Fed's Balance Sheet Grows in Latest Week - The Fed's asset holdings in the week ended Dec. 12 increased to $2.919 trillion, up from $2.861 trillion a week earlier, it said in a weekly report released Thursday. The Fed's holdings of U.S. Treasury securities increased to $1.661 trillion on Wednesday from $1.654 trillion a week earlier. The central bank's holdings of mortgage-backed securities rose to $928.80 billion from $883.65 billion a week ago. The Fed's portfolio has tripled since the financial crisis of 2008 and 2009 as the central bank bought government bonds and mortgage-backed securities in an effort to keep interest rates low and to stimulate the economy.Thursday's report showed total borrowing from the Fed's discount lending window was $827 million Wednesday, down from $959 million a week earlier. Commercial banks borrowed $5 million Wednesday, up from $2 million a week earlier. U.S. government securities held in custody on behalf of foreign official accounts rose to $3.221 trillion, up from $ 3.204 trillion in the previous week. U.S. Treasurys held in custody on behalf of foreign official accounts increased to $2.867 trillion, up from $2.850 trillion in the previous week. Holdings of agency securities rose to $318.29 billion, up from the prior week's $317.68 billion
FRB: H.4.1 Release--Factors Affecting Reserve Balances--December 13, 2012
After Twist, What Is the Fed’s Next Move? - TIME is running out for Operation Twist, the Federal Reserve stimulus program named for that hip-swiveling dance from the 1960s. The Fed’s twist is scheduled to end soon, mainly because the central bank is running low on the short-term securities that keep the action going. Decorum may prevent it from adopting “Gangnam Style” moves right now, but the Fed’s mesmerizing dance with the bond market isn’t over yet. “The bond market is counting on the Fed — and can keep counting on it — to hold short-term interest rates near zero for some time to come,” said Kathy A. Jones, fixed-income strategist for the Schwab Center for Financial Research. And with the weak economy vulnerable to a shock if the Congress and White House don’t reach an agreement soon on fiscal policy, the Fed is likely to introduce further innovations, perhaps as early as this week. The Fed’s hypnotizing moves have captivated the bond market for many months, said Ed Yardeni, an independent economist. “The stock market still reacts to news events these days; the bond market barely does. The Fed has put it in a nearly perpetual rally.” That can’t last forever, but ultralow yields and remarkably rich prices have persisted largely because of the Fed’s daring experiments and interventions.
Fed Balance Sheet to Reach $4 Trillion With Next Announcement = Call it QE Whatever. The Federal Reserve will “amplify record accommodation” by announcing $45 billion in monthly Treasury buying that will push its balance sheet to almost $4 trillion, according to a Bloomberg survey of economists. The news service reports that 48 of 49 economists predict that the Federal Open Market Committee on Wednesday will purchase Treasuries to bolster an existing program to buy $40 billion in mortgage bonds each month. The panel pledged in October to continue that plan until the labor market improves "substantially." "It's going to be massive and open-ended in size," Joseph LaVorgna, chief U.S. economist at Deutsche Bank Securities Inc. in New York and a former New York Fed economist, told Bloomberg. They are expanding the balance sheet beyond $2.86 trillion in a bid to spur growth and lower an unemployment rate of 7.7%.
Thresholds for the Fed -The idea here is pretty well known by now: rates stay low until unemployment falls below x per cent as long as inflation remains below y per cent. As I understand the state of play, pretty much everyone on the FOMC prefers this approach to the mid-2015 date, and discussion is well advanced. The challenge is to find a good formulation for x and y that everyone can agree on. My guess is there may be some kind of staff proposal at this FOMC meeting, but more likely one for comment by the committee, rather than one ready to act on. Choosing x and y is tricky. Here are some thoughts on how the Fed may approach it.When does the Fed want to raise rates? The first thing is to understand in what conditions the Fed expects to raise rates for the first time. A chart used by vice chair Janet Yellen in a recent speech helps. The path to look at is the blue line – optimal policy – which is influential within the Fed. It is derived by running repeated simulations to find the path of policy that best trades off unemployment and inflation. Looking at the blue line in the bottom chart, the first rise in interest rates happens in early 2016. Compare that with the top two charts, and at that time the simulation shows unemployment at 6 per cent, while inflation never rises much above 2.25 per cent. This kind of result – suggesting you can keep rates low pretty much all the way back to full employment – are common in these models (Note: an important issue with the optimal policy path is whether you can commit to staying on the blue line in 2016 and 2017 when inflation may be above target).
Fed Statement Following December Meeting - The following is the full Fed statement following the December meeting.
Parsing the Fed: How the Statement Changed - Fed watchers closely parse changes between statements to see how the Fed's views are evolving. The following tool compares the latest statement with its immediate predecessor.
FOMC Statement: Expand QE3, Sets Thresholds of 6.5% Unemployment Rate, 2 1/2 Inflation - The thresholds are huge! FOMC Statement: To support continued progress toward maximum employment and price stability, the Committee expects that a highly accommodative stance of monetary policy will remain appropriate for a considerable time after the asset purchase program ends and the economic recovery strengthens. In particular, the Committee decided to keep the target range for the federal funds rate at 0 to 1/4 percent and currently anticipates that this exceptionally low range for the federal funds rate will be appropriate at least as long as the unemployment rate remains above 6-1/2 percent, inflation between one and two years ahead is projected to be no more than a half percentage point above the Committee’s 2 percent longer-run goal, and longer-term inflation expectations continue to be well anchored. The Committee views these thresholds as consistent with its earlier date-based guidance. In determining how long to maintain a highly accommodative stance of monetary policy, the Committee will also consider other information, including additional measures of labor market conditions, indicators of inflation pressures and inflation expectations, and readings on financial developments. When the Committee decides to begin to remove policy accommodation, it will take a balanced approach consistent with its longer-run goals of maximum employment and inflation of 2 percent.
More Bond Buying and Thresholds, by Tim Duy - The FOMC statement was released this morning. Key points are that Operation Twist will be converted one-for-one to an outright purchase program and the long-debated issue of thresholds became a reality. First thoughts: Inflation both low in near-term and longer-term inflation expectations remain anchored. Nothing too surprising here as it seems broadly consistent with the tenor of recent speeches by Fed speakers. They continue to see strains in global financial markets...although this seems odd, as it seems that financial markets have calmed considerably in recent months. The FOMC reaffirms its commitment to long-term price stability.Bond buying, key addition: The Committee also will purchase longer-term Treasury securities after its program to extend the average maturity of its holdings of Treasury securities is completed at the end of the year, initially at a pace of $45 billion per month. I am not surprised, but I was cautious that the Fed would choose to pull the trigger on a complete conversion of Operation Twist to an outright purchase program. I think the St. Louis Federal Reserve President James Bullard is right when he notes that this is a more dovish policy. The Fed has more than doubled the pace of the balance sheet expansion, a much more stimulative stance - unless, of course, we are deep into the territory of diminishing marginal returns. We all knew thresholds were coming, but in general did not expect it this meeting: the Committee decided to keep the target range for the federal funds rate at 0 to 1/4 percent and currently anticipates that this exceptionally low range for the federal funds rate will be appropriate at least as long as the unemployment rate remains above 6-1/2 percent, inflation between one and two years ahead is projected to be no more than a half percentage point above the Committee’s 2 percent longer-run goal, and longer-term inflation expectations continue to be well anchored. The Committee views these thresholds as consistent with its earlier date-based guidance. When the Committee decides to begin to remove policy accommodation, it will take a balanced approach consistent with its longer-run goals of maximum employment and inflation of 2 percent.
The Fed Adopts Numerical Thresholds for Inflation and Unemployment - The Federal Reserve's monetary policy committee announced today that it will continue its policy of maintaining exceptionally low interest rates and expand its "quantitative easing" program by purchasing bonds at the rate of $85 billion per month in a move to boost economic growth. But the big news is the central bank's adoption of numerical thresholds that, if crossed, will trigger a reassessment of its existing policies. Specifically, the Fed said it will keep the federal funds rate within the 0 to 0.25 percent range "at least as long as the unemployment rate remains above 6.5 percent, inflation between one and two years ahead is projected to be no more than a half percentage point above the committee's 2 percent longer-run goal, and longer-term inflation expectations continue to be well anchored." This signals a change from time-based Fed policies that end on a certain date to those that are contingent on the state of the economy. The latter type of policy is considered more effective and less likely to cause credibility problems if, for example, the economy does worse than expected and the Fed is forced to extend the program beyond its pre-announced end. But it's important to recognize that these are triggers, not thresholds. A 6.5 percent unemployment trigger, for example, means that if the unemployment rate falls below this level, a new policy is necessarily triggered, meaning the policy ends. But a 6.5 percent threshold brings about a discussion and a reassessment at the Fed of the appropriate policy -- but policy does not necessarily change. The Fed is instituting thresholds, not triggers, and its important to understand the difference.
More Of The Same... With "Thresholds" - Fed Chairman Ben Bernanke made it clear... again. Interest rates will remain low, even when the labor market shows stronger signs of growth. He said that if inflation doesn't exceed an annual rate of 2.5%, and unemployment stays above 6.5%, the Fed would keep its target rate near zero percent. Laying out "thresholds" is something new, but the basic message remains the same: low rates and no plans to change the status quo any time soon. As Bernanke explained at yesterday's press conference:First, as the statement notes, the committee reviews policy as likely to be appropriate at least until a specified threshold is met, reaching one of those thresholds will not automatically trigger immediate reduction in policy accommodation. If unemployment was to decline at a time inflation and expectations were subdued... the committee might judge an increase in target for the federal funds rate to be inappropriate and ultimately in deciding when and how quickly to reduce policy accommodation the committee will follow a balanced approach in seeking to mitigate deviations of inflation from the longer run 2% goal and deviations of employment from estimated maximum level. The 2.5% ceiling for pricing pressure is a "conditional inflation targeting," as Menzie Chinn labels it. As it happens, the market appears to have been anticipating that level in recent days. Yesterday's inflation forecast via the 10-year Treasury yield less its inflation-indexed counterpart was 2.51%, about where it's been all week. It's also interesting to note that the Treasury market's assumption for future inflation has been inching higher this month after bottoming out at around 2.4%.late last month.
Fed Spreads Treasury Purchases Into Shorter-Term Notes - The Federal Reserve’s commitment to buying more Treasurys next year includes a slight adjustment from its existing program, steering some of the monthly purchases away from longer-term bonds and toward shorter-dated notes. The central bank said Wednesday it will buy $45 billion in long-term Treasurys each month. This replaces the soon-to-expire Operation Twist, under which the bank buys $45 billion Treasurys monthly, but funded with sales of an equal amount of short-term notes. The new outright purchase program largely replicates the buying end of Operation Twist, but with a few tweaks on the maturities being targeted.
The Fed Turns Aggressively Dovish With ‘Evans Rule’ - Wednesday’s announcement from the Federal Reserve’s Open Market Committee marks a significant escalation (perhaps the biggest to date) in the Fed’s efforts to boost the economy. Rather than tying monetary policy decisions to far-off points in time, or signaling its intentions through vague pronouncements about whether the economy is showing moderate or modest growth, policy will now be tied directly to hard, numerical targets. Namely, the Fed will keep short-term interest rates near zero as long as unemployment remains above 6.5 percent and the inflation it expects in one to two years is no higher than 2.5 percent. That replaces the previous plan to keep rates near zero until mid-2015. Given the slow pace of job growth, the current plan could mean that rates stay super-low past mid-2015. This is essentially what Charles Evans, President of the Federal Reserve Bank of Chicago, has been arguing for over the last year. Dubbed the Evans Rule, the argument holds that monetary policy shouldn’t be tightened until the economy heals pasts a certain predetermined threshold. In a speech delivered in September 2011, Evans made the point that the Fed should be just as aggressive about fighting high unemployment as it is about high inflation.
Fed’s bond buying will continue until jobless rates drops - Offering greater clarity to financial markets and politicians, the Federal Reserve on Wednesday took the unprecedented step of saying it would continue its controversial bond buying and other steps to stimulate the economy until the unemployment rate falls to 6.5 percent or below and stays there. The Fed’s benchmark federal funds rate, the primary way it influences lending rates across the economy, has been near zero since December 2008. Unable to cut rates any more, the Fed has taken a number of unconventional steps to try and further spark a subpar recovery. Critics, especially Republicans in Congress, contended the steps may eventually spark inflation that’s hard to tame and complained about their open-ended nature. Chairman Ben Bernanke sought to quell that criticism by offering a threshold, the 6.5 percent unemployment rate, which he cautioned was nothing more than a meaningful idea of when the Fed might start pulling back on its accommodative policies and raise interest rates. “It is not a target. What it is is a guidepost of when to begin reduction of accommodation,” Bernanke said in a lengthy news conference, which included calls on Congress to avoid the fiscal cliff and projections that show the Fed slightly downgrading U.S. growth prospects for next year.
QE4 Is Here: Bernanke Delivers $85B-A-Month Until Unemployment Falls Below 6.5% - Forbes: Ben Bernanke continues to make history at the Federal Reserve. On Wednesday, the FOMC announced more quantitative easing at a rate of $85 billion a month for an extended period of time. The Bernanke Fed has also modified its guidance, noting its ultra-accommodative stance will remain in place until the unemployment rate falls below 6.5% and inflation projections remain no more than half a percentage point above 2% two years out. QE4 is here. Only a few months after announcing what had been dubbed QE3, an open-ended $40 billion a month program to buy up mortgage backed securities (MBS), the FOMC decided to extend its asset purchases in 2013 as Operation Twist expires.The Fed will therefore accelerate its rate of balance sheet expansion, easing monetary conditions further. While Operation Twist had been sterilized, which means the Fed sold assets at the same rate as it was gobbling them up, the new program will consist purely of Treasury purchases. Combined with QE3, the Fed will be taking $85 billion in bonds, both Treasuries and MBS, out of the market. The FOMC also decided to begin rolling over its maturing Treasuries as of January. Bernanke’s biggest surprise came in terms of the Fed’s forward guidance. The FOMC moved from a calendar-based guidance to one tied to economic factors, specifically, inflation and unemployment (which constitute the Federal Reserve’s dual mandate): “In particular, the Committee decided to keep the target range for the federal funds rate at 0 to 1/4 percent and currently anticipates that this exceptionally low range for the federal funds rate will be appropriate at least as long as the unemployment rate remains above 6-1/2 percent, inflation between one and two years ahead is projected to be no more than a half percentage point above the Committee’s 2 percent longer-run goal, and longer-term inflation expectations continue to be well anchored"
Fed Launches Contractionary QE4; Continues Unlimited Expansion - As expected, the Fed announced today that QE4 bond buying will start in January. We think Fed policy is contractionary. The announcement of more bond buying doesn’t improve the outlook. . Even though we disagree with the Fed’s decision to buy more bonds, we welcome the openness of the Fed’s discussion about its monetary policy vision. Under QE4, the Fed’s liabilities will quickly expand beyond $3 trillion and, given today’s announcement of an aspiration for 6.5% unemployment, probably above $4 trillion. We expect the growth impact of QE4 to follow the pattern of QE3, QE2 and Operation Twist, which saw steady declines in the Fed’s own growth expectations as the QE policies were implemented (see graph in the attachment.) During the press conference, Chairman Bernanke was asked how QE works. He drew on the portfolio rebalancing theory that he had laid out in his 2010 Jackson Hole speech. We don’t think Bernanke’s transmission theory works when private sector credit is constrained by regulatory policy. The Fed is causing a rationing process which channels capital to the government and to assets with similar characteristics at the expense of small businesses (see WSJ Near-Zero Rates Are Hurting the Economy on December 4, 2009 and WSJ How the Fed is Holding Back the Recovery on October 19, 2010.) Fed policy distorts markets, hurts savers, and favors the government at the expense of the private sector. There’s been no change in credit or regulatory policy, so there’s no increase anticipated in the M2 money supply or private sector credit. There’s been no loosening of bank regulatory policy, no increase in expectations for bank leverage and no un-freezing of the money multiplier that connects excess reserves to private sector loan growth, which remains stagnant.
Quantitative Easing, Basic Process (graphic)
Most on Fed See Rates Low Into 2015 - Most Federal Reserve officials continue to expect the central bank to first raise interest rates in 2015, in a projection consistent with new monetary policy thresholds announced by the central bank Wednesday. Fed officials also on balance downgraded slightly their collective outlook for growth, while projecting touch-lower ranges of unemployment and inflation compared to forecasts released in September. On the monetary policy front, 14 of the 19 Federal Open Market Committee members now believe the first increase in monetary policy will come in 2015 or later. Two believe the Fed will raise rates in 2013. In September, 12 FOMC members expected a hike in 2015 and one saw it happening in 2016.
The Federal Reserve Gets Down to Business - Adopting what has come to be known as the Evans Rule, whereby rates remain low until either inflation hits 2.5 percent or unemployment reached their initial target of 6.5 percent, is a remarkable change. Beyond a needed expansion of monetary policy, this represents a major policy victory. How did this happen? The Evans Rule dates from a September 2011 speech given by Charles Evans, the president of the Federal Reserve Bank of Chicago—one of the 12 regional Federal Reserve banks informally led by the New York Federal Reserve. The speech called out the Fed for not taking both parts of its mandate—to keep both inflation and unemployment low—seriously. Evans noted that unemployment was at 9 percent while inflation was near the target, and the Fed didn’t seem that concerned. But those numbers are equivalent to a situation where inflation was higher than expected, say 5 percent, and unemployment was lower, a situation where the Federal Reserve would certainly take notice. In the speech, Evans proposed that the Federal Reserve tie its projections to unemployment while also giving a clear number on the inflation rate it would tolerate. This would prevent the Federal Reserve from keeping the economy in check by its inaction.
New From the Fed: TBG - That is, "Threshold Based Guidance." The Federal Open Market Committee's statement today included the following: To support continued progress toward maximum employment and price stability, the Committee expects that a highly accommodative stance of monetary policy will remain appropriate for a considerable time after the asset purchase program ends and the economic recovery strengthens. In particular, the Committee decided to keep the target range for the federal funds rate at 0 to 1/4 percent and currently anticipates that this exceptionally low range for the federal funds rate will be appropriate at least as long as the unemployment rate remains above 6-1/2 percent, inflation between one and two years ahead is projected to be no more than a half percentage point above the Committee’s 2 percent longer-run goal, and longer-term inflation expectations continue to be well anchored. Since the federal funds rate hit the zero lower bound - four years ago - other monetary policy tools have taken on a more prominent role. One of them is the Fed's ability to influence expectations, which it tries to do by making promises about future policy ("forward guidance"). Because long-term interest rates depend on expected future short term rates, convincing people that short-term rates will be low for longer can bring down long-term rates, and thereby reduce the cost of investment and credit purchases. One of the difficulties that the Fed has to get around, though, is that people believe it places a high priority on keeping inflation low and would tighten policy at any hint of the economy heating up.
Analysis: Why Is the Fed Being So Specific? - The Federal Reserve says it expects to keep rates exceptionally low at least as long as unemployment is above 6.5% and inflation set to stay below 2.5%. PNC Financial Services Senior Economist Gus Faucher discusses the report with The Wall Street Journal Online’s Dan Loney.
The mandate is willing but the tools are weak - Low inflation and full employment have been statutory goals of the Federal Reserve since 1977, but its officials always felt more comfortable with the first than the second. After all, in theory monetary policy can’t alter unemployment in the long run. But the stubbornly weak economy of recent years prompted some at the Fed to question their historical neglect of the second half of their mandate. “The Fed’s dual mandate … has the force of law behind it,” Charlie Evans, president of the Federal Reserve Bank of Chicago, said in September, 2011. “So, if 5% inflation would have our hair on fire, so should 9% unemployment.” Mr Evans argued the Fed should make it clear that unemployment and inflation both carried weight in its decisions by setting thresholds for both that would trigger a policy response. This meant the Fed would explicitly tolerate inflation higher than its target if it wasn’t satisfied with the state of unemployment. Mr Evans' argument was so powerful because it called on the Fed to do nothing more than apply orthodox economic policy reasoning to Section 2A of the Federal Reserve Act. It was also a little bit subversive: Mr Evans' rule was a sort of watered-down nominal GDP targeting. But the Evans rule was much easier for the Fed to swallow than NGDP targeting because it required no radical remake of its operating framework.
Monetary Policy Innovations - It is always interesting to compare the Fed, ECB and Bank of England. For both the Fed and ECB it has been quite a year for innovation. At the Fed the most recent announcements in terms of forward guidance can be seen as just a development of how it began the year, by publishing its own forecasts for interest rates. Once you tell others how you expect policy to develop given one (central) projection of how the economy will go, it is natural to say how it might develop in other circumstances. Just as it seemed to me the first development was eminently sensible (but others disagreed), so I think recent moves are as well. Do they mark a substantial shift in policy? Brad DeLong thinks so, but Paul Krugman is more downbeat. I think the answer depends on the timespan you are looking at. In terms of the very recent developments, they are perhaps not a huge shift, although I agree with Mark Thoma that raising the inflation target from an ‘apparent 2%’ to a ‘definitely at least 2.5%’ is significant. Seen over the year as a whole, and including the idea of continuing QE, I think it is an important change.
Too Little, Too Late? -The FOMC, after over four years of overly tight monetary policy, seems to be feeling its way toward an easier policy stance. But will it do any good? Unfortunately, there is reason to doubt that it will. The FOMC statement pledges to continue purchasing $85 billion a month of Treasuries and mortgage-backed securities and to keep interest rates at current low levels until the unemployment rate falls below 6.5% or the inflation rate rises above 2.5%. In other words, the Fed is saying that it will tolerate an inflation rate only marginally higher than the current target for inflation before it begins applying the brakes to the expansion. Here is how the New York Times reported on the Fed announcement. The Federal Reserve said Wednesday it planned to hold short-term interest rates near zero so long as the unemployment rate remains above 6.5 percent, reinforcing its commitment to improve labor market conditions. The Fed also said that it would continue in the new year its monthly purchases of $85 billion in Treasury bonds and mortgage-backed securities, the second prong of its effort to accelerate economic growth by reducing borrowing costs.But Fed officials still do not expect the unemployment rate to fall below the new target for at least three more years, according to forecasts also published Wednesday, and they chose not to expand the Fed’s stimulus campaign.
How risky is the Fed's major move? - Muhammed El-Erian - A bold and necessary move? Yes, but the Fed's growing activism has limits and is ultimately inconsistent with the proper efficient functioning of a market economy. Wow! That is what I suspect many investors said when they heard Wednesday's policy announcement…. Yesterday's Fed announcement will go down in the history books…. The Fed took two major steps on Wednesday, one expected and one less so. First, it added to its expected purchases of market securities, doubling the dollar amount to $1 trillion for 2013…. Second, the Fed shifted to quantitative (unemployment and inflation) targets for forward policy guidance…. This further leap into the policy unknown was motivated by continued disappointment with the economy's sluggish growth, persistently high unemployment and increasing concern about joblessness becoming more structurally embedded into the economy…. The bad news is that the institution, with its imperfect tools for the challenge at hand and with other federal government entities essentially MIA, may be taking on an unsustainable burden…. [T]he outcome of the Fed's unusual activism is neither predictable nor costless… an increasing risk of collateral damage and unintended consequences… ultimately inconsistent with the proper efficient functioning of a market economy. With a market share that will end 2013 between 30% and 45% depending on the securities, the Fed is heavily involved in markets as both a referee and player. As such, it distorts their functioning, the price discovery process and the allocation of capital.
Why QE4 Will Fail - The Fed turbo-charged the printing press yesterday, turning QE3 into QE4. Yet the stock market closed flat on the day -in fact it sold off after an initial sugar rush rally. Why no party? Perhaps because despite being more open ended (no calendar end date), it is a more constrained edition of QE than previous versions. Operation Twist has been running since September 2011 and has managed to convert $667 billion of short term Treasury Notes into intermediate term Treasury Notes on the Fed's balance sheet. You may recall Operation Twist was the Fed stimulus program wherein it sold $45B/month in short term Treasury Notes to fund buying of intermediate term Treasury Notes, thus avoiding new money printing and balance sheet expansion. However, since the Fed's inventory of short term bonds (3 years and less) is now gone, it won't be able to continue Operation Twist. Instead, it will use $45B per month in freshly printed dollars to fund its purchases of intermediate and longer term Treasury Notes. The Fed is also going to continue buying $40B per month in agency-backed mortgage bonds (what was QE3). So in total, this new action (QE4) will see the Fed buying $85B per month in U.S. Tbonds and Fanny/Freddie bonds with newly printed dollars -essentially debasing the dollar by 1 $trillion per year. The Fed will continue doing this until:
- The unemployment rate drops to 6.5%;
- The inflation rate tops 2.5%;
- The cows come home and the fat lady sings.
QE 4: Folks, This Ain't Normal - Okay, the Fed's recent decision to boost its monetary stimulus (a.k.a. "money printing," "quantitative easing," or simply "QE") by another $45 billion a month to a combined $85 billion per month demonstrates an almost complete departure from what a normal person might consider sensible. To borrow a phrase from Joel Salatin: Folks, this ain't normal. To this I will add ...and it will end badly. If you had stopped me on the street a few years ago and asked me what I thought would have happened in the stock, bond, foreign currency, and commodity markets on the day the Fed announced an $85 billion per month thin-air money printing program directed at government bonds, I would have predicted soaring stock prices on the expectation that all this money would have to end up in the stock market eventually. I would have predicted the dollar to fall because who in their right mind would want to hold the currency of a country that is borrowing 46 cents (!) out of every dollar that it is spending while its central bank monetizes 100% of that craziness? Further, I would have expected additional strength in the government bond market, because $85 billion pretty much covers all of the expected new issuance going forward, plus many entities still need to buy U.S. bonds for a variety of fiduciary reasons. With little product for sale and lots of bids by various players, one of which – the Fed – has a magic printing press and is not just price insensitive but actually seeking to drive prices higher (and yields lower), that's a recipe for rising prices. Then I would have called for sharply rising commodity markets because nothing correlates quite so well with thin-air money printing as commodities. That's what should have happened. But it's not what we're seeing.
Fed’s Fisher Worries About ‘Hotel California’ Monetary Policy - Dallas Fed President Richard Fisher said Friday on CNBC he opposed the Federal Open Market Committee‘s recent decision on employment thresholds and that he was extremely concerned that it would become increasingly difficult to exit the Fed’s accomodative monetary policy. “We are at risk of what I call a ‘Hotel California’ monetary policy, referring to the Eagles’ song, where we can check out any time we want from this program, but we can never leave” due to an engorged balance sheet, he said. Mr. Fisher said he argued that the markets would become overly fixated on the “unemployment target that the Fed put in there, and not on the thresholds,” but he lost his argument. He said there is flexibility in the approach to the 6.5% thresholds as we approach them, as Chairman Ben Bernanke made clear, and if we need to alter monetary policy.
Dallas Fed Richard Fisher: Fed Risks 'Hotel California' Monetary Policy - At least one Fed governor understands the Bernanke Fed's hyper-accommodative monetary policy has no exit. Today on CNBC "Squawk Box", Dallas Fed governor Richar Fisher complained Fed Risks 'Hotel California' Monetary Policy. Dallas Fed President Richard Fisher told CNBC that he's worried the U.S. central bank is in a "Hotel California" type of monetary policy because of its "engorged balance sheet." Evoking lyrics from the famous song by The Eagles, he said he feared the Fed would be able to "check out anytime you like, but never leave." Fisher said on "Squawk Box" that he argued against revealing the new inflation and unemployment targets set by the Fed this week, saying he's worried that the markets will become "overly concerned" with the thresholds. Fisher would not comment on any contingency plans at the Fed should Republicans and President Barack Obama fail to strike a deal to prevent the automatic tax increases and spending cuts from taking effect in the new year. "What you see is what you get here," Fisher said. "We have a hyper-accommodative monetary policy here ... cheap and abundant money that the Fed has made widely available."
Two Fed officials speak out against the latest FOMC policy decision - We are seeing some dissent among the Fed officials with respect to this week's decision.
1. Richmond Federal Reserve President Jeffrey Lacker, who voted against the FOMC's last policy decision, remains uneasy: Reuters: - "I do not believe that tying the federal funds rate to a specific numerical threshold for unemployment is an appropriate and balanced approach to the FOMC's price stability and maximum employment mandates," he said in a statement, referring to the Federal Open Market Committee. Focusing on MBS purchases pushes capital into the housing sector - and according to Lacker should be left to the federal government, not the central bank. Reuters: - "Deliberately tilting the flow of credit to one particular economic sector is an inappropriate role for the Federal Reserve," he said, adding that trying to influence credit allocation within the economy was a function of fiscal policy.
2. Dallas Fed President Richard Fisher calls the latest FOMC action a "Hotel California" policy (with respect to the expansion program, you can "check out anytime you like, but never leave").
The Fed Focuses on the Unemployed - The FOMC just did a great thing. The Federal Reserve tied interest rates and quantitative easing to U.S. labor. The messaging alone is powerful. The Federal Reserve is saying, very clearly, U.S. workers matter. Businesses need to start hiring and increasing wages if they want to actually improve the overall economy. About 5 million people—more than 40 percent of the unemployed—have been without a job for six months or more, and millions more who say they would like full-time work have been able to find only part-time employment or have stopped looking entirely. The conditions now prevailing in the job market represent an enormous waste of human and economic potential. The FOMC set out specific parameters to the ongoing QE3. To support continued progress toward maximum employment and price stability, the Committee expects that a highly accommodative stance of monetary policy will remain appropriate for a considerable time after the asset purchase program ends and the economic recovery strengthens. In particular, the Committee decided to keep the target range for the federal funds rate at 0 to 1/4 percent and currently anticipates that this exceptionally low range for the federal funds rate will be appropriate at least as long as the unemployment rate remains above 6-1/2 percent, inflation between one and two years ahead is projected to be no more than a half percentage point above the Committee’s 2 percent longer-run goal,
Digital threat to Fed’s jobless target - -Functions driven by technology are displacing many human workers. In recent months, something striking has quietly occurred at Exim Bank, the US export credit guarantee agency. For the fourth year in a row, the agency is watching an export boom. So far this year, Exim has provided $35.8bn of export financing to support $50bn of export sales, 25 per cent up on last year. But while that might seem good news for the American economy, there is a crucial catch: so far in 2012, the number of jobs backing those Exim-supported exports has fallen by 12 per cent. Yes, you read that right. In 2012 Exim-supported companies have been selling more widgets (such as planes) and services (such as engineering advice), helping them to post profits, and the economy to grow. But fewer workers were needed to produce these sales, even – or especially – in sectors which are booming (such as engineering design). It is a telling saga for investors, particularly in a week that Ben Bernanke, Fed chairman, has declared that the Fed will not tighten monetary policy until the US jobless rate drops below 6.5 per cent. In some senses, the Exim data may be extreme as they only reflect a tiny slice of corporate America. But they are not an aberration. After all, this year the economy is on track to post growth above 2.5 per cent. However, the unemployment rate has barely fallen, running at 7.7 per cent. Just like those Exim-backed companies, the American economy as a whole now seems to be doing more with the same, or fewer, people. This is jobless growth.
FOMC Projections and Bernanke Press Conference - Here are the updated projections from the FOMC meeting. Here is the video stream. The FOMC is no longer presenting a "date-based guidance" for policy, and instead changed to announcing thresholds for raising the Fed Funds rate based on the unemployment rate and inflation. How this will work will be a key topic of the press conference today. Currently the thresholds are holding rates low "at least" until the unemployment rate is above 6 1/2%, and the inflation outlook "between one and two years ahead" is no more than 2 1/2%, as long as inflation expectations remain "well anchored" - this means inflation could increase to 3% or 4% without an increase in rates, as long as expectations remain anchored and the outlook one to two years ahead is at or below 2 1/2%. This is a significant change in policy guidance. Another key question is: Which will come first, a rate hike or stopping or slowing QE3 (the FOMC will expand QE3 to $85 billion per month in January)? The four tables below show the FOMC December meeting projections, and the September projections to show the change.
A Fed That Is Focused on the Value of Clarity - The Federal Reserve’s decision on Wednesday to announce specific economic objectives for its policies would have stunned and dismayed earlier generations of central bankers, who regarded secrecy as a virtue and obfuscation as a prized technique for manipulating financial markets. “Since I’ve become a central banker, I’ve learned to mumble with great coherence,” Alan Greenspan, a former Fed chairman, told reporters in 1987. “If I seem unduly clear to you, you must have misunderstood what I said.” Until recently, the Fed under Mr. Greenspan and his successor, Ben S. Bernanke, were tentative participants in this revolution. Over the last two years, Mr. Bernanke and his colleagues have announced a series of changes intended to increase the transparency of the Fed’s decision-making. Some of those moves have also transformed the way those decisions are made and, the Fed hopes, increased the power of its efforts to revive the economy. Several of those changes were tied together by Wednesday’s announcement that the Fed would hold short-term interest rates near zero as long as the unemployment rate remained above 6.5 percent and inflation remained under control.
More Monetary Policy Uncertainty - The Fed’s announcements yesterday increase monetary policy uncertainty in two fundamental ways. First, the new quantitative easing announcement implies a gigantic increase in the size of the Fed’s balance sheet and thus effectively an amplification of the policy risks and uncertainty which I have discussed, for example, in this oped with George Shultz and other colleagues in September. The Fed now plans to purchase $85 billion a month of longer-term Treasury and mortgage backed securities until there is substantial improvement in the labor market, which requires a completely unprecedented increase in reserve balances as illustrated in this chart. The chart shows reserve balances held by banks at the Fed. These are used to finance the large scale asset purchases. The chart assumes that substantial labor market improvement is defined by the 6.5% unemployment rate the Fed is using to assess when to raise interest rates. Thus, assuming the central tendency forecast of the FOMC, the announced buying spree will bring reserve balances to about $4 trillion in mid-2005. The risk is two-sided. If the Fed does not draw down reserves fast enough during a future exit, then it will cause inflation. If it draws them down too fast, then it will cause another recession.
Bernanke's Non-Stupidity Pact - Krugman - So, how big a deal was yesterday’s Fed announcement? Philosophically, it was pretty major; in terms of substantive policy implications, not so much. What the Fed did was pledge not to raise rates until unemployment is considerably lower than it is now, or inflation is running significantly above the 2 percent target. One fairly important wrinkle I haven’t seem emphasized: the inflation criterion was couched in terms of the inflation projection, rather than past inflation. This would let the Fed hold rates low even in the face of a blip caused by, say, a sharp rise in commodity prices. It’s fairly clear — although not explicitly stated — that the goal of this pronouncement is to boost the economy right now through expectations of higher inflation and stronger employment than one might otherwise have expected. So philosophically, this represents a conversion to the Evans criterion for rates and the Woodford/Krugman doctrine about monetary policy in a liquidity trap. Substantively, however, there isn’t that much going on here. Basically, Bernanke is promising that the Fed won’t do anything stupid — specifically, that it won’t pull an ECB, and raise rates even though the economy is still depressed and underlying inflation is still low. As it was, however, few people expected the Fed to pull an ECB in any case. That’s reflected in the market reaction: rates actually rose, and expected inflation, as measured by the spread between nominal and real rates, went up only slightly.
Fed presidents discuss economic recovery at Becker Friedman Institute - The presidents of three regional Federal Reserve Banks discussed the Fed’s role in America's recovery from the economic recession at a Dec. 1 panel arranged by and for University of Chicago undergraduates and sponsored by the Becker Friedman Institute. Fed presidents Charles Evans of the Chicago bank; Narayana Kocherlakota, PhD '87, of the Minneapolis bank; and Charles Plosser, PhD'76, of the Philadelphia bank, shared their views on target rates for inflation, interest rates, and unemployment, and other aspects of monetary policy with a student audience of more than 200. In January 2012, the Federal Open Market Committee announced that 2 percent inflation is a desirable limit, with a target of 5.25 to 6 percent unemployment. Evans said that for more than two years, he has been making the case for greater accommodation from the Fed to improve economic outcomes. He favors keeping interest rates low until unemployment declines to 6.5 percent, as long as inflation stays below 2.5 percent. He shared his reasoning: “I’m led to think this way because I’ve considered economic theory and the best stochastic models, and they all seem to indicate a need to continue” greater accommodation. His approach builds in a safeguard at 3 percent inflation, in case inflation takes off more than expected.
How Charles Evans Saved the Recovery - Some revolutionaries wear Guy Fawkes masks and talk about the 1 percent, and some revolutionaries wear suits and talk about policy thresholds. Chicago Fed president Charles Evans is one of the latter. A year ago Evans was the rare dovish dissenter at the Fed. He didn't think it was taking the unemployment half of its dual mandate seriously enough, so he proposed a new, eponymous rule for it to do better. He certainly wasn't the first Fed president to have his own ideas about monetary policy, but a funny thing happened on his way to heterodoxy -- his ideas quickly became the consensus. Now, just a year later, the Fed has fully embraced the so-called Evans rule by linking interest rates to the unemployment rate. Ain't no revolution like a monetary policy revolution.
Central bankers give voice to a revolution - FT.com: Ben Bernanke seemed unusually buoyant at his press conference this week. He smiled – more than once; there was a folksy story about his roots in South Carolina, and a joke about his facility with a southern accent. The chairman of the US Federal Reserve had reason for cheer and for a little pride: his committee had just said it would keep interest rates close to zero until the US unemployment rate falls below 6.5 per cent (it is 7.7 per cent today). For a central bank, let alone the Fed, to tie rates to the economy in this way was without precedent.The move speaks of a quiet revolution that is sweeping over central banks. A day earlier, Mark Carney, currently governor of the Bank of Canada, soon-to-be governor of the Bank of England, became the most senior central banker to praise an even more radical policy: targeting the level of nominal gross domestic product. Instead of having apoplexy, Britain’s chancellor said he wanted a debate. Like most revolutions, it seems to come from nowhere but has deep roots. Like most revolutions, it holds the promise of great good but has the potential for harm. It is crucial that politicians and the public understand what this revolution in central bank thinking is and is not about.
Trendline on the unemployment rate projects the Fed ending zero rate policy by late 2014 - The Fed's new approach to targeting a specific unemployment rate (called the "Evans’ Rule") may shed some light on how long the monetary easing may continue. Credit Suisse did a simple linear extrapolation from the peak unemployment rate in 09. Such approach sets the end of the program for late 2014. That of course assumes the unemployment rate will continue declining in a linear fashion (which may be unrealistic given the structural shift in employment). It also assumes that labor participation (something the Fed is tracking closely, though it's not part of the official target) will improve with falling unemployment - another "leap of faith".This extrapolation gets to the "target" considerably faster than the FOMC's "middle of 2015" projection or even the Fed Funds futures curve market expectation (Feb-2015 contract now implies full 25bp).The new unemployment targeting program (combined with inflation tolerance level) is expected to make for a more flexible policy tool because the FOMC would be less reluctant in adjusting its rate expectations. CS researchers think both the FOMC and the futures markets will adjust to an earlier date as the unemployment rate continues to decline (some comments in brackets [ ] ).
The Fed targets $45 billion in treasury purchases a month; why then did treasuries sell off? - The Fed has announced that in addition to the $40 billion of monthly MBS purchases, it will also commence $45 billion in treasury purchases. This unprecedented open-ended program will swell bank reserves and ratchet up the monetary base. The announcement of this new asset purchase program should be a big positive for treasuries, right? Turns out that it wasn't. Longer dated treasuries rallied immediately after the announcement, but sold off shortly after, now trading at the lows for the week. With the FOMC doves running the show, the Fed announced it would target a specific combination of unemployment and short-term inflation expectations. The two-year inflation expectation (the so-called breakeven rate) however now stands at about 1.3% - which means the Fed has given itself quite a bit of room to get to 2.5%. And that was the reason for the selloff - such an open-ended policy clearly runs inflation risks. Bloomberg: - “The Fed is losing some of its credibility as an inflation fighter,” . “They will allow inflation to go above the long-term target. That’s disappointing for the market.”
Bank reserves still down on the year; should ramp up shortly - Some MBS settlements have now been reflected on the Fed's balance sheet, as agency paper holdings increase. Bank reserves are also gradually moving up, though still down for the year. So far the growth in reserves has been underwhelming.With the newly announced treasury purchases, this should pick up steam. And the settlement schedule will be much less "lumpy" than agency MBS. One thing worth mentioning here is that the US treasury will be borrowing $45bn a month effectively interest free. That's because the Fed passes interest income back to the Treasury (less its own expenses) via earnings distribution once a year. This certainly helps reduce pressure on Washington to cut spending quickly - the can will be kicked down the road once more.
Exit Strategy? What Exit Strategy? - Today the Federal Reserve issued this Policy Statement Regarding Purchases of Treasury Securities and Agency Mortgage-Backed Securities. On December 12, 2012, the Federal Open Market Committee (FOMC) directed the Open Market Trading Desk (the Desk) at the Federal Reserve Bank of New York to purchase longer-term Treasury securities after the maturity extension program is completed at the end of December 2012, initially at a pace of about $45 billion per month. The FOMC also directed the Desk to continue purchasing additional agency mortgage-backed securities (MBS) at a pace of about $40 billion per month. These actions should maintain downward pressure on longer-term interest rates, support mortgage markets, and help to make broader financial conditions more accommodative. The FOMC also directed the Desk to maintain its existing policy of reinvesting principal payments from the Federal Reserve’s holdings of agency debt and agency MBS in agency MBS, and, in January, to resume rolling over maturing Treasury securities into new issues at auction.Recall when the Fed pretended it was working on an exit strategy to reduce its balance sheet at the appropriate time? It was a lie then and it's an even bigger, more apparent lie now (which is why you no longer hear Bernanke mentioning it) . The simple fact of the matter is that every Fed asset purchase makes it more difficult to exit.
"Regime Change": The Critical Message In Today's FOMC Announcement - It will take the market some time to figure it out, but there were two main parts to the Fed's announcement: the actual breakdown of the $85 billion/month QE4EVA which were priced in as far back as the day QE3 was announced and were not a surprise at all; and the employment and inflation hard-targeting part, the so-called Evans Rule, which is, or at least should be, a shock to the market, only it hasn't quite realized it yet. Why shock? Because starting today, every incremental economic data point that is materially better, brings us closer to an explicit end of Fed intervention. Because at least before the Fed's calendar target was as soft as it gets; now the Fed will have no choice but to terminate its monetization once the unemployment rate plunges (be it entirely due to part-time jobs or 68 year old workers, as has been the case lately). It also means that as the economy continues along an "improving" glideslope, whether real, manufactured or doctored, the market will start pricing in its own "flow"-based demise. Because once the Fed's $85 billion/month in new Flows ends, it's game over.
Conditional Inflation Targeting in Effect - Nearly a year ago, Jeffry Frieden and I called for Conditional Inflation Targeting. Today, policy seems to have turned toward that direction. From today's statement from the FOMC:...the Committee decided to keep the target range for the federal funds rate at 0 to 1/4 percent and currently anticipates that this exceptionally low range for the federal funds rate will be appropriate at least as long as the unemployment rate remains above 6-1/2 percent, inflation between one and two years ahead is projected to be no more than a half percentage point above the Committee’s 2 percent longer-run goal, and longer-term inflation expectations continue to be well anchored. ... The Fed had earlier conditioned its asset purchases on the state of the economy, and continues to do so (although replacing Operation Twist with outright purchases). But today, the Fed provided explicit numerical reference points to condition the policy regarding the setting of the Fed funds rate. From our Foreign Policy article: [We need] inflation -- just enough to reduce the debt burden to more manageable levels, which probably means in the 4 to 6 percent range for several years. The Fed could accomplish this by adopting a flexible inflation target, one pegged to the rate of unemployment. Chicago Fed President Charles Evans has proposed something very similar, a policy that would keep the Fed funds rate near zero and supplemented with other quantitative measures as long as unemployment remained above 7 percent or inflation stayed below 3 percent.
Key Measures show low inflation in November - The Cleveland Fed released the median CPI and the trimmed-mean CPI this morning: According to the Federal Reserve Bank of Cleveland, the median Consumer Price Index rose 0.2% (2.3% annualized rate) in November. The 16% trimmed-mean Consumer Price Index increased 0.1% (1.6% annualized rate) during the month. The median CPI and 16% trimmed-mean CPI are measures of core inflation calculated by the Federal Reserve Bank of Cleveland based on data released in the Bureau of Labor Statistics' (BLS) monthly CPI report. Earlier today, the BLS reported that the seasonally adjusted CPI for all urban consumers fell 0.3% (-3.7% annualized rate) in November. The CPI less food and energy increased 0.1% (1.4% annualized rate) on a seasonally adjusted basis. Note: The Cleveland Fed has the median CPI details for November here.This graph shows the year-over-year change for these four key measures of inflation. On a year-over-year basis, the median CPI rose 2.2%, the trimmed-mean CPI rose 1.9%, the CPI rose 1.8%, and the CPI less food and energy rose 1.9%. Core PCE is for October and increased 1.7% year-over-year. On a monthly basis, median CPI was above the Fed's target at 2.3% annualized. However trimmed-mean CPI was at 1.6% annualized, and core CPI increased 1.4% annualized. Also core PCE for October increased 1.6% annualized. These measures suggest inflation is mostly below the Fed's target of 2% on a year-over-year basis. The Fed's focus will probably be on core PCE and core CPI, and both are at or below the Fed's target on year-over-year basis. Also, the FOMC statement this week indicated the Fed will tolerate an inflation outlook "between one and two years ahead" of 2 1/2 percent.
Elliott's Paul Singer Reveals The Thing That Scares Him Most - "They say this is not massive money printing, but first they are wrong; and second, monetary authorities in the United States did not see the crash coming and the unsoundness of the financial system. In fact, right up until the crash they were saying that nothing like what happened could ever happen... This monetary policy, $3 trillion of bond buying in the United States, $3 trillion in Europe and another $2.5 trillion to $3 trillion in Japan, is unprecedented. ... If and when people lose confidence in paper money because of repeated bouts of quantitative easing and zero-percent interest rates—it could happen suddenly and in a ferocious manner in the commodity markets, in gold, possibly in real estate—interest rates could go up at the long end by hundreds of basis points in a very short time. I’m quite concerned as a money manager that we have to manage money, not just for the boundaries of what’s in front of our faces—maybe we’ll have a little tax increase or not, the fiscal cliff, or the stock market might go up or down 10% or 15%—but for a basic shift. The thing that scares me most is significant inflation, which could destroy our society."
FOMC Projections - The FOMC projections, central tendency: The GDP growth projections were only marginally softer. Most notable was the decrease in the high end of the 2014 forecast. The unemployment rate projection fell in the near term, necessitated by the decline this year. But the 2014 projection was roughly the same. Inflation expectations were marginally softer, and notice that, within the central tendency, there are no projections above 2%. You need to move to the overall range to get an upper-bound projection of 2.2%, still within the Fed's now explicit margin of error of 50bp. Another point: There is no indication here of a fundamental change regarding the rate of potential output growth or the natural rate of unemployment in the longer-run. For now, the speed-limits remain the same. The expected date of first tightening is still reported:Most participants (13, instead of 12 like in September) expect the first tightening in 2015. Notice that this is consistent with unemployment falling below 6.5% that year. The Fed thinks that the unemployment rate will hit its threshold first.
Fed Downgrades Economic Outlook: With the most recent meeting of the Federal Reserve came the quarterly release of the Fed's economic projections we can update our tables and charts. When it comes to the economy the Fed has consistently overstated economic strength. Take a look at the chart and table. In January of 2011 the Fed was predicting GDP growth for 2011 at 3.7%. Actual real GDP (inflation adjusted) was 1.6% or a negative 56% difference. The estimate at that time for 2012 was almost 4% versus 1.8% currently. We have been stating repeatedly over the last 2 years that we are in for a low growth economy due to the debt deleveraging, deficits and continued fiscal and monetary policies that are retardants for economic prosperity. The simple fact is that when an economy requires nearly $5 of debt to provide $1 of economic growth the engine of prosperity is broken. As of the latest Fed meeting the forecast for 2013 and 2014 economic growth has been revised down as the realization of a slow-growth economy has been recognized. However, the current annualized trend of GDP suggests growth rates in the next two years that will roughly be half of the Fed's current estimates of 2.6% and 3.4%. As we have stated over the past year - a recession in 2013 remains a strong likelihood given the current annualized trend of economic growth since 2000. A recession followed by a rebound in 2014 would leave economic growth running at annual rate close to 1%-1.5% versus the current estimate of 3.35%. What is very important is the long run outlook of 2.6% economic growth. That rate of growth is not strong enough to achieve the "escape velocity" required to substantially improve the level of incomes and employment that were enjoyed in previous decades. With the Fed's new goal of targeting a specific unemployment level to monetary policy could potentially put the Fed into a box. Currently, the Fed sees 2014 unemployment falling to 6.75% and ultimately returning to a 5.5% "full employment" rate in the long run. The issue with this full employment prediction really becomes what the definition of reality is.
Lost Decade Watch - Paul Krugman - Along with its new policy pronouncement, the Fed released its economic projections (pdf). What struck me is that the Fed expects the unemployment rate to be well above its long-run level even in the fourth quarter of 2015, which is as far as its projections go. This means that the Fed is projecting elevated unemployment nine full years after the Great Recession started. And, of course, the Fed has been consistently over-optimistic. This is an awesome failure of policy — not solely at the Fed, of course. When I wax caustic about Very Serious People, bear this in mind. Faced with an economic crisis where textbook macroeconomics told us exactly how to respond, people of influence chose instead to obsess over budget deficits and generally punt on employment; and the result has been a huge economic and human disaster.
Bernanke: Fiscal Cliff Is Already Harming The Economy -The Chairman of the Federal Reserve Board spoke again today about the dangers of the fiscal cliff: The U.S. economy is already being hurt by the “fiscal cliff” standoff in Washington, Federal Reserve Chairman Ben Bernanke said Wednesday. But Bernanke said the Fed believes the crisis will be resolved without significant long-term damage. The steep tax increases and spending cuts can be avoided with a successful budget deal, Bernanke said during a news conference after the Fed’s final meeting of the year. The Fed’s latest forecasts for stronger economic growth next year and slightly lower unemployment assume that happens. Still, Bernanke said the uncertainty surrounding the resolution is already affecting consumer and business confidence. And it has led businesses to cut back on investment. “Clearly the fiscal cliff is having effects on the economy,” Bernanke said. Bernanke said the most helpful thing that Congress and the Obama administration can do is resolve the issue quickly.
Latest Article in the Atlantic - Ramesh Ponnuru and I have a new article in the Atlantic where we argue concerns about the fiscal cliff are exaggerated if the Fed continues to stabilize nominal spending. We note two experiences that support this notion: The Bank of England vividly demonstrated the power of central banks to offset fiscal policy at the dawn of the Thatcher era. In 1981 her government introduced a budget that would sharply reduce the deficit in the midst of a recession. Most economists opposed it on Keynesian grounds, with 364 of them signing a now-famous letter arguing there was "no basis in economic theory or supporting evidence" for it. Yet the Thatcher government implemented its plan and by late 1981 the economy was recovering. The Bank of England at the same time had begun a cycle of monetary policy easing, and the economists had underestimated its effects. Something similar happened in Canada in the mid-1990s. After running several decades of budget deficits that had led to a debt-to-GDP ratio of 70 percent in 1995, then-Finance Minister Paul Martin introduced a budget plan that began a half decade of reducing the federal budget, largely through cuts in spending. This fiscal tightening led to budget surpluses by the early 2000s. As in the British case, the Bank of Canada eased monetary policy over the same time, offsetting any fiscal drag. The economy performed nicely. The same outcome is possible for the U.S. fiscal cliff, but would require the Fed to adopt a NGDP level target. Reihan Salam provides a smart follow-up discussion here.
Is The US Already in Recession?, by Tim Duy: Via a recent media blitz, ECRI Co-Founder Lakshman Achuthan insists that the US is already in recession, apparently as of July. I would be very skeptical that this was in fact the case. I think the preponderance of evidence weighs in favor of ongoing expansion, disappointing as the pace of that expansion may be. Actually, Achuthan loses credibility quite quickly by claiming there is a strict definition of recession based upon peaks of production, income, jobs, and sales. In contrast, according to the NBER business cycle dating committee: The Committee does not have a fixed definition of economic activity. It examines and compares the behavior of various measures of broad activity: real GDP measured on the product and income sides, economy-wide employment, and real income. The Committee also may consider indicators that do not cover the entire economy, such as real sales and the Federal Reserve's index of industrial production (IP). The Committee's use of these indicators in conjunction with the broad measures recognizes the issue of double-counting of sectors included in both those indicators and the broad measures. Still, a well-defined peak or trough in real sales or IP might help to determine the overall peak or trough dates, particularly if the economy-wide indicators are in conflict or do not have well-defined peaks or troughs. Dating a recession, it would seem, is something of an art. And note that Achuthan appears to ignore the role of GDP and GDI in the determination of a recession. Taking a quick look at those two series:
Weisenthal interview with Goldman's Jan Hatzius - From Joe Weisenthal at Business Insider: Goldman's Top Economist Explains The World's Most Important Chart, And His Big Call For The US Economy - Hatzius is bullish on the U.S. economy starting in the second half of 2013, because finally he expects private releveraging to occur at a nice clip, and to not be counteracted by a fiscal drag. Says Hatzius: "If the business sector is basically trying to reduce its financial surplus at a more rapid pace than the government is trying to reduce its deficit then you’re getting a net positive impulse to spending which then translates into stronger, higher, more income, and ultimately feeds back into spending." He has a specific explanation and numbers in mind, to explain the private sector's inclination to reduce its savings, and spend more. "Since mid-2009, that surplus has gradually come down as businesses and households have gotten closer to where they need to be from a long-term balance sheet perspective. They’ve paid down debt, they’ve eliminated the excess supply of housing, and that’s basically allowed them to reduce the financial surpluses that they run. They’re still running large surpluses – still 5.5 to 7 percent of GDP, but they’re no longer as large. We expect those figures to come down as the balance sheet adjustment process makes further strides and that’s an underlying source of boost to the economy that’s happening on the one side."
The recovery: In search of "natural" velocity - The Economist - I HAD high hopes for the American economy after the Federal Reserve's policy shake-up in September. It looked to me like a shift in framework that signalled increased tolerance for inflation, one that could potentially allow for a shift up in the trajectory of the recovery. Revisions may vindicate this view, but Friday's jobs numbers, for the month of November, show an expansion stuck on course. The economy added 146,000 jobs last month. The Bureau of Labour Statistics helpfully noted, "Since the beginning of this year, employment growth has averaged 151,000 per month, about the same as the average monthly job gain of 153,000 in 2011." Since late 2010, growth in employment and nominal output has been strikingly, impressively, and disappointingly stable. Will the economy ever manage to do any better? Goldman Sachs economist Jan Hatzius reckons there's a chance it will turn a corner late next year, provided that Congress doesn't drive the country back into recession. In an interview with Business Insider's Joe Weisenthal, he describes his sectoral balances approach to business cycles: [E]very dollar of government deficits has to be offset with private sector surpluses purely from an accounting standpoint, because one sector’s income is another sector’s spending, so it all has to add up to zero. That’s the starting point. It’s a truism, basically. Where it goes from being a truism and an accounting identity to an economic relationship is once you recognize that cyclical impulses to the economy depend on desired changes in these sector's financial balances...
Goldman Q4 GDP Forecast At 1.0% Following Trade Data - So just what is below "stall-speed" growth in the New Normal? And with 48 out of 49 economists now predicting what we said would happen back in September, namely that the Fed will go all in with QEternity+1 and take its balance sheet to $4 trillion (and then $5 trillion in 2014) yet firmly holding their 2013 year end GDP forecast at 2.0%, lower than Q3 2011's 2.7%, does it mean that even $1 trillion in additional flow and stock from the Fed can barely keep the economy above the Old Normal stall speed definition? What exactly would happen if the Fed were to not monetize hundreds of billions in debt? We shiver to even think.
The Big Four Economic Indicators: Industrial Product and Retail Sales Brighten the Picture - Official recession calls are the responsibility of the NBER Business Cycle Dating Committee, which is understandably vague about the specific indicators on which they base their decisions. This committee statement is about as close as they get to identifying their method. There is, however, a general belief that there are four big indicators that the committee weighs heavily in their cycle identification process. They are:
- Industrial Production
- Real Personal Income
(excluding transfer payments)- Employment
- Real Retail Sales
The weight of these four in the decision process is sufficient rationale for the St. Louis FRED repository to feature a chart four-pack of these indicators along with the statement that "the charts plot four main economic indicators tracked by the NBER dating committee." Here are the four as identified in the Federal Reserve Economic Data repository. See the data specifics in the linked PDF file with details on the calculation of two of the indicators. This morning I've added two more of the Big Four for November: Industrial Production from the Federal Reserve, the purple line in the chart below and Real Retail Sales, the green line.
Economic Outlook: Where are we? - Once again we are nearing a political event horizon that could significantly impact the economy - and we can't see beyond the horizon. My baseline assumption is an agreement will be reached, probably during the first few weeks of January, and the agreement will mean Federal fiscal drag next year at about the level of the CBO's alternative fiscal scenario. This would suggest modest GDP and employment growth next year, although probably better than in 2012. Note: There is no clear drop dead date for the "fiscal cliff". Nothing horrible happens on January 1st, but the longer it takes to reach an agreement next year, the larger the negative impact on the economy. With that assumption, there are two key drivers for additional growth next year. The first is residential investment (construction employment lags investment with a lag, so construction employment should pick up in 2013), and the second is the end of the state and local drag. I've discussed both of these before - see: Two Reasons to expect Economic Growth to Increase - but I think this is worth repeating. This graph shows the contribution to percent change in GDP for residential investment and state and local governments since 2005.
The Slow Growth in Investment - One of the puzzles of the post-crisis period is why investment has been so slow. Some would want to resort to stories of uncertainty. Is there something to this idea? Figure 1 depicts the gross investment to net capital stock. Goldman Sachs (David Mericle, “The Drivers of Capital Spending, December 5, 2012, not online) notes: Our econometric analysis [of data over the 1991-2012 period] leads us to draw the following conclusions about each class of model: First, the accelerator model generally fits well. ... The model also substantially overpredicts investment during the last couple of years because it implies that the lagged effect of the sharpest downturn phase of the recession should have passed by now.Second, Tobin’s Q model ... is considerably noisier and overpredicts investment during the recovery from the Great Recession much more severely than the other models. Finally, combining the accelerator model with a measure of credit availability captures investment dynamics reasonably well. ... Our analysis suggests that an improved version of the standard accelerator model that accounts for the availability of credit goes a long way toward explaining recent investment patterns. GS provides this graph:
Delusions of Wisdom - Paul Krugman - Both Jonathan Chait and Charles Pierce have a field day with a Politico piece titled, without a hint of irony, Crafting a boom economy. In said piece they talk to various Very Serious People, and divine the insider consensus on What Must Be Done — which mainly seems to involve, naturally, cutting Social Security and Medicare while reducing corporate tax rates.What I find remarkable about this piece is that after everything that has happened these past five years or so, Jim VandeHei and Mike Allen still take it for granted that these people actually know what they’re talking about; the whole premise of the article is that the insiders really do have the key, not just to good policy, but to achieving a dramatic rise in the growth rate.Now, they don’t tell us everyone they talked to; but I think we can safely assume that, with few exceptions, the insiders in question:
- Believed that financial deregulation was a great idea, because bankers had really learned to manage risk
- Did not believe that there was a housing bubble
- Insisted that budget deficits, even in a depressed economy, would send interest rates soaring any day now
- Insisted that austerity measures would promote recovery, not hurt it, because of the confidence fairy
And on and on.
The Trade-Off Between Economic Growth and Deficit Reduction -- Laura Tyson - The economy is continuing to recover from its deepest recession since the Great Depression, but the pace of recovery is frustratingly slow. The question is why, and the answer has profound implications for fiscal policy and for the debate over deficit reduction and economic growth that has transfixed Washington. Since 2010, annual growth of gross domestic product has averaged about 2.1 percent. This is less than half the average pace of recoveries from previous recessions in the United States since the end of World War II, according to a recent study by the Congressional Budget Office. Both potential G.D.P., a measure of the economy’s underlying capacity, and actual G.D.P. have grown unusually slowly compared with previous recovery periods. Slow G.D.P. growth has meant slow growth in employment. Payroll employment has been expanding at a rate of about 150,000 jobs per month during the last two years, only slightly above the growth of the labor force. Employment growth has been largely consistent with overall G.D.P. growth and with the “jobless” pattern of the 1990-91 and 2001 recoveries. In both this recovery and the previous two, the rebound in employment growth has been weaker and later than the rebound in G.D.P. growth. But G.D.P. growth in the current, jobless recovery has been slower. Another salient difference is that the loss of jobs in the most recent recession was more than twice as large as in previous recessions, so a slow recovery has also meant a much higher unemployment rate.
An Alternative Meme for Money, Part 5: A Spending Meme --- L. Randall Wray - Let me repeat and clarify my purpose in this series. I am attempting to initiate a discussion among progressives on how to frame discussions about money and related issues. My perspective is MMT. To be sure, on one level MMT is a description. It provides a correct description of the operation of a sovereign currency system. Some commentators have objected to my progressive framing; they assert that one can accept MMT without the progressive bias. Sure they can. One can understand how money “works” but prefer NOT to use money in the public interest. Science is necessarily a progressive endeavor. Or, as Stephen Colbert puts it, reality has a well-known liberal bias. Of course it does. From global warming to the problems of unemployment, the liberal perspective is based in reality, while the conservative view necessarily denies science.But one can accept the MMT description and still pursue a reactionary policy agenda. The conservative is willing to take the “technology” of a modern money system to use it against the public purpose. Technology can be used in highly anti-progressive ways. Tear gas to put down civil rights demonstrators. Nuclear weapons to vaporize humans. Concentration camps and gas chambers. Science, however, is progressive.
An Alternative Meme for Money, Part 6: Alternative Framing on Inflation - L. Randall Wray - As we have discussed, sovereign government cannot run out of the keystrokes it uses to mark-up balance sheets as it spends. Does our argument rely on modern technology, that sends electrons or photons (I’m not sure which) pulsing through copper or fiber-optic lines? No, of course not. Government always spent by notching hazelwood, imprinting clay, stamping coins, chalk on slate, or “running the printing press”. There has never been another alternative. These marks or electronic entries represent government IOUs. No matter what time period we are talking about, I would have received government payments as “Government Owes Me’s”. Obviously, government cannot run out of these. Government can “afford” to buy what’s for sale in its own currency. The question is not about affordability but rather concerns effects on the value of the currency and impacts on the pursuit of private interest. As Stephanie Kelton says, cash registers do not discriminate: they do not care whether that dollar comes from government spending or private spending. If something is in scarce supply, more purchases of it by either government or private buyers might push up the price. A government purchase of something that is scarce can “crowd out” a private purchase. Government purchases need to be, and can be, planned to avoid undesired crowding out and price pressures.
An Alternative Meme For Money, Part 7: Framing Deficits - L. Randall Wray - Deficits and Debt are probably the most terrifying topic that MMT addresses. We need to be careful. We are treading on moral (or religious) grounds. We know that one should not be a debtor (or, a creditor)—most religions tell us so. One who proclaims that deficits and debts are OK is automatically engaged in blasphemy of various sorts, not least of which is a crime against morality. Let’s try to frame the discussion. When government spends more than it taxes, we not only get the services and infrastructure that we need but we also get to accumulate net financial wealth. We are richer in both real terms and financial terms. Government also offers to pay us interest on that financial wealth if we prefer to hold treasuries rather than HPM. Government spending greater than taxing should not be called a “deficit”, rather, it is government’s contribution to our saving; government bonds are not “debt”, they are our net financial wealth. Deficits and debts are bad framing; saving and wealth are good framing. The clock that used to sit in Times Square doesn’t record our national government’s debt, rather, it shows our net financial wealth. President Obama has added trillions and trillions to our financial wealth, making up for some of the losses Wall Street imposed on us. Thanks Uncle Sam!
An Alternative Meme for Money: Conclusion By L. Randall Wray - The monetary system is a wonderful creation. It allows for individual choice while giving government access to resources needed to allow it work for us to achieve a just society. The monetary system spurs entrepreneurial initiative. It finances, organizes, and distributes much of the nation’s output. It is one of the primary mechanisms used by government to accomplish the public purpose. There could be a better way to organize production and distribution. There could be a better way to allocate resources between public and private. There could be a better way to induce the private to serve not only its own interest but also the public interest. But if so, we have not yet seen it—at least not since the end of tribal society, and I’m not sure I want to go back there. Until that better system comes along, we need a progressive meme for the monetary system we’ve got. Progressives have been in retreat for the past three or four decades. Yes, they’ve won some battles—mostly in the social sphere. They’ve lost almost all economic battles, however. At least some of those losses are due to adoption of the wrong meme for money.We need to recognize that the monetary system is important. It is not merely—or even mainly—used to lubricate exchange of goods and services. From its origins, the monetary system has played an important role in pursuit of the public interest. It also is used in pursuit of the private interest. And it is—especially in recent years—used by a rapacious elite of Wall Street insiders in their own selfish interests.
NEP’s Stephanie Kelton appears on Capital Account - Stephanie appeared on Capital Account with Lauren Lyster on December 11. The topic was MMT’s goals for Full Employment and the government’s deficit.
Bernanke Says Fed Can’t Save U.S. From Fiscal Cliff - Federal Reserve Chairman Ben Bernanke said if the country falls off the fiscal cliff, the economy will be damaged in way the Fed can’t control. “I don’t think Federal Reserve has tools to offset the effect…we’d have to temper the expectations of what we can accomplish.” said Mr. Bernanke, who coined the phrase fiscal cliff for the looming tax hikes and government spending cuts set to begin in 2013. Mr. Bernanke said that while the Fed could increase asset purchases “a bit,” it can’t offset fully the effects through added stimulus.
The Fed vs. the Fiscal Cuts: Not a Fair Fight - Since the financial crisis began, the Federal Reserve has taken the lead on stimulating the economy. It starting easing long before the Recovery Act was even a twinkle in Congress’s eye, and it has continued its stimulus efforts in the last couple of years to counteract fiscal tightening while the Recovery Act was petering out. As Mervyn A. King, the governor of the Bank of England, explained this week, central banks around the world have pursued monetary easing to offset fiscal tightening. The problem is that fiscal tightening is now a much bigger potential negative for the economy than monetary easing is a positive. The Fed announced today that it would provide more stimulus, by purchasing $45 billion in long-term Treasuries each month after its continuing “Operation Twist” concludes this month. This was welcome news to the markets, which have been clamoring for the Fed to do more, even though the marginal returns to more Fed stimulus get smaller and smaller. The first big injection of money into the economy does a lot; the second, not quite as much; the third, much less; and so on. Meanwhile Congress is contemplating fiscal tightening that is much more potent than the Fed’s easing.
US budget deficit reaches $172B in November — The U.S. federal government's budget deficit widened in November compared to October, a sign that the nation is on a path to its fifth straight $1 trillion-plus deficit. The budget gap rose to $172 billion in November, up from $120 billion in October, the Treasury Department said Wednesday. The November deficit was also 25 percent higher than the same month last year. Last month's deficit was pushed higher by a calendar quirk that pulled about $33 billion in benefits payments into November from December. The government finished the 2012 budget year with a deficit of $1.1 trillion. President Barack Obama and Congress are under pressure to curb the deficit as part of a budget deal to prevent tax increases and deep spending cuts from kicking in Jan. 1. With the economy and hiring improving a bit, the government is receiving more tax receipts. Overall tax revenue rose 10 percent in the first two months of the budget year to $346 billion. But spending has risen faster, up $87 billion or 16 percent.
Trillion-dollar deficits are sustainable for now, unfortunately - Congress is attempting, unsuccessfully, to reduce “unsustainable” deficits and debt accumulation by engineering “crises” that are meant to force politically challenging action on spending cuts (entitlements) and tax increases (loophole closing, higher tax rates on the “rich”). The mid-2011 debt-ceiling crisis fiasco and the upcoming year-end “fiscal cliff” are striking examples of this dangerous tactic. ... The tactic of threatening to go over the fiscal cliff will fail ... because deficits have been, and will continue to be for some time, eminently sustainable. The Chicken Little “sky is falling” approach to frightening Congress into significant deficit reduction has failed because the sky has not fallen. Interest rates have not soared as promised... Two percent inflation means that the real inflation-adjusted cost of deficit finance averages –1.5 percent... The debt-to-GDP ratio is not a reliable guide for gauging the sustainability of deficits, notwithstanding the Reinhart and Rogoff warning... The United States Is NOT Greece ... The hyperbolic claim that the United States is becoming Greece because of the absence of dramatic progress on deficit and debt reduction is unfortunately ridiculous
How to End Congressional Meddling in the Debt Ceiling - Washington has no shortage of fiscal disasters to grapple with. Raising the debt ceiling shouldn’t be one of them. No member of Congress, of either party, looks forward to going on the record to support an increase in the amount of money the U.S. government can borrow -- and therefore spend. That’s why these debt-ceiling votes have become such irresistible political targets. Now President Barack Obama, adopting a proposal first made last year by Senate Minority Leader Mitch McConnell, has offered a way for members of Congress to make their political point -- without harming the markets, the economy, or the full faith and credit of the United States. If Republican members would drop their resistance, Congress and the White House could move on with the more important task of getting the federal government’s budget deficit under control. It’s time to end this congressional chokehold, which is not merely symbolic of Washington dysfunction but has real consequences. The U.S. will have $18.9 billion in higher interest payments over the next decade as a result of last year’s gamesmanship. The threat of U.S. default makes investors nervous, harms the economy and weakens the nation’s hand in its dealings with other countries.
Sen. Corker: Debt ceiling is Republican ‘leverage’ to cut ‘entitlements’ - Sen. Bob Corker (R-TN) says that his party should agree to raise taxes on the wealthy before January because Republicans can force cuts to earned benefits like Medicare and Social Security next year by holding the debt ceiling hostage. “I do think it’s time for the president — he knows there’s a growing body of folks who are willing to look at the rate on the top 2 percent but that’s only — it could be $400 billion, it might be $800 billion, depending on how you deal with that,” Corker told Fox News host Chris Wallace on Sunday. “Many of us that are fiscal and conservatives are beginning to see that we could end up with a lesser revenue increase by agreeing to that.” “The shift to focus in entitlements is where we need to go,” the Tennessee Republican added. “And again, it’s a shame that we’re not just sitting down and solving this, but Republicans know that they have the debt ceiling that’s coming up right around the corner and the leverage is going to shift as soon as we get beyond this issue.”
The Debt-Ceiling Gamble - Ezra Klein reports that the White House is drawing a line in the sand on the debt-ceiling, and they really, really mean it: The Obama administration is utterly steadfast on this point: They will not suffer a repeat of 2011, when they conducted negotiations over whether the United States should default. If Republicans go over the cliff and try to open up talks for raising the debt ceiling, the White House will not hold a meeting, they will not return a phone call, they will not look at the e-mails. The Administration is looking to take the debt ceiling off the table forever. This is good policy; that Congress should be able to pass laws authorizing spending but not authorizing the required debt is beyond ridiculous. Also ridiculous - and irresponsible - is the willingness of the Republicans to use the debt ceiling to hold the economy hostage. Ending this travesty should be a priority for the White House. Klein adds that the White House is ready for the fight now while their strength is up: Boehner and the Republicans don’t want to give up the leverage of the debt ceiling forever, or for 10 years, or even, as John Engler, head of the Business Roundtable and a former Republican governor suggested, for five years. But the White House isn’t very interested in compromising on this issue, as they figure that if there needs to be a final showdown over the debt ceiling, it’s better to do it now, when they’re at peak strength, then delay it till 2014 or 2015, when their own vantage might have ebbed. I would add another advantage. Better - from a political point of view - to have a recession at the beginning of President Obama's second term that can be blamed entirely on the Republicans. A recession in the first half of 2013 means that, most likely, the Democratic presidential nominee can run on the back of an improving economy by 2016. Alternatively, they run the risk that this recovery, anemic as it is, gets long in the tooth by 2016.
Debt ceiling: Forget the fiscal cliff, the debt ceiling could stretch the budget crisis out for months, or more. - If you want to know why the fiscal-cliff talks are having such a devilishly hard time reaching resolution, you need to look behind the issues—taxes, spending, stimulus, austerity—that are dominating this month’s debate and start looking ahead to the next debate. Specifically, gaze dolefully forward to February or March or maybe April when the total volume of nominal federal debt will reach the statutory cap on borrowing—the “debt ceiling”—setting up a repeat of the legislative brinksmanship we saw in the summer of 2011. The debt ceiling is key because conservatives believe it gives them crucial hidden leverage that they currently lack, and because Democrats are determined not to settle for a short-term deal this month without resolving the debt ceiling for a while. The debt ceiling, recall, is a curious American institution that we share exclusively with Denmark. Back in the 19th century, Congress specifically authorized each issuance of federal bonds. When World War I came along, this became tedious, so Congress simply appropriated the funds it thought would be required for the war and authorized the federal government to borrow a bunch more money as needed to spend what Congress had directed it to spend, up to a certain cap—the debt ceiling.Over the years, this evolved into a fun exercise in congressional hypocrisy and partisan grandstanding. Congress would pass laws setting the tax code, laws shaping entitlement spending, and annual appropriations for the military and civilian functions of government. When a gap arose, as it often did, the Treasury Department would, obviously, borrow the money. But every so often the combination of economic growth and inflation would guarantee that the government would run up against the authorized borrowing cap. At this point opposition party members of Congress would take potshots at the president. Back in 2006 when George W. Bush had to ask for an increase in the debt ceiling, then-Sen. Barack Obama called it “a sign of leadership failure” and proclaimed “Americans deserve better.”
Why Is Obama Ignoring The Platinum Coin Solution - Brad DeLong bemoans the Obama administration’s weak approach to the debt limit as opposed to the fiscal cliff: In any negotiation, you first want to prepare the ground so that failing to make an agreement creates a situation that your counterparty absolutely hates–that even what is from their perspective a bad deal is better from their standpoint than no deal– With respect to the debt ceiling, however, no effort has been made to prepare the ground at all: no steps have been taken to signal what actions the administration will take after the debt ceiling has been reached that will make the situation one that Republican politicians will hate and that Democratic politicians can live with. And without such a strategy in place, the Obama administration has no bargaining power on the debt ceiling. Here’s my rationale: There are two negotiations going on. The Obama administration would like to resolve the fiscal cliff deal in their favor as soon as possible. The Republicans are worried that the tax increases that will ensue if negotiations fail will rebound to their disadvantage. They know that they will have more leverage in the debt limit negotiations that will soon follow. Hence, they are more likely to concede in the fiscal cliff negotiations if they think they will be in strong position in the debt limit negotiations. If Obama explores constitutional solutions to the debt limit increase that sidelines the House, this will impact the fiscal cliff negotiations. Then, the Republicans will be less likely to concede the middle class tax cut now and bargain about entitlements later because they will believe they have less leverage later. Therefore, Obama should not bring up any exit option from the debt limit negotiations. No trillion dollar platinum coin should be invoked right now. Of course, when the debt limit does come up, the coin comes out. Ha ha.
How Big Is the Budget Hole? - Something I’ve been meaning to write: get into a discussion of matters fiscal, especially with conservatives, and you’re bound to have somebody declaring that we have a ONE TRILLION DOLLAR deficit, which means that what Americans want from their government is far more than we can pay for, so we must slash the welfare state, etc.. Also, that the hole is so big that taxing the rich can’t possibly make any real difference. So I think it’s worth pointing out just how misleading all this is.Yes, we do have a trillion-dollar deficit. But a large part of that deficit is attributable to the depressed economy. Reasonable estimates say that we have an output gap of something like $900 billion a year — yes, some would dispute that, but it’s the estimate I find most convincing. This automatically raises the budget deficit by depressing revenue and leading to more spending on unemployment insurance and means-tested programs like Medicaid — the CBO doesn’t offer a simple ratio on this, but a survey of their estimates suggests that we’re probably looking at $300 billion or more in automatic stabilizers here. Then you need to add in non-automatic but nonetheless cyclically-determined things like extended unemployment benefits and the temporary payroll tax cut. The point is that economic recovery would shrink the budget deficit a lot — almost surely more than $400 billion. Meanwhile, zero is not the crucial number for the deficit; a much better criterion is the budget balance that would, on a sustained basis, stabilize debt as a percentage of GDP. Now, debt is currently slightly over 70 percent of GDP; with 2 percent growth and 2 percent inflation, that means that a deficit of almost 3 percent of GDP, say $450 billion, is consistent with a stable debt ratio.
The New Mandate on Defense - Barney Frank - Earlier this year, for the first time that I can recall, a majority of the House of Representatives voted to reduce the military appropriation recommended by the House Appropriations Committee. The cut was only $1.1 billion—less than it should have been—but it was a decision that froze spending at the previous year’s level, and it passed by a vote of 247-167, with the support of both an overwhelming majority of Democrats (158-21) and a significant minority of Republicans (89-146). Deficit reduction over the long term must include significant reductions in military spending along with tax increases on the very wealthy if we are to avoid devastating virtually everything we do to promote the quality of life at home. A realistic reassessment of our true national security needs would mean a military budget significantly lower not only than the one President Obama inherited, but that which he now proposes. That is, by next year, we no longer should be forced to spend additional funds—close to $200 billion a year at their peak—in Afghanistan and Iraq. Additionally, we can reduce the base budget by approximately $1 trillion over a ten-year period (this includes the $487 billion reduction that President Obama proposed in early 2012) while maintaining more than enough military strength to fully protect our security and those of our allies that genuinely need help because they are too poor and weak in the face of powerful enemies. (Should the nation decide in a democratic way to go to war again, that would require an increase in the military budget, and I would hope, in taxation to pay for it.)
Washington Doesn’t Have a Spending Problem. It Has a Healthcare Problem. Period. - Earlier today I wrote a post saying flatly, "We don't suffer from runaway spending." Our only long-term problems are an aging population and rising healthcare costs. That's it. In case you, or a conservative loved one, doesn't believe this, here's a chart I posted last year that tells the basic story of federal spending: First off, notice that total federal spending is down—not up—from its peak during the Reagan-Bush years. More specifically, the category that contains domestic discretionary spending and miscellaneous mandatory spending ("Other") has been on a steady downward slope for decades. It spikes a bit during recessions, but that's about it. Interest expense is also down. Defense spending swelled back up to late-80s levels after 9/11, but is otherwise down over the long term too. And Social Security spending is pretty flat, though it will go up a point or two over the next few decades before it levels out again. The only category that's on a long-term upward slope is Medicare.
The Real Long-Term Budget Challenge - On Dec. 3, the Government Accountability Office released new estimates of the federal government’s long-term budget outlook. They show that our real long-term problem is quite different from the one constantly portrayed by congressional Republicans. As the table shows, spending is not out of control. Entitlement programs like Social Security and Medicare are rising gently as the baby-boom generation retires. All other spending, including that for the military and domestic discretionary programs, falls – with the notable exception of interest on the debt. Interest rises sharply as the deficit rises, principally because the G.A.O. assumes that revenue will not be permitted to rise above its historical average – as Republicans continually insist. Republicans demand that Social Security and Medicare be cut immediately to deal with the so-called fiscal cliff. Popular suggestions for doing so include raising the age of eligibility for Medicare and changing the indexing formula that adjusts Social Security benefits for inflation.To be sure, some restraint is needed in federal entitlement programs. But the idea that we are facing a crisis is complete nonsense. Spending for Social Security, in particular, is very stable. Relatively modest changes, such as raising the taxable earnings base slightly, would be sufficient to put the program on a sound footing virtually forever.That leaves interest on the debt as the principal driver of long-term spending and deficits.
Raising Medicare’s age: Saves feds $5.7 billion, costs you $11.4 billion - House Speaker John Boehner has made his counter-offer on deficit reduction and, as my colleague Lori Montgomery reports, it floats the idea of raising the Medicare eligibility age from 65 to 67. This isn’t a new idea: It’s come up in a lot of deficit reduction proposals of years past, as economists and legislators stare down a Medicare program eating up a growing chunk of the federal budget. The idea has, however, gained a bit more traction since the Affordable Care Act passed. If the Medicare age were raised, the thinking has gone, the 3.3 million 65- and 66-year-olds would still be guaranteed access to health coverage through the tax subsidies. The lowest-income seniors — those earning less than 133 percent of the federal poverty line – would qualify for Medicaid. That’s the upside. Health care economists see a number of downsides, too. For one thing, Medicare tends to be a pretty efficient program. Its costs have grown slower than private health insurance plans. The Center for Budget Priorities and Policy estimates that, while the federal government would save $5.7 billion, the rest of the health care system would end up spending $11.4 billion more to provide those same benefits.Seniors themselves would end up spending $3.7 billion more as the benefits on the exchange would be less robust than those currently covered through Medicare. Employers would end up footing part of the bill, too, continuing to sponsor an additional two years of coverage.
Responding to Jon Chait on the Suddenly Possible Idea of Raising the Medicare Eligibility Age - So my old college pal Jon Chait has responded to my criticism of his endorsement of raising the Medicare eligibility age, America’s worst new idea. As the kerfuffle was happening, however, this has become less of an academic argument. Ezra Klein writes that raising the Medicare eligibility age could become the centerpiece of a deal, based on what “smart folks in Washington” say. He even highlights Chait’s original argument, the entire premise of which is cracked. Apparently the idea here is that the reliance of those aged 26-64 on insurance exchanges to deliver affordable health care is not enough of a constituency behind the program, but adding in those aged 65 and 66 will simply put it over the top. Klein actually rewrites Chait’s point to channel “the White House thinking here,” saying that “it’s not a huge (or smart) cut to Medicare benefits, and most of the pain will be blunted by the Affordable Care Act.” Once again, Ezra, who sits at a desk for a living, can join Jon on a conference call with 65 and 66 year-olds to tell them why it’s so tolerable for them to wait two years – out of a life expectancy of another 15-20 – for Medicare benefits they paid into all their lives. I don’t know, 10-15% reductions in the benefit sounds like a lot to me, especially when you consider that poorer people, with a lower life expectancy, lose more of the benefit. When you add in that this only saves a meager amount of money for canceling 10-15% of the lifetime benefit, it makes it all the more horrible a trade. And you can’t phase this in slowly if you want to save any money with it
Fixing Inflation Adjustments Is the Smart Way to Shrink the Deficit - Cost-of-living adjustments (COLAs) are used throughout the U.S. economy – for union contracts and income tax brackets, as well as for government entitlements. It may seem only fair to adjust contracts and government programs for inflation – otherwise recipients would see their standard of living steadily erode over time. But there are a lot of ways to adjust for inflation. Moreover, the most commonly used gauge, the Consumer Price Index (CPI), may overstate the adjustment needed. Switching to a more conservative measure could save as much as $200 billion over the coming decade. The most commonly proposed change is to replace the CPI with another index called the “chained CPI.” Basically, inflation is calculated based on putting together a basket of commonly bought goods and services and then tracking the price increases for them. In reality, though, people don’t consistently buy the same things. If one particular item – steak, for example – gets very expensive, people will typically buy something cheaper instead, such as chicken. The chained CPI takes into account the substitution of cheaper items for things that get too expensive, and is therefore arguably more accurate than the regular CPI. It also rises a little bit more slowly. The result of replacing the regular CPI with the chained CPI would be slightly slower increases in monthly Social Security payments and some other government benefits. The new measure would also modestly boost tax revenues. The reason: tax brackets are indexed to inflation and would ratchet up more slowly if the chained CPI were used to adjust them. For many taxpayers, that would mean that some of their income would fall in a higher bracket.
Yank The Chain: Washington's Terrible New Social Security Fix -One “fiscal cliff” remedy favored by House and Senate leaders that President Obama might actually go for is changing how cost-of-living increases are calculated for Social Security recipients. The change has some appeal because it could save $112 billion over ten years. Here’s how the CPI is calculated today. Every month the Labor Department’s Bureau of Labor Statistics (BLS) phones all sorts of businesses all over the country to collect prices on roughly 80,000 items divided into about 200 categories. The categories are “weighted” in accordance with nationwide consumer surveys that the BLS conducts every two years; the weighting yields a “market basket,” i.e., a set of goods that’s reasonably representative of American consumption patterns. One longstanding criticism of the CPI is that it doesn’t take into account, on a month-to-month basis, consumer substitutions made in response to price increases. Maybe cheddar cheese is getting so pricey that I’ll switch to American cheese. Or maybe beef is getting so pricey that I’ll switch to chicken. If such substitutions become permanent, the CPI will be artificially inflated because it will assume I’m buying cheddar when I’m really buying American, or it will assume I’m buying beef when I’m really buying chicken. Subsequent inflation adjustments will compound the error and inflate benefits even more.(An obvious objection to this entire mode of thinking is that it doesn’t consider that substitutions might constitute a serious decline in the standard of living. What if I can no longer afford to feed my children beef and I have to feed them dog food instead? From an economist's point of view, I have merely altered my consumption habit.)
More Cliff Notes–Moving to the Chained CPI or Raising Medicare Eligibility Age: Now’s Not the Time - Cutting right to the chase, the cliff is almost upon us, and deciding big changes in social insurance programs—Medicare and Social Security, in particular—in this climate makes no sense. That includes both lowering the Medicare eligibility age and the move to a chained CPI, which by dint of growing more slowly, would reduce Social Security benefits (and increase tax revenues…see here).
- –That doesn’t mean some changes, including cuts, shouldn’t be part of the cliff negotiations. The President’s team, I think, could bring to the table around $400 billion in Medicare cuts over 10 years that largely come out of more efficient drug purchasing, other delivery side savings (paying for quality over quantity), and increase premiums on higher income seniors. Those look to me like smart savings and important negotiating material.
- –But bigger, structural changes, like raising the Medicare eligibility age or switching to the chained CPI are more complex and deserve more discussion and debate.
- –Increasing the eligibility age for Medicare saves money for the budget. But that’s no great policy feat–just kick some people off the rolls and boom, you’ve got some savings. In fact, it raises costs for the larger system (see here), while potentially leaving 65-66 year olds with a less access to affordable coverage. That’s not “reform”—it’s a short-sighted attack on a critical, highly efficient program motivated not by efficiency, but by antipathy to social insurance.
The Fiscal Cliff And Chained CPI, Or Wile E. Coyote As Policy Maker…The Bureau of Labor Statistics defines a Cost of Living Index (COLI) as “the ratio of the minimum expenditure required to attain a particular level of satisfaction in two price situations, a comparison period and a base period.” In other words, a cost of living index answers the question “how much money do you need in order to be as happy now as you were before?” Using the traditional CPI as a cost of living index makes an implicit assumption that the way to be as well off as you were before is to buy the same stuff, but, while keeping consumption constant is in fact *a* way to be as well off as you were before, it’s not the only way, and not usually the cheapest way. For example, to reference a popular meme, suppose I am indifferent between one horse-sized duck and 100 duck-sized horses. Now fast forward to next year, and imagine that the price of the horse-sized duck has risen by 10 percent but the price of the 100 duck-sized horses has remained constant. The CPI would imply that my cost of living has increased by 10 percent, whereas I, as a utility-maximizing consumer, would simply switch over to the 100 duck-sized horses and be just as happy with no additional expenditure required. The chained CPI, therefore, should state that my cost of living has remained constant. Chained CPI uses only observed price and quantity behavior and doesn’t try to estimate cross-price elasticities of demand or anything like that and instead draws its estimates from combining traditional CPI data with expenditure data from the Consumer Expenditure Survey. (The general idea is that if you know how much money people spent on stuff and the price of that stuff, you can back out the quantities purchased over time and the substitutions made in response to changing prices.) In order to understand how chained CPI is constructed and analyze its shortcomings, it’s important to know a bit about how the regular CPI is constructed:
Does Social Security increase the budget deficit? - Over at the Huffington Post, Jason Linkus and Ryan Grimm claim that media fact checkers are “sputtering” in trying to explain how Social Security might affect the deficit and debt. I examined this issue in depth at Real Clear Markets, but here’s the short story: There are two main measures of the budget deficit and the federal debt: The “on-budget” deficit shows the balance of programs other than Social Security (and the postal service), while the “unified budget” deficit combines Social Security with the rest of the budget. Likewise, the “publicly-held” debt includes only debt sold in financial markets, while the “gross debt” includes special-issue debt held in trust funds, including Social Security’s. If you focus on the on-budget deficit, Social Security doesn’t have any effect. Likewise, the gross public debt isn’t affected. On the other hand, Social Security does affect the unified budget deficit and the publicly-held debt. If Social Security’s financing worsens—as it has in recent years, due to the recession and the retirement of the Baby Boomers—then that affects the deficit and debt. Back when conservatives advocated investing the Social Security surplus in personal accounts, liberals endlessly cited figures on how doing so would increase the (unified) budget deficit and the (publicly held) debt.
Sen. Graham: Obama is a ‘small ball guy’ who needs to ‘man up’ on Medicare cuts - Republican South Carolina Sen. Lindsey Graham says President Barack Obama is a “small ball guy” but it’s time for him to start “manning up” on cuts to earned benefits like Medicare and Social Security. Speaking to Fox News host Martha MacCallum on Monday, Graham suggested that Republicans should not agree to tax rate hikes on the rich and should hold a debt ceiling increase hostage until Democrats agreed to “entitlement reform.” “Here’s where the president is going to have a rude awakening,” the senior senator from South Carolina opined. “In February or March, you have to raise the debt ceiling and I can tell you this, there’s a hardening on the Republican side. We’re not going to raise the debt ceiling, we’re not going to let Obama borrow any more money or any American Congress borrow any more money until we fix this country from becoming Greece. And that requires significant entitlement reform to save Social Security and Medicare from bankruptcy.”
Counterparties: How not to fix Medicare - Among the many conventional wisdom fixes in the latest reports on the fiscal cliff negotiations: raising the eligibility age for Medicare. Combine the costs of Medicare with Medicaid expenses for the poor and, as one professor said, you’ve got “pretty much the entire ball game” of US debt. “Government spending on medical expenditures outstripped revenues by $775 billion, which represents 58% of the 2011 Federal deficit,” Robert Dittmar calculated. But the mention of a raising the Medicare eligibility age has drawn an outcry from economists and policy wonks. For that, you can blame, well, math. Raising the cut-off for Medicare to 67 from 65 would save the US government $5.7 billion in 2014, but would increase total health care costs by $11.4 billion, including higher costs for employers and states. Worse, it could raise premiums by some 3%. And, though the CBO says the move could save the government $148 billion over 10 years, it would have an outsized effect on the less educated, minorities, and the bottom 50%, who, unlike the well-off, have seen almost no increase in life expectancy in the last 30 years. In Duncan Black’s words: “it will cost money, not save money, and also kill people”. Matt Yglesias calls this “an absurd means of saving the federal government money—akin to raising $12 billion in taxes and then setting half the money on fire. The only people who actually benefit from this shift are health care providers who get to charge higher prices to 65- and 66-year-olds.” Ezra Klein wonders if policymakers have “a kind of elite blindness” to the idea that some people — poorer people, especially — don’t like to work. Making people wait longer for Medicare, he writes, would address exactly none of America’s truly crucial healthcare problems: It doesn’t modernize the system or bend the cost curve. It doesn’t connect to any coherent theory of health reform, like increasing Medicare’s bargaining power, increasing competition in Medicare, ending fee-for-service medicine, or learning which treatments work and which don’t.
When government does things better - Budget discussions in Washington these days always seem to deteriorate into arguments over what government is supposed to do for its citizens, and what should be left aside. Is the reach of government strictly defined in the Constitution? Or tradition? And, if so, whose "tradition"? Here's a rule of thumb to consider for when government should take a role in providing a service: When it's cheaper. That doesn't mean cheaper merely in a narrow sense, such as cheaper at the cash register, or for some people rather than others. Government can always achieve that end simply by subsidizing things by fiat. Congress could cut the cost of tablet computers simply by deciding to subsidize every household's purchase by, say, $50 or $100. The same thing goes for dishwashers, or fine crystal.Rather, it means cheaper for the economy or society at large. And that points us to the idiocy of an unaccountably popular proposal aired in connection with Washington's "fiscal cliff" cabaret: raising the eligibility age for Medicare.
IMF’s Christine Lagarde on the U.S. Fiscal Cliff - iMFdirect - The head of the IMF Christine Lagarde has weighed in on the ongoing U.S. fiscal cliff debate. Three weeks before a series of automatic tax increases and spending cuts are due to kick in if lawmakers don’t reach a new deal, Lagarde said she favors a comprehensive fix, rather than a quick one. “My view is that the best way forward is to have a balanced approached that takes into account both increasing revenues and cutting spending as well.” Lagarde said the uncertainty of a quick fix would fuel doubt, which prevents investors, entrepreneurs, and households from making decisions. Watch the CNN interview.
Video: David Leonhardt Interviews Paul Krugman - video
Obama ‘willing to compromise’ on ‘tough spending cuts’ - US President Barack Obama said Monday he was ready to compromise “a little bit” to head off a tax and austerity crisis, but warned he would not budge on making the rich pay more. Obama took his campaign to hike rates on the wealthy to a factory floor in Michigan, a day after he met House Speaker John Boehner, his top Republican foe on the “fiscal cliff” showdown for secret White House talks. Unless Obama and Boehner strike a deal to head off $500 billion dollars in tax hikes and savage spending cuts by January 1, all Americans will face higher taxes next year and experts fear the US economy will dip into recession. A temporary cut to payroll taxes and unemployment benefits will expire at the same time, and Obama is also calling on Congress to raise the government’s borrowing limit from its ceiling of $16.4 trillion which will be hit shortly. Obama wants to extend tax cuts dating from the George W. Bush era to be extended for 98 percent of Americans, but to let rates rise on individuals earning more than $200,000 a year and families pulling in $250,0000. Republicans are demanding cuts to social programs in return.
Obama and Boehner’s Grand Bargain: Gullible Democrats are Falling for the Ol’ “Good Cop, Bad Cop” Routine - Generally political analyses of the last four years suffer from two main faults: they either describe an almost undifferentiated environment of complete political corruption or they pinpoint a single main source of our political downfall and attribute most evil to that source. In other words, we are often left with either on the one hand “they’re all evil” and on the other “evil emanates mostly from this person/institution/party”.We can probably agree that a completely polarized view of the world sometimes washes out critical details of that world. It is very difficult to come up with examples of people or institutions that could be viewed as “purely evil” or “all good”. Alternatively if we view the entire political world as the equivalent of a sewer, we are tempted to turn our backs on it and not do anything. What is happening now in American politics surrounding the political theater called “the fiscal cliff”, must be understood with the utmost clarity because, in part, the organizers of what James K. Galbraith aptly calls a “scam” are counting on confusion and rash action to complete their scheme. If we can understand what is going on with greater clarity, we may be able to highlight to more people the import of the events occurring and hopefully short-circuit the efforts of politicians to damage the social safety net and the economy more generally.
Obama Reduces Tax Demand as Budget Talks Inch Forward - Bloomberg: President Barack Obama reduced his demand for tax increases to $1.4 trillion from $1.6 trillion as he and House Speaker John Boehner traded another round of offers and inched toward a budget agreement.Boehner told fellow House Republicans during a private meeting today that Obama hasn’t been reasonable, according to a House Republican aide who asked for anonymity and wasn’t authorized to speak publicly about the discussions. Republicans believe they have been reasonable by proposing new revenue and spending cuts, Boehner said during the meeting, according to the aide. Senate Majority Leader Harry Reid of Nevada said on the Senate floor today he was “very, very disappointed” with the lack of progress. He said Republicans will either agree to raise tax rates on top earners, “or we are going to go over the cliff” of tax increases and spending cuts scheduled to begin in January. The two sides remain hundreds of billions of dollars apart on taxes and spending, and they continue to disagree on whether a year-end deal should include an increase in the debt limit and fresh programs to boost the economy. Obama and Boehner, of Ohio, spoke by telephone yesterday, according to another Republican congressional aide and an administration official who asked for anonymity.
Durbin Says Obama Won’t Support Medicare Age Increase - According to Sen. Dick Durbin (D-IL), one of Obama’s closest allies in the Senate, raising the Medicare age from 65 to 67 is no longer on the table. From the Wall Street Journal: A top Senate Democrat said he was told that President Barack Obama is no longer open to an increase in the Medicare eligibility age as part of a broader deficit-reduction agreement with Republicans. Sen. Richard Durbin, the assistant majority leader who has close ties to Mr. Obama, said to reporters Thursday that he was told “it was no longer on the table” from the White House’s perspective. “It’s no longer one of the items beings considered by the White House,” Mr. Durbin said.
Both White House and GOP debt plans put US credit rating at risk - Deficit-reduction proposals from Speaker John Boehner (R-Ohio) and President Obama fall short of clearly stabilizing the debt, according to budget experts, putting the U.S. credit rating at risk of a downgrade. Under both proposals, U.S. debt would continue to grow as a percentage of gross domestic product, unless the economy grows at a rapid pace, according to experts who have studied the proposals. While some suggest new talks between Obama and Boehner suggest a deal is in reach, they have doubts it will be big enough to meaningfully reduce deficits — or satisfy credit rating agencies. “More is going to have to be done. I’m actually getting a bit more optimistic that a fiscal-cliff deal will get done, but at the same time I’m less optimistic that a ‘grand bargain’ will be achieved,” Bob Bixby of the Concord Coalition said. “The real issue is where everything ends up as a percentage of GDP.” Moody’s, Fitch and Standard and Poor’s have taken a cautious approach in public comments on talks between congressional Republicans and the White House.
The fiscal cliff could split the Republicans - In contrast to his handling of the August 2011 debt crisis, Mr Obama has so far stayed resolute on the fiscal cliff. His insistence on a tax increase for the wealthiest 2 per cent might look like a victory lap but he is aiming to settle more than old scores. If Mr Obama manages to get enough Republicans to vote for a tax increase, it could plunge their party into civil war. There has been much fanfare since the election about the growing number of Republicans who have signalled a readiness to break their anti-tax pledge. But many more have vowed to stick to theirs. In practice, even a deal with a modest 2-3 percentage point rise in the top rate would cause internal ructions – as opposed to the almost five-point rise that kicks in without one. Any Republicans who vote for a rate increase will find themselves on the wrong side of the theological divide from their angry colleagues. That would be a hard one to bridge. Until now, opposition to any new taxes was the one thing on which all Republicans agreed. For every Republican obsessed with what goes on in America’s bedrooms, there is a national security hawk preoccupied with external threats. Then there are the libertarians, such as Ron Paul, who believe the post-9/11 wars were a disastrous mistake. What they share is a hatred of taxes. It has been the party’s binding principle since George H.W. Bush broke his “read my lips” promise in 1990. If Mr Obama can corner House speaker John Boehner and enough Republicans into breaking theirs, the party will never be the same.
A third option changes the negotiation - The conventional wisdom on the fiscal cliff is that there are two options: (1) an Obama-Boehner deal; or (2) no deal, in which case there is no legislation before the end of the year and we “go off the fiscal cliff.” I won’t rehash my argument that the President is no more willing to risk a no deal scenario than Republicans, and therefore that he and his advisors are bluffing when they say they are willing to “go over the cliff” if a new bill is not to their liking. But after talking to Republican friends on Capitol Hill, I am confident that I have convinced no one of this point. It appears many key Republicans believe that a no-bill scenario is unacceptable and must be avoided at any cost. If enough Republican Members of Congress believe this, and if the President knows they believe this, then Speaker Boehner has literally zero leverage in his negotiations. If, however, there is a third option, one that is terrible but not inconceivable, then there is at least some minimum floor to the negotiations. I think option C is S. 3412, a bill passed by the Senate in July. The short description is that this bill “extends the middle class tax relief for one year and allows tax cuts for the rich to expire.”Senate Democrats have already passed this bill, so it is rhetorically infeasible for them to now say no to it. If there is no Obama-Boehner deal, the Speaker has the ability to bring this bill to the House floor and present it as a take-it-or-go-off-the-cliff offer to Congressional Democrats. Many (most?) House Republicans would oppose it, but enough of them would join with Democrats to pass the bill and avert the cliff scenario.
Why Obama Must Go Over The Cliff To Save His Second Term - The standard line on Barack Obama’s fiscal-cliff dilemma is that tactical considerations (i.e., how to get the best deal) recommend jumping over the edge, while strategic considerations (i.e., how to have the most successful presidency) recommend striking a deal. When it comes to tactics, after all, there’s no point in compromising with the GOP in order to raise tax rates below their Clinton-era levels, at least not when simply waiting until January 1 will restore them entirely, no concessions required. On the other hand, doing so could trigger a recession that derails Obama’s agenda. As Major Garrett of the National Journal put it a few weeks ago: “President Obama … has no hope of a second-term legacy of immigration reform, tax reform, or climate-change legislation (if he even wants it) if he drives the nation off the cliff.” There is plenty to be said for this argument—president’s don’t normally find it easier to govern during a recession, of course. But as the fiscal cliff negotiations play out, it’s increasingly proving to be wrong. At this point, both tactical and strategic considerations point toward the necessity of taking the plunge. Simply put: The biggest threat to Barack Obama’s second-term agenda isn’t the economy. It’s the mania that has yet to loosen its grip on congressional Republicans, even after they lost seats in both houses and watched Obama roll to a comfortable re-election. The current debate within the GOP is between those who see that Obama has all the leverage in this particular episode and urge a quick deal on tax rates so the party can regroup for a bigger victory on entitlements, and those who still refuse to budge in any way on tax rates. Which is to say, it’s a debate between the moderately delusional and the utterly, irreconcilably delusional.
Is it Time for Deficit Hawks to Walk Away from the Bargaining Table? - Throughout the past few years I have been a consistent advocate of bipartisan engagement and compromise on fiscal issues. I signed the Committee for a Responsible Federal Budget’s letter urging comprehensive, bipartisan deficit reduction legislation. I wrote repeatedly in support of the Simpson-Bowles Social Security reform proposal although it deviated significantly from my own preferences by including substantial tax increases. I have consistently made the case to like-minded policy makers that compromise is preferable to allowing current unsustainable trends to continue. There are certain substantive realities, however, that limit our scope of useful action. As I detailed in my last piece, the structural fiscal problem is one of spending growing faster than the underlying economy can sustain. That trend is driven by growth in four programs alone – Social Security, Medicare, Medicaid and the so-called “Obamacare” entitlement. Without fundamental reforms that qualitatively re-direct the spending paths of these four programs, tax increases can only kick the can down the road, at best buying some additional time while the real problem grows more difficult to solve.
Time To Start Planning For After We Go Over The Cliff (AWGOC) - A deal is still possible, of course, although the grand bargain/big deal/legacy agreement that never was very likely to begin with now appears to be all-but-impossible to achieve. Even if Obama and Boehner could agree on something like that, the chances of translating it into legislation and getting enough votes to pass it in the House and Senate before the January 1-2 fiscal cliff deadlines are very, very small. I'm not surprised by any this: I've been predicting since September that we were more likely to go over the cliff than prevent it and my odds of that happening have only gotten better (or is it worse?) since Election Day. For the record, I still think there's a better than 60 percent chance that we won't get any deal by January 1, and I'm very close to raising that number.The chances of getting a big deal are only about 5 percent, and I'm being generous.That makes it time to start thinking about what happens next, that is, what if we do go over the cliff. Here's the first installment.
Hedge Fund Executives to Meet With White House on Budget - The Obama administration is continuing its outreach to Wall Street executives in pressing for a resolution of the U.S. budget dispute, with a meeting planned today between Valerie Jarrett and hedge fund managers, according to an administration official. Jarrett, a senior adviser to President Barack Obama, will meet with financial services executives, including Daniel Och, chief executive of Och-Ziff Capital Management, according to the official, who requested anonymity when discussing private meetings. Others scheduled to attend, the official said, include Stefan M. Selig, executive vice chairman of global corporate and investment banking at Bank of America/Merrill Lynch; Jonathan D. Gray, global head of real estate at Blackstone Group Management LLC; and Jes Staley, chairman of JPMorgan Chase & Co.’s corporate and investment bank.
Fiscal Cliff Deal Necessary, but Rushing Makes Bad Policy - The U.S. tax code is about 73,000 pages. Congress and the White House seem to want to rewrite it in little over a week. Good luck with that. Rushing makes bad policy. Even if a deal is reached by the end of next week, it’s a sure bet that a future Congress will have to deal with the unintended consequences of an overhaul done too quickly. Instead of putting every budget item on the table, Washington leaders should focus on avoiding the immediate fiscal cliff. Next year is soon enough to fix the nation’s convoluted tax code and unsustainable spending promises. The latest twist in the fiscal-cliff soap opera, as reported in Wednesday’s Wall Street Journal, is that corporate taxes are on the table. The White House suggested changes to business taxes; the Republicans viewed the offer as a ruse, and little progress was made on the matter at hand. Popular wisdom is that a deal will have to be made by late December 21 to allow for a vote before the usual Congressional holiday recess. (As economists at J.P. Morgan point out December 21 is also the date of the Mayan apocalypse.) That means political leaders have about nine days to reach an agreement that for now is focused on taxes rather than spending. (You can’t even read the entire tax code in that short a time–unless you can speed-read about 5 pages a minute with no breaks.)
Here are the key dates ahead in the fiscal cliff standoff - With lawmakers rushing to avert events that could trigger another recession, here is a look at key dates ahead, with estimated impacts based on research by the Tax Policy Center and the Bipartisan Policy Center, both non-partisan think tanks.
- * Dec. 14. This was the targeted adjournment date for the U.S. House of Representatives, but it has been postponed. The U.S. Senate has not set an adjournment date.
- * Dec. 17. Unofficial optimal date to have a “framework” for a deal in place, congressional aides say, in order to permit time for review and procedural delays in Congress. Congress can go beyond this time without much trouble, however.
- * Dec. 21. Target date for a final deal that would permit lawmakers a full holiday break, aides say.
- The House could be in session through at least Dec. 21 and will not adjourn “until a credible solution to the fiscal cliff has been found,” according to Republican House leadership.
- * Dec. 24. Some skeptical aides say Congress will work to Christmas Eve, possibly reaching a deal, or possibly not.
- * Dec. 25. Christmas holiday.
- * Dec. 26-31. If no deal has been reached by this time to raise the government’s debt ceiling of $16.4 trillion, the U.S. Treasury Department will have to take “extraordinary measures” to put off possible default, as it has done before.
- If Congress does not have a “fiscal cliff” deal before Christmas, lawmakers may have to return to Washington this week.
- * Jan. 1. Expiration of low tax rates enacted under President George W. Bush and extended in 2010 under Obama. This event would raise taxes an estimated $1,600 per U.S. household annually.
- Expiration of Obama payroll tax cut of 2011 and 2012. This would raise taxes an estimated $700 per household.
Chance Of Going Over The Cliff Now At Least 75% - With 17 days as the crow flies before it happens, it's time for me to do something I've been resisting for a week or so: formally increase my odds that we'll go over rather than avoid the fiscal cliff. Back in September I said it was better than 50-50 that no deal would be in place by January 1. I raised that to 60 percent immediately after the election. Today, I'm raising my predicted likelihood of no deal before January 1 to 75 percent, and I may still be overstating the possibility that an agreement will be reached and put in place before the tax cuts and spending increases go into effect. I really hope I'm wrong, and will gladly and publicly say that if a last-minute deal materializes. But here's why I don't think I am:
A Funny Thing Happened On The Way To The Fiscal Cliff - There are 16 days left before we all shoot over the falls and are plunged into the freezing water. The markets are pretending it will never happen and that some magical incantation will be found to set everything right in the moments before we take the dive. The lethargy is noticeable and the apathy is like someone has thrown the wet towel of complacency over everyone’s shoulders. The crowd meanders. In the best case scenario, according to most people, some agreement will be reached. This best case scenario however includes an assumption that I do not believe will be correct which is that something formulated by common sense will be the result and it is just there that I hold little hope - I am more frightened of what our political leaders might concoct than what we face at the cliff. Obama claims a mandate. Who gave him this mandate one may reasonable ask; the 47.5 million people on food stamps, the people living on the tax benefits of those that work, the people who game the system so that they never have to find a job and enjoy a life paid for by those that are gainfully employed? That is one heck of a mandate isn’t it and yet that is the basis of his claim. I am slowly coming to the opinion that the best that can be hoped for is that we do plunge off the cliff. Maybe that will wake up some of the intoxicated with themselves people we now find living in Washington. It also might have a further benefit of waking up the citizens of the country who seem to be traipsing around like nothing is amiss.
Why the Senate’s Tax Bill is No Way Out of the Fiscal Impasse - With fiscal cliff talks seemingly stalled (at least today) , there has been growing talk that House Republicans would call President Obama’s bluff and simply pass the Middle-class Tax Cut Act approved by the Senate last summer. But for all the chatter, nobody has paid much attention to what is, and is not, in that bill. They should, because a close look at the details suggests this option may not be quite so attractive to the GOP, or to anyone else who thinks seriously about tax policy. Granted, it may be politically tempting. In the words of fellow blogger Keith Hennessey (who has great connections with GOP insiders), such a step would be “terrible but not inconceivable.” The bill extends for one year several provisions of the 2001-2009 tax cuts. For instance, it temporarily continues the low 2001-2003 ordinary income rates for individuals making less than $200,000 or couples making less than $250,000, repeals the limits on itemized deductions and personal exemptions (aka Pease and PEP), and extends marriage penalty relief. It also temporarily extends relatively generous treatment of the child tax credit and the earned income tax credit. The measure also raises the tax rate on capital gains and dividends to 20 percent for high income households, and retains a zero rate on investments for those with very low incomes. However, the measure also allows the payroll tax to expire and does nothing to replace it, a step that would raise taxes on many low- and moderate-income workers. It patches the Alternative Minimum Tax, but for 2012 only. While this addresses the immediate problem for those who have to file their 2012 returns starting in a few weeks, it does nothing to patch the AMT for tax year 2013.
A dreadful third option - Negotiations over the fiscal cliff appear to have stalled. A meeting last night between President Barack Obama and John Boehner, the Republican speaker of the House of Representatives, produced no apparent narrowing in their positions. Since negotiations began, very little progress has been made: Mr Obama initially asked for $1.6 trillion in tax increases over the coming decade, and offered $400 billion in spending cuts. Mr Boehner has, in return, offered $800 billion in higher revenue by eliminating tax expenditures (i.e., no increase in rates), and asking for $600 billion in entitlement cuts. Both sides say they are waiting for the other to specify details of their demands, in particular on spending. Mr Boehner is apparently headed home to his Ohio district for the weekend, a sign that no progress is being made. Until this point there have been two likely outcomes: no deal at all and the country going over the cliff, to a grand bargain. But there is third option. Mr Obama has been demanding the House pass an-already passed Senate bill (S.3412) that keeps tax rates where they are for families making less than $250,000 and lets the others return to their pre-2001 level. There is growing support among Republicans for this option, and indeed Andy Laperriere, policy analyst for ISI Group, now considers it the most likely outcome. Neither the world, nor the stock market, appreciates how bad this would be.
Means Testing Emerges as a Social Insurance Pill Democrats Could Swallow - It certainly looked yesterday as if the White House had dropped any notion of using an increase in the Medicare eligibility age as a bargaining chip in future negotiations on a grand bargain. While the White House has not ruled out increasing the age, some of its leading allies did, and Dick Durbin went so far as to say this was “no longer one of the items being considered by the White House.” But the Press Secretary said they would not engage in hypotheticals, seemingly undercutting that categorical. My theory is that the insistent focus on just the eligibility age masks other areas of Medicare policy where Democrats may remain open to benefit cuts. In particular, means testing has become something where Democrats have some bend in them. The problem with means testing is that it already exists; higher-income seniors pay higher premiums already. And the threshold for “higher-income” in Medicare for means-testing is only $85,000. In addition, there are only so many of these high-income seniors; to actually get anything resembling real savings out, you would have to lower that threshold for “high income” well into the middle class. But since the President already put this on the table last year, making it the menu from which Republicans have used to extract concessions, Democrats have pronounced themselves open to it, while holding firm in other areas.
Dems hold the middle ground. GOP is on fringe.: I spoke this morning to an official familiar with the fiscal cliff talks. He tells me that ever since Republicans rejected the first White House fiscal offer, White House negotiators have been asking Republicans to detail both the spending cuts they want and the loopholes and deductions they would close to raise revenues while avoiding a hike in tax rates for the rich. According to the official, Republicans continue to refuse to answer. “No answer ever since the Geithner meeting,” the official said. “To date they have been unwilling or able to identify a list of specific cuts or changes they would like or a single loophole they are willing to close.” This is borne out by reporting in both the New York Times and Politico. How on earth can there be any progress under these circumstances? There is a great deal of consternation this morning over the failure to reach a deal and what it says about the failings of our “political system.” But the main problem is not the “system,” it’s the behavior of one of the participants. It is overwhelmingly clear at this point that Republicans are the primary obstacle to any compromise.
Serious People Could be Seriously Embarrassed: Why It’s Important that We Not Go Off the “Fiscal Cliff” - Much of the media has spent the last month and a half hyping the impact of the "fiscal cliff," the tax increases and spending cuts that are scheduled to take effect at the end of the year. They have been warning of a recession and other dire consequences if a deal is not struck by December 31st. As we are now getting down to the final two weeks and the prospect that there will not be a deal becomes more likely, many in the media are getting more frantic. What they fear is yet another huge embarrassment, if people see the deadline come and go and the economy doesn't crash and the world doesn't end. The reality, as all budget analysts know, is that no one will see more taxes coming out of their paychecks until they actually get paid later in the month. If a deal is imminent or actually struck in the first weeks of January then most workers will never be taxed at the higher Clinton era rate. They will be taxed in accordance with the deal that President Obama reaches with the Republicans. And those who do have money taken out of a check will have it returned in the next one. This might be bad news for people who are skimming by paycheck to paycheck, but the impact on the economy will be too small to measure. The same applies on the spending side. If President Obama sees a deal in sight then he will adjust spending in accordance with the amount that he expects to agree to with Congress, not the amount specified in the sequester. The impact on the economy will be essentially zero, except of course for the impact of the budget cuts that Congress and President Obama actually agree to put in place. In other words, if January 1, 2013 comes and there is no deal, we will likely see that the Serious People were again out to lunch. This will be yet another blow to the credibility of the people who are telling us that we have to cut Social Security and Medicare and do all sorts of other things that somehow always seem to have the effect of hurting the poor and middle class.
The Onion’s Plan For Solving The Fiscal Cliff Crisis - With the so-called fiscal cliff arriving in three weeks, The Onion would like to offer its own simple and mutually beneficial plan for averting a crisis. Those who reject any part of this plan are not only ignorant, but are also guilty of actively trying to undermine the nation and its government.
- STEP ONE: Eliminate school breakfast and lunch programs, Medicaid, the Consumer Product Safety Commission, the Environmental Protection Agency, Medicare, PBS, New Mexico, elk, the Coast Guard, and all dams.
- STEP TWO: Eliminate all nonessential public school programs entirely and offer only three courses: Corn Farming, Nuclear Weaponry, and Print Journalism.
- STEP THREE: Eliminate federal prison system by converting U.S. territory of Guam into an unsupervised penal colony known as “The Gauntlet.”
- STEP FOUR: Eliminate a randomly selected 8 percent of the nation’s total population, preferably teenagers or very young children from the Iowa or Minnesota regions.
- STEP FIVE: Raise taxes on single mothers to encourage them to work harder. The Onion has repeatedly called for a national referendum on how best to punish single mothers, and yet Congress has remained silent.
Fiscal Cliff May Unbuild America - Peter Orszag - you want a concrete example of the unanticipated harm that could come from the U.S. going over the fiscal cliff, look no further than Build America Bonds, an efficient alternative way to subsidize state and local investments. They are part of the spending that is scheduled to be reduced in January. Build America Bonds, which were created in the 2009 stimulus bill, are a shining example of the right way to subsidize activities through the tax code. The wrong way -- which is also the way virtually all other tax subsidies are structured -- is to provide a tax deduction or exclusion. This means that the tax break per dollar of subsidized activity varies with the taxpayer’s marginal rate, and that is both unfair and inefficient. Consider, for example, the exemption allowed for interest paid on state and local bonds. A high-income taxpayer gets a larger tax break for each $1 of interest paid on the bond than a middle-income taxpayer who owns the same bond does. This creates a windfall for high-income taxpayers, a variety of analyses have concluded. As a result, only about 80 percent of the forgone federal revenue shows up in reduced state and local government borrowing costs. Build America Bonds, by contrast, provide a direct federal subsidy, an explicit tax credit that isn’t dependent on marginal tax rates. As a result, it is delivered fully to state and local governments. As I emphasized in my previous article on the topic, these bonds have two other benefits: They attract new participants, such as pension funds, and they help lower the interest rates on traditional state and local bonds.
Beyond the 'fiscal cliff,' America's kids need more – not less – government spending - As the 'fiscal cliff' approaches, John Boehner and other lawmakers should beware of another kind of deficit – the growing opportunity deficit for low-income US children, already present by the time they enter kindergarten. Government can help with universal childcare and preschool.Once a world leader in equal opportunity, America now ranks behind many other affluent countries. Among adults aged 25 to 45 in 2000-2008, just 30 percent of those born into a family in the bottom fifth of incomes had reached the middle fifth of incomes or higher, whereas 80 percent of those born into the top fifth of earners had done so. That gap looks set to grow even larger, as differences in test scores and college graduation between children from low-income versus high-income homes have been rising since the 1970s. We have, in short, a significant opportunity deficit for Americans who grow up in low-income families. And it's getting worse. Like it or not, a real solution will require more – not less – smart spending by government. If President Obama, John Boehner, and House Republicans are unable to reach a deal to avoid the “fiscal cliff,” automatic spending cuts will cause states to lose an estimated $7.5 billion in federal funding for more than 100 grant programs, many of which are vital to low-income communities. Even if Washington averts the precipice, these programs face likely reductions in federal spending as part of an eventual budget deal. But lawmakers who want to preserve the “land of opportunity” by unsaddling future generations from debt should think twice about such cuts.
Why is Washington Obsessing about the Deficit and Not Jobs and Wages? - Robert Reich - Why are we back to showdowns over the deficit? It makes no sense economically. Cutting the budget deficit — either by reducing public spending or raising taxes on the middle class, or both — will slow the economy and increase unemployment. That’s why the so-called “fiscal cliff” is so dangerous. In the foreseeable future our government has to spend more rather than less. Businesses won’t hire because they still don’t have enough consumers to justify additional hires. So to get jobs back at the rate and scale needed, government has to be the spender of last resort. The job situation is still horrendous. Twenty-three million Americans can’t find full-time work. Less than 59 percent of the working-age population of the nation is employed, almost the lowest percent in three decades. 4.8 million Americans have been out of work for more than six months. The 40-week average spell of joblessness is almost three times the post-1948 average. And even those who have jobs are finding it harder to make ends meet. Jobs created since the trough of the recession pay less than jobs that were lost. The median wage is 8 percent below what it was in 2000, adjusted for inflation. And wages are still heading downward: Average hourly earnings in October were 3.1 percent below what they were in October, 2010
Your Humble Blogger Discusses the Fiscal Cliff with Bill Moyers and Bruce Bartlett by Yves Smith I had fun in this conversation with conservative Bruce Bartlett, even though he stole some of my best lines (like Obama not being a liberal). Bartlett is in exile from the Republican party for saying things like Keynesian deficits stimulate the economy (after doing research and finding he couldn’t debunk it based on data) and unions help promote higher wages. The hope was to provide information to a generalist audience about fiscal cliff fearmongering. If you think we succeeded, I hope you’ll see fit to circulate this video widely.
Heritage, Chicago, and the Fiscal Cliff - Paul Krugman -- Menzie Chinn has some fun pointing out that if the doctrine Heritage was pushing to oppose fiscal stimulus were true — namely, that government borrowing always crowds out an equal amount of private spending — then the fiscal cliff could not be a problem. Hey, the government is going to borrow less, which will automatically and necessarily lead to an equal rise in private borrowing, so total demand can’t be affected, right? It is, of course, an absurd proposition; when Heritage propounded this doctrine, it was also retrogressing intellectually by at least 80 years. But what Menzie doesn’t mention is that the very same doctrine was propounded by distinguished economists at the University of Chicago — John Cochrane and Gene Fama made exactly the same argument that Brian Riedl was making at Heritage, while Robert Lucas fell into a somewhat different but equally misleading fallacy. So if you think the fiscal cliff matters, you also, whether you know it or not, believe that a whole school of macroeconomics responded to the greatest economic crisis since the Great Depression with ludicrous conceptual errors, of a kind nobody has had a right to make since 1936 at the latest. And I see no sign at all of a rethink, of an admission that perhaps the macroeconomic situation has developed not necessarily to the Chicago School’s advantage.
Sandy and the Fiscal Cliff -- Andrew Taylor reports that the President has proposed what should be a no brainer: President Barack Obama's proposal for $60.4 billion in federal aid for states hit by Superstorm Sandy adds a huge new item to an end-of-year congressional agenda already packed with controversy. The president's request to Congress on Friday followed weeks of discussions with lawmakers and officials from New York, New Jersey and other affected states who requested significantly more money, but generally praised the president's request as they urged Congress to adopt it without delay. Is the controversy surrounding the question of what not more aid? Of course not: Pushing the request through Congress in the few weeks left before lawmakers adjourn at the end of the year will be no easy task. Washington's attention is focused on the looming fiscal cliff of expiring Bush-era tax cuts and automatic spending cuts to the Pentagon and domestic programs set to begin at the end of the year. And tea party House Republicans are likely to press for budget cuts elsewhere to offset some or even all disaster costs. Again we see the confusion about what Ben Bernanke meant when he coined the term “fiscal cliff”.
CBO Releases Sandy Damage Estimate: At $60.4 Billion, It Would Send US Over The Debt Ceiling - At the end of October, as the Tristate Area was being flooded by Hurricane Sandy, one after another Wall Street firm tried to position Sandy virtually as a non-event, with total damage "forecasts" by such "reputable" firms as Goldman Sachs and Bank of America forecasting a total bill between $10 and $20 billion (as anything above that and the Q3 damage to GDP would be far more substantial than their recently bullish forecasts had accounted for, and would also imply a substantial spillover effect into Q1 2013), the same as various insurance companies who had other far more obvious reasons to undershoot on the total damages. We said the opposite, and based on historic damage forecasts, predicted the damage would likely be between $50 and $100 billion. Once again the sellside consensus was wrong and a fringe blog was accurate, as the CBO has just released the Obama administration's full aid request. Bottom line: $60.4 billion, or roughly what one year of what the ultimate tax hike compromise will bring into the government's treasury. Furthermore, if fully funded by debt today, this amount would send the US (which has a $57 billion debt buffer as of this moment) over the debt ceiling immediately.
Tax Reform At The Bottom Of The Cliff - Whatever Congress and the White House do in the next couple of weeks will reinforce the case for tax reform. The seeming sanctification of low tax rates that occurred with the Tax Reform Act of 1986 has not meant keeping top tax rates low; it has meant only the death of honesty in talking about rates. The result is a patch work of hidden rates and additional wage taxes that is likely to continue. Following the 1986 Act, the advertised top marginal tax rate increased from 28 percent to 31 percent in 1990 and to 39.6 percent in 1993 and then decreased to 35 percent in 2001. But, Congress also added a number of hidden rate increases. In 1990, it added the phase out of personal exemptions and a haircut on itemized deductions (These were gradually eliminated under the 2001 Act). In 1993, it removed the cap on wages subject to the Hospital Insurance (HI) Tax and, in 2010, it added an additional HI tax on high-income individuals.
Would letting all the Bush tax cuts expire make tax reform easier? - My great pal Tony Fratto over at Hamilton Place Strategies is talking up the “benefits to allowing my favored Bush income tax rates to expire and return to Clinton-era tax rates for everyone.” While emphasizing the Clinton-era tax code is “suboptimal,” Fratto — a deputy press secretary to President George W. Bush — thinks a reversion would make it easier to eventually accomplish major tax reform. Fratto: The Obama plan of only raising the top two rates on the wealthiest Americans kills any chance of income tax reform. This is important to understand: tax reform was always going to be a long shot. The forces arrayed against reform are numerous, well-organized, well-financed, dispersed across the country, and are often sympathetic groups: charities, state and local governments, the housing industry, and homeowners, just to name a few. But tax reform becomes practically and politically impossible if the tax burden is skewed to the top as the Obama plan intends. In fact, the wealthiest Americans will face an even higher top marginal tax rate than under the Clinton years due to the increased Medicare payroll and investment taxes in Obamacare. Tax reform requires creating winners, and the pool of winners has to come from people paying taxes. Those not paying taxes today have absolutely nothing to gain from tax reform.
Obama’s Tax Plan Would Spare Many Affluent Families - President Obama’s insistence that marginal tax rates rise for families making more than $250,000 has convinced millions of affluent Americans that they are likely to be writing larger checks to the government next year. But many of those families have no reason to fret. A close look at the president’s plan shows that a large majority of families making up to $300,000 — as well as hundreds of thousands of families with even larger incomes — would not pay taxes at a higher marginal rate. Because the complexity of the tax code makes it difficult to draw clean lines, they are the beneficiaries of choices the administration has made to ensure that families earning less than $250,000 do not pay higher rates. Some of those affluent households would pay higher taxes next year under other parts of the president’s tax plan and increases imposed by the Affordable Care Act, but not under the centerpiece, the part most frequently promoted by the president and most bitterly opposed by Congressional Republicans. John Boudreau, the president of a Connecticut
Washington’s Definition of Middle Class - I saw this proposal in Lori Montgomery’s article on fiscal cliff talks yesterday: Fresh tax revenue, generated in part by raising rates on the wealthy, as Obama wants, and in part by limiting their deductions, as Republicans prefer. The top rate could be held below 39.6 percent, or the definition of the wealthy could be shifted to include those making more than $375,000 or $500,000, rather than $250,000 as Obama has proposed. As commentators from Marty Feldstein to CAP have pointed out, 250K is not middle class. And $375,000 and $500,000 certainty aren’t. While some in New York and San Francisco are right to argue that they face higher local prices (see Moretti’s paper on Real Wage Inequality ) and higher national taxes as a consequence (see Albouy’s paper on the unequal geographic burden of taxation), many chose to live in these expensive cities and I don’t think local price level differences are large enough to make 250K in nominal income fall in the 33-66 ban in real terms.At the national level, the 90th, 95th, and 99th percentiles of income including capital gains are 108K, 150K, and 350K respectively as of 2010 based on data from Emmanuel Saez’s top income database. Unless you count the 67th-97th percentiles as middle class, then it’s hard to justify using 250K as a threshold and it’s even harder to justify going north of that as proposed in the Washington Post.
Incredibly Easy to Balance Budget Without Repealing Obamacare and Without Fiscal Cliff Tax Hikes - The Wall Street Journal has a nice interactive map that lets you Make Your Own Deficit-Reduction Plan. I balanced the budget easily without doing things that I think need to be done such as eliminating the department of energy, the department of education, slashing military spending by 35%, etc., etc. Under the category of "revenue increases", I clicked everything except ...
- Repeal health care coverage
- Add a government run health care plan
- Limit ability to sue doctors
That raised $480 billion in a manner far better than the tax hikes in the fiscal cliff.
Number of the Week: Popular Policies Won’t Balance Budget - $322 Billion: The projected deficit in 2020 if policies preferred by a majority of Journal readers were implemented.Reducing the U.S. deficit is no easy task, and it’s likely impossible to balance the budget just using policies that are backed by a majority of Americans. Last week, the Journal unveiled a tool that allows readers to try their hands at balancing the budget. The graphic tallied the choices made, and allowed us to pinpoint which options were the most popular. Using just the tax increases and spending cuts that garnered more than 50% support support from readers who shared their plans just brings the deficit down to $322 billion in 2020. That’s much better than the $1.102 trillion deficit projected if some tax cuts are extended and other policies remain in effect, but not quite the reduction that would come from policies included in the “fiscal cliff” scenario. (See the plan with the most popular options selected here.) Polling has shown that Americans have a hard time agreeing to policies that would make a significant dent in the federal debt. Congressional Budget Office Director Douglas Elmendorf summed the situation up well in one sentence in 2009: “The country faces a fundamental disconnect between the services the people expect the government to provide, particularly in the form of benefits for older Americans, and the tax revenues that people are willing to send to the government to finance those services.”
The Tax Hike Canard - Five years ago, the United States' budget deficit equaled 1.5 percent of GDP and its national debt stood at 36 percent of GDP. This year, the deficit will exceed $1 trillion, or seven percent of U.S. GDP. Over the same period, the debt ratio has doubled to 73 percent of GDP. Although the United States' economic weakness has contributed to the booming deficit and debt ratios, it is only a small part of the whole story. According to projections by the U.S. Congressional Budget Office, without significant reforms, the deficit would still add up to more than five percent of GDP a decade from now, even if the economy were operating at full capacity. Increased interest on the national debt is not to blame, either, since falling interest rates have made the government's net interest bill lower today as a share of GDP than it was in 2007. Moreover, the share of GDP that goes to another common scapegoat, defense, has risen less than one percent since 2007 (from 3.6 percent to 4.4 percent) and is projected to drop over the next decade. Instead, the rising deficit and debt reflect trillions of dollars of new spending on health programs, other new and enlarged transfer programs to individuals, and a variety of transfers to state and local governments. The increased debt creates five problems: First and most obvious, paying the interest on that debt will require enacting higher taxes that will hurt incentives and weaken growth. Second, since foreign investors hold more than half of U.S. national debt, paying interest on it will require selling more U.S. products to the rest of the world and buying fewer products from abroad.
Top CEOs Urge Lawmakers to Raise Taxes - The Business Roundtable, a group of the nation’s top CEOs, Tuesday urged lawmakers to consider raising taxes to avert the fiscal cliff, a shift for business leaders who had previously said they wanted all tax cuts extended for one year.“We urge you to step forward and demonstrate that principled compromise is once again possible and that the American political system that underpinned the economic success of our nation and others can function as designed,” the group said in a letter to House and Senate leaders. A similar letter was also sent to the White House. The chief executives of Boeing Co., Dow Chemical Co., American Express Co. and other large businesses signed the letters. The executives said a compromise on the fiscal cliff requires Congress “to agree on more revenue–whether by increasing rates, eliminating deductions, or some combination thereof.” Previously, in ads, press releases and letters the Business Roundtable said it wanted Congress to extend Bush-era tax cuts set to expire at year’s end to allow both sides time to overhaul the tax code. The letter to Senate Majority Leader Harry Reid (D., Nev.) Senate Minority Leader Mitch McConnell (R., Ky.), House Speaker John Boehner (R., Ohio) and House Minority Leader Nancy Pelosi (D., Calif.) also promised “active support for a compromise that includes comprehensive and meaningful tax and entitlement reforms that result in market-credible spending reductions and revenue growth.”
GOP: We’ll Accept Higher Taxes If President Obama Gives Us His Dog - news video - Republicans have proposed a new debt deal that includes higher taxes on the wealthiest 2% on the condition that Obama hands over his daughters' dog.
Fiscal Cliff Update - Earlier today I was wondering when the business community would start seriously pressing Republicans to agree to tax increases in order to avoid a new recession caused by either the fiscal cliff or another debt ceiling standoff. Tonight, the New York Times reports that the pressure has started: A broad swath of the nation’s leading chief executives dropped its opposition to tax increases on the wealthiest Americans on Tuesday, while the White House quietly pressed Wall Street titans for their support as well. Before Tuesday’s about-face, the Business Roundtable had insisted that the White House extend Bush-era tax cuts to taxpayers of all income brackets, but the executives’ resistance crumbled as pressure builds to find a compromise for the fiscal impasse in Washington before the end of the year. “We recognize that part of the solution has to be tax increases,” The Business Roundtable isn't a center-right organization. It's a pretty central player in movement conservatism. The fact that they're publicly urging Congress to accept higher revenue—"whether by increasing rates, eliminating deductions, or some combination thereof"—is a significant step.
New language, same findings: Tax hikes on the rich won’t cripple the economy - Under pressure from Senate Republicans, the Congressional Research Service withdrew a September report that concluded that there was no correlation between top individual tax rates and economic growth. Republicans claimed that the report was biased in tone and faulted its methodology, and convinced the agency to remove the report from circulation. The CRS has now released a revised edition of the report that changes some of the language that Republicans had found most objectionable, bolsters the arguments cited in favor of tax cuts and clarifies its methodology. But its underlying conclusion about the Bush tax cuts remains the same. The nonpartisan office, which is part of the Library of Congress, denies that it was simply acting at the whim of Republicans. “CRS decided to report on its own,” said spokesperson Jeanine D’Addario, stressing the office’s commitment to objectivity. “To my knowledge, we have never withdrawn a report based solely on comments from Congress.” But many of the changes reflect the GOP’s criticism of the original report. Republicans were incensed that the original report referred to “tax rates on the rich,” which the CRS has revised to “high-income taxpayers.” The new version of the CRS report is also padded with new citations to research in support of Republicans’ view that tax cuts view economic growth.
Americans Support Tax Increase But Not Spending Cuts - When it comes to deficit reduction the American people strongly support increasing taxes on the rich, but they don’t support most of the common spending cuts currently being considered in Washington. According to a new Pew Research poll, raising taxes on those making over $250,000 a year is the most popular deficit reduction idea, while cutting eduction spending is the least popular. From Pew: (graphic)
Loopholes to Some, Lifelines to Others - If there is one idea that everybody seems to agree on while peering over the fiscal cliff, it is that we should close the loopholes that riddle the tax code. It is offered as a painless way to raise money, like fixing a leak or ending some unfair privilege. . But there is a problem with this consensus. Many of the things the government promotes with loopholes are truly valuable to lots of Americans. Tax credits and deductions may be murky and convoluted, and perhaps are not the best way to achieve government objectives. But that doesn’t mean they serve no purpose at all. Consider education. The federal government has helped Americans pay for college since World War II. Today, the political tide has turned decidedly against tax breaks. Last week, the House speaker, John A. Boehner, may have put President Clinton’s higher-education benefits on the chopping block. In exchange for less spending on federal entitlements, he said Republicans could drop their vow of “no new revenues” and let the government raise $800 billion over 10 years by cutting or paring tax breaks. Though the offer to raise money by closing loopholes has a bipartisan pedigree — based on a plan proposed last year by the Democrat Erskine Bowles and the Republican Alan Simpson, the chairmen of President Obama’s deficit commission — it relies on rhetorical sleight of hand. If tax breaks are equivalent to government spending, eliminating them is equivalent to spending cuts. Mr. Boehner’s offer to do away with tax breaks in exchange for cutting entitlements raises no new revenue. It amounts to cutting spending twice.
Middle Class Malaise Complicates Democrats’ Fiscal Stance - The income stagnation that has hit the middle class in the last decade is complicating the Democrats’ position in the fiscal talks, making it more difficult for them to advocate across-the-board tax increases if a deal falls through.Many Democrats have derided the expiring tax cuts as irresponsible since President George W. Bush signed them a decade ago. Yet the party is united in pushing to make the vast majority of them permanent, even though President Obama could ensure their expiration at year’s end with a simple veto. That decision reflects concern over the wage and income trends of the last decade, when pay stagnated for middle-class families, net worth declined and economic mobility eroded. Democrats who generally would prefer more tax revenue to help pay the growing cost of Medicare and other programs are instead negotiating with Republicans to find a combination of spending cuts and targeted tax increases for higher incomes. If the two parties fail to come to a deal by Jan. 1, taxes on the average middle-income family would rise about $2,000 over the next year. That would follow a 12-year period in which median inflation-adjusted income dropped 8.9 percent, from $54,932 in 1999 to $50,054 in 2011.
The Coming AMT Debacle - The Tax Policy Center (TPC) has estimated that going over the fiscal cliff will raise taxes on average by about $3,500 per household in tax year 2013, compared with extension of 2011 tax law. But tens of millions of Americans have a much more immediate problem. They’ll face a huge tax increase when they file their 2012 tax returns early next year. And many of them don’t even know it. The trouble: A number of major tax benefits expired earlier this year, including the deductibility of state and local sales taxes as well as many business incentives. But by far the biggest problem comes from the expiration of the temporary increase in exemption levels under the alternative minimum tax (the “AMT patch”). In 2011, the exempt income levels under the AMT were $48,450 for single taxpayers and $74,450 for married taxpayers. If Congress fails to act, these exemptions will decline to $33,750 for singles and $45,000 for couples. As a result, 28 million more taxpayers will be hit by the AMT, and many of the 4 million who would owe AMT even with a patch will owe even more. Overall, AMT liability will rise from $34 billion to $120 billion. Of that $86 billion increase, new AMT taxpayers will owe $64 billion—an average of about $2,250–while those currently on the tax will pay another $22 billion—an increase of about $5,500 each over the nearly $8,500 average they would pay with a patch.
If you must raise taxes …President Obama is surrounded by plenty of smart economists. And plenty more are just a phone call away. Is no one telling him that he is trying to raise taxes in the worst possible way? I have frequently written why raising capital gains taxes by 60% and dividend taxes by 200% is bad for growth. But raising marginal tax rates on labor income should also be a last resort. E21: The economic literature is quite clear that increases in marginal tax rates cause households to reduce their supply of investment and labor and result in a smaller economy. The adjustment to higher marginal rates is generally borne through three channels: (1) second earners drop out of the workforce or reduce hours, often due to the increase in the relative cost of child care services; (2) a reduction in the market production of services that could be performed at home, which depresses the demand for the services of housekeepers, mechanics, contractors, painters, and other service providers; and (3) an increase in tax-preferred investments, like municipal debt, rather than more economically productive investments.
Can the Estate Tax Solve the Fiscal Cliff? - The estate tax has gone through many changes over the past ten years, as the tax cuts enacted early in President George W. Bush‘s first term reduced the rate Americans pay on inheritances and raised the threshold amount under which estates are exempt from the tax. The tax was briefly repealed altogether in 2010, before it was reenacted in a 2010 compromise which set the estate tax rate at 35% for estates valued at more than $5 million ($10 million for a couple), indexed to inflation. But without Congressional action, the estate tax will revert to its pre-2001 form January 1st. Under that version of the law, estates valued over $1 million were subject to an estate tax on a graduated basis from 37% to 55%, and a 5% surtax was imposed on some estates valued at over $10 million, which would eliminate the benefit of the graduated rate for very large estates.
Keepin’ It Real on the Estate Tax - Had a debate on the estate tax today, and the best part of it was reviewing the evidence as per this myth/fact document by CBPP’s Chye-Ching Huang and Nate Frentz.This is one of those tax policies lurking in background of the fiscal cliff debate—when you hear the White House say that the expiration of the upper income tax cuts raises about $1 trillion in revenue over 10 years, they’re including the estate tax resetting back to 2009 levels (along with other stuff…the rate increases on income just raise about $440 billion of the total). Compared to keeping it where it is right now (see first link for details), resetting the estate tax would raise about $120 billion over ten…so, there’s real money here ($140 billion including interest savings). The CBPP doc takes you through all the relevant arguments and counterarguments, but here are some of the most important factoids:
Give Now or Pay Later: The Ever-Changing Estate and Gift Tax - For over a decade, the federal estate and gift tax has been in constant flux with its exemption rising, its rates falling, and its near-death experience in 2010 followed by resurrection in a reduced state. Now Congress once again has to decide what to do about these levies, which affect relatively few taxpayers but get an inordinate amount of attention. Calling something the “death tax” will do that. For a few more weeks, the estate and gift tax exempts $5 million of gifts or bequests and taxes any excess at 35 percent. In January, unless Congress acts, the tax will return to its old pre-2001 self with a $1 million exemption and a 55 percent top rate. That possibility means that the wealthy once again have to decide what to do with their assets. Of course, Congress can prevent most of this mess. President Obama wants to revert to the 2009 parameters—a $3.5 million exemption and a 45 percent tax rate. Others want make this year’s tax permanent. Some deficit hawks want to let the rate and exemption return to pre-2001 levels to collect needed revenue. And, of course, many people would like the taxes to go away altogether.
Who Got the Biggest Tax Break in the Last 30 Years? (The Rich, of Course) - Since 1980, total tax rates have fallen for each income group -- rich, poor, and everybody in the middle. But who got the biggest break? This fabulous series of charts from the New York Times offers one answer -- and it exactly the group you're expecting. Total tax rates -- that's federal income + payroll + corporate + state/local -- have gone down for poor and rich alike since 1980. So, we all get a break. But who got the biggest? Divide the first by the 2010 rate by the 1980 rate, and you get an answer. Taxes fell 5% for the poorest households. They fell about 7% for the typical household. And they fell 14% for the richest households. It is fair to say that between President Carter and President Obama, taxes have fallen by twice as much for the richest families as for the median family.
Rich Gain as Firms Seek to Beat Obama Tax Increases - The wealthy look set to enjoy a windfall in the closing weeks of the year as companies push money out the door to beat the higher tax rates advocated by President Barack Obama. More than 150 companies, from Costco Wholesale Corp. to Las Vegas Sands Corp. (LVS), have declared special dividends totaling about $20 billion this quarter to avoid anticipated tax increases in 2013, according to data compiled by Bloomberg. Others, including law and private-equity firms, probably will pay bonuses, partnership distributions and commissions early for tax reasons, “We’re going to have a big jump in household income in the fourth quarter” said Crandall, whose company is a subsidiary of ICAP Plc, the world’s largest broker of transactions between banks. “It’s going to be in excess of $50 billion.” Much of that will go to upper-income Americans, the very people Obama has targeted to pay higher taxes, including Las Vegas Sands controlling shareholder and Chief Executive Officer Sheldon Adelson. Of the $123.6 billion in qualified dividends reported to the government for 2009, about 52 percent was received by those making more than $250,000 for the year, according to the latest data available from the Internal Revenue Service.
Paying 2013 Dividends in 2012 May Save on Taxes but Not for Everyone - Regardless of the outcome of the fiscal cliff negotiations, taxes on dividends will be higher in 2013 than in 2012. As a result, companies can save some shareholders plenty of taxes by paying some of next year’s dividends this year. But not every shareholder will benefit from this presumed largess. While the very wealthy will be winners, many middle-income investors could be worse off. For instance, that extra dividend income could throw some shareholders onto the alternative minimum tax. Some retirees could see more of their Social Security benefits subject to income tax. Some families with children will pay more tax as their child credits phase out. While some investors would be hurt by the accelerated dividend payouts, many low- and middle-income taxpayers could benefit. Taxpayers in the 15 percent bracket and below will owe no income tax on 2012 dividends but would pay their ordinary tax rate on 2013 dividends if Congress doesn’t act. That includes many retirees who rely on dividend income to support themselves. Two tax increases are scheduled to hit dividends next year:
- New taxes associated with Obamacare will kick in for high-income households. Dividends will be subject to a new 3.8 percent tax on investment income above a threshold—$250,000 for couples and $200,000 for singles.*
- Tax rates for dividends revert to ordinary rates as high as 39.6 percent, up from the current top rate of 15 percent.
The first tax hike is certain. The second is tangled up in fiscal cliff negotiations and will occur if Congress and the president do not agree to extend current tax rates for dividends. Even a compromise could raise taxes on dividends for high-income taxpayers.
Paying Taxes on Capital Gains Early: How Investors are Avoiding Tax Hikes - Normally, at the end of each year, investors sell stock (and other assets) to recognize losses to offset gains recognized earlier in the year. Sometimes they do it the other way around, harvesting gains that can be offset by earlier losses. But this year is different: many investors are recognizing gains, even if they don’t have losses. They are doing so to avoid a looming tax hike. Unless things change as part of the fiscal cliff drama, the top rate on capital gains will jump from 15 percent to 25 percent (the 20 percent nominal capital gains rate + 3.8 percent included in the health reform law + 1.2 percent, which is the effective marginal rate created by the limits on itemized deductions for high income taxpayers). That tax hike will induce many investors to take gains over the next few weeks. A similar phenomenon occurred prior to the increase of capital gain tax rates in 1987. But investors won’t need to give up their ownership interests for very long. Gains from the sale of stock are not subject to the wash sale rules that disallow losses from the sale of a stock that is repurchased within 30 days. So, investors can sell stock one day to trigger their gains and then buy back the stock the next day, thus maintaining their economic position.
Tarullo Telegraphs Fed’s Plans to Cap Bank Size - Simon Johnson - Why would a senior governor of the Federal Reserve System publicly ask a question to which he plainly knows the answer? It is about regulation in general, and the Fed’s policy toward big banks in particular. Even the Dodd-Frank financial-reform legislation didn’t immediately inspire Fed governors to take up the role of thought leaders on the nature of systemic financial risk, and what to do about it. Yet, in prominent speeches delivered Oct. 10, Nov. 28 and Dec. 4, the Fed governor responsible for bank supervision, Daniel K. Tarullo, seemed intent on asserting a leadership role for the central bank. The speech in October laid out a broad agenda and floated the idea of size caps on the largest U.S. banks. In November, he sensibly proposed actions to ensure that the U.S. operations of foreign banks are capitalized separately. To borrow a phrase from the former Bank of England official Charles Goodhart, big banks live globally but die locally, and we should prepare accordingly. Lawyers for the bankers reply that such arrangements will make cross-border resolution of failing banks harder. That argument makes no sense. In fact, the opposite is true; resolution would become easier. The Fed will prevail on this issue.
Counterparties: Too Global To Fail - The thing about Too Big to Fail financial firms is that they tend to be Too Big to Fail in several countries at once. Hence, the “shared strategy” laid out in a new joint paper from of the FDIC and the Bank of England that aims to protect taxpayers from paying for the rescue of gigantic multinational corporations.Even if it’s just a set of principles, any sort of action on cross-border resolution has been a long time coming. As Simon Johnson has pointed out, the IMF has been pushing for at least a decade for some method of unwinding international financial firms. The new strategy, summarized in this FT op-ed, has some clear improvements over crisis-era handling of TBTF firms. The company’s home regulator would take control of the firm (lucky them), shareholders and unsecured creditors would be forced to take losses (slow clap), and senior management would be removed (rousing applause). Liquidity would be parceled out by regulators to newly spun-off divisions and any taxpayer losses could be recovered from the financial sector — though it’s not quite clear how. The FDIC-BoE approach — like this 2010 IMF proposal — also calls for something like a Pause button for derivatives contracts; a “stay of termination rights” would temporarily prevent counterparties from being paid out after a TBTF firm fails.
Fed Targets Foreign Banks - The Federal Reserve proposed far-reaching guidelines to change how it regulates foreign banks operating in the U.S. The Fed's Board of Governors voted unanimously to approve a proposal that would subject foreign banks operating in the U.S. to many of the same rules as their American competitors and squelch foreign firms' efforts to avoid tougher U.S. capital and leverage rules. The guidelines would thwart the efforts of some major foreign banks, notably Deutsche Bank and Barclays , to elude new U.S. rules by restructuring. The Fed vote starts the clock on a 90-day comment period, and industry officials expect foreign banks to unleash a vigorous push against the proposal, possibly enlisting foreign governments in criticizing it. After considering the comments, the Fed may make changes to the proposal before making it final, and the rules would go into effect on July 1, 2015. "The proposal is directly responsive to the vulnerabilities in foreign bank activities observed during and after the financial crisis," said Fed governor Daniel Tarullo, the key force on bank regulation at the Fed. Roughly 107 foreign banks—those with at least $50 billion in total global assets—would be affected by the proposal, with the strictest new rules reserved for the roughly 23 banks that have at least $50 billion in U.S. assets. Foreign banks that have at least $10 billion in U.S. assets
Fed wants to force foreign banks to hold more capital - The Federal Reserve wants to force large foreign banks operating in the US to hold a larger financial cushion against unexpected losses. The central bank has also proposed subjecting lenders such as Barclays to the same strict liquidity rules as their US counterparts and forcing them to undergo stress tests. London-based Barclays and Germany’s Deutsche Bank are among global institutions with more than $50bn (£30.9bn) of assets that would be caught by the proposed measures. The Fed is keen to expand regulations, brought in following the financial crisis four years ago, to overseas banks that have operations in the US. The 2008 global crisis “revealed limitations on the ability of foreign banking organisations to act as a source of support to their US operations under stressed conditions”, the proposed regulations state. “In the wake of the crisis, some home country regulatory authorities have restricted the ability of banking organisations based in their home country to provide support to host country subsidiaries. In addition, the capacity and willingness of governments to act as a backstop to their,” the Fed added.
Basel III: Dead on Arrival? - In my last post on Basel III, I suggested that we would soon see a silly game played out over the coming months whereby banks on either side of the Atlantic would alternate in securing more and more concessions on Basel III until the whole thing became manifestly pointless and got sidelined.In fact it is all happening rather faster than that. Brooke Masters at the FT is keeping tabs on the whole thing. In this piece, from 10 days ago, we get a few portents: The 19 biggest US banks will have to show they are on course to comply with the “Basel III” banking reform package as part of next year’s Federal Reserve stress tests even though the US will not have formal rules in place, global regulators pledged on Friday. The announcement by the Financial Stability Board comes at a time when questions are being raised about the global commitment to implementing the Basel reforms, which are aimed at preventing a recurrence of the 2008 financial crisis. Only 10 of the 27 countries that belong to the Basel Committee on Banking Supervision have finished writing their Basel III regulations, and the US recently said that it would not meet the end of year deadline.This proclamation hardly makes sense. It will naturally invite a rejoinder from the banks’ IT departments: “You are telling us to plan and build Basel III compliant computer systems, but, to do that, we need the formal rules (that you don’t have). So you are asking us to build a system, but you won’t let us know what it’s supposed to do. We’ve seen this sort of thing many times before, and we assure you that this won’t end well.”
Volcker Spots a Problem - Simon Johnson - On Monday, at the end of a long day of wrangling over technical details at the Federal Deposit Insurance Corporation’s Systemic Resolution Advisory Committee, Paul A. Volcker cut to the chase. The resolution authority created by the Dodd-Frank financial reform legislation was a distinct improvement on the previous situation, making it easier to handle the failure of a single large financial institution. It does not, however, end the myriad problems associated with that most daunting and modern of phenomena: too big to fail. At age 85, Mr. Volcker, the former chairman of the Federal Reserve, speaks softly and displays a razor-sharp mind. Mr. Volcker incisively observed that the general legal framework of Dodd-Frank, as currently being put into effect, definitely puts more effective powers in the hands of the Federal Deposit Insurance Corporation to handle the failure of what is known as a systemically important financial institution. But the bigger issue is a point made by Mr. Volcker and others at the table. When big banks boom, they find new ways to finance themselves and, too often, regulators go along. The assets they buy look like a sure thing until the moment they collapse in value. This is the classic and future recipe for systemwide panic and potential collapse. The only solution to prevent this is to limit the size of the largest institutions and the activities they can undertake.
Deconstructing Dodd-Frank - Graphic - NYTimes
How Corruption Is Strangling U.S. Innovation - If there's been one topic that has entirely dominated the post-election landscape, it's the fiscal cliff. Will taxes be raised? Which programs will be cut? Who will blink first in negotiations? For all the talk of the fiscal cliff, however, I believe the US is facing a much more serious problem, one that has simply not been talked about at all: corruption. But this isn't the overt, "bartering of government favors in return for private kickbacks" corruption. Instead, this type of corruption has actually been legalized. And it is strangling both US competitiveness, and the ability for US firms to innovate.The corruption to which I am referring is the phenomenon of money in politics. Lawrence Lessig's Republic, Lost, details many of the distortions that occur as a result of all the money sloshing around in the political system: how elected representatives are being forced to spend an ever-increasing amount of their time chasing donors for funds, for example, as opposed to chasing citizens for votes. Former congressman and CIA director Leon Panetta described it as "legalized bribery"; something which has just "become part of the culture of how this place operates." But of all the negative impacts this phenomenon has had, it's the devastating impact it has on US competitiveness that should be most concerning.
Jack Bogle wants to stop those naughty speculators - Jack Bogle, the founder of Vanguard, made some comments on CNBC today that warrant a discussion. He pointed out that the amount of new capital raised in the equity markets these days is about three quarters of a percent of the amount traded in the market during the same period. CNBC: - "When you think about our financial system, the role of the financial system is to direct capital to its highest and best and most profitable uses," Bogle said. While companies raise about $250 billion a year in equity financing through IPOs and additional equity offerings, Bogle said there's $33 trillion worth of trading going on, "which is basically betting on the psychology of the markets. It makes no sense."He thinks it's a problem because people trade on sentiment rather than long-term investing, creating issues for the market and the economy. He is also saying that it hurts long-term investors. Here are some thoughts on the topic:
Thomson Reuters seeks to run new Libor - FT.com: Thomson Reuters, the data provider responsible for the administration of Libor, wants to run a toughened new system after being assured by UK regulators that it is not being investigated over attempts to rig global interest rates. It is set to join its main rival Bloomberg among the bidders to operate the new system. UK regulator the Financial Services Authority has proposed that the future administration of the London interbank offered rate should continue to be operated by a private organisation. Martin Wheatley, the FSA managing director, wants to establish links between submissions from banks and transactions on markets to boost Libor’s credibility. Libor is the umbrella term for global benchmarks that underpin the terms of $350tn of contracts, from mortgages to the cost of corporate lending. They are set daily after the world’s leading banks submit their own estimates of borrowing rates. Thomson Reuters has been assured by the Bank of England and the FSA that it is not under investigation.
Counterparties: The Libor scandal expands -“People are setting to where it suits their book. Libor is what you say it is.” That’s the ontological musing of the man in charge of RBS’s Libor submissions; it comes from a 2007 phone conversation in a seemingly massive set of documents obtained by Bloomberg. One adviser to the OECD said that this is part of what “has to be the biggest financial fraud of all time”. (It’s a common refrain.) In June, Barclays paid a record $450 million fine to settle Libor-fixing allegations for what Matt Levine called “biased guessing”. It wasn’t destined to remain a record. Today, we learned that UBS could face a fine of some $1 billion to settle similar charges with US and UK authorities. (RBS is said to be working on its own settlement). It’s not going to end there. On Tuesday, three men were arrested in London over the Libor probe, including a former UBS trader. Bloomberg reports that the EU could could impose fines equal to 10% of banks’ annual revenue. Nine banks have received subpoenas in a joint investigation by New York and Connecticut AGs over how investors, states and cities have been affected. And Baltimore is already suing a group of big banks over Libor. British regulators have put forth a sensible plan to fix Libor, but in an appearance this week outgoing BoE governor Mervyn King seemed to suggest that misleading Libor bids may just be inevitable:
US banks in fresh structured finance spree - FT.com: US banks have increased their holdings of structured financial products to the highest level since 2009 in an effort to boost profits in the face of continued record low interest rates. Banks’ structured finance investments surged to $48bn in the third quarter of this year, according to data released last week by the Federal Deposit Insurance Corporation (FDIC). That is the highest since the FDIC began breaking out the investments in mid-2009, and a 25 per cent rise on the same period last year. Analysts say that banks have been snapping up higher-yielding structured securities to offset the effect of low interest rates. While banks’ total revenues have surged due to a boom in mortgage refinancings and loan sales, the interest the companies earn from their assets and loans has dropped sharply. The increase is likely to raise concerns that banks are assuming more risk to offset low interest rates – a situation which echoes the pre-financial crisis environment when banks made and bought billions of dollars worth of structured securities. “You’ve got to be on the lookout for riskier structures like asset-backed securities, or commercial mortgage-backed securities and maybe some other structured products,” said David Hendler, bank analyst at CreditSights.
If We Don’t Measure Leverage, We Risk More Crises - You can’t control what you don’t measure. In engineering, control theory is all about using information gained by measuring a system to plan and carry out intelligent actions that will control it. Ideally, it leads to desirable outcomes, such as a nuclear reactor that doesn’t melt down, or a robotic arm that does precisely what it is supposed to do. In the case of the economy, we might not be measuring everything we need to achieve control. For at least half a century, policy makers seeking to control inflation and unemployment have typically focused on managing interest rates. The U.S. Federal Reserve lowers its target rate if the economy stalls, and raises it if inflation appears on the horizon. The recent financial crisis, however, had more to do with the amount of borrowing people did and the way such leverage fueled a bubble in the housing market. Where does leverage currently fit in the equation of macroeconomic stability? Surprisingly, the answer seems to be that it doesn’t. For 15 years, Yale economist John Geanakoplos has argued that policy makers should pay more attention to leverage. Prevailing interest rates determine the cost of borrowing, if a borrower ultimately repays the loan. Independent Quantity Leverage -- reflected by how much collateral people or firms need to put down to borrow and might lose if they fail to pay the loan back -- determines how much someone can buy with a given amount of starting capital. It’s an independent quantity that also influences what happens in the economy, whether borrowing is easy and attractive or not.
The Slap on the Wrist Financial and Corporate Crime Fines - Have you ever noticed that large corporations can get away with pretty much anything? Over and over again a major scandal breaks and in the end the fines are pennies on the dollar for the profits gained by these nefarious financial activities. Banks can launder money with impunity and the consequences are a small fine in comparison to the profits made. No matter how egregious there are no criminal chargers or revoking of the bank's charter. The British bank Standard Chartered said on Thursday that it expected to pay $330 million to settle claims by United States government agencies that it had moved hundreds of billions of dollars on behalf of Iran. Even the record breaking BP fine is considered a slap on the wrist and generated outrage that BP should be barred much longer from federal contracts.
HSBC to Pay $1.9 Billion Fine for Money Laundering - Yves Smith - It seems the Federal Government has finally woken up and is making a show of being serious about one type of bank misbehavior, that of money laundering. The striking element about the agreement of the agreement with various Federal agencies and the Department of Justice is that nearly $1.3 billion of the $1.9 million fine comes in the form of a deferred prosecution agreement. This is the criminal analogy to injunctive relief, in which a miscreant is granted amnesty in return for committing to change its behavior in specific ways. The charges are then dismissed if the subject follows through. On paper, this is a much tougher regime than the frequently violated injunctive relief, since the charges remain over the head of the miscreant until they are dismissed. The open question in these cases is whether the monitoring of compliance is serious or pro-forma, and that’s impossible to know from the outside. The grounds for the criminal part appear to be money laundering for Iran. So why did HSBC get the book thrown at them when Standard Chartered was laundering the Iranian government’s biggest source of foreign exchange, its oil revenues, on behalf of the central bank, and Treasury and other Federal regulators, was a mere $330 million when New York State got $340 million? Admittedly, there is one difference: here, US regulators had already told the bank to shape up and it failed to do so.
Ian Fraser: HSBC’s $1.9 Billion Settlement Sets (Another) Dangerous Precedent - Yves here. One of the things that has too often gone missing in the many discussions of why massive scale money launderer HSBC was not prosecuted is the basis of the “doing that would be destabilizing” excuse. When a company is indicted (mind you, indicted, not convicted), pretty much all Federal and many (most?) state agencies are required to stop doing business with it, immediately. The effect of the loss of so much business, particularly for a large financial firm, is seen as a death knell. Of course, that’s the point. The threat of indictment of the company provides tremendous leverage to go after individuals. The Wall Street Journal’s editorial page went on a rampage against Eliot Spitzer when he used that cudgel to force the resignation of CEO Hank Greenberg. Now of course there is a different way to use this power. A prosecutor could just as well inform a board that it is ready to indict the company unless it secures the full cooperation of executives in order to secure prosecutions of all individuals involved in a meaningful fashion, top to bottom. That includes waving the company’s attorney-client privilege on this matter. Sending executives to prison has far more deterrent value that bringing a company down, since many will argue that employees who had nothing to do with the criminal activity would also be harmed.
HSBC’s $1.9 Billion Settlement and the Men on the Hill - On July 17 of this year, the Senate Permanent Subcommittee on Investigations released a 330-page report on banking giant HSBC, together with 100 documents and internal emails, evincing a culture of hubris and potentially criminal actions when it came to U.S. banking laws. Today, the U.S. Department of Justice and multiple other U.S. regulators will tie all that up with a tidy red bow for a settlement of $1.921 billion; a small nick in HSBC’s profits of $22 billion last year. HSBC released a statement saying it was “profoundly sorry.” During the July 17 Senate hearing on HSBC, Subcommittee Chairman, Carl Levin, questioned Chistopher Lok, the former head of global banknotes at HSBC Bank USA, about internal emails from HSBC that the Senate had in its possession. In the first email, a subordinate tells Lok that a proposed bank customer has a “know your customer” profile that “documents various allegations of fraud, internal control weaknesses, and the FBI investigation into terrorist financing…” Later in the hearing, ranking minority member, Senator Tom Coburn, sends an equally conflicted message to the American people watching this hearing. Coburn asks the chief legal officer for HSBC, Stuart Levey, the following: Coburn: “Do you have a recommendation for Senator Levin and I in terms of what we could do to make us both more effective, less burdensome, and more efficient…” I’m asking that because I really want to know. I actually like to try to fix what’s wrong with government rather than pile on another program that supposed to do the same thing that’s gonna fail again.”
US Bank Money Laundering - Enormous By Any Measure: There is a consensus among U.S. Congressional Investigators, former bankers and international banking experts that U.S. and European banks launder between $500 billion and $1 trillion of dirty money each year, half of which is laundered by U.S. banks alone. As Senator Carl Levin summarizes the record: "Estimates are that $500 billion to $1 trillion of international criminal proceeds are moved internationally and deposited into bank accounts annually. It is estimated that half of that money comes to the United States". Over a decade then, between $2.5 and $5 trillion criminal proceeds have been laundered by U.S. banks and circulated in the U.S. financial circuits. Senator Levin's statement however, only covers criminal proceeds, according to U.S. laws. It does not include illegal transfers and capital flows from corrupt political leaders, or tax evasion by overseas businesses. A leading U.S. scholar who is an expert on international finance associated with the prestigious Brookings Institute estimates "the flow of corrupt money out of developing (Third World) and transitional (ex-Communist) economies into Western coffers at $20 to $40 billion a year and the flow stemming from mis-priced trade at $80 billion a year or more. My lowest estimate is $100 billion per year by these two means by which we facilitated a trillion dollars in the decade, at least half to the United States. Including the other elements of illegal flight capital would produce much higher figures. The Brookings expert also did not include illegal shifts of real estate and securities titles, wire fraud, etc. In other words, an incomplete figure of dirty money (laundered criminal and corrupt money) flowing into U.S. coffers during the 1990s amounted to $3-$5.5 trillion.
DOJ Refuses to Indict HSBC For Money Laundering Explicitly Because It is Too Big To Fail - This is a straight up admission. State and federal authorities decided against indicting HSBC in a money-laundering case over concerns that criminal charges could jeopardize one of the world’s largest banks and ultimately destabilize the global financial system. Instead, HSBC announced on Tuesday that it had agreed to a record $1.92 billion settlement with authorities. The bank, which is based in Britain, faces accusations that it transferred billions of dollars for nations like Iran and enabled Mexican drug cartels to move money illegally through its American subsidiaries. It’s why we need someone like Neil Barofsky at the SEC. In 2009, it really wasn’t possible to indict one of the largest financial institutions for fraud because it really would bring down the entire financial system. And that’s a problem that the Department of Justice can’t solve; that’s a problem the Financial Stability Oversight Council and the Treasury Department and the regulators have to solve first. And that’s underlying all of this. Now the SEC is in a different place, because an SEC case is not going to bring down an institution the way a criminal indictment would. It’s a different set of standards.
Obama Administration Essentially Admits That Some Banks Are Too Big To Jail, Which Is Troubling: One of the great things about being too big to fail is that you're also too big to jail, apparently. So saith the Obama administration, via the New York Times, in its front-page story on Tuesday about HSBC's settlement with the government over money-laundering charges. Though the British banking giant had to pay a wrist-stinging $1.9 billion, the settlement helped it avoid formal criminal charges. The NYT quotes anonymous government officials who say they were skittish about indicting HSBC because formal charges would amount to a "death penalty" for the bank, potentially roiling the financial system.Nor have any individuals been charged at the five other big European banks that have also managed to dodge formal money-laundering charges in recent years, including British bank Standard Chartered, which entered its own deferred prosecution agreement on Monday. Apparently, all of this constant money laundering was done by robots. "The message this is sending is if you want to engage in money laundering, make sure you're doing it within the context of your employment at a bank," Gurulé said in a phone interview. "And don't go small. Do it on a very large scale, and you won't get prosecuted."
Too Big to Jail – Our Banking System’s Latest Disgrace - By Neil Barofsky, former Special Inspector General for the Troubled Assets Relief Program - You can be forgiven if you watched the Department of Justice’s announcement yesterday of a $1.92 billion settlement with HSBC with a sense of disappointment–and déjà vu. The event checked all the boxes in a theatrical routine that has become all too familiar. Descriptions of breathtaking misconduct involving the facilitation of massive drug trafficking and transactions with rogue terror-sponsoring nations? Check. Broad boasts about the “historic” nature of the settlement that will certainly end the type of criminal misconduct alleged? Check. Mea culpas from the offending institution with promises that it has really learned its lesson this time and will never ever engage in dastardly conduct again? Yep, that too. Nothing, however, was quite as it appeared. Sure, HSBC paid a record fine, but there was something vitally important missing from yesterday’s press conference: actual criminal charges for obvious criminal conduct.
Outrageous HSBC Settlement Proves the Drug War is a Joke - Taibbi - If you've ever been arrested on a drug charge, if you've ever spent even a day in jail for having a stem of marijuana in your pocket or "drug paraphernalia" in your gym bag, Assistant Attorney General and longtime Bill Clinton pal Lanny Breuer has a message for you: Bite me. Breuer this week signed off on a settlement deal with the British banking giant HSBC that is the ultimate insult to every ordinary person who's ever had his life altered by a narcotics charge. Despite the fact that HSBC admitted to laundering billions of dollars for Colombian and Mexican drug cartels (among others) and violating a host of important banking laws (from the Bank Secrecy Act to the Trading With the Enemy Act), Breuer and his Justice Department elected not to pursue criminal prosecutions of the bank, opting instead for a "record" financial settlement of $1.9 billion, which as one analyst noted is about five weeks of income for the bank.
How Did Drug Money Laundering Become a Non-Prosecutable Crime: The Stench Spreads on the HSBC Settlement - Yesterday, Lanny Breuer, the Assistant U.S. Attorney General for the criminal division of the Justice Department, appeared on CNBC to defend the deferred prosecution agreement with the global banking giant, HSBC – a deal which settled drug money laundering and other crimes for $1.9 billion without prosecuting any HSBC employee. What Breuer was effectively defending was the five years that his former law partner, John Dugan, was HSBC’s primary banking regulator and did nothing to rein in the outrageously lawless behavior at the bank. Dugan headed the Office of the Comptroller of the Currency (OCC), which regulates all national banks, from August 4, 2005 through August 14, 2010. During that period, according to the Senate Permanent Subcommittee on Investigations, the OCC turned a blind eye to abuses at HSBC. In fact, it was not until Dugan left the OCC that a report was issued in September 2010, detailing five years of alarming conduct at HSBC that went unpunished. U.S. Attorney General, Eric Holder, Assistant U.S. Attorney General, Lanny Breuer, and former OCC head, John Dugan, all hailed from the corporate law firm, Covington & Burling. When Dugan, who also functioned as a bank lobbyist prior to heading the OCC, stepped down from the Federal agency in 2010, he returned to Covington & Burling’s Washington, D.C. office and now chairs the firm’s Financial Institutions Group, providing legal counsel to many of the same banks he supervised badly for five years.
Why did Obama and Cameron save a Criminal Enterprise like HSBC? By William K. Black - Why is HSBC still in operation? On the same day (December 10, 2012) that the Obama administration leaked the story of the HSBC settlement a story ran in the New York Times that was full of self-praise by the Obama and Cameron (U.K.) governments for their “cooperative approach” to cracking down on systemically dangerous institutions (SDIs). SDIs are treated as “too big to fail” because they pose a global systemic risk when they fail. The HSBC settlement puts the lie to the Obama/Cameron crack-down on the SDIs for it revealed a disgrace – Obama and Cameron treat the SDIs as too big to prosecute. Indeed, HSBC demonstrates that the SDIs’ senior officers are treated by Obama and Cameron as too elite to prosecute. The propaganda meme of the NYT story – that the SDIs would never again be given special favors due to reforms being adopted by Obama and Cameron – lasted four hours before it was destroyed by the disgraceful reality of the Obama and Cameron governments’ refusal to prosecute HSBC and its officers for their tens of thousands of felonies. The NYT article begins by accepting the Obama/Cameron framing of the SDI issue, without any critical analysis. “It is one of the thorniest problems hanging over the financial system: how should authorities deal with the collapse of a sprawling global bank to protect the financial system at large?” The reporter’s implicit assumption is that we must have banks that are systemically dangerous when they fail. This example exemplifies why implicit assumptions are so dangerous. They exclude far better alternatives or terrible risks from even being considered – and they do so unknowingly. If the reporter had made the assumption explicitly he would have been forced to defend it with analytics. The article acknowledges that SDIs drove the financial crisis that caused the Great Recession. In the U.S. alone this caused over a $15 trillion loss in wealth and led to the loss, or prevented the creation, of over 10 million jobs. According to the Bush and Obama administrations we were lucky in preventing the crisis from growing vastly larger. SDIs are economic weapons of mass destruction – but they cause their primary destruction inside the nation in which they reside.
At Last We Know How Hedge Funds Are Making All That Money - The ink was barely dry on the $1.9 billion get-out-of-jail-free card that those corporate lawyers that now head up the U.S. Department of Justice handed global bank, HSBC, on Tuesday when long-overdue outrage erupted from the media. There was so much attention to the HSBC stench that a potentially more fascinating and equally smelly deal from the Justice Department went down with little attention the very next day. More on that in a moment. On the Justice Department’s decision to add part of the drug money laundered by HSBC to its own coffers and call it a day without prosecuting HSBC or any of its employees, CNN quoted Notre Dame law professor, Jimmy Gurulé, an international expert on criminal law. Gurulé said the settlement “makes a mockery of the criminal justice system,” adding that “there appears to be an exception for employees of large banks that have engaged in particularly serious and egregious violations of the law. That’s an insane policy.”Fines are seen as a cost of doing business.” In an editorial, the New York Times called the HSBC settlement “a dark day for the rule of law.” Fingering their worry beads (the beads they threw out the window when their editorial page happily advocated for the repeal of the Glass-Steagall Act – the daddy of too big to fail or jail –) the Times questioned why no individual at HSBC was charged in such a well documented case of money laundering for drug cartels. But if the Times wants its mind genuinely boggled, it need only peruse the settlement that snuck in one day later – the insider trading case against the iconic Tiger Asia Management LLC hedge fund that magically became a one-count prosecution of wire fraud – which, having worked 21 years on Wall Street, I can assure you is not the same thing as insider trading. But even more incredulous, the company without the apparent aid of human beings, committed the crime and was the sole defendant charged by the Justice Department — giving corporate personhood a whole new dimension.
Paying 2 And 20 For What Again? Hedge Funds Underperform Stocks For Third Year Running - For the third year in a row, hedge funds will underperform the market, this time by nearly 50%, having returned 5.15% through the end of November (with just equity funds +5.20% YTD), less than half what the MSCI World has returned. And while one can make the argument (not correctly) that a manager has to beat only a given benchmark, and not the overall market, the reality is that for virtually all LPs, seeing their money return well below the S&P not for one, not two, but for three years running, is about the last thing they need before they make a decision to fax in that redemption form.
Deutsche Bank Didn’t “Ignore” Losses of LSS Trade, It Went Through the Mother of All Canadian Restructurings - Yves Smith -A default position among what passes for finance cognoscenti in the blogosphere is to argue that media stories pointing up bank improprieties are making a mountain out of a molehill. The form of the argument is usually, “If you only understood XYZ technical issue, this is not such a big deal.” We’ve seen this type of diversion-as-argumentation take place on the brewing Deutsche Bank scandal over losses that three separate whistleblowers allege that that bank hid from investors during the crisis. The debate has focuses on one position that accounted for the overwhelming majority of the misvaluation, involving so called leveraged super senior trades. In particular, Matt Levine of Dealbreaker and Felix Salmon have both contended that all the bank needed to do was wait and its positions would have worked out. Felix explicitly and Levine implicitly analogize a position carried in the bank’s trading books as a long-term bank asset. There are two problems with that argument. First, it’s a classic example of hindsight bias. Tell me who during the crisis would have assigned a 100% probability to that view, because that’s what this amounts to. It runs afoul of Keynes’ observation: that markets can remain irrational longer than you can stay solvent. Second, Levine and Salmon say, to use Levine’s turn of phrase, that all the German bank did was ignore the losses until they went away. That is a misrepresentation of what actually happened. Levine and Salmon airbrush out what has been called “the biggest structured credit restructuring in history” and “the largest restructuring in Canadian history.” If the restructuring had failed, Deutsche most assuredly would have had major losses on its hands, not just from being forced to unwind the trades at an unfavorable time, but also from litigation, which is not factored into the whistleblowers’ estimates.
Deutsche Bank’s $12 Billion in Hidden Losses: Why Whistleblower Charges Have Merit and Why They Matter - Yves Smith - I’ve read the Department of Labor complaint of former Deutsche Bank employee Eric Ben-Artzi that, among other things, alleges that the German bank violated SEC, GAAP and IFRS (International Financial Reporting Standards) requirements and probably also Sarbanes Oxley, and have had follow up conversations with him and his counsel. The charges are specific and sufficiently well supported to merit serious investigation. In their efforts to dismiss his charges, defenders of the bank’s position overlook the public reporting requirements for complex financial transactions like the one in question, a leveraged super senior (LSS) trade. Nor does their Panglossian “everything worked out for the best” argument stand up to scrutiny. Deutsche’s CFO issued a statement on Thursday justifying the bank’s actions; we’ll address that after providing some context. Lost in the fulminating about these allegations, and the likely reason that the Financial Times gave this story such prominent play is that not one, but three whistleblowers came forward with overlapping concerns. All these individuals had to recognize that going this route would be at best a career-limiting move at Deutsche and would likely result in being fired.
VIDEO: "Big Write-Offs Will Inspire You," Top AIG Exec Raps About Bailout - Today the US Treasury is expected to sell the last of its stock in the American International Group (AIG), marking the end of the $182 billion bailout that rescued the company. But the AIG brass did not always seem appreciative of the government assistance. Just look at Robert Gifford, president and CEO of AIG Global Real Estate, which oversees $8.4 billion of real estate in various countries. At a 2010 holiday party for AIG employees held at a restaurant in New York City, Gifford rapped, to the tune of Jay-Z's "Empire State of Mind," about working at AIG and having to deal with the government. Mother Jones obtained a copy of the video. Watch:
Technology or Monopoly Power? - Krugman - More on robots and all that: first, here’s the chart from the BLS (pdf), which focused on nonfarm business: Dean Baker warns me that the trend is a bit slower if you look at net output, because depreciation is a rising share of the total. Still, something major is happening. Nick Rowe makes a good point, however, which is not so much a critique of the robot story as a general puzzle. Income has been shifting to capital, which would seem to increase the return to investment; but real interest rates are low by historical standards, and were low even before the financial crisis, suggesting that maybe the return to investment is if anything low. You might be able to make some headway here by stressing the different between safe assets and risky investments, but it is a puzzle. Rowe suggests that a third factor, land, may be soaking up the excess returns and being misclassified as part of capital income. Logically, this could be true; I have doubts about whether it can be a major factor empirically, although obviously the thing to do is check it out But there’s another possible resolution: monopoly power. Barry Lynn and Philip Longman have argued that we’re seeing a rapid rise in market concentration and market power. The thing about market power is that it could simultaneously raise the average rents to capital and reduce the return on investment as perceived by corporations, which would now take into account the negative effects of capacity growth on their markups. So a rising-monopoly-power story would be one way to resolve the seeming paradox of rapidly rising profits and low real interest rates.
Robots and Robber Barons, by Paul Krugman - The American economy is still, by most measures, deeply depressed. But corporate profits are at a record high. How is that possible? It’s simple:... profits have been rising at the expense of workers in general, including workers with the skills that were supposed to lead to success in today’s economy. Why is this happening? As best as I can tell, there are two plausible explanations, both of which could be true to some extent. One is that technology has taken a turn that places labor at a disadvantage; the other is that we’re looking at the effects of a sharp increase in monopoly power. Think of these two stories as emphasizing robots on one side, robber barons on the other. About the robots: there’s no question that in some high-profile industries, technology is displacing workers of all, or almost all, kinds. ... What’s striking ... is that many of the jobs being displaced are high-skill and high-wage; the downside of technology isn’t limited to menial workers. ... What about robber barons? We don’t talk much about monopoly power these days; antitrust enforcement largely collapsed during the Reagan years and has never really recovered. Yet Barry Lynn and Phillip Longman of the New America Foundation argue, persuasively in my view, that increasing business concentration could be an important factor in stagnating demand for labor, as corporations use their growing monopoly power to raise prices without passing the gains on to their employees.
Occupy the SEC Submits Amicus Brief to the Supreme Court in Gabelli v. SEC - Yves Smith Occupy the SEC submitted an amicus brief in Gabelli v. SEC, a case before the Supreme Court. The plaintiffs are appealing a Second Circuit decision over the issue of the statute of limitations. The underlying charge is that Gabelli, a portfolio manager at Gabelli Funds LLC, and the chief operating officer, Bruce Alpert, engaged in fraudulent market-making. From Occupy the SEC’s blog: In April 2008, the SEC brought a civil fraud action against Gabelli and Alpert under the Advisers Act. The activities in question occurred between 1999 and 2002. The statute of limitations applicable to the Advisers Act claim, 28 U.S.C. § 2462, bars such claims by the government if they are filed more than five years from when the claim “accrues.” Centuries-old caselaw holds that in fraud cases, “accrual” begins only when the aggrieved party discovers (or reasonably should have discovered) the transgressor’s fraud. This interpretation, known as the “discovery rule,” has a common-sense policy behind it. A perpetrator of fraud should not be able to avoid liability under a technicality simply because the aggrieved party remained unaware of the fraud for the limitations period (of five years, in the case of Gabelli). Gabelli and Alpert have appealed the case to the U.S. Supreme Court, after having lost in the Second Circuit in an opinion co-written by Judge Jed Rakoff. Not surprisingly, financial industry lobbyists like Securities Industry and Financial Markets Association (SIFMA) and the American Bankers Association (ABA) have been vocal critics of the Second Circuit’s decision. SIFMA, the ABA and other anti-enforcement groups have filed amicus briefs before the Supreme Court, urging it to overturn the Second Circuit’s Gabelli decision. If the pro-industry lobbyists have their way, an untold numbers of fraudsters will be able to avoid liability under a technicality – 28 U.S.C. § 2462 – simply because their frauds remain undiscovered for certain statutory periods of time.
Fighting the information war (but only on behalf of rich people) There’s an information war out there which we have to be prepared for. Actually there a few of them. And according to this New York Times piece, there’s now a way to fight against the machine, for a fee. Companies like Reputation.com will try to scour the web and remove data you don’t want floating around about you, and when that’s impossible they’ll flood the web with other good data to balance out the bad stuff. At least that’s what I’m assuming they do, because they of course don’t really explain their techniques. And that’s the other information war, where they scare rich people with technical sounding jargon and tell them unlikely stories to get their money. I’m not claiming predatory information-gatherers aren’t out there. But this is the wrong way to deal with it. First of all, most of the data out there systematically being used for nefarious purposes, at least in this country, is used against the poor, denying them reasonable terms on their loans and other services. So the idea that people will need to pay for a service to protect their information is weird. It’s like saying the air quality is bad for poor people, so let’s charge rich people for better air. So what kind of help is Reputation.com actually providing? Here’s my best guess. First it targets people to get overly scared in the spirit of this recent BusinessWeek article, which explains that cosmetic companies have gone to China and started a campaign to convince Chinese women they are too hairy so they’ll start buying products to remove hair. Second, Reputation.com gets their clients off nuisance lists, like the modern version of a do-not-call program (which, importantly, is run by the government). Finally, for those rich people who are also super vain, they will try to do things like replace the unflattering photos of them that come up in a google image search with better-looking ones they choose. Things like that, image issues.
SEC’s Aguilar Warms Up to Money-Fund Overhauls—The $2.6 trillion U.S. money-market fund industry is headed toward a drastically new look next year, as a regulator who blocked an overhaul effort this past summer has dropped his opposition. Securities and Exchange Commission member Luis Aguilar, a former mutual-fund executive, said in an interview that he would support a proposal that requires money-market funds to "float" their share prices like other mutual funds, a system that would end the $1 peg for their net asset value that money-fund shares have had for decades. Money funds typically invest in short-term debt instruments and, similar to bank accounts, pay investors back the amount that they put in, at exactly a dollar a share, on top of any interest. In 2008, the collapse of Lehman Brothers Holdings Inc. led to a fund that held Lehman debt to "break the buck," or fall below the $1 peg, a rare market event. The government intervened to prevent panic from spreading to other parts of the financial system, and the aim of any regulatory overhaul would be to prevent a similar situation. "I'm not fundamentally opposed to including a properly structured floating net asset value as part of a proposal," Mr. Aguilar said. He added that he hadn't seen the new plan SEC staffers are drafting to overhaul the industry's regulation.
The Beginning of the End of Money Market Funds - Say goodbye to money market funds, and hello to more volatility, whether in money market funds, or their substitutes. As with all of the financial crisis, it would have been better if the Fed and Treasury had not intervened. Most money market funds would have survived. The market panicked less than the regulators did. But now we have the capitulation of Luis Aguilar, perhaps giving in to the pressures of the banks that hate competition from the money market funds. Who is more powerful? Banks. Where are there more systemic losses? Banks. Money market funds are not the problem. If there is a crisis, let them fail. The losses will be ~2% of principal; banks will do far worse. Publishing the net asset value of Money Market Funds will destabilize them; rising NAVs will attract more money, and falling NAVs will lead to a run on the MM funds. It is a recipe for disaster.
Quelle Surprise! OCC Confirms that Big Banks are Badly Managed, Lack Adequate Risk Management Controls - Yves Smith - American Banker has an article up that is astonishing in that it tells us that the main regulator of national banks, the OCC, has confirmed one of our ongoing complaints: that the controls at the biggest banks are inexcusably weak. The OCC is the last place you’d expect to hear this from; historically it’s been a major enabler of banks playing fast and loose with the rules. And the implication is that bank execs should be wearing orange jumpsuits rather than getting multi-million pay packages. Recall that this blog has inveighed repeatedly that the officialdom had a clear and easy path to prosecuting bank executives by using Sarbanes Oxley. You might not fathom how damning that is. If the top brass ins’t doing an adequate job of making sure the books are kept properly and overseeing risk, what the hell are they doing? There’s absolutely no justification for super duper pay packages in light of this finding. It confirms what critics have long charged: that banking has become an exercise in looting, as defined by George Akerlof and Paul Romer: lever up on the basis of government support (which allows you to persist in reckless behavior far longer than normal businesses could) in order to pay the insiders more than they deserve. They keep the leverage and extraction game going until the odds catch up with the enterprise and it collapses.
Banks need to hold a lot more capital — the good stuff - Thomas Hoenig, vice-chairman of the Federal Deposit Insurance Corporation and former head of the Kansas City Fed, has been advocating a break up of America’s big banks. And I think that makes a lot of sense. But banks should also hold more capital. And as Hoenig explains in the FT, the various Basel standards do not provide for “enough real capital to absorb unexpected shocks to the economy.” The Basel standards try to model the riskiness of assets when determining capital levels. “Using this system of risk-weighted assets,” Hoenig explains, “the 10 largest US banking groups had total Basel capital to risk-weighted assets averaging 11 per cent in 2007 at the start of the financial crisis. The chief executives of these banks were confident, even boastful, of being well capitalised.” But by a more conservative standard that Hoenig favors, not so much. Hoenig: Using tangible equity capital and total assets – a more conservative, more credible method of assessing capital adequacy – the average leverage ratio of those same US banks was only 2.8 per cent prior to the crisis, or less than three cents for every dollar of assets on the balance sheet. This more conservative calculation reflects what good analysts do: it excludes items that do not absorb losses in a crisis, such as goodwill, deferred tax assets and other intangibles. And it includes all assets, including those thought to be risk-free. The ten largest US banks have an average tangible equity capital ratio of only 6.1%. Hoenig thinks that’s not nearly enough, noting that before deposit insurance was introduced, the TEC ratios for US banks of all sizes averaged above 10%. Without a government backstop, depositors insisted on high levels of sound capital. Now they don’t.
Unofficial Problem Bank list declines to 849 Institutions - The first unofficial problem bank list was published in August 2009 with 389 institutions. The number of unofficial problem banks grew steadily and peaked at 1,002 institutions on June 10, 2011. The list has been declining since then.This is an unofficial list of Problem Banks compiled only from public sources. Here is the unofficial problem bank list for Dec 7, 2012. Changes and comments from surferdude808: Nothing to report this week than removals to the Unofficial Problem Bank List. Seven institutions were removed, which leaves the list at 849 institutions with assets of $316.2 billion. From last week, assets dropped by $10.2 billion, but $4.9 billion of the decline came from balance sheet shrinkage during the third quarter. A year ago, the list held 977 institutions with assets of $399.5 billion.
Mortgage Crisis Presents a New Reckoning to Banks - NYTimes.com: The nation’s largest banks are facing a fresh torrent of lawsuits asserting that they sold shoddy mortgage securities that imploded during the financial crisis, potentially adding significantly to the tens of billions of dollars the banks have already paid to settle other cases. Estimates of potential costs from these cases vary widely, but some in the banking industry fear they could reach $300 billion if the institutions lose all of the litigation. Depending on the final price tag, the costs could lower profits and slow the economic recovery by weakening the banks’ ability to lend just as the housing market is showing signs of life. The banks are battling on three fronts: with prosecutors who accuse them of fraud, with regulators who claim that they duped investors into buying bad mortgage securities, and with investors seeking to force them to buy back the soured loans. Efforts by the banks to limit their losses could depend on the outcome of one of the highest-stakes lawsuits to date — the $200 billion case that the Federal Housing Finance Agency, which oversees the housing twins Fannie Mae and Freddie Mac, filed against 17 banks last year, claiming that they duped the mortgage finance giants into buying shaky securities.
Lawler: Delinquency/Foreclosure Rates by State for Five Servicers - From economist Tom Lawler: “Free” Data on Delinquency/Foreclosure Rates for First and Second Liens by State for Five “Mortgage Settlement” Servicers. On “The Office of Mortgage Settlement Oversight,” there is a report that can be downloaded that shows the first- and second-lien servicing portfolios for Ally, Bank of America, Citi, Chase, and Wells by delinquency status as of September 30th, 2012 – both nationally and by state. Below are some summary stats (stated as a % of number of loan) for each servicer. The data highlight how truly badly Bank of America’s servicing portfolio is performing, with the “DLQ 180+” and “in Foreclosure” %’s suggesting unusual “slowness” in resolving seriously-delinquent loans (Chase’s “in foreclosure” % suggests problems at that institution as well). The reports (which, again, have data by state) are available here. (click on “servicer performance data”). Here is the spreadsheet.
Bernanke: Fed mortgage bond investments will find new owners in time - During a question-and-answer session, Federal Reserve chairman Ben Bernanke stated the decline in mortgage-back securization yield will not stop investors from returning to the markets when the Fed agrees to sell its holdings. The announcement came alongside the Federal Reserve reporting that interest rates will remain unchanged during the close of the Federal Open Market Committee meeting Wednesday — and that there would be no immediately change to the Fed buying and owning large portions of the aforementioned MBS. Specifically, the Committee decided to continue to purchase additional agency mortgage-backed securities at a pace of $40 billion per month. The Committee also will purchase long-term Treasury securities after the maturity extension program is completed at the end of the month at a pace of $45 billion per month. As rates remained compressed, so do yields. Eventually, the Fed would hope to sell its holdings in this low-yield paper and Bernanke believes buyers will be waiting when that happens. "Taken together, these actions should maintain downward pressure on longer-term interest rates, support mortgage markets, and help to make broader financial conditions more accommodative," the report said. Mortgage rates and MBS yield spread is widening. Bernanke pointed out that while he doesn't expect 100% pass through of MBS, over time a great majority of MBS yields will get passed through with the benefit seen by retail customers and mortgage rates.
Obama Prepares To Kick Out Fannie's Ed DeMarco - The man who singlehandedly fought the administration over the idea of converting Fannie and Freddie into the latest taxpayer-funded handout machine, FHFA head Ed DeMarco, and refused to write down Fannie and Freddie home loans in yet another Geithner-conceived debt forgiveness scheme, whose cost like any other non-free lunch will simply end being footed again by yet more taxpayers (what little is left of them), appears to have lost the war, and with the second coming of Obama appears set to be replaced as head of the FHFA. The WSJ reports that "The White House has begun preparations to nominate a new director to lead the agency that oversees Fannie Mae and Freddie Mac as soon as early next year, according to people familiar with the discussions. This would pave the way for President Barack Obama to fill what has become one of the most important economic policy positions in Washington." And so the impetus for as many as possible to default on their mortgage in a wholesale scramble to obtain debt forgiveness, will soon take the nation by storm, while the contingent liability will be transferred to those who still believe that taking out debt should be a prudent activity and one that takes into account future cash flows. In other words, the solvent middle class - those who were prudent stupid enough to save when they should have simply be doing what the government does and spend like a drunken sailor, preferably on credit, will soon be punished once more.
Is Obama Getting Rid of the FHFA’s Ed DeMarco to Bail Out the Banks? - Yves Smith - Believe it or not, sometimes I’m not cynical enough. I couldn’t fathom the timing of the Obama plan to replace acting FHFA director Ed DeMarco via a recess appointment. DeMarco serves as the perfect scapegoat for Team Obama’s failed housing policies. DeMarco also has a big fanbase among Republicans, so replacing him with anyone too homeowner-friendly might lead the Republicans to take revenge in some fashion in the budget/debt ceiling talks. So given that the administration has seen fit to let the DeMarco matter fester, why act when it might lead to pushback on other fronts from the constitutionally tetchy opposition (well, faux opposition)? And lo and behold, the Administration changed course yet again. Per the Wall Street Journal: . One person familiar with the discussions said officials were likely to seek a nominee who would pose few problems gaining Senate confirmation, a sign that a recess appointment isn’t being considered for now. But then why replace DeMarco at all? He’s that rare beast of a dedicated public servant. Whether you like it or not, he actually believes that he can give borrowers enough relief without principals mods. And no one acceptable to the Republicans is going to be more forgiving on that issue. Dave Dayen pieced it together. It’s the $200 billion in FHFA putback litigation against the banks. A few days ago, there was a peculiar article in the New York Times, “Mortgage Crisis Presents a New Reckoning to Banks,” peculiar in that it was old news, yet given prominent play. Here’s the relevant part:Regulators, prosecutors, investors and insurers have filed dozens of new claims against Bank of America, JPMorgan Chase, Wells Fargo, Citigroup and others, related to more than $1 trillion worth of securities backed by residential mortgages.Estimates of potential costs from these cases vary widely, but some in the banking industry fear they could reach $300 billion if the institutions lose all of the litigation. Depending on the final price tag, the costs could lower profits and slow the economic recovery by weakening the banks’ ability to lend just as the housing market is showing signs of life…
Countrywide motion to seal borrower info denied - Information about borrowers, like employment and income levels, that Countrywide (now owned by Bank of America) wants sealed during the well-known MBIA v. Countrywide case are likely to become a matter of court record, according to a new filing from Judge Eileen Bransten with the Supreme Court of the State of New York. The judge's response, which is mostly in favor of MBIA's push to reveal certain information, stems from an MBIA ($8.41 0%) case in which the bond insurer is suing Countrywide for allegedly making erroneous representations about mortgages backing bonds guaranteed by MBIA. The two parties couldn't agree over whether the following information should be sealed: borrower employment information, borrower loan numbers, transcripts subject to other protective orders in litigation, documents revealing Countrywide non-public financial information as well as documents and transcripts related to Countrywide repurchase analysis and polices and procedures on loss reserves. The court's verdict was to allow for the disclosure of most of the information with certain restrictions to protect the privacy of borrowers. The judge agreed to protect information that would identify borrower's personal or financial information, but said the motion to seal the "voluminous spreadsheets in their entirety is denied."
Foreclosure cases moving like mud - Florida’s foreclosure courts have made almost no progress in clearing an overwhelming backlog of cases from their dockets despite a $4 million stipend awarded by lawmakers this year. As of Oct. 31, there were 377,272 pending foreclosures in Florida’s 20 circuit courts, a net reduction of just 435 cases since the money became available in July, according to the state courts administrator. Judges say new foreclosure filings have nearly outpaced the number of cases they’ve been able to close as banks work on clearing defaulted loans on hold since the robo-signing freezes and pending the National Mortgage settlement, which was finalized in March. While the $4 million has helped courts statewide close 69,513 cases in four months, 69,078 new cases were added during the same time period.“Obviously, we hoped to make a bigger dent, but it seems like we’re just treading water at this point,” said Palm Beach County Chief Judge Peter Blanc, who has 32,434 pending foreclosure cases in the 15th Circuit. “I’m disappointed in the numbers, but the reason for them is pretty clear.”
Yes, We’re Still in the Middle of a Foreclosure Crisis - The Office of Mortgage Settlement Oversight released some interesting data on the first-lien and second-lien portfolios of the five services sanctioned in the foreclosure fraud settlement. Calculated Risk reproduces the data here. Despite the heavy investment in a narrative of the foreclosure crisis being over and the housing recovery underway, these loan portfolios show substantial weakness at the big banks, particularly Bank of America and JPMorgan Chase. Even at Wells Fargo, the bank with the best data here, nearly 1 in 11 first-lien mortgages in their portfolio are in some stage of delinquency. That number widens with BofA, which only has 84.4% of its loans current, and 4.81% in foreclosure, well above traditional averages. JPMorgan Chase’s foreclosure rate is 5.06%. These just aren’t good numbers, and they suggest continuing softness in the sector. Worse, home seizures have begun to rise for the first time in two years.Home seizures in the U.S. rose 5.4 percent last month, the first annual gain in two years, as lenders seek to manage the flow of distressed properties without disrupting the housing recovery, according to RealtyTrac. Banks repossessed 59,134 homes, up from 56,124 from November 2011, the Irvine, California-based data firm said today in a report. The increase was the first since October 2010, when foreclosures slowed after allegations that lenders were using faulty practices to take property from delinquent homeowners. Seizures climbed 11 percent from the previous month.
Reverse Mortgages Pose Big Risks for Seniors, Warn Attorneys and U.S. Officials - Linda and Jim McMahan said that they could not believe their luck in 1993 when they found their dream house. "We loved it," she said. "It wasn't a huge house, but it was a nice size. ... It had the big trees in the yard. And we have deer in the yard every day, and wild turkeys. What more could you want?" As is true for so many Americans, the McMahans' home in St. Croix, Wis., was the couple's dream and nest egg. That is, until their home was drained of its 19-year equity by a reverse mortgage and sold out from under Linda McMahan to pay it back as soon as her husband died. "They must read the death notices, because I'd say within two days, I get a letter: 'Sorry to hear about your husband passing away,' " said Linda, pictured at left. "And they said, 'Well, you either have to buy the house or move out.'"Only people 62 and older qualify for reverse mortgages. They work by giving homeowners the option of an immediate cash payment in exchange for the future value of their house upon death or sale.
Another Asterisk for Asset Purchases - Federal Reserve officials have complained for years that the rest of the government is impeding the effectiveness of monetary policy. The Fed keeps making it cheaper to borrow, but the nation’s favorite kind of borrowing is the mortgage loan, and the mortgage market — well, let’s just say it’s a little broken. In the latest variation on this important theme, researchers at the Federal Reserve Bank of New York presented evidence in a recent paper that a government policy aimed at helping underwater borrowers also is helping lenders pad profits, reducing the benefits for borrowers — and the economy. There is ample evidence that asset purchases work, at least a little. The new Fed study simply adds to the list of reasons that it does not work better.The federal government encourages mortgage companies to refinance borrowers whose debts exceed 80 percent of the value of their homes by instructing Fannie Mae and Freddie Mac to buy the new loans and to relax some of their usual conditions and safeguards. But the Home Affordable Refinance Program offers those terms only to the company controlling the original loan. This unique financial advantage means lenders can charge higher interest rates while still underpricing potential competitors. The Fed study calculates that average rates are about 0.5 percentage points higher than on comparable loans.
MBA: Mortgage Applications increase, Record Low Mortgage Rates - From the MBA: Mortgage Rates Drop to New Lows in Latest MBA Weekly Survey - The Refinance Index increased 8 percent from the previous week and is at its highest level since the week ending October 12, 2012. The seasonally adjusted Purchase Index increased 1 percent from one week earlier. .....The average contract interest rate for 30-year fixed-rate mortgages with conforming loan balances ($417,500 or less) decreased to 3.47 percent, the lowest rate in the history of the survey, from 3.52 percent, with points decreasing to 0.36 from 0.41 (including the origination fee) for 80 percent loan-to-value ratio (LTV) loans.The first graph shows the refinance index. The refinance activity is at the highest level in two months, and has been at a fairly high level all year. The second graph shows the MBA mortgage purchase index.
Freddie Mac: Mortgage Rates to Stay Low, Property Values to Rise in 2013 - Mortgage rates are likely to remain near record lows for the first half of 2013, while property values are expected to strengthen, said mortgage-finance company Freddie Mac. The company expects long-term mortgage rates to rise gradually in the second half of 2013, but to remain below 4%, according to its U.S. Economic and Housing Market Outlook. Freddie Mac sees house prices continuing to rise next year, with most U.S. house price indexes increasing by 2% to 3%. The company expects household formation to increase households by 1.2 million to 1.25 million in 2013, with housing starts reaching an annualized pace of roughly one million by the fourth quarter.
Home Prices Could Jump 9.7% in 2013, J.P. Morgan Says - J.P. Morgan Chase & Co. expects U.S. home prices to rise 3.4% in its base-case estimate and up to 9.7% in its most bullish scenario of economic growth. Standard & Poor’s, which rates private-issue mortgage bonds, on Friday said it expects a 5% rise in 2013. The J.P. Morgan analysts boosted their base-case estimate from 1.5% after a convincing rise in the “net demand” for housing this year has surpassed 2 million homes for the first time since 2006, said John Sim, a strategist at the investment bank. Net demand is the pace of existing home sales minus the inventory of homes available for sale. “Net demand has picked up a lot in 2012,” said Mr. Sim. “Once you get north of the 2 million territory, you are in the positive growth area unless you get a lot of distressed inventory, which this year hit a low point” since at least 2008, he added. J.P. Morgan predicts that net demand to rise from 2.7 million next year from 2.3 million this year. An expected increase in home prices in 2012 triggered a run into some of the riskiest real estate assets, such as subprime mortgage-backed securities from the real estate boom, and analysts including Mr. Sim expect that trend to continue. Rising home prices and the quest for yield has also given a tailwind to new mortgage bond issuance that has been mired in the fallout of the housing crisis and regulatory uncertainty for the past four years.
The Mystery of Housing's Jobless Recovery - If this is a housing recovery, where are the housing jobs? That's the big question after yesterday's jobs report showed the economy still stuck in something just above stall speed. You could change the year on this jobs report from 2012 to 2011 or 2010 and you probably wouldn't be able to tell the difference. Things are getting better, but not getting better fast enough -- unless you think getting back to full employment in 2020 is fast enough. Prices rose 3 percent year-over-year in September, home-builder confidence is up and so are housing permits. All of these indicators have hit post-2006 highs, albeit from a very low, semi-dormant base. But construction employment has barely budged. Superstorm Sandy certainly skewed the November numbers, but construction's 20,000 loss this past month wasn't a complete aberration -- there hasn't been any uptick in construction despite the uptick in housing. The chart below compares building permits with construction jobs since March 2006, and gives us a sense of this disconnect. As Evan Soltas points out, construction employment hasn't increased because construction hours have increased. The chart below shows that the average construction workweek is now a bit longer than it was at the height of the boom.
Merrill Lynch on Housing and Construction Employment - We are still waiting for a strong increase in construction employment, but we know it is coming (I expect construction employment will be revised up in the annual revision). Michelle Meyer at Merrill Lynch wrote about this today (and more on housing): Housing starts are on track to be up 25% and home prices are set to rise 5% over 2012. We believe the recovery will continue into 2013 for several reasons. Most importantly, household formation has started to turn higher, reflecting the shortfall of household creation over the prior five years. In addition, listed inventory is low, owing to extraordinarily slow construction and only a gradual reduction of the distressed pipeline. And specifically for prices, there has been a shift toward short sales as a means of disposing distressed properties. Moreover, investor demand is strong, particularly for distressed inventory. We forecast housing starts to increase another 25% to an average of 975,000 and home prices to increase 3% in 2013...The housing market is turning into an engine of growth once again. Housing construction will likely add 0.3pp to GDP growth in 2012 and 0.4pp to 2013 growth. ... The gain in homebuilding will support related sectors such as furniture, building material sales and financial companies. Moreover, construction jobs will finally come back, allowing some of the 2 million people who lost construction jobs to find employment in the field again.
Rock-Bottom U.S. Mobility Rates - Everyone knows that Americans are a mobile society, moving toward opportunity and jobs, right? Not according to the data from the U.S. Census Bureau, which shows that of geographic mobility in 2011 were at their all-time low since the start of the data in 1948, and were only a tad higher in 2012. Here's the figure just released by the U.S. Census Bureau. The blue bars show the absolute number of moves, as measured on the left-hand axis. The black line shows the rate of mobility, as measured by the percentage of U.S. households that moved. Another chart gives a sense of how far the move are. Most moves are within a given county, or between nearby counties, while relatively few involve moves to another state or abroad. Why is the mobility rate down? One potential set of explanations focuses on the Great Recession: with jobs scarce, and declining home values in many areas, people stayed in place either because of a lack of jobs to move to, or by the unexpectedly low price of their home, or both. But this explanation is at best a very partial one.The downward trend in U.S. mobility goes back well before the start of the recession. People who are unemployed are often more likely to move, not less likely, as a report accompanying these charts pointed out. And if the issue is declining home values, it's hard to explain why mobility rates are down for both renters and for homeowners.
Americans Moving Again, Census Bureau Says -How frequently we move may not seem particularly significant, but it has major implications: Geographic stagnation is closely linked to economic stagnation. During tough times, Americans have historically set off for geographic areas with more jobs and other economic opportunities. In recent years, however, the real estate market hasn’t cooperated: Folks are not only struggling to sell homes, but with so many homes underwater, many can’t even think of selling.And in a kind of vicious cycle, this dynamic runs in both directions: Yes, tough times can cause a decrease in mobility; but decreased mobility can also stifle economic recovery. Several areas of the country have dramatically lower unemployment rates than others; and employers report that large numbers of jobs have remained unfilled for months because of a lack of qualified candidates. But there’s good news, at least in the short-term. According to new data from the Census Bureau, mobility rates are starting to head back up after hitting an all-time low in 2011. Twelve percent of Americans moved in 2012. Most promising, 25- to 29-year-olds are moving again. According to analysis of Census Bureau data by William Frey, a demographer for the Brookings Institution, interstate migration for 25- to 29-year-olds rose from 3.4% in 2010-11 to 3.8% in 2011-12, the largest rate increase since 1999 and the highest level since 2005. It’s a small increase, but an important one, says Frey, who believes that rate will keep going up. “I expect to see a real uptick next year because of all this pent-up demand,” says Frey. “This young generation is ready to pop out of this.”
Q3 2012: Mortgage Equity Withdrawal strongly negative - The following data is calculated from the Fed's Flow of Funds data and the BEA supplement data on single family structure investment. This is an aggregate number, and is a combination of homeowners extracting equity - hence the name "MEW", but there is little MEW right now - and normal principal payments and debt cancellation. For Q3 2012, the Net Equity Extraction was minus $112 billion, or a negative 3.8% of Disposable Personal Income (DPI). This is not seasonally adjusted.This graph shows the net equity extraction, or mortgage equity withdrawal (MEW), results, using the Flow of Funds (and BEA data) compared to the Kennedy-Greenspan method. There are smaller seasonal swings right now, perhaps because there is a little actual MEW (this is heavily impacted by debt cancellation right now). The Fed's Flow of Funds report showed that the amount of mortgage debt outstanding declined sharply in Q3. Mortgage debt has declined by $1.15 trillion since the peak. This decline is mostly because of debt cancellation per foreclosures and short sales, and some from modifications. There has also been some reduction in mortgage debt as homeowners paid down their mortgages so they could refinance.
Chart Of The Day: The Real Household Net Worth As A % Of Debt Chart - In the hours following the release of the latest Flow of Funds statement on Thursday, some of the glorified powerpoint-cum-statist tabloid media outlets released a very disingenuous and flat out wrong comparison of household net worth to total US debt (even though technically total US GDP was showed, although the two are now interchangeable with total US Debt having surpassed total US GDP). Supposedly this was intended to demonstrate the "net worth of America is massively positive" and that America is "not even close to being broke." Of course, by doing so they merely confirmed once more their complete cluelessness when it comes to the debt market, as US household net worth (source) is the direct beneficiary not just of sovereign debt, but certainly all on-balance sheet debt verticals in existence which include, again from the Flow of Funds report tab L.1, household, non-financial corporate, non-financial non-corporate, financial and rest of world debt. The grand total is also conveniently tracked by the Fed in the Total Credit Market Debt Owed category (source) which in the last quarter was $55.3 trillion: just "modestly" above the $16.3 trillion strawman of merely US Federal debt. Comparing this to the $65 trillion in household net worth certainly gives a far less rosy picture of just how "massively positive" net worth of America is.
Consumer credit trend remains the same; guess who is doing all the borrowing? - The latest increase in consumer credit finally showed some increase in revolving credit for October as consumers started to spend a bit. Once again some are attributing this increase in credit card purchases to homeowners stocking up in preparation for Sandy, a storm that ending up leaving millions on the Eastern Seaboard without power. But the growth in non-revolving credit continues unabated, driven primarily by government sponsored student loans. Econoday: - Consumers are active borrowers with credit outstanding, up $14.2 billion, up sharply for a third month in row. Much of the gain is once again tied to loans for students who, limited by the soft jobs market, continue to stay in school. Strong sales of autos are also driving up borrowing. Student and auto loans are part of the nonrevolving component which is up $10.8 billion in the month. The revolving side, where credit cards are tracked, popped up $3.4 billion following the prior month's $2.2 billion decline. Willingness to borrow money and willingness to make big ticket commitments like auto purchases are good signs for the holiday shopping season. Student loans owned by the federal government now constitute nearly a fifth ($0.52 trillion) of US consumer credit (excluding mortgages). Based on the pace of the past 12 months' growth, government-owned student debt will be at $1.7 trillion in 10 years. That's roughly 39% of total consumer debt, assuming other consumer credit also grows at the current pace. And this number doesn't include student loans guaranteed by the government but owned by banks (included in blue below), which represent another half a trillion. As discussed earlier (see post), this allows universities to rapidly increase tuition costs, often with little incentive to do otherwise. And that ends up creating even more demand for student loans.
Vital Signs Chart: Credit-Card Debt Expands - Americans ramped up their credit-card use in October. Revolving credit, which includes credit-card debt, rose a seasonally adjusted $3.4 billion, or 4.7% at an annualized rate, from September to $857.6 billion, the highest level since May. Overall consumer borrowing rose an annualized 6.2% in October to $2.75 trillion. That suggests consumers are growing more willing to borrow for big-ticket items.
Gallup Reports Upper-Income Spending Worst November Ever - With the generally upbeat spending reports on black Friday and cyber-Monday, Gallup paints a different point of view in its most recent poll that shows U.S. Consumer Spending Holds Steady, Consistent With 2011. Americans' self-reported daily spending averaged $73 in November, essentially on par with September and October. It is also similar to the $71 Americans spent last November and slightly higher compared with November 2010 and 2009 -- but still much lower than in November 2008. Upper-income Americans' (defined as those making at least $90,000 per year) self-reported daily spending was lower this November -- an average of $113 -- than in any November dating back to 2008. Upper-income spending has been trending downward since September, although the decline has not been large enough to drag down the overall spending figures.
Consumer Spending Wobbles - U.S. consumer spending, a rare pillar of economic strength in recent months, is showing signs of weakening. American consumers helped carry the economy through a spring slowdown and appeared to power a summer resurgence in growth. But in recent weeks government data have shown spending was slower over the summer than previously believed, and it has started off the final three months of the year on an even weaker footing. Now a range of factors, from high unemployment to the prospect of increased taxes due to the approaching "fiscal cliff," are threatening to sap consumers' spending power at a time when other sectors of the economy likely are too weak to pick up the slack. On Friday, a preliminary December measure of consumer sentiment from the University of Michigan tumbled to its lowest level since August after four months of gains.
Wobbly Consumers?, by Tim Duy: This morning's Wall Street Journal contains a front page story on the state of the American consumer: U.S. consumer spending, a rare pillar of economic strength in recent months, is showing signs of weakening. American consumers helped carry the economy through a spring slowdown and appeared to power a summer resurgence in growth. But in recent weeks government data have shown spending was slower over the summer than previously believed, and it has started off the final three months of the year on an even weaker footing. This, I think, is a charitable interpretation of the consumer situation up until now. I am not sure who exactly believed that the US consumer is a "rare pillar of economic strength," but I suspect they were somewhat delusional and perhaps overemphasizing the importance of consumer confidence surveys. I don't think the consumer is falling off the cliff, fiscal or otherwise, just yet, but household spending hasn't been exactly a source of strength for several months now. The fragility of the sector is not new. Begin with a quick look at core retail sales: The October figure can be discounted as a artifact of Sandy. And even if not, by itself the decline is hardly out of line with monthly fluctuations in the series. On a three month basis, core sales have also been within their past range: The soft spot earlier this year, however, did put in place a more worrisome trend: On this basis, consumer spending lost momentum in April. So why is spending believed to be an economic pillar? I think the rebound of consumer sentiment fostered this view.
Retail Sales increased 0.3% in November - On a monthly basis, retail sales increased 0.3% from October to November (seasonally adjusted), and sales were up 3.7% from November 2011. From the Census Bureau report: The U.S. Census Bureau announced today that advance estimates of U.S. retail and food services sales for November, adjusted for seasonal variation and holiday and trading-day differences, but not for price changes, were $412.4 billion, an increase of 0.3 percent from the previous month and 3.7 percent above November 2011. ... The September to October 2012 percent change was unrevised from -0.3 percent. The change in sales for October was unrevised at a 0.3% decline. This graph shows retail sales since 1992. This is monthly retail sales and food service, seasonally adjusted (total and ex-gasoline). Retail sales are up 24.5% from the bottom, and now 8.8% above the pre-recession peak (not inflation adjusted) The second graph shows the same data, but just since 2006 (to show the recent changes). Most of the decline in October was due to fewer auto sales - a direct impact of Hurricane Sandy. Retail sales ex-autos were unchanged in November - so only autos bounced back. Excluding gasoline, retail sales are up 21.3% from the bottom, and now 8.9% above the pre-recession peak (not inflation adjusted). The third graph shows the year-over-year change in retail sales and food service (ex-gasoline) since 1993. Retail sales ex-gasoline increased by 4.0% on a YoY basis (3.7% for all retail sales).
Retail Sales Only Increase 0.3% Due to Lower Gas Prices for November 2012 - November 2012 Retail Sales increased, by 0.3%. Gasoline sales tanked -4.0% from October on lower prices. If one removes gasoline sales from retail sales, overall the increase from October would have been 0.8%. Auto sales increased 1.6% and minus all autos & parts but including gas sales, retail sales had no change from last month. Retail sales are reported by dollars, not by volume with price changes removed. For the three month moving average, from September to November in comparison to June to August, retail sales have increased 2.0%. In comparison to a year ago, retail sales are up 4.3%. Total retail sales are $412.4 billion for November. Below are the retail sales categories monthly percentage changes. These numbers are seasonally adjusted. General Merchandise includes super centers, Costco and so on. We see retail sales increased and it appears black Friday Thursday-Monday is showing up in sales with online shopping making increasing gains. Nonstore retail sales have increased 11.1% from last year. Retail trade sales are retail sales minus food and beverage services. Retail trade sales includes gas, and is up 0.2% for the month, up 3.4% from last year. Gasoline station sales have increased 0.8% from one year ago, essentially flat whereas things people can do without, sporting goods, hobbies, books & music sales have increased 7.1% from last year. Auto dealer sales have increased 6.3% from last year. Below are the November retail sales categories by dollar amounts. As we can see, cars are king when it comes to retail sales. We also see that electronics is much smaller by total dollars.
Retail Sales: Most of Last Month's Decline Was Erased - The Advance Retail Sales Report released this morning shows that sales in November came in at 0.3% month-over-month. Today's number is below the Briefing.com consensus forecast of 0.4%. The year-over-year change is 3.7%. The latest overall sales number erases most of the October decline.Now let's dig a bit deeper into the "real" data, adjusted for inflation and against the backdrop of our growing population.The first chart shows the complete series from 1992, when the U.S. Census Bureau began tracking the data. I've highlighted recessions and the approximate range of two major economic episodes. The Tech Crash that began in the spring of 2000 had relatively little impact on consumption. The Financial Crisis of 2008 has had a major impact. The green trendline is a regression through the entire data series. The latest sales figure is 5.3% below the green line end point.The blue line is a regression through the end of 2007 and extrapolated to the present. Thus, the blue line excludes the impact of the Financial Crisis. The latest sales figure is 17.4% below the blue line end point.We normally evaluate monthly data in nominal terms on a month-over-month or year-over-year basis. On the other hand, a snapshot of the larger historical context illustrates the devastating impact of the Financial Crisis on the U.S. economy.
A Pair Of Winners: Jobless Claims Fall, Retail Sales Rise - Jobless claims dropped substantially last week, near the lowest level in almost five years. Meanwhile, retail sales rebounded in November. In short, we have two more economic updates that support the case for expecting modest economic growth in the near future. Let’s look at both reports in more detail, start with consumer spending. Retail sales rose 0.3% last month, modestly below the rate projected by economists overall. Nonetheless, today’s report shows a) there’s a post-Hurricane Sandy rebound factor juicing the numbers; and b) retail spending isn’t collapsing, as some of the more pessimistic analysts have been predicting. In sum, a decent report and one that continues to support the case for expecting modest growth in the economy overall. Stripping out gasoline sales, which tumbled 4.0% in November, puts retail ex-gas up by a much-stronger 0.8% last month. That's a reminder that consumers are spending on discretionary items. A strong month for auto sales is one reason, and the holiday shopping season doesn't hurt either. More importantly, the annual trend is holding up as well. Retail sales rose 3.7% last month vs. the year-earlier level. A drop below this rate into the low-3% range would be a warning sign for the business cycle, but there’s still a comfortable margin in today's numbers over that zone.
Vital Signs Chart: Department Store Weakness - The holiday shopping season started on a positive note. Overall retail sales gained 0.3% last month, after declining 0.3% during October. However, consumers showed some signs of caution, cutting back their purchases at department stores in favor of other retailers. Sales at department stores fell 0.8% in November, the fourth consecutive monthly decline.
Holiday retail hiring could break record set 12 years ago - Holiday hiring by retailers is fast approaching a record set 12 years ago, according to a new analysis of government numbers.So far, retailers have added 619,700 seasonal workers in October and November, 19% more than the 512,600 holiday employees hired over the same period last year, according to consultancy firm Challenger, Gray & Christmas Inc.If businesses bring on just 140,300 more workers in December, they’ll match the nearly 760,000 employees tacked on to payrolls during the three-month holiday hiring season in 2000 – a record high.Doing so isn’t a stretch. Last year, retailers hired 147,600 workers in December, bringing the three-month total to 660,200 seasonal employees.Last month, businesses such as Target and Amazon.com picked up 465,500 additional workers -- a 21% increase from a year ago and slightly above the record set in November 2007. Challenger derives its non-seasonally adjusted data from the Bureau of Labor Statistics.“Despite all of the uncertainty, all the talk of fiscal cliffs, the widespread damage to retail epicenters on the east coast by Hurricane Sandy, and the continued growth of e-commerce, retailers are hiring holiday workers in record numbers,” said Chief Executive John A. Challenger in a statement.
Producer Price Index: Headline Lower Than Forecast, Core at Forecast - Today's release of the September Producer Price Index (PPI) for finished goods shows a month-over-month decline of 0.8%, seasonally adjusted, in Headline inflation. Core PPI rose 0.1%. Briefing.com had posted a MoM consensus forecast of -0.5% for Headline and 0.1% for Core PPI. Year-over-year Headline PPI is up 1.4% and Core PPI is up 2.2%. Here is a snippet from the news release: The November decrease in the finished goods index is attributable to prices for finished energy goods, which fell 4.6 percent. By contrast, the indexes for finished consumer foods and for finished goods less foods and energy advanced 1.3 percent and 0.1 percent, respectively. The index for finished energy goods fell 4.6 percent in November, the largest decline since a 4.6-percent decrease in March 2009. Accounting for over ninety percent of the November decline, gasoline prices dropped 10.1 percent. Decreases in the indexes for diesel fuel and home heating oil also contributed to lower finished energy goods prices. (See table 2.) Prices for finished consumer foods rose 1.3 percent in November, the sixth consecutive advance. About forty percent of the November increase can be attributed to the index for beef and veal, which moved up 8.2 percent. Higher prices for fresh and dry vegetables also factored in the advance in the finished consumer foods index. Finished core: The index for finished goods less foods and energy edged up 0.1 percent in November after declining 0.2 percent a month earlier. Leading this advance, the index for light motor trucks rose 0.2 percent. More... Now let's visualize the numbers with an overlay of the Headline and Core (ex food and energy) PPI for finished goods since 2000, seasonally adjusted. As we can see, the YoY trend in Core PPI declined significantly during 2009 and increased modestly in 2010 and more rapidly in 2011. This year the YoY Core PPI trend had been one of gradual decline.
Drought Starting to Show Up in Food Prices - A visit to the grocery store is likely to make shoppers skeptical about news of falling inflation. The drought last summer in the nation’s breadbasket is starting to reflect in food costs even as falling prices at the pump are pushing down overall inflation. The producer price index, a measure that tracks how much wholesalers pay for goods, declined 0.8% last month, but the price for food jumped 1.3%, the largest gain since February 2011, a report Thursday from the Labor Department said.
BLS: CPI declines 0.3% in November, Core CPI increases 0.1% - From the BLS: Consumer Price Index - November 2012 - The Consumer Price Index for All Urban Consumers (CPI-U) declined 0.3 percent in November on a seasonally adjusted basis, the U.S. Bureau of Labor Statistics reported today. Over the last 12 months, the all items index increased 1.8 percent before seasonal adjustment. The gasoline index fell 7.4 percent in November; this decrease more than offset increases in other indexes, resulting in the decline in the seasonally adjusted all items index. The index for all items less food and energy increased 0.1 percent in November after a 0.2 percent increase in October. ... The index for all items less food and energy rose 1.9 percent over the last 12 months, slightly lower than the October figure of 2.0 percent. The food index has risen 1.8 percent over the last 12 months, and the energy index has risen 0.3 percent. . This was below the consensus forecast of a 0.2% decrease for CPI, and below the consensus for a 0.2% increase in core CPI. The decrease in CPI was mostly due to the recent decline in gasoline prices. On a year-over-year basis, CPI is up 1.8 percent, and core CPI is up 1.9 percent. Both below the Fed's target.
Consumer Price Index Declines 0.3% on Falling Gas Prices for November 2012 - The November Consumer Price Index decreased -0.3% from October. CPI measures inflation, or price increases. The culprit is gas prices. The gasoline index declined by -7.4%, the largest decline in gas prices since December 2008. The dramatic drop in gas prices offset inflation in other areas for the month which resulted in a decline not seen since May 2012 Below are CPI's monthly percentage changes. CPI is up 1.8% from a year ago as shown in the below graph. Core inflation, or CPI minus food and energy items, increased 0.1% for November. Core inflation has risen 1.9% for the last year. Core CPI is one of the Federal Reserve inflation watch numbers. These low figures probably helped justify more quantitative easing, which usually increases commodity prices. A global slowdown will trump quantitative easing effect on commodities due to overall weaker demand. Core CPI's monthly percentage change is graphed below. Shelter increased 0.2% and is up 2.2% for the year. The shelter index is comprised of rent, the equivalent cost of owning a home, hotels and motels. Rent increased 0.2%. Used cars and trucks declined -0.5% while apparel dropped -0.6%. Another cost which never drops is medical care. Medical care services increased 0.3% and has increased 3.7% over the last 12 months. Nowhere else do we see a ridiculous, constant increase in costs.
CPI Drops 0.3%, Largest Decline Since December 2008 - If yesterday's better than expected initial claims numbers were bad for the market (as they implied the approach of the Fed's QEnd), today's CPI should dissolve some fears of an imminent, and very unrealistic, end to easing. Because as the Fed explained, employment is only one component of the QEnd calculus, inflation is another. And with November CPI dropping 0.3% sequentially (up 1.8% Y/Y), on expectations of a -0.2% M/M, and +1.9 Y/Y, also the biggest sequential decline since 2008, there is not much to worry about on the inflation front... as long as one doesn't count other inflation "expressions" such as modern art, insurance costs, student tuition, or even the S&P and other credit funded items into account. Core CPI also missed the expected rise of 0.2%, growing at 0.1%. Biggest components of the price drop were energy prices, declining (-4.1%) from October, Apparel (-0.6%) and Used cars and trucks (-0.5%) - thank you GM channel stuffing. Alternatively, prices rose for food at home (+0.3%), Electricity (+0.7%) and food away from home (+0.3%). We may need some more QE4EVA+1^? soon if this continues.
Annualized Headline and Core Inflation Decline - The Bureau of Labor Statistics released the CPI data for November this morning. Year-over-year unadjusted Headline CPI came in at 1.76%, which the BLS rounds to 1.8%, down from 2.16% last month. Year-over year-Core CPI (ex Food and Energy) came in at 1.94% (BLS rounds to 1.9%), down from last month's 2.00%. Here is the introduction from the BLS summary, which leads with the seasonally adjusted data:The Consumer Price Index for All Urban Consumers (CPI-U) declined 0.3 percent in November on a seasonally adjusted basis, the U.S. Bureau of Labor Statistics reported today. Over the last 12 months, the all items index increased 1.8 percent before seasonal adjustment. The gasoline index fell 7.4 percent in November; this decrease more than offset increases in other indexes, resulting in the decline in the seasonally adjusted all items index. The energy index fell 4.1 percent in November despite increases in the indexes for natural gas and electricity. The food index rose 0.2 percent with the food at home index increasing 0.3 percent, the same increases as in October. The index for all items less food and energy increased 0.1 percent in November after a 0.2 percent increase in October. The indexes for shelter, household furnishings and operations, airline fares, recreation, new vehicles, and medical care all increased in November, while the indexes for apparel and used cars and trucks declined. More... The first chart is an overlay of Headline CPI and Core CPI (the latter excludes Food and Energy) since 1957. The second chart gives a close-up of the two since 2000.
Analysis: Inflation Is Just Not a Major Threat - Wells Fargo Chief Economist John Silvia talks with Jim Chesko about this morning’s report showing that U.S. consumer prices fell in November as gasoline prices tumbled.
Inside the Consumer Price Index - Let's do some analysis of the Consumer Price Index, the best known measure of inflation. The Bureau of Labor Statistics (BLS) divides all expenditures into eight categories and assigns a relative size to each. The pie chart below illustrates the components of the Consumer Price Index for Urban Consumers, the CPI-U, which I'll refer to hereafter as the CPI. The slices are listed in the order used by the BLS in their tables, not the relative size. The first three follow the traditional order of urgency: food, shelter, and clothing. Transportation comes before Medical Care, and Recreation precedes the lumped category of Education and Communication. Other Goods and Services refers to a bizarre grab-bag of odd fellows, including tobacco, cosmetics, financial services, and funeral expenses. For a complete breakdown and relative weights of all the subcategories of the eight categories, here is a useful link. The chart below shows the cumulative percent change in price for each of the eight categories since 2000. Not surprisingly, Medical Care has been the fastest growing category. At the opposite end, Apparel has actually been deflating since 2000. The latest Apparel number is the first fractional nudge above zero in about nine years. Another unique feature of Apparel is the obvious seasonal volatility of the contour. Transportation is the other category with high volatility — much more dramatic and irregular than the seasonality of Apparel. Transportation includes a wide range of subcategories. The volatility is largely driven by the Motor Fuel subcategory. For a closer look at gasoline, see my weekly gasoline updates. The BLS does not lump energy costs into an expenditure category, but it does include energy subcategories in Housing in addition to the fuel subcategory in Transportation. Also, energy costs are indirectly reflected in expenditure changes for goods and services across the CPI.
Weekly Gasoline Update: Prices Drop Another Four Cents - Here is my weekly gasoline chart update from the Energy Information Administration (EIA) data. Gasoline prices at the pump declined again last week. Rounded to the penny, the average for Regular and Premium both fell four cents, the same as the previous week. We are now approaching the anniversary of the interim weekly lows in the December 19, 2011 EIA report. Regular is 12 cents and Premium 16 cents above their interim lows. That means more money for holiday spending! As I write this, GasBuddy.com continues to show one state, Hawaii, with the average price of gasoline above $4. The next highest average price is New York, has prices above $3.78.
Wholesale Inventories in US Rose More Than Forecast in October - Inventories at U.S. wholesalers rose more than forecast in October, a sign goods are piling up in the face of slowing demand. The 0.6 percent increase in stockpiles followed a 1.1 percent gain in September, the Commerce Department reported today in Washington. The median forecast in a Bloomberg survey was a 0.4 percent advance. Sales declined 1.2 percent, the biggest drop since June. While the Commerce Department said it couldn’t quantify the effect of Sandy on the data, it said companies reported both positive and negative influences from the storm. A global slowdown and looming U.S. tax and government spending changes may weigh on orders, indicating distributors will want to keep a tight rein on stockpiles. At the current pace of sales, wholesalers had enough goods on hand to last 1.22 months, the most since October 2009, the report showed.
CoStar: Commercial Real Estate prices decrease slightly in October, Up 6% Year-over-year - From CoStar: Commercial Property Prices Show Little Movement in October Amid Economic Uncertainty The two broadest measures of aggregate pricing for commercial properties within the CCRSI—the equal-weighted U.S. Composite Index and the value-weighted U.S. Composite Index—saw very little change in the month of October 2012, dipping -0.1% and -0.8%, respectively, although both improved over quarter and year-ago levels. Recent pricing fluctuations likely signify a more cautious attitude among investors stemming from uncertainty over U.S. fiscal policy heading into 2013. The number of distressed property trades in October fell to 14.8%, the lowest level witnessed since the first quarter of 2009. This reduction in distressed deal volume should result in higher, more consistent pricing, and lead to enhanced market liquidity, giving lenders more confidence to finance deals. This graph from CoStar shows the Value-Weighted and Equal-Weighted indexes. As CoStar noted, the Value-Weighted index is up 35.0% from the bottom (showing the demand for higher end properties) and up 6.1% year-over-year. However the Equal-Weighted index is only up 10.0% from the bottom, and up 5.9% year-over-year.
Hotel Occupancy Rate above pre-recession levels at end of November - From HotelNewsNow.com: STR: US results for week ending 1 December In year-over-year comparisons, occupancy was up 2.5 percent to 52.2 percent, average daily rate rose 3.5 percent to US$103.00 and revenue per available room increased 6.2 percent to US$53.74. The 4-week average is above the pre-recession levels (the 4-week average is at 56.0% - for the same week in 2007, the 4-week average was at 54.8%). Note: ADR: Average Daily Rate, RevPAR: Revenue per Available Room. The following graph shows the seasonal pattern for the hotel occupancy rate using a four week average.
U.S. Trade Deficit Grows to $42.2 Billion in October — The U.S. trade deficit increased in October because exports fell by a larger margin than imports, a sign that slower global growth could weigh on the U.S. economy. The trade gap with China also hit an all-time high. The Commerce Department says the trade deficit grew 4.8 percent in October from September to $42.2 billion. Exports dropped 3.6 percent to $180.5 billion. Sales of commercial aircraft, autos and farm products all declined. Imports fell 2.1 percent to $222.8 billion, reflecting fewer shipments of cell phones, autos and machinery. A wider trade deficit acts as a drag on growth. It typically means the U.S. is earning less on overseas sales of American-produced goods while spending more on foreign products.
Trade Deficit increased in October to $42.2 Billion - The Department of Commerce reported: [T]otal October exports of $180.5 billion and imports of $222.8 billion resulted in a goods and services deficit of $42.2 billion, up from $40.3 billion in September, revised. October exports were $6.8 billion less than September exports of $187.3 billion. October imports were $4.9 billion less than September imports of $227.6 billion. The trade deficit was smaller than the consensus forecast of $42.8 billion. The first graph shows the monthly U.S. exports and imports in dollars through October 2012.Both exports and imports decreased in October. US trade has slowed recently. Exports are 9% above the pre-recession peak and up 1.0% compared to October 2011; imports are 4% below the pre-recession peak, and down 0.8% compared to October 2011. The second graph shows the U.S. trade deficit, with and without petroleum, through October. The blue line is the total deficit, and the black line is the petroleum deficit, and the red line is the trade deficit ex-petroleum products. Oil averaged $99.75 in October, up from $98.88 per barrel in September. The trade deficit with China increased to $29.5 billion in October, up from $28.1 billion in October 2011. Most of the trade deficit is still due to oil and China.
U.S. Trade Deficit Increases 4.9%, China Trade Deficit at Record High for October 2012 - The U.S. October 2012 monthly trade deficit increased by 4.9%, $1.963 billion to $42.24 billion. The trade deficit with China hit an all time monthly record of -$29.466 billion. The year to date trade deficit with China is -$261.647 billion, which means the United States-China trade deficit will exceed the record 2011 annual trade deficit with China and be greater than 2011's 3.7% of GDP. October's U.S. exports declines -$6.815 billion or -3.8%. Imports decreased by -$4.852 billion, or -2.2%. The three month moving average gives a trade deficit of -$41.7 billion and a change of -$203 million, or 0.5% increase in the trade deficit over a span of three months. The U.S.-China goods trade deficit alone was, -$29.466 billion, or 45.6% of the total goods trade deficit and this ratio includes oil, our largest commodity import. The year to date tally of the goods trade deficit with China is -$261.647 billion, or 42.4% of the entire goods trade deficit to date. In October 2011, the China goods trade deficit up to that time was -$245.501 billion. This is a year to date increase of 6.6% in the goods trade deficit with China in comparison to 2011. The United States will have an over $300 billion trade deficit with China for 2012 as the 2009 November and December trade deficit with China was -$45.9 billion. Global trade collapsed in 2009. China's never ending import barrage is highly cyclical as one can see in the below graph of the not seasonally adjusted trade deficit with China and why we compare to this time last year in order to try to remove seasonality. The South Korea-U.S. trade deficit is quickly rising. From January to October 2012 we have a $13.637 billion trade deficit with Korea. The same time period for 2011 shows a $11.404 billion Korean trade deficit, a 19.6% increase. March 15, 2012, the South Korean NAFTA style trade deal went into effect. Below is a graph of the Korean goods trade deficit, not seasonally adjusted and also cyclical, in particularly the cyclical high point seems to be December. For comparison's sake, NAFTA went into effect January 1, 1994. Below is our goods trade deficit with Mexico, not seasonally adjusted. The 2012 January to October trade deficit with Mexico was $52.553 billion and it is 2.1 times larger than the trade deficit with Canada. Canada is the other country in NAFTA, yet have wage and environmental protections.
October US Exports Plunge By Most Since January 2009 As Trade Deficit With China Hits Record - The boost to GDP from the declining US trade deficit is over. While the September trade deficit number was revised further lower, to $40.3 billion from $41.5 previously, October saw a pick up to $42.2 billion, slightly less than the expected $42.7 billion, but a headwind to Q4 GDP already. As a result, expect a modest boost to Q3 GDP in its final revision, even as Q4 GDP continues to contract below its consensus of sub stall-speed ~1%. The reason for the decline: a 3.6% decline in exports of goods and services. This was the biggest percent drop in exports since January 2009 as the traditional US import partners are all wrapped in a major recession. What helped, however, was the offsetting drop in imports by 2.1%, the lowest since April 2011, as US businesses are likewise consumed by a concerns about the global economy. And without global trade, whose nexus just happens to be Europe, there can be no global or even regional recovery. So far, all hopes of a pick up in global economy have been largely dashed. Yet one country benefits from the ongoing US slump is China: imports from China - consisting primarily of computers and toys, games, and sporting goods- jumped 6.4% to a record $40.3 billion, offset be a modest rise in exports - primarily soybeans - to $10.8 billion, bring the China deficit to a record $29.5 billion from $29.1 billion in September. Of course, one wouldn't get that impression looking at the Chinese side of the ledger: the Chinese Customs department, reported a September and October trade surplus with the US amounting to $21.1 and $21.7 billion. One wonders, somewhat, where the over $16 billion difference has gone.
Chart Of The Day: US-China Trade Deficit Hits Record - The US Census Bureau reported that in October, the total deficit with China hit a record $29.5 billion. What did America need to export so much that it is willing to impair its GDP (net imports are a GDP drain) and boost the GDP of China? "Primarily computers and toys, games, and sporting goods." In other words, gizmos and iPhones. And no, China did not buy US bonds - recall that China has boycotted US Treasurys for precisely one year - so the age old equality that we export China worthless paper in exchange for just as worthless gizmos, yet somehow everyone benefits, is no longer valid. What the US does, however, export to China, is inflation, courtesy of the USDCNY peg, and is the reason why the PBOC is still terrified, and certainly will be after Bernanke announces QE4EVA (RIP QEternity) tomorrow, to ease more as the last thing it can afford is to create its own inflation in addition to importing America's.
Disappointing Trade Report, by Tim Duy: Today's international trade report confirms that sluggish global growth is taking a toll on the US economy. Exports are now barely up compared to last year:Calculated Risk notes the wider goods deficit with the Eurozone. I would add that this is clearly on the back of weaker exports (imports are up slightly). On the plus side, exports of services were up 4.3 percent, while goods exports were down slightly, a story consistent with the divergent ISM manufacturing and services surveys. Also note the negative year-over-year growth around 1998, the time of the Asian Financial Crisis, which means that even a significant external shock does not necessarily induce a US recession. That said, the softer external sector does leave the economy more vulnerable to negative internal shocks. In the late 1990's, the US experienced a positive internal shock, mitigating the impact of the Asian Financial Crisis. In the near-term, such a positive shock does not look as likely this time around. I take little comfort from the import data: Flat to negative numbers are typically consistent with recession as they reflect periods of negative domestic demand. We can't write off the slightly negative reading as simply a reflection of falling oil imports (down $625 million); non-petroleum imports (down $792 million) also fell slightly compared to a year ago. Unless the pace of import-substitution is happening very quickly, this data seems like something of a red flag. Something to be cautious of as we head into 2013.
Analysis: Both Imports and Exports Shrink - Wells Fargo Global Economist Jay Bryson talks with Jim Chesko about a report showing that the U.S. trade deficit widened by 4.9% in October to $42.24 billion as the deficit with China hit record levels.
Vital Signs Chart: Wider Trade Deficit - The U.S. trade deficit widened by 4.9% in October to $42.2 billion. During the month, the nation’s biggest decline in exports in almost four years offset a decrease in imports. The trade gap with China widened by 1.4% to a record $29.5 billion. The U.S. trade deficit with Japan jumped 45%, or $2.2 billion, to $7 billion as imports expanded and exports contracted.
Import Prices Decline - The cost of goods imported into the U.S. fell in November for the first time in four months, as softening petroleum prices are helping to reduce inflation pressures. Import prices decreased 0.9% last month from October, the Labor Department said Wednesday. Economists in a Dow Jones Newswires survey had expected import costs to decline 0.5% during November. The drop came after prices had risen 2.5% over the previous three months. In October prices rose 0.3%, according to downwardly revised figures.
Global Agricultural Machinery Sales are Strong - The Association of Equipment Manufacturers is reporting strong agricultural machinery equipment sales for 2012 as well as strong sales prospects for the coming year. This is due to current high commodity prices and increased production trends in both developed and developing countries. There were especially strong sales globally in tractors larger than 100 horsepower. Global tractor sales were running ten percent higher than a year earlier through October of this year. Combine sales had fallen by eight percent, however, presumably due to higher sales of combines during the past three years. The volume of agricultural machinery production this year is expected to total $110 billion, with expected growth of five percent next year. A press release earlier this year reported that global demand for agricultural equipment is expected to increase 6.7 percent per year through 2016 when it will reach $173.5 billion, and that the growth will be driven primarily through sales gains in China, Brazil, and India. Other markets in Thailand, Indonesia, and Argentina will also do well.
Solid Bounce in Industrial Production, by Tim Duy: Industrial production posted a solid gain in November, more than offsetting the Sandy-impacted October decline: This means that what had been the best clear top in a recession indicator is a lot less clear. A solid blow to ECRI Co-Founder Lakshman Achuthan's claim that the US slipped into recession in the middle of the year. I noticed this quote from Bloomberg: “There is this continued tug of war for manufacturing,” said Aneta Markowska, chief U.S. economist at Societe Generale in New York, who forecast a 1.2 percent gain in manufacturing output. “Consumer spending is still looking pretty good so that’s helping support production. On the other hand, business demand for things like capital equipment, machinery is pausing.” That vexing consumer spending question again - pretty good, on shaky grounds, or a pillar of strength? I would say the middle ground holds, as least on the basis of core retail spending in November: Of course, on a year-over-year basis, the deceleration from the earlier this year remains evident:
US Manufacturing Output Rises 1.1 Pct in November - U.S. factories rebounded in November from Superstorm Sandy, boosting production of cars, equipment and appliances. But after factoring out the impact from the storm, the broader trend in manufacturing remained weak. The Federal Reserve said Friday that factory output increased 1.1 percent in November from October. That offset a 1 percent decline in the previous, which was blamed on the storm. Auto production jumped 4.5 percent last month, the first increase since July. Production of primary metals, wood products, electrical equipment and appliances all showed gains. Total industrial output at factories, mines and utilities rose also rose 1.1 percent last month, after a 0.7 percent decline in October. Still, economists cautioned that the rebound in manufacturing was almost entirely related to Sandy. Sal Guatieri noted that when averaging data over October and November, industrial output and manufacturing both were up just 2.1 percent over the past year — less than half the growth rate from the start of the year.
Industrial Production increased 1.1% in November, Bounces back following Hurricane Sandy - From the Fed: Industrial production and Capacity Utilization Industrial production increased 1.1 percent in November after having fallen 0.7 percent in October. The gain in November is estimated to have largely resulted from a recovery in production for industries that had been negatively affected by Hurricane Sandy, which hit the Northeast region in late October. In November, manufacturing output increased 1.1 percent after having decreased 1.0 percent in October; in addition to the storm-related rebound, a sizable rise in the production of motor vehicles and parts boosted factory output in November. The output of utilities advanced 1.0 percent, and production at mines rose 0.8 percent. At 97.5 percent of its 2007 average, total industrial production in November was 2.5 percent above its year-earlier level. Capacity utilization for total industry increased 0.7 percentage point to 78.4 percent, a rate 1.9 percentage points below its long-run (1972--2011) average. This graph shows Capacity Utilization. This series is up 11.6 percentage points from the record low set in June 2009 (the series starts in 1967). Capacity utilization at 78.4% is still 1.9 percentage points below its average from 1972 to 2010 and below the pre-recession level of 80.6% in December 2007. The second graph shows industrial production since 1967. Industrial production increased in November to 97.5. This is 17% above the recession low, but still 3.2% below the pre-recession peak.
Industrial Production Rebounds Sharply In November - Industrial production mounted a surprisingly strong comeback last month. The 1.1% surge in the Fed's industrial production index—the biggest monthly gain in nearly two years—surprised many analysts, including yours truly. Surprising or not, it's clear that October's dreadful decline in this indicator (a decline that was revised further into the red in today's update) was a temporary setback rather than a sign that the trend was slipping over the edge. Indeed, the cyclically sensitive manufacturing component in today's report also registered a strong 1.1% increase in November. The strength of last month's rebound is almost certainly overstated due to the distorting effects of Hurricane Sandy, albeit for positive reasons this time. As the Federal Reserve notes in today's release: "The gain in November is estimated to have largely resulted from a recovery in production for industries that had been negatively affected by Hurricane Sandy, which hit the Northeast region in late October." Whatever the source of last month's rebound, the positive effects on the year-over-year trend is anything but subtle. Industrial production increased 2.5% for the year through November. That's a sharp turn higher from October's 1.6% annual gain. It's also one more reason for assuming that the broad economic profile for November 2012 will eventually be marked as one of growth generally in the macro history books.
Industrial Production Soars As Sandy Reignites Economy: QEnding? - In what must be one of the scariest data points for equity bulls, Industrial Production just printed above all economist's estimates with its largest rise since Dec 2010. This 2.5 sigma beat of expectations is the biggest beat since December 2010 and, given that it was data that Ben Bernanke did not have at his previous FOMC meeting, we suggest, ever so humbly, that surely this will play into his qualitative assessment of the economic thersholds and reduce the likelhood of him accelerating his bond-purchases scheme. The driver of such exuberant Industrial Production... Motor Vehicle manufacturing; which as we already know produced the largest channel-stuffing debacle in history. Sustainable? We don't think so... As previous downward revisions appear to have provided a much bigger than expected rebound from Sandy-scuppered prior levels.
US manufacturing stabilizing - In spite of some conflicting data coming out of the US manufacturing sector in November (see discussion), the Markit manufacturing PMI is consistently showing signs of gradual expansion. Econoday: - The first half of December has been very good for the nation's manufacturers based on the PMI flash index which rose to 54.2, up a solid 1.4 points from the final index for November. A reading over 50 indicates monthly growth in business activity and a reading over the prior reading indicates a greater rate of growth. Details are solid across the report led by monthly acceleration in new orders which are up 1.2 points to 54.8. A special highlight is the index for new export orders which, following a long streak under 50, first popped over the breakeven mark last month and is now at 52.8. This suggests that foreign demand is on the mend. Other readings include a strong and sustainable rate for output and -- in a special positive -- a strong and increasing rate of employment where the index is at 54.4. Inventory readings show slight destocking which is ideal for future output and employment. Price readings are heating up especially for inputs which is consistent with the overall increase in activity.
Factory Activity Seen Expanding in December - U.S. factory activity is expanding in December as output and new orders picked up pace, according to a report released Friday. The flash purchasing managers’ index compiled by data provider Markit for this month rose to 54.2 from 52.8 in November. Markit said December’s reading brings the index to an eight-month high. A reading above 50 means expansion. The report characterized the sector as showing “solid improvement,” and an upgrade from last month’s “moderate” description.
Purchasing Managers See Further Expansion in 2013 - Purchasing managers in both the factory and nonmanufacturing sectors expect revenue, jobs and capital spending to increase in 2013, according to surveys released Tuesday by the Institute for Supply Management. “Economic growth in the United States will continue in 2013,” says the ISM’s semiannual outlook for the manufacturing and nonmanufacturing sectors. However, respondents in both sectors are somewhat less optimistic about 2013 than they were heading into 2012, owing to worries about weak demand and future government regulations, the ISM said.
Cautionary Details on U.S. Manufacturing Productivity - There's a basic and often-told story about output and employment in the U.S. manufacturing sector: I'm sure I've told it a time or two myself. The story begins by pointing out that the total quantity of U.S. manufacturing output has actually held up fairly well over recent decades, although it hasn't grown as quickly as the services sector. However However, manufacturing productivity has been rising quickly enough that, even though manufacturing output has remained fairly strong, the number of jobs has been falling. The standard historical analogy is that just as rising agricultural productivity meant that fewer U.S. farmers were needed, now rising manufacturing productivity means that fewer manufacturing workers are needed. That story isn't exactly wrong, at least not over the long-run, but Susan Houseman has been digging down into the details and finding arguments which suggests that it is a seriously incomplete version of what's happening in the U.S. manufacturing sector. Houseman presented some of these arguments in a paper called "Offshoring Bias in U.S. Manufacturing," which appeared in the Spring 2011 issue of my own Journal of Economic Perspectives. In turn, their JEP paper was a revision of a more detailed Federal Reserve working paper in 2010, available here. However, Houseman offers a nice overview of her arguments in an interview recently published in fedgazette, a publication of the Federal Reserve Bank of Minneapolis. ...
Small business owners are very, very worried right now - A terrible read from the National Federation of Independent Business. Its Small Business Optimism Index, which fell 5.6 points to 87.5 in November. The NFIB: Something bad happened in November—and based on the NFIB survey data, it wasn’t merely Hurricane Sandy. The storm had a significant impact on the economy, no doubt, but it is very clear that a stunning number of owners who expect worse business conditions in six months had far more to do with the decline in small-business confidence. Nearly half of owners are now certain that things will be worse next year than they are now. Washington does not have the needs of small business in mind. And here is a bit of IHS Global Insight’s take: Surprisingly, the percentage of owners planning to hire rose 1 point to 5%, the highest level since August. This is a shining star in the report, but one should resist excitement as it is still at a historically low level.The example of the political bickering and gridlock that defined the debt ceiling debacle would surely dampen sentiment and hope for a positive outcome of the fiscal cliff debate. Uncertainty will keep small business owners cautious and a lid on any significant improvements to optimism moving into December.
Small Business Sentiment: Tenth Lowest Reading in This Series - The latest issue of the NFIB Small Business Economic Trends is out today (see report). The December update for November came in at 87.5. This is the tenth lowest reading in history of this series. Here is the opening summary of the report: The NFIB Small Business Optimism Index dropped 5.6 points in November, bottoming out at 87.5. The two major events in November were the national elections and Hurricane Sandy, which devastated parts of the East Coast. To disentangle these, the results for the states impacted by Sandy were excluded from the computation for comparison. When separating the hurricane-impacted states from the remainder, the data makes clear that the election was the primary cause of the decline in owner optimism. "Something bad happened in November—and based on the NFIB survey data, it wasn't merely Hurricane Sandy. Nearly half of owners are now certain that things will be worse next year than they are now. Washington does not have the needs of small business in mind. Between the looming 'fiscal cliff,' the promise of higher healthcare costs and the endless onslaught of new regulations, owners have found themselves in a state of pessimism. The first chart below highlights the 1986 baseline level of 100 and includes some labels to help us visualize that dramatic change in small-business sentiment that accompanied the Great Financial Crisis. Compare, for example the relative resilience of the index during the 2000-2003 collapse of the Tech Bubble with the far weaker readings of the past three years. The NBER declared June 2009 as the official end of the last recession.
Small-Business Optimism Plunges - The Small Business Optimism Index is starting to look misnamed. The index, reported monthly by the National Federation of Independent Business, had one of the steepest declines in its history in November, and is now at one of its lowest readings ever. The industry group has reported a lower index value only seven times since it began conducting monthly surveys in 1986. Businesses, it seems, are about as optimistic today as they are during the typical recession. Hurricane Sandy did not seem to have driven the decline in optimism, either, given that the survey did not show much difference between sentiment at businesses in states hit by Sandy and those in states it spared.The big drag on overall optimism came from small businesses’ view of the future. In October, businesses were slightly more likely to say that they expected business conditions to improve in the next six months than they were to say that conditions would worsen. But by November, the outlook darkened substantially. The net percentage of business owners saying they expected better conditions — that is, the share saying they expect improvement minus the share saying they expect deterioration — was negative 35 percent.
Small business sentiment declines again; election results blamed - NFIB small business sentiment fell to another 2-year low in November. Some have argued that the index (which Tom Keene of Bloomberg Surveillance calls the "Pessimism Index") is not grounded in reality, representing small businesses complaining about this or that. The data however reveals that in 2012, small businesses are indeed struggling. The chart below shows a sharp decline in earnings recently. According to NFIB, the drop in sentiment in November was also driven (in fact to a great extent) by the results of the last elections. Add to that the unease about healthcare costs as well as the uncertainty over taxes - and we are looking at a period of stagnant growth, low investment, and anemic hiring among America's small businesses.
So Much For "Confidence" - NFIB Small Business Outlook Drops To Record Low - While Europe's confidence-inspired rally is floating all global boats in some magical unicorn-inspired way, the reality is that on the ground in the US, things have never looked worse. The NFIB Small Business Outlook for general business conditions had its own 'cliff' this month and plunged to -35% - its worst level on record - as the creators-of-jobs seem a little less than inspired. Aside from this unbelievably ugly bottom-up situation, top-down is starting to be worrisome also. In a rather shockingly accurate analog, this year's macro surprise positivity has tracked last year's almost perfectly (which means the macro data and analyst expectations have interacted in an almost identical manner for six months). The concerning aspect is that this marked the topping process in last year's macro data as expectations of continued recovery were dashed in a sea of reality (both coinciding with large 'surprise' beats of NFP). We suspect, given the NFIB data, that jobs will not be quite so plentiful (unadjusted for BLS purposes) the next time we get a glimpse.
Small businesses: Obama worse than Lehman collapse - Do small-business owners really fear that the re-election of President Barack Obama is worse for their businesses than the collapse of Lehman Brothers? A survey released Tuesday by the National Federation of Independent Business suggested as much. Not only did small-business sentiment plunge, but the net percentage of owners expecting better business conditions in six months fell 37 points. . To put that in perspective, the drop in expected business conditions fell only 18 points between September and October 2008 — as Lehman Brothers collapsed. That seems a bit extreme, and it suggests the small-business owners might not necessarily make good economists. Using the Commerce Department’s gross-domestic-product data, output dropped by about 4% in the six months after Lehman’s collapse. By contrast, Obama has overseen growth — middling growth, to be sure, but growth nonetheless. The nation’s economy is up by about 7% from the quarter when Obama took office.
The Deeper Secrets of the NFIB - Much ado is being made about the drop in the NFIB small business optimism index. While interesting, this index is just one part of the larger NFIB Small Business Economic Trends survey that contains a trove of other information. In fact, a little digging into this survey can shed some light on the nature of the ongoing economic slump. This is because the survey asks firms what specific developments they see as the "single most important problem" they face. This question, in my view, is the more important than the news-making small business optimism index because it tells us why firms feel more or less optimistic. Knowing this information better informs what the appropriate policy response should be to the ongoing slump. Unfortunately, it rarely makes the headlines. This post is an attempt to correct this shortcoming. So what does this survey show for this question? There are a number of answers from which firms can chose. Below is a graph that shows some of their responses. Other responses included concerns about inflation, financing costs, insurance availability, and the threat of competition. They were not viewed by firms as being very important. The concerns with the highest scores are shown in the above figure: lack of sales, taxes, and regulation. Over the past four years, lack of sales has been the most vexing problem for firms. Taxes have always been relatively high, while concerns about regulation have grown more important over this period. So what does this tell us about the nature of the ongoing slump? The figure indicates that a lack of sales, independent of concerns about regulation and taxes, has been the biggest fear for small firms up until recently. If so, one would expect (given sticky wages and prices) firms would cut back on production and employ fewer workers as result of the expected weak sales. Is there anyway to corroborate this view?
Small Business Owners Cut Capital Expenditures, Plan to Cut Even More - According to the latest Gallup survey, Small-Business Owners Pull Back Capital Spending Plans. Moreover, net capital spending by small businesses declined over the last year as well. Here is the question Gallup asked "Over the next 12 months, do you expect the amount of money your company allocates for capital spending -- such as computers, machinery, facilities, or other long-term investments -- to increase a lot, increase a little, stay the same, decrease a little, or decrease a lot?" U.S. small-business owners' net capital spending intentions for the next 12 months plunged to -14 in November, the lowest level in more than two years, according to the Wells Fargo/Gallup Small Business Index. This is down from net capital spending intentions of -1 in July and suggests the nation's small-business owners are likely to pull back on their business investments even more, given their negative expectations for the next 12 months. The -14 November score is based on 20% of small-business owners saying they expect to increase their capital spending over the next 12 months and 34% saying expecting to decrease their capital spending. The 20% "increase" reading is down from 23% in July and the lowest level since July 2010. The 34% "decrease" reading is the highest since July 2010. In the current survey, 45% of owners expect no change in their capital spending.
Employment Index Little Changed in November - A compilation of U.S. labor indicators was little changed in November, according to a report released Monday by the Conference Board. The board said its November employment trends index fell a small 0.02% to 107.82 from a revised 107.84 in October, first reported as 108.16. The latest index is up 3.3% from a year ago. The weak reading of the index suggests employment growth is likely to slow in coming months, the report said. “Employment growth typically lags economic growth, and with the economy expected to decelerate in the current quarter and early 2013, a slowdown in employment won’t be far behind,” said Gad Levanon, director of macroeconomic research at the board.
Survey: CEOs Still Cautious on 2013 Hiring - U.S. corporate leaders remain cautious on hiring and investment expectations, but are slightly more optimistic about economic growth next year, according to the Business Roundtable‘s latest chief-executive survey released Wednesday. With uncertainly around pending tax increases and government spending cuts still looming, most CEOs said they wouldn’t increase hiring or capital spending in the next six months, but they did boost their forecast for 2013 gross domestic product growth to 2.0%, from a 1.9% projection in the third-quarter survey. “The continued softness in quarterly sentiment reflects deep uncertainty about the future overall economic climate, realities of a slow-growing economy and frustration over Washington’s inability to resolve looming ‘fiscal cliff’ issues,” said Boeing Co. CEO Jim McNerney, who is the chairman of the Business Roundtable.
Lowest Unemployment Rate Since Obama Took Office? - A lot of pundits this weekend were calling the latest news from the BLS as good news. Yes – the payroll survey showed a modest increase in employment but the household survey suggested a decline. But then the pundits also note the decline in the unemployment rate to 7.7%, which is lower than the 7.8% rate observed for January 2009. But is that really good news? No because the employment to population ratio fell last month with the decline in the unemployment rate coming from a larger drop in the labor force participation rate. It is true that the employment to population ratio has had a bumpy ride increasing from its low of 58.2% during the middle of 2011. While the unemployment rate has showed a more impressive decline, a fair amount of that decline over the past 18 months has been from a decline in the labor force participation rate. Furthermore, our graph shows just how far both series have declined on net since President Obama took office. To be fair, Obama inherited an economy in free fall and the economy has been recovering slowly since the Great Recession ended. But let’s stop cheerleading how great the labor market is and it is still awful. Which is all the more reason to pursue fiscal stimulus not rather than allowing this “fiscal cliff” to occur.
Jobs truthers’ latest myth: Government doing all the hiring - Have you heard the news? While us workaday job-creating CEOs are about to get hit by Obama’s tax hike on the wealthiest 2 percent, those fat-cat municipal sanitation workers and public schoolteachers are adding to their ranks at an alarming rate. According to the latest meme ricocheting around the conservative blogosphere and Fox News, almost three-quarters of the new jobs created in the past five months have been government jobs.The figure, first reported Friday by the social conservative news website CNS.com, has immediatly gained traction on the right. It hits all the right buttons of demonstrating out-of-control government spending while exposing the sham that is the supposedly improving economy. And it does it all in a nifty little eye-popping statistic: First there was the 1 percent, then the 53 percent, followed by the 47 percent, now we have the 73 percent. Other sites quickly joined in. The one problem is that it’s total baloney, but we’ll get to that in a second. In fact, government workers have been hit the hardest during the recession, especially on the state and local level, where requirements to balance the budget every year have led to massive layoffs that have been a drag on the economy and even private sector jobs. Here’s what the situation actually looks like, with public sector numbers in blue and private sector numbers in red (the spike is from hiring related to the census and the stimulus package):
Labor Force Participation Rate Update - I've written extensively about the participation rate, see: Understanding the Decline in the Participation Rate and Further Discussion on Labor Force Participation Rate. A key point: The recent decline in the participation rate was expected, and most of the decline in the participation rate was due to changing demographics, as opposed to economic weakness. Here is an update to a few graphs I've posted before. Tracking the participation rate for various age groups monthly is a little like watching grass grow, but the trends are important. Here is a repeat of the graph I posted Friday showing the participation rate and employment-to-population ratio. The Labor Force Participation Rate decreased to 63.6% in November (blue line. This is the percentage of the working age population in the labor force. Here is a look at some of the long term trends (updating graphs through November 2012): This graph shows the changes in the participation rates for men and women since 1960 (in the 25 to 54 age group - the prime working years). The participation rate for women increased significantly from the mid 30s to the mid 70s and has mostly flattened out. The participation rate for women was unchanged in November at 74.7%. The participation rate for men decreased from the high 90s decades ago, to 88.2% in November 2012. This is the lowest level recorded for prime working age men. This graph shows that participation rates for several key age groups.
Boomer Demographics and the Unemployment Rate - A week ago in Startling Look at Job Demographics by Age I posted the following chart made with data that I downloaded from the St. Louis Fed.One person suggested the chart was "very misleading" because it did not properly reflect the aging workforce. However, I did comment at the time 'Boomer demographics certainly explains "some" of this trend'. I could not quantify the amount at the time because there was no civilian population data on the St. Louis Fed website (at least that I could find). Since then, I asked my friend Tim Wallace to see what he could come up with, and with a few calls to the BLS he did get the population data from which we could make more accurate assessments. Here are the key comparisons; 2007 vs. Now for Age Group 25-54:
- In 2007, the Civilian Noninstitutional Population for age group 25-54 was 125,978,000
- Currently the Civilian Noninstitutional Population for age group 25-54 is 24,248,000
- In 2007, Employment in age group 25-54 was 101,083,000
- Currently, Employment in age group 25-54 is 94,523,000
- Since 2007, the Civilian Noninstitutional Population for age 25-54 declined by 1,730,000
- Since 2007, Civilian Employment declined by 6,560,000
U.S. Unadjusted Unemployment Shoots Back Up -U.S. unemployment, as measured by Gallup without seasonal adjustment, was 7.8% for the month of November, up significantly from 7.0% for October. Gallup's seasonally adjusted unemployment rate is 8.3%, nearly a one-point increase over October's rate. Underemployment, as measured without seasonal adjustment, was 17.2% in November, a 1.3-point increase since the end of October. The uptick in November also puts an end to the six-month trend of improvements or no change. Still, underemployment has improved 0.9 points since November 2011. Gallup's U.S. underemployment measure combines the percentage who are unemployed with the percentage of those working part time but looking for full-time work. Gallup does not apply a seasonal adjustment to underemployment. The increase in underemployment is the result of an increase in the number of people unemployed as well as the number of people working part time but wanting full time work, which rose to 9.4% in November from 8.9% in October. The number of workers wanting full-time positions generally increases during the holiday season as more people take on part-time seasonal work. Compared with this time last year, the percentage of workers desiring additional work is down a modest three-tenths of a point.
U.S. Jobs Five Years After Their Peak -We're going to look at the change in the U.S. employment situation since the total level of employment in the U.S. peaked five years ago in November 2007, but first, let's look at the change since October 2012. Through November 2012, the U.S. employment situation for young adults Age 20-24 was good, for all older adults it was bad, and for teens, it was "meh". Overall, some 6,000 more teens and 62,000 young adults than in October 2012 gained jobs, while some 190,000 fewer individuals Age 25 and older were counted as being employed. Doing the math, the net change in the number of jobs in the month from October 2012 to November 2012 came in for a loss of 122,000. The total number of employed Americans fell by that number to 143,262,000 in November 2012, which is 3,333,000 less than the so-far all-time peak number of of 146,595,000 Americans who were counted as having jobs in November 2007. The number of employed teens in the U.S. has declined from 5,927,000 in that month to 4,479,000 some five years later. Over this period of time, the number of young adults Age 20-24 with jobs has fallen by 405,000 from 14,001,000 to 13,596,000 and the number of older adults has fallen by 1,480,000 from 126,667,000 to 125,187,000.
Have We Seen The Peak Of Employment? - Last week we noted: "...when taking into account the recent slate of economic weakness, post-election we are likely to see many of the recent job gains revised away as the data aligns itself with overall economic activity...." Since that time jobless claims did indeed rise, and with the release of the November jobs report, we saw the previous two month's gains in employment revised down by a total of 49,000. What is important to remember is that the BLS only publishes revisions to the prior two months even though it has data for months prior. This is why the annual revisions to the employment data can be significant. Furthermore, given the weakness in the employment components of the major economic surveys, as shown by the composite employment index, we should expect to see negative revisions to the 2012 data employment data next year. While it is too early to say that employment has peaked for this current recovery cycle - there is mounting evidence that this may indeed be the case.
Job Openings in U.S. Rose in October to Four-Month High - Job openings in the U.S. rose to a four-month high in October, showing companies kept expanding in the face of looming tax increases and budget cuts. The number of positions waiting to be filled rose by 128,000 to 3.68 million from the prior month, the Labor Department said today in Washington. The trade deficit widened as exports slumped the most in four years, other figures showed. More openings lay the groundwork for the accelerated job growth needed to bolster consumer spending, which accounts for about 70 percent of the economy. Employment gains so far have failed to satisfy Federal Reserve policy makers, who are meeting today and tomorrow to consider further easing to spur the economy. “The labor market is healing gradually,”
BLS: Job Openings "little changed" in October - From the BLS: Job Openings and Labor Turnover Summary The number of job openings in October was 3.7 million, essentially unchanged from September....The level of total nonfarm job openings in October was up from 2.4 million at the end of the recession in June 2009....In October, the quits rate was unchanged for total nonfarm and total private, and little changed for government. The number of quits was 2.1 million in October compared to 1.8 million at the end of the recession in June 2009.The following graph shows job openings (yellow line), hires (dark blue), Layoff, Discharges and other (red column), and Quits (light blue column) from the JOLTS. Notice that hires (dark blue) and total separations (red and light blue columns stacked) are pretty close each month. This is a measure of turnover. When the blue line is above the two stacked columns, the economy is adding net jobs - when it is below the columns, the economy is losing jobs. Jobs openings increased in October to 3.675 million, up from 3.547 million in September. The number of job openings (yellow) has generally been trending up, and openings are up about 8% year-over-year compared to October 2011. Quits increased in October, and quits are up 4% year-over-year. These are voluntary separations. (see light blue columns at bottom of graph for trend for "quits").
Weekly U.S. Jobless Aid Applications Drop to 343K — The number of Americans seeking unemployment benefits fell sharply for a fourth straight week, a sign that the job market may be improving.The Labor Department says weekly applications for unemployment benefits fell 29,000 last week to a seasonally adjusted 343,000, the lowest in two months. It is the second-lowest total this year.Applications are a proxy for layoffs, so the drop indicates that companies are cutting fewer jobs. But employers also need to step up hiring to rapidly push down the unemployment rate.Applications spiked five weeks ago because of Superstorm Sandy. The storm’s impact has now faded. The four-week average, a less volatile measure, fell 27,000 to 381,500.
Weekly Initial Unemployment Claims decline to 343,000 - The DOL reports: In the week ending December 8, the advance figure for seasonally adjusted initial claims was 343,000, a decrease of 29,000 from the previous week's revised figure of 372,000. The 4-week moving average was 381,500, a decrease of 27,000 from the previous week's revised average of 408,500. The previous week was revised up from 370,000. The following graph shows the 4-week moving average of weekly claims since January 2000.The dashed line on the graph is the current 4-week average. The four-week average of weekly unemployment claims declined to 381,500. The recent sharp increase in the 4 week average was due to Hurricane Sandy as claims increased significantly in NY, NJ and other impacted areas. Now, as expected, the 4-week average is almost back to the pre-storm level. Weekly claims were lower than the 370,000 consensus forecast. And here is a long term graph of weekly claims:
Weekly Unemployment Claims at 343K: Much Lower Than Expected - The Unemployment Insurance Weekly Claims Report was released this morning for last week. The 343,000 new claims number was a 29,000 decrease from a 2,000 upward adjustment of the previous week. The impact of Sandy has disappeared from the weekly data. The less volatile and closely watched four-week moving average, which is usually a better indicator of the recent trend, fell to 381,500. Despite the decline in the four-week MA, it continues to show a diminishing upward skew from Sandy and will continue to do so for the next two weeks. Here is the official statement from the Department of Labor: In the week ending December 8, the advance figure for seasonally adjusted initial claims was 343,000, a decrease of 29,000 from the previous week's revised figure of 372,000. The 4-week moving average was 381,500, a decrease of 27,000 from the previous week's revised average of 408,500. The advance seasonally adjusted insured unemployment rate was 2.5 percent for the week ending December 1, unchanged from the prior week's unrevised rate. The advance number for seasonally adjusted insured unemployment during the week ending December 1 was 3,198,000, a decrease of 23,000 from the preceding week's revised level of 3,221,000. The 4-week moving average was 3,270,750, a decrease of 42,250 from the preceding week's revised average of 3,313,000. Today's seasonally adjusted number was well below the Briefing.com consensus estimate of 375K. Here is a close look at the data over the past few years (with a callout for 2012), which gives a clearer sense of the overall trend in relation to the last recession and the trend in recent weeks.
Modest Job Growth, Less Take-Home Pay Is Recipe for Depressed Consumer -Worries about the consumer outlook are elevated. First, despite a surprise pop in November, hiring is not accelerating at the end of 2012. Second, consumers are more pessimistic about the future as households realize they likely face higher tax bills next year. Modest job growth and less take-home pay won’t support substantial increases in consumer spending. At first glance, the November job gain of 146,000 was a positive surprise. Economists had expected only an 80,000 increase because of Sandy, but the Labor Department said the superstorm had little impact. But labor demand isn’t as strong as the November number suggests. That’s because Labor also revised down hiring in September and October. Job growth over the past three months averaged 139,000 per month. That’s below the 157,000 average of the past year, and is only fast enough to hold the unemployment rate steady or to reduce it very gradually. (The unemployment rate dropped to 7.7% last month only because more Americans dropped out of the labor force, not because more job seekers found work.)
Offshoring and Directed Technical Change - That will have been one of the most important papers of this year and it is by Daron Acemoglu, Gino Gancia, and Fabrizio Zilibotti. Read every sentence of the abstract carefully because each one matters!: To study the short-run and long-run implications on wage inequality, we introduce directed technical change into a Ricardian model of offshoring. A unique final good is produced by combining a skilled and an unskilled product, each produced from a continuum of intermediates (tasks). Some of these tasks can be transferred from a skill-abundant West to a skill-scarce East. Profit maximization determines both the extent of offshoring and technological progress. Offshoring induces skill-biased technical change because it increases the relative price of skill intensive products and induces technical change favoring unskilled workers because it expands the market size for technologies complementing unskilled labor. In the empirically more relevant case, starting from low levels, an increase in offshoring opportunities triggers a transition with falling real wages for unskilled workers in the West, skill-biased technical change and rising skill premia worldwide. However, when the extent of offshoring becomes sufficiently large, further increases in offshoring induce technical change now biased in favor of unskilled labor because offshoring closes the gap between unskilled wages in the West and the East, thus limiting the power of the price effect fueling skill-biased technical change. The unequalizing impact of offshoring is thus greatest at the beginning. Transitional dynamics reveal that offshoring and technical change are substitutes in the short run but complements in the long run. Finally, though offshoring improves the welfare of workers in the East, it may benefit or harm unskilled workers in the West depending on elasticities and the equilibrium growth rate.
Jobs, Productivity and the Great Decoupling - For several decades after World War II ... G.D.P. grew, and so did productivity... At the same time, we created millions of jobs, and many of these were the kinds of jobs that allowed the average American worker, who didn’t (and still doesn’t) have a college degree, to enjoy a high and rising standard of living. But as shown by the accompanying graph, which was first drawn by the economist Jared Bernstein, productivity growth and employment growth started to become decoupled from each other at the end of that decade. Bernstein calls the gap that’s opened up “the jaws of the snake.” They show no signs of closing. ... Wages as a share of G.D.P. are now at an all-time low, even as corporate profits are at an all-time high. The implicit bargain that gave workers a steady share of the productivity gains has unraveled. What’s going on? ... There are several explanations, including tax and policy changes and the effects of globalization and off-shoring. We agree that these matter but want to stress another driver of the “Great Decoupling” — the changing nature of technological progress. The Great Decoupling is not going to reverse course... And this should be great news for society. Digital progress lowers prices, improves quality, and brings us into a world where abundance becomes the norm. But there is no economic law that says digital progress will benefit everyone evenly. ... Designing a healthy society to go along with such an economy will be the great challenge, and the great opportunity, of the next generation. ...
Full Employment as the New Progressive Paradigm - Right now, Democrats and Republicans in Washington are arguing over which forms and degrees of austerity to impose on us as the penalty we must pay to avoid the even larger smack we will be given if the terms of the Budget Control Act of 2011 – the “fiscal cliff” act – take effect at the end of the year. This act was the bi-partisan gift of fiscal pain passed last summer when Congress and the White House could not agree on the appropriate form of torture to inflict on Americans as our punishment for daring to run large countercyclical deficits in our federal budget during an economic collapse. Their solution was to agree on a joint homicide pact full of doubled-down, double torture – with an agreement to renew the negotiation later after the election. As the argument goes forward, progressives are reminded that we now live in a two-party country that possesses only a conservative party and a reactionary party, and that the defeat of the reactionary party is not so much a cause for celebration as the renewal of the demolition contract for the less brawny of two wrecking crews. The fact is that the progressive movement in America, at least so far as electoral politics goes, was bumped over the political cliff long ago and is barely hanging on by its fingernails at the edge of the precipice. Ambitious progressive dreams of social transformation have now been replaced almost entirely by scrambling, draining efforts just to slow down the pace at which the plutocracy takes the gains of the past away from us.
Rise of the Robots - Paul Krugman - Catherine Rampell and Nick Wingfield write about the growing evidence for “reshoring” of manufacturing to the United States. They cite several reasons: rising wages in Asia; lower energy costs here; higher transportation costs. In a followup piece, however, Rampell cites another factor: robots. The most valuable part of each computer, a motherboard loaded with microprocessors and memory, is already largely made with robots, according to my colleague Quentin Hardy. People do things like fitting in batteries and snapping on screens. As more robots are built, largely by other robots, “assembly can be done here as well as anywhere else,” said Rob Enderle, an analyst based in San Jose, Calif., who has been following the computer electronics industry for a quarter-century. “That will replace most of the workers, though you will need a few people to manage the robots.” Robots mean that labor costs don’t matter much, so you might as well locate in advanced countries with large markets and good infrastructure (which may soon not include us, but that’s another issue). On the other hand, it’s not good news for workers!
Many types of tech, not just robots - Many types of tech - not just robots - have been affecting and are going to affect the service sector. When someone develops an inexpensive sign you can stick on top of television sets, racks of clothes, or appliances that will change itself whenever someone in the headquarters decides to change the price of the product, its going to eliminate entire departments of people (or move them to doing something else), plus reduce the workload at every retail store in the system. (The normal cadence for us is to enter prices more than a week before they take effect. We do have over-rides that allow the process to take place in 24 hours, but the amount of work needed to reduce errors in that process is mind-boggling, not to mention wasteful given it results in hard printing of the wrong signs as well as the right signs.) As of yet, I'm not sure automation reduced white collar work. What it has done is created a race to efficiency. Now companies scrape competitor data. They analyze prices to try to determine which generate highest margins. They analyze floor plans for the same purpose. I cannot imagine that being done 10 years ago - both in my previous life as a consultant, and my current life working for a major retailer, we can barely get the data systems to provide the data for those types of analysis properly now. Ten years ago it would have been impossible anywhere outside the military. Ten years from now, data pulls that I need an analyst to spend a week and a half doing, and then another week and a half cleaning, will be spit out in minutes (I hope). That analyst won't be pulling data and organizing it - I'll have her doing analysis instead. Margins will be even tighter because all our competitors will be doing the same analysis, without which nobody survives.
Krugman Ponders the Fallen State of US Labor - Yves Smith - Paul Krugman is troubled by this chart from the Bureau of Labor Statistics and is looking for explanations: It’s another way to illustrate that corporations are producing record profits while unemployment is still high and workers get an unprecedented small share of GDP growth. But it also shows the story about the prospects for workers would have been seen as very different during the Internet bubble. The long term trend would have looked flattish, and the uptick in worker share would have been consistent with all the hype about the Web ushering in a golden era for “freeters” and small businesses, that it would allow for rapid identification of and contracting with small firms, reducing the advantage of big, integrated players (yours truly thought that theory was bunk, but people believed a lot of crazy stuff in those years). The chart is particularly useful in identifying that a shift took place after the dot com era and has accelerated. Krugman suggests two three culprits, with the first two suggested by Nick Rowe robots and (which rdan at Angry Bear argues should be thought of as technology generally) land taking being miscategorized as income to capital. The third comes from Barry Lynn and Philip Longman, who’ve described how numerous industries have become more concentrated, increasing their leverage over suppliers and workers. Krugman finds the monopoly story more compelling:
Krugman: The New Luddite - I know, I post too often on Krugman's musings in the New York Times. However, I could not resist the later missive from Krugman regarding automation (robots, and I presume he also means software that automates tasks currently performed by humans, but that is a guess): If this is the wave of the future, it makes nonsense of just about all the conventional wisdom on reducing inequality. Better education won’t do much to reduce inequality if the big rewards simply go to those with the most assets. Creating an “opportunity society” won’t do much if the most important asset you can have in life is, well, lots of assets inherited from your parents. And so on. I think our eyes have been averted from the capital/labor dimension of inequality, for several reasons. It didn’t seem crucial back in the 1990s, and not enough people (me included!) have looked up to notice that things have changed. It has echoes of old-fashioned Marxism — which shouldn’t be a reason to ignore facts, but too often is. And it has really uncomfortable implications.But I think we’d better start paying attention to those implications.Welcome to the new Luddite approach to the improvement of the human condition. The robots will move wealth to the holders of capital from the workers.....and that is bad for us all. And what, might I ask, does he think happened in the industrial revolution? The hand loom weavers were put out of business due to automation. It was one of the heralds of the greatest changes in the history of mankind, and one from which we all now benefit. The industrial revolution was, in some respects, a painful process, but also served to create the potential for the huge benefits that we now enjoy.
Robots, capital-biased technological change and inequality - Bruegel - What started as a discussion about the rise of automation in manufacturing – and its potential impact on “re-shoring” manufacturing to the U.S. by some firms – has turned into a broader discussion about the impact of capital-biased technological change on the future of jobs and inequality. The discussion also touches on the role of increasing mark-ups in the shift in income away from labor. In his NYT column, Paul Krugman (HT Mark Thoma) writes that skill bias may be yesterday’s story. The wage gap between workers with a college education and those without, which grew a lot in the 1980s and early 1990s, hasn’t changed much since then (see here). Indeed, recent college graduates had stagnant incomes even before the financial crisis struck. Paul Krugman writes twenty years ago, when he was writing about globalization and inequality, capital bias didn’t look like a big issue. But, in fact, profits have been rising at the expense of workers in general, including workers with the skills that were supposed to lead to success in today’s economy. What has happened is a notable shift in income away from labor. Econfuture (HT Angry Bear) writes that manufacturing in the U.S. has become dramatically more productive and requires fewer workers. If technology is the primary driver behind the decline in manufacturing employment, then employment in China must inevitably follow the same path. In fact, there are good reasons to believe that manufacturing employment’s downward slope will be significantly steeper for China. The U.S. had to invent the technology to make manufacturing more productive, while in many cases China only needs to import it from more developed nations.
Technology and Wages, the Analytics (Wonkish) - Paul Krugman - Obviously I’m getting a lot of reaction to my stuff on robots and all that. (My copy editor, last night: “Thank God, it’s not about the fiscal cliff!”) My sense is, however, that a lot of the reaction, both positive and negative, involves misunderstanding the economic logic, with some readers believing that technological progress can never hurt workers, others believing that rapid productivity growth always hurts workers; neither is true. So here’s an attempt to explain what’s going on in the theory; cognoscenti will recognize it as nothing more than an exposition of J.R, Hicks’s analysis of the whole thing in his 1932 Theory of Wages (pdf). Start with the notion of an aggregate production function, which relates economy-wide output to economy-wide inputs of capital and labor. Yes, that sort of aggregation does violence to the complexity of reality. So? Furthermore, for current purposes, hold the quantity of capital fixed and show how output varies with the quantity of labor. We expect the relationship to look like the lower curve in this figure (we’ll get to the upper curves in a minute):
Human Versus Physical Capital - Krugman: One more entry in the robots and all that discussion, just to stress how much recent trends require a new storyline. Our discourse on inequality has been dominated for decades by issues of education and talent — and for what were good reasons at the time. There was a big increase in the college premium in the 1980s and to some extent in the 1990s — but since then, not so much. From EPI: Meanwhile, the people at BLS have sent me an update of their labor share calculations: So the story has totally shifted; if you want to understand what’s happening to income distribution in the 21st century economy, you need to stop talking so much about skills, and start talking much more about profits and who owns the capital. Mea culpa: I myself didn’t grasp this until recently. But it’s really crucial.
Automation is making unions irrelevant - The attack on unions in Michigan, say critics, is directed at undermining unions and their political contributions to Democrats. The proponents of right-to-work legislation say it will make Michigan more competitive and business friendly. Well, no, not really. Michigan is already business friendly. In a report this month, the Bay Area Council Economic Institute, ranked Michigan third among states in high-tech employment growth from 2010-2011. It had 6.9% growth, putting its high-tech population at 167,000 jobs. By comparison, California has just over 1 million tech jobs, New York, 340,000, and Massachusetts, 265,000. How does right-to-work legislation help tech job growth? It doesn’t. The tech industry isn’t unionized. The real problem for Michigan's manufacturing workers is automation. Amazon, for instance, spent $775 million this year to acquire a company, Kiva Systems, that makes robots used in warehouses. Automation will replace warehouse workers and even retail workers. In time, Google’s driverless cars will replace drivers in the trucking industry. It’s a given that manufacturing facilities, already highly automated, will become completely robotic.
Production of Robots by means of Robots. - Nick Rowe - (Sorry about the title. The devil made me write it.) What are we afraid of? Let's think about the worst-case, nightmare scenario for the distribution of income.Assume that all capital is robots, and robots are perfect substitutes for human workers. One robot can produce everything and anything one human worker can produce. And that includes producing more robots. And assume that every year the technology of robot production improves, so that it takes less and less time for one robot to produce another robot. That sounds nightmarish, right? Because robots will get cheaper and cheaper, and drive down human wages? Well, no. They won't. Or rather, it all depends. It depends on whether we add other forms of capital, or land, to the model. Let's start out by ignoring land. And the only form of capital is robots. You can produce everything with just human or robot labour.
Of Servants and Robots - When I read about some of the arguments regarding robots replacing people, and creating more unemployment, I shake my head and say to myself, “Nobody studies history.” Most of human history has had a surfeit of people versus those that controlled capital and resources. What did the excess people do (those that lacked resources and were unskilled)? They became servants to those who were better off. In such a situation, some servants would become critical to the success of the wealthy family. They would become better paid as a result. First, the needs of people are unlimited. Wealthy people could use help managing their vast enterprises, and reducing their own efforts at home that take them away from their profitable endeavors. Second, people are more flexible and clever than robots — they can deliver personal services to those that need them. Also, robots cannot deliver the “human touch;” regardless of how clever the AI gets, people will feel better receiving services from people who show that they care. Income inequality has been the norm throughout human history. Attempts at creating “equal” societies fail, because people aren’t equal — some are more talented than others, and deserve more as a result. We are reverting to the norm — inequality.
Our Bedpan and Canasta Future - I'll confess to sometimes succumbing to fairly grim feelings about our medium-term economic future. But apparently I've got nothing on Matt Yglesias. Check this out: I see a lot of American political discourse dominated by two equal and opposite fears. One is fear of population aging, and the consequent transformation into a society in which a larger and larger share of economic output is dedicating to taking take of the elderly. The other is fear of automation and the consequent transformation into a society in which nobody can find a job. [That would be me. –ed.] These two trends are simply two sides of the same coin....What will everyone do for work when everything is automated? They'll take care of old people and sick people, because people would rather interact with human beings if possible. How will we afford all this caretaking for the elderly? Because there will be so much automation that we'll enjoy lives of material plenty even with very little human work. Raise your hand if this sounds like a wonderful vision of the future. Anyone?
A McDonald’s Employee Must Work One Million Hours To Make As Much As The Company’s CEO: Fast food workers in New York City briefly walked off the job last month to protest the low wages endemic to their industry. Over the last several years, fast food companies — most prominently McDonald’s and Yum! Brands, which owns Kentucky Fried Chicken, Pizza Hut, and Taco Bell — have reaped huge profits while employing some of the largest numbers of low-wage workers in the country. At the same time that they’re paying their workers bottom-of-the-barrel wages, these companies give huge salaries to their CEOs. Case in point, McDonald’s CEO made $8.75 million last year, while an average McDonald’s employee would need to work more than one million hours to amass such a sum, as Bloomberg News noted today: The pay gap separating fast-food workers from their chief executive officers is growing at each of those companies. The disparity has doubled at McDonald’s Corp. in the last 10 years, according to data compiled by Bloomberg. At the same time, the company helped pay for lobbying against minimum-wage increases and sought to quash the kind of unionization efforts that erupted recently on the streets of Chicago and New York.
McDonald’s Server Would Have To Work 550 Years To Earn CEO’s Pay - In a stirring Bloomberg BusinessWeek article, Leslie Patton tells the story of one McDonald's employee. His name is Tyree Johnson. The 44-year-old has worked at the fast food chain for two decades, yet still makes just $8.25 an hour, and doesn't get 40 hours a week of work. So Johnson has jobs at two Chicago McDonald's, scrubbing himself down in the bathroom between shifts, because he may be denied a raise if he smells bad. Twice a month he goes to church food pantries to stock up on cereal, soup and powdered milk. Johnson would have to work for 1.1 million hours to earn the $8.8 million that McDonald's CEO James Skinner was paid last year. If he worked for 40 hours a week, every week of the year, that would take five centuries.
Fast-Food Workers Ride Crest of "Simmering Strike Wave" Sweeping Nation - "There seems to be something of a simmering strike wave in the country," said Frances Fox Piven, professor of sociology and political science at the City University of New York. The one-day strikes held by the fast-food workers, like the recent wave of strikes at Walmarts around the country, are something different from a traditional strike (though we've seen those in recent months too, most dramatically with the Chicago Teachers Union). The one-day strike, organized to disrupt business but not to shut it down, Piven noted, isn't about winning. It's about identifying the group, about respect, about demonstrating to other workers that they can take action, but not exposing the workers to the risk of prolonged loss of the income they have little of already. "They're organizing and advocating for low-wage workers in ways that are not in an established New Deal framework," The difficulties of running a traditional National Labor Relations Board election are well-known now. "That system has become so dysfunctional, increasingly people are looking for alternatives," Milkman continued. "Structurally it makes sense given the rollback of New Deal reforms that we've seen, the growth of inequality, the extreme immiseration."
American Tariffs, Bangladeshi Deaths - THE fire that killed 112 workers at a garment factory in the suburbs of Bangladesh’s capital last month was a stark reminder of the human costs of producing and consuming cheap clothes. While American officials have condemned poor safety conditions at the factory and have urged the Bangladeshi government to raise wages and improve working conditions, the United States can do much more: It should bring down high tariffs on imports from Bangladesh and other Asian countries, which put pressure on contractors there to scrimp on labor standards in order to stay competitive. The United States imported more than $4 billion worth of apparel and textiles from Bangladesh last year. So it has an interest in giving the country’s garment industry some financial room with which to improve conditions for the three million employees, most of them female, who work in the industry. Monitoring systems have, in many cases, achieved progress at the higher levels of the industry: the contractors that deal directly with American retailers. But oversight is lax, and conditions particularly dire, in factories run by subcontractors, like the Tazreen Fashions factory, the site of the deadly blaze on Nov. 24.
The Mysterious Case Of America's Negative Real Wage Growth - Regular readers are aware that one of our favorite data series when it comes to demonstrating the quality aspect of the American "recovery" (the quantity is sufficiently taken care of with part-time workers filling in positions without benefits and job security in the New Normal) is that showing the annual average hourly earnings growth in nominal terms, which in November posted the tiniest bounce from its all time low print of 1.2%, rising to 1.3%. The problem as noted above, is that this is nominal wage growth. It therefore excludes the impact of inflation which according to the CPI, rose by 2.2% in October, or, in other words, wage growth was negative in real terms. But it wasn't negative only in October and November. When one takes the Y/Y change in average hourly earnings and subtracts the Y/Y change in CPI one gets a very troubling picture: wages have risen below the rate of inflation for 22 consecutive months, with real wages printing their last positive number back in January 2011 and negative ever since!
Low-Wage Jobs Don’t Just Harm Workers — They Harm Their Children - The recent report by the Pew Research Center that births per every 1000 American women have dropped to historic lows kicked off a flurry of concern amongst conservatives that American culture is beginning to undervalue the future. However, that concern ignores the rather dismal job the country’s economy is doing to care for the children Americans are already having — and the way conservative policy preferences are exacerbating the problem. In particular, Amanda Marcotte flagged a recent round-up of studies at The American Prospect detailing the ways low-wage jobs not only harm the workers who hold them, but can harm the children of those workers as well. One out of every five children ages 12 to 17 currently live in a low-income family — one making twice the federal poverty level or less. And as the recent round of labor protests against Walmart and the fast food industry highlighted, two out of every three jobs the United States is predicted to produce over the next decade will be low-wage and will not require more than a high school diploma. The proliferation of low-wage work as an ever greater share of America’s job supply can have all sorts of damaging effects on the country’s future generations, as the paper found: Many low-income parents face longer hours, unusual hours, inflexible schedules, and lack benefits such as paid sick days, paid medical and parental lave, and vacation. This prevents them from providing the same attention and care to their children as higher income parents — often forcing a choice between their family and their income. They’re often less able to involve themselves in their child’s schooling, or to even ensure the child regularly attends class and completes homework.
Recessions and the Costs of Job Loss - Failing to address the jobs crisis adequately has enormous and long-lasting consequences for workers: We develop new evidence on the cumulative earnings losses associated with job displacement, drawing on longitudinal Social Security records from 1974 to 2008. In present-value terms, men lose an average of 1.4 years of predisplacement earnings if displaced in mass-layoff events that occur when the national unemployment rate is below 6 percent. They lose a staggering 2.8 years of predisplacement earnings if displaced when the unemployment rate exceeds 8 percent. These results reflect discounting at a 5 percent annual rate over 20 years after displacement. We also document large cyclical movements in the incidence of job loss and job displacement and present evidence on how worker anxieties about job loss, wage cuts, and job opportunities respond to contemporaneous economic conditions. Finally, we confront leading models of unemployment fluctuations with evidence on the present-value earnings losses associated with job displacement. The model of Mortensen and Pissarides (1994), extended to include search on the job, generates present-value losses only one-fourth as large as observed losses. More- over, present-value losses in the model vary little with aggregate conditions at the time of displacement, unlike the pattern in the data. Full paper here
Crazy Incentives in Welfare System; The Welfare Cliff; Welfare Spending Per Hour $30.60 - Median Income Per Hour $25.03 - It's better to receive median welfare than median income according to a US Senate budget committee report Total Welfare Spending Equates To $168 Per Day For Every Household In Poverty. Based on data from the Congressional Research Service, cumulative spending on means-tested federal welfare programs, if converted into cash, would equal $167.65 per day per household living below the poverty level. By comparison, the median household income in 2011 of $50,054 equals $137.13 per day. Additionally, spending on federal welfare benefits, if converted into cash payments, equals enough to provide $30.60 per hour, 40 hours per week, to each household living below poverty. The median household hourly wage is $25.03. After accounting for federal taxes, the median hourly wage drops to between $21.50 and $23.45, depending on a household’s deductions and filing status. State and local taxes further reduce the median household’s hourly earnings. By contrast, welfare benefits are not taxed.
Is the safety net keeping the unemployment rate high? -- In this recent EconTalk episode, I talked to Casey Mulligan about his new book, The Redistribution Recession. He argues in that book that the increased generosity of the safety net–unemployment compensation, food stamps, help with health care and so on, played a major role in worsening the recession and slowing down the recovery. It’s a very interesting argument. It isn’t saying that we shouldn’t have a safety net. It’s saying that one of the consequences of a safety net is that unemployment will not respond to economy recovery the way it might otherwise.Before the state of the recovery became an ideological football, most (all?) economists would agree that paying people when they are unemployed would encourage unemployment. Increasing the amount paid to unemployed people would make the unemployment rate higher than it otherwise would be. The question remains as to the magnitude of the effect. I’ve been a little skeptical of the potential magnitude because unemployment compensation isn’t that generous. What Mulligan shows is that when you combine all of the benefits that come when you’re unemployed, it’s a reasonably large sum of money for a lot of folks. He also tries to quantify the precise impact of that generosity across the economy. I’m skeptical about his methodology but put that to the side. Here’s a report from MSNBC which lends support to Mulligan’s claim
'The Distributional Issue ... is Extremely Important' - Dean Baker responds to inconsistent worries about robots displacing labor and the ability of a smaller number of workers per retiree to support Social Security:... we seem to be seeing rapid improvements in productivity growth ... that are drastically reducing the demand for labor. Yet all the gains from these improvements seem to be going to owners of capital as the labor share of output has been falling sharply. The distributional issue ... is extremely important, both for workers who are not seeing gains in living standards, and also for the economy as a whole, since a continual upward redistribution of income will lead to stagnation as a result of inadequate demand. However, it is worth noting that the concern that rapid productivity growth will lead to less demand for labor is 180 degrees at odds with the often repeated concern that productivity growth will be inadequate to sustain rising living standards in the future.... If you are concerned that a falling ratio of workers to retirees is going to make us poor then you are not concerned that excessive productivity growth will leave tens of millions without jobs. It is possible for too much productivity growth to be a problem, if the gains are not broadly shared. It is also possible for too little productivity growth to be a problem as a growing population of retirees impose increasing demands on the economy. But, it is not possible for both to simultaneously be problems. ...
Unemployment Benefits Hang on 'Fiscal Cliff' Deal - A crucial jobs issue hangs on the "fiscal cliff" negotiations: will lawmakers extend unemployment benefits for millions of Americans? Jobless benefits for the roughly 2.1 million Americans who have been out of work for more than six months will expire at the end of December. The Congressional Budget Office (CBO) estimates that an extension of these benefits would cost the government nearly $30 billion. Lawmakers already cut back federal jobless benefits to a maximum of 73 weeks, from 99 (although some states, such as New York, ultimately still offered a combination of benefits totaling 99 weeks for those who exhausted all available emergency unemployment compensation). In general, states provide 20 to 26 weeks of benefits for eligible workers and then federal benefits cover up to 47 more weeks. The extent of federal benefits varies based on each state's unemployment rate. The higher the rate, the greater the number of weeks. The CBO estimates that unemployment insurance benefits totaled $94 billion in fiscal year 2012, while the unemployment rate averaged 8.3%. For comparison, it paid out just $33 billion in fiscal year 2007, when the rate was 4.5%.
I Can't Stop Looking At These Terrifying Long-Term Unemployment Charts - There's a new cliff in town, and it's much scarier than the fiscal cliff. It doesn't have anything to do with expiring tax cuts or sequesters. It has to do with people who have been out of work for six months or longer. It's the worst cliff of them all: the Unemployment Cliff. Our unemployment crisis is also an unemployment enigma. When jobs openings go up, unemployment should go down. This relationship is captured by the Beveridge Curve, seen below. The diagonal red line says that when there are more vacant job openings, the unemployment rate should be lower. But as you can see in the bottom right hand corner, something strange (and very bad!) is happening. More job openings haven't produced more jobs. That suggests a mismatch between jobs and skills ... the dreaded "structural unemployment." Look again. This might be the most important chart you'll see. If unemployment really is structural, there's not much more policymakers can do to bring it down. If it's not, policymakers should be tearing their hair out to put people back to work. So, is it? No. A pioneering paper out of the Boston Fed pretty definitively shows that we have a long-term unemployment problem, not a structural unemployment problem.
As Washington Fiddles over the Fiscal Cliff, the Real Battle Over Inequality Is Happening in the Heartland - Robert Reich: The debate over the fiscal cliff is really about tactical maneuvers preceding a negotiation about how best to reduce the federal budget deficit. Even this larger debate is just one part of what should be the central debate of our time — why median wages continue to drop and poverty to increase at the same time income and wealth are becoming ever more concentrated at the top, and what should be done to counter the trend. With a shrinking share of total income and wealth, the middle class and poor simply don’t have the purchasing power to get the economy back on solid footing. As a result, consumer spending — fully 70 percent of economic activity — isn’t up to the task of keeping the economy going. This puts greater pressure on government to be purchaser of last resort.The dilemma isn’t just economic. It’s also political. As money concentrates at the top, so does power. That concentrated power generates even more entrenched wealth at the top, and less for the middle class and the poor. A case in point is what’s now happening in Michigan. In the state where the American labor movement was born – and where, because of labor unions, the American middle class once had the bargaining power to gain a significant portion of the nation’s total income – Republicans and big money are striking back.Legislators in the Michigan state House, followed almost immediately by Republicans who dominate the state Senate, voted Thursday afternoon to eliminate basic union organizing and workplace protections for both public and private-sector workers
Foodstamps Soar By Most In 16 Months: Over 1 Million Americans Enter Poverty In Last Two Months - And we thought last month's delayed foodstamp data was bad. The just reported foodstamp number for September was a doozy, with 607,544 new Americans becoming eligible for foodstamps, as a record 47.7 million Americans are now living in poverty at least according to the USDA. The monthly increase was the highest since May 2011, and with August's 421K new impoverished America, over 1 million Americans made the EBT card their new best friend. It is unclear just which atmospheric phenomenon will get the blame for this unprecedented surge in poverty, which comes at a time when the pre-election economic data euphoria was adamant that the US economy was on an escape velocity to utopia. Instead what we do know is that in August and September, over three times as many foodstamp recipients were add to the economy as jobs (324,000). We also know that with the imminent impact of Sandy, which will send foodstamp recipients soaring, it is now looking quite possible that the US may end 2012 with just over a mindboggling 50 million Americans living in absolute poverty and collecting the $134.29 average monthly benefit per person, instead of working. Welcome to the recovery indeed. Individual Americans on foodstamps:
Homeless Rates in U.S. Held Level Amid Recession, Study Says, but Big Gains Are Elusive - The federal government has made big strides in reducing the ranks of the chronically homeless and of veterans who are homeless, but it probably will not reach its goal of ending homelessness among those two populations by 2015, according to a government report to be released on Monday. In an annual report to Congress, the Department of Housing and Urban Development said that the overall level of homelessness remained essentially the same from 2011 to 2012, with the number of homeless individuals falling slightly and the number of homeless families increasing slightly. “Every number in this estimate is a person, a family or a veteran living in our shelters or even on our streets. It’s exactly why we have to redouble our efforts to find real and lasting solutions for those facing homelessness.” The number of chronically homeless people — a particularly at-risk population often in need of mental and physical health services and other safety-net support — fell about 7 percent in 2011 and more than 19 percent since 2007. Homelessness among veterans declined more than 7 percent in 2011 and 17 percent since 2009.
Welcome To The New Normal: Poor, Not Special, But Here And Not There - In her November 25 article, “Becoming One Of ‘Them’,” Sharon Astyk offers powerful vignettes from shelters where middle class Hurricane Sandy victims have been attempting to cope not only with their losses but being forced to live alongside the homeless, encountering marginalized immigrants and the physically and mentally ill. Exuding terminal entitlement, these individuals have projected an air of superiority and horror regarding their surroundings and their shelter mates—the usual aura of “This is America, and I shouldn’t have to live this way.” Such vignettes allow us once again to witness how woefully unprepared for the collapse of institutions and infrastructure most Americans are in comparison with the indigent and dispossessed who have lived with and repeatedly survived the ground under their feet being swept away more times than they can probably remember. One cannot watch these scenes, as I have many times on television news reports of Hurricane Sandy devastation, without also feeling compassion for the white, middle-class, hysterical, deer-in-the-headlights survivors whose worlds were shattered with loss and trauma in the course of a few hours. At times I have wanted to take each person by the hand and force them to watch Chris Martenson’s “Crash Course” or read James Howard Kunstler’s Long Emergency. At other times I’ve found myself erupting in anger that these entitled and infantilized individuals could be so abjectly clueless.
UPMC opens food bank for struggling employees, misses point completely: Employees of the University of Pittsburgh Medical Center can no longer say that their employer hasn’t been listening to their concerns and addressing their needs. Since non-medical employees began seeking unionization earlier this year from SEIU, they have been telling the public about the low wages paid by the healthcare giant and how it affects their ability to make ends meet. Many employees, like Leslie Poston, have told the public how they’ve had to go to food banks to make sure they have enough food for their families. Others have said they have to go on public assistance. But fear not, good workers: UPMC Cares, and they’ve come up with a solution. In fact, since Poston was one of the first workers to tell such tales, UPMC brass decided to alert her to the news first. "It was two days before Thanksgiving and my unit director came up, put an arm around me and said 'we've been hearing what you've been saying,'" Poston told City Paper earlier today. "She pulled out a flyer and said, 'We're starting a food bank for the employees.'" “I turned my head and started to cry because I was so angry, although she thought I was crying because of the gesture. They just don’t get that I’d rather they pay me a better wage so I wouldn’t have to go to a food bank.”
Could You Survive on $2 a Day? - Two years ago, Harvard University professor Kathryn Edin was in Baltimore interviewing public housing residents about how they got by. Edin shared her observations with H. Luke Shaefer, a colleague from the University of Michigan. While the income numbers weren't literally nothing, they were pretty darn close. Families were subsisting on just a few thousand bucks a year. "We pretty much assumed that incomes this low are really, really rare," Shaefer told me. "It hadn't occurred to us to even look." Curious, they began pulling together detailed household Census data for the past 15 years. There was reason for pessimism. The researchers were already aware of a rise in "deep poverty," a term used to describe households living at less than half of the federal poverty threshold, or $11,000 a year for a family of four. Since 2000, the number of people in that category has grown to more than 20 million—a whopping 60 percent increase. And the rate has grown from 4.5 percent of the population to 6.6 percent in 2011, the highest in recent memory save 2010, which was just a tad worse (6.7 percent). But Edin and Shaefer wanted to see just how deep that poverty went. In doing so, they relied on a World Bank marker used to study the poor in developing nations: This designation, which they dubbed "extreme" poverty, makes deep poverty look like a cakewalk. It means scraping by on less than $2 per person per day, or $2,920 per year for a family of four. Edin and Shaefer estimated that nearly 1 in 5 low-income American households has been living in extreme povery; since 1996, the number of households in that category had increased by about 130 percent. Among the truly destitute were 2.8 million children. Even if you counted food stamps as cash, half of those kids were still being raised in homes whose weekly take wasn't enough to cover a trip to Applebees. (The chart below reflects their data.)
The Liberal Case Against Right-to-Work Laws - The enactment of a so-called right- to-work law by the state of Michigan this week is indeed, as the news media have described it, a blow against the union movement. Michigan, of all places. But it is also a blow against fairness and common sense. “Right to work” sounds like a law guaranteeing you a job, or at least protecting your job once you’ve got it. A lot of the propaganda by the Chamber of Commerce and similar business groups is about so-called forced unionism. In fact, it’s almost the opposite. The main effect of right-to-work laws is to outlaw regulations of employment and allow your boss to fire you without cause.
Do ‘Right to Work’ Laws Violate the Constitution's Article I Contracts Clause? - Beverly Mann - No State shall enter into any Treaty, Alliance, or Confederation; grant Letters of Marque and Reprisal; coin Money; emit Bills of Credit; make any Thing but gold and silver Coin a Tender in Payment of Debts; pass any Bill of Attainder, ex post facto Law, or Law impairing the Obligation of Contracts, or grant any Title of Nobility. -- Article I, Section 10, I posted it to highlight the prohibition against states’ enacting a law impairing the obligation of contracts—which the Supreme Court has interpreted as a guarantee of the right to freely enter into contracts. That guarantee does have exceptions, of course, none of which includes the type of contract that state so-called ‘right to work’ laws bar. Including the ones passed today by the Michigan legislature, after springing out of nowhere last week. (Although maybe the proponents of these laws think these statutes come within this exception created by the current Supreme Court’s majority: any law that helps corporations is constitutional. It’s a corollary to the majority’s maxim that any federal statute, such as ones concerning compelled contractual arbitration, or labor unions, or federal-court jurisdiction, be distorted beyond plausible recognition of the statute’s actual language, if necessary, to favor corporations. This is known by them as “originalism” and “textualism.” And known by others, not all of whom are justices, as cute, pick-and-choose gimmickry.)But as Slate’s Matthew Yglesias points out today, what these bills do is use the force of law—state law—to interfere with the right of contract between two private parties: labor unions and private employers. In Michigan, the legislature actually passed two separate laws today: one pertaining to labor contracts between labor unions and private employers, the other pertaining to contracts between labor unions and public employers (i.e., state and local governments). But as a constitutional matter, this doesn’t matter.
NYT Series Illuminates - And Confuses - State of the Subsidy Wars - Louise Story's series in the New York Times this week has created a substantial buzz about the issue of economic development subsidies.This is a welcome development, because it's an issue that doesn't get nearly enough attention in the highest profile media. Story has, in addition, appeared on shows such as MSNBC's "Morning Joe" and NPR's "Fresh Air," bringing subsidies to an even wider audience. She crafted a number of stories that highlighted the big picture issues: imbalance in bargaining power between city governments and giant multinational corporations, the blatant conflicts of interest on display in Texas subsidy procurement, and a border war between Kansas and Missouri involving multimillion dollar incentives to move existing facilities across the state line, with no net benefit for the Kansas City metropolitan area, let alone for the U.S. as a whole. The last few days have given me time to absorb the articles and the database Story created, as well as surveying the commentary on the web from well-known experts on subsidies. Several tentative conclusions seem in order.
Coveting Thy Neighbor’s Manufacturing – Is State Tax Competition A Zero Sum Game? - Many people have been focused on state tax incentives of late. Earlier I posted about some work by Moretti and Greenstone that concludes local subsidies improve residents’ welfare (perhaps partly due to sizable employment spillovers). With that in mind, I wanted to highlight a Journal of Public Economics paper by Austan Goolsbee & Edward Maydew that shows that state tax competition appears to be a zero sum game. They find that something that amounts to lowering corporate taxes in your state increases state employment but not national employment (see this post’s discussion of apportionment for more details): ABSTRACT: This paper investigates the economic impact of the apportionment formulae used to divide corporate income taxes among the states. For the average state, reducing the payroll weight from one-third to one-quarter increases manufacturing employment around 1.1%, concentrated in manufacturing and with larger effects in the long-run. The results also suggest that apportionment changes have important negative externalities on other states. On average, the aggregate effects of apportionment formula changes are close to zero.
State Tax Revenues Showed Continued Yet Slow Growth in the Third Quarter of 2012 - The Rockefeller Institute's compilation of preliminary data from 47 states shows that collections from major tax sources increased by 2.1 in nominal terms in the third quarter of 2012 compared to the same quarter of 2011. Tax collections have now risen for 11 straight quarters, beginning with the first quarter of 2010. This growth followed five quarters of declines brought on by the Great Recession.... Among 47 early reporting states, 38 states reported gains while nine states reported declines in total tax revenue collections during the third quarter of 2012.....Overall, state tax revenues are showing continued improvement, though the pace of growth has been much slower in the recent quarters compared to historic averages. While state tax revenues have now grown for 11 consecutive quarters, they are still far below where they would have been in the absence of the Great Recession. Nationwide, state tax revenues in fiscal 2012 were less than 1 percent higher than fiscal 2008 in nominal terms. After adjusting for inflation, state tax revenues declined 5 percent in fiscal 2012 compared to fiscal 2008.
As State Budgets Rebound, Federal Cuts Could Pose Danger - After years of budget cuts and sluggish recovery, states expect to see their revenues climb back to prerecession levels this year for the first time since the financial crisis hit. But even as some states hope to restore some of the deep spending cuts they have made, they face a new threat. Washington’s efforts to tame the federal deficit, state officials fear, could end up further whittling away the federal aid that states depend upon and weakening the economy as it slowly mends. Those worries cloud a year that should be a turning point of sorts for the states. A fiscal survey of states released Friday by the National Governors Association and the National Association of State Budget Officers found that states expect to collect $692.8 billion in general fund revenues this fiscal year, which is more than they collected in 2008, the last fiscal year before the recession. That is good news, but perhaps not as good as it initially appears. Adjusted for inflation, this year’s revenues are still expected to be 7.9 percent below the 2008 levels. And with Medicaid costs continuing to rise — states now spend more on Medicaid than on elementary and high school education — states find themselves hard-pressed to restore many of the deep cuts they have made to other services. Now many governors are bracing for the prospect of cuts in federal aid, which provided states with roughly a third of their revenue last year.
Storm Sirens’ Last Wail - The tsunami sirens of Tillamook County, posted along the rocky beachfront on this stretch of the earthquake-prone Pacific coast, are a reassuring presence to many residents and visitors. The 30-odd pole-mounted speakers, simple and dated in their 1960s technology of transistors and circuit boards, carry an echo of cold war civil defense, suggesting that people have a kind of handle on responding to the earth’s potential violence from a killer wave. The sirens, bought used in 1993, rely on 1960s technology, but many people like their familiarity. But now a decision by the County Commission to dismantle and forever silence the sirens on Jan. 1 has opened up a fault line of its own, as questions of hard science and geology — about the big quake that scientists say will surely strike here one day — mix with emotion and angst about how human beings and emergency managers prepare for, or deny, that eventuality. What further complicates the story is money. In a hard-pressed county that is still struggling in the aftermath of the recession and tax-revenue declines, managers said they weighed the effectiveness of the sirens, in light of new tsunami research and coastal flood-zone maps, against the roughly $100,000 needed to replace the devices under new federal communications regulations that take effect next year. The conclusion, they said, was clear: the sirens were not worth it.
The US Bureau of Prisons’ lack of compassion costs it dear - Between 1940 and 1980, the inmate population in the Federal Bureau of Prisons (BOP), which is an agency under the US Department of Justice, averaged approximately 24,000 a year. This all changed after 1984, when Congress passed the Sentencing Reform Act, which eliminated parole in the federal prison system, did away with time-off for good behavior and introduced determinate sentencing. As a result of this legislation and several subsequent follow-up acts, the number of prisoners in federal custody has increased tenfold, to approximately 218,000 today. Regardless of how excessive these prisoners sentences may have been, or how rehabilitated those inmates are, it is almost impossible for a prisoner to be released early – and the Federal Bureau of Prisons seems to like it that way. These days, the only way an inmate in federal prison can get his sentence reduced is by applying for compassionate release. Compassion appears to be severely lacking in the BOP, however, as evidenced in a joint report released last week by Human Rights Watch (HRW) and Families against Mandatory Minimums (FAMM). The title of the report, "The Answer is No", pretty much sums up the BOP's attitude towards granting early release, even when the continuance of a prisoner's sentence is "senseless, incompatible with human dignity or cruel". In 2011, only 30 motions were filed by the BOP on behalf of prisoners (out of a population of 218,000), most of whom were terminally ill. Twenty-five of those motions were granted.
Arizona funnels business to CCA through its school-to-prison pipeline - - On 31 October 2012, a group of local law enforcement agencies and approximately 20 trained sniffer dogs descended on the Vista Grande High School in Arizona to perform a drug sweep. The officers and dogs showed up in the early morning and the school was put on lockdown, meaning all of the doors were locked and none of the children was allowed to leave. Drug sweeps of schools are not uncommon occurrences in the recent past in America, much to the chagrin of civil rights advocates, who see such sweeps as an efficient means of diverting certain kids to prison – in some cases, even before they make it to adolescence, via the much-criticized "school-to-prison pipeline". What was unusual about this particular raid, however, is that, among the team of law enforcement personnel and canines put together by the local Casa Grande police department, there were prison guards employed by the Corrections Corporation of America (CCA), the country's largest for-profit prison company, which owns and operates several prisons in the area. CCA was also kind enough to provide their sniffer dogs for the raid. What's even more unusual about this is that pretty much nobody in a position of authority in and around Casa Grande seems to think there's anything wrong with that.
Nonsense nonsense crisis -AMERICA and Europe face a troubling demographic future. Declining birth rates will probably result in an older population and a smaller share of the population working to pay for their retirement. Does this necessary spell doom and gloom? Megan Mcardle reckons so, but Dean Baker dismisses such arguments as “nonsense”. He shows that if productivity continues to increase (even at a lower rate than we’ve experienced historically) then we can still expect rising levels of prosperity. But which factor will dominate, aging or productivity, is uncertain. History is on Mr Baker’s side. Since industrialisation, each new cohort was more productive than the last. The productivity of labour depends on capital and innovation. There are diminishing returns to capital, so sustainable increases in productivity come from new innovation. Ms McArdle, channeling endogenous growth models, is concerned there will less innovation in the future. Younger workers are more innovative and entrepreneurial; an aging labour force might mean much less or no productivity growth. Future productivity of labour will also depend on capital-intensity. An old population requires more people to work in labour-intensive jobs like elder care, there's not much scope to improve productivity of labour in such sectors—at least not in a humane way.
Confirmation that studying and child labor are incompatible: Labour conditions, the amount of hours and working during the morning are the factors that most negatively affect the academic development of children who work. Using data from the 'Edúcame primero Colombia' Project ('Educate me first Colombia' in Spanish), a group of researchers in which the University of Seville participates has confirmed the incompatibility between studying and child labour. The International Labour Organisation states that, in 2010, approximately 215 million children across the world were working. This figure has been progressively decreasing in Asia, the Pacific, Latin America and the Caribbean especially with regards to jobs that are considered hard and dangerous carried out by the youngest children. However, according to the organisation, the number of workers between the age of 15 and 17 years has increased in the last five years. Numerous studies have demonstrated that working and the academic development of minors are incompatible.Against this backdrop, the researchers interviewed 3,302 families that had a son or daughter participating in the "Edúcame Primero Colombia" programme, headed by the United States Department of Labour and the Ministry for Social Protection of the Republic of Colombia. The average child worker is 9 years of age.
School District Owes $1 Billion On $100 Million Loan - In 2010, officials at the West Contra Costa School District, just east of San Francisco, were in a bind. The district needed $2.5 million to help secure a federally subsidized $25 million loan to build a badly needed elementary school. Charles Ramsey, president of the school board, says he needed that $2.5 million upfront, but the district didn't have it. "We'd be foolish not to take advantage of getting $25 million" when the district had to spend just $2.5 million to get it, Ramsey says. "The only way we could do it was with a [capital appreciation bond]." CABs allow districts to defer payments well into the future — by which time lots of interest has accrued. In the West Contra Costa Schools' case, that $2.5 million bond will cost the district a whopping $34 million to repay. Ramsey says it was a good deal, because his district is getting a brand-new $25 million school. "You'd take that any day," he says. "Why would you leave $25 million on the table? You would never leave $25 million on the table." But that doesn't make the arrangement a good deal, says California State Treasurer Bill Lockyer. "It's the school district equivalent of a payday loan or a balloon payment that you might obligate yourself for," Lockyer says. "So you don't pay for, maybe, 20 years — and suddenly you have a spike in interest rates that's extraordinary."
Only In California: School Owes $1 Billion On $100 Million 'PayDay' Loan - These three letters - C.A.B. - might just be the Dis-Humor story of the day. NPR reports that more than 200 schools across California are coming to the shocking realization that the upfront cash they needed so badly came at quite a price. These 'Capital Appreciation Bonds' are unlike normal bonds (requiring regular coupon payments and principal repayment); instead they provide the 'lent' money upfront and defer all interest and repayment to some magical faery land time in the future (by which time the interest accrued has grown exponentially as the interest accrues on the rising 'principal plus previously accrued interest'). Brilliant - as the Guinness chaps might say. So California schools are now undertaking PayDay or loan-shark style loans defending the idiocy of super-short-term thinking with such statements as "Why would you leave $25 million on the table?" referring to the upfront cash that one Treasurer was able to get his hands on - with clearly no comprehension of the financial instrument's massive convexity. California State Treasurer Bill Lockyer said "It's the school district equivalent of a payday loan or a balloon payment that you might obligate yourself for, so you don't pay for, maybe, 20 years - and suddenly you have a spike... It's so irresponsible."
Hite to announce plans to close 37 school buildings - On Thursday, Superintendent William R. Hite Jr. will announce the proposed closures of 37 school buildings, plus multiple other changes coming to the cash-poor Philadelphia School District. Hite is proposing that the buildings listed for closure - around 20 elementary schools, a handful of middle schools, and about 10 high schools - shut their doors for good in June, according to sources and documents obtained by The Inquirer. The schools are in nearly every part of the city and include well-known ones with long histories, such as Bok, Germantown, Strawberry Mansion, and University City High Schools. Under the proposal, North Philadelphia would be hit particularly hard, while the overcrowded Northeast would be spared but for the closure of an annex of Carnell Elementary that houses middle school students. The district would not confirm the list, but Hite on Wednesday offered hints as to what was coming. "Quite a few of the programs will be programs that will relocate and have different grade configurations,"
The Silent Treatment: A Day in the Life of a Student in ‘No Excuses’ Land - Meet Carolina. This college-bound fifth grader is fortunate enough to attend a charter school where expectations are high and innovation and excellence abound. There’s just one wee catch. In order to realize her goal of opportunity and the promise of independence, Carolina must spend the next SEVEN YEARS in near silence. Sweet Carolina is not a novice in a convent or an inmate in a children’s prison but a resident of a horrifying place called “no excuses” land that, while often lauded by education rephormers, is rarely seen from within. You see, Carolina is a would-be student at a proposed new school, Argosy Collegiate Charter School, in Fall River, Massachusetts. As part of its application to the state Board of Education, Argosy included a detailed hour-by-hour look at what Carolina’s typical school day is like (note: Day in the Life begins on page 144 of the application). The following is an excerpt from Carolina’s day.
U.S. Students Still Lag Globally in Math and Science, Tests Show - - Fourth- and eighth-grade students in the United States continue to lag behind students in several East Asian countries and some European nations in math and science, although American fourth graders are closer to the top performers in reading, according to test results released on Tuesday. Fretting about how American schools compare with those in other countries has become a regular pastime in education circles. Results from two new reports, the Trends in International Mathematics and Science Study and the Progress in International Reading Literacy Study, are likely to fuel further debate. South Korea and Singapore led the international rankings in math and fourth-grade science, while Singapore and Taiwan had the top-performing students in eighth-grade science. The United States ranked 11th in fourth-grade math, 9th in eighth-grade math, 7th in fourth-grade science and 10th in eighth-grade science. In the United States, only 7 percent of students reached the advanced level in eighth-grade math, while 48 percent of eighth graders in Singapore and 47 percent of eighth graders in South Korea reached the advanced level. As those with superior math and science skills increasingly thrive in a global economy, the lag among American students could be a cause for concern.
State government education employees shielded from recession by the federal government - Back in October we discussed a sudden and likely unsustainable spike (for the month of September) in state and local government payrolls (see post). The increase was particularly visible in education. Now that we've had a couple of US employment reports, it is worth revisiting the subject. Specifically let's first take a look at the trend in local government employees in education. These represent mostly K-12 public school systems. It seems that most of the September spike has been reversed, suggesting that this was a temporary jump and the trend will likely resume.Now let's take a look at state (as opposed to local) government employees working in education. This population should include employment in higher education such as state universities. The growth trajectory there is quite different, with employee numbers near all-time record. How can the number of these government employees grow unabated when every other sector of local, state, and federal government (such as postal workers - see post) is shrinking payrolls? The answer may lie in the old familiar trend of rising student loan balances that continue to fund constant increases in higher education tuition (see discussion). There is always a need to hire more people at a university (or the state bureaucracy that supports it), and raising tuition is an easy way to fund it. The's why a great deal of academia has a limited appreciation for the recession the nation has undergone recently - the federal government has at least in part shielded them from the economic downturn.
University of Phoenix’ plot to corner the cheap education market - The University of Phoenix played a key role in defeating legislation that would have allowed community colleges in Arizona to offer low-priced bachelor’s degree programs, interviews and state records show. The for-profit college, which is one of the state’s biggest employers, provided research and political muscle for a multi-year lobbying campaign against “community college baccalaureate degrees” – out of concern that those programs would undercut its business model. For-profit schools and community colleges generally serve the same working, non-traditional student demographic, but tuition rates at community colleges are often much lower. Historically, community colleges have offered two-year associate’s degrees, with students then transferring to other schools to earn a bachelor’s degree – also known as a baccalaureate degree. Recent efforts by community colleges to offer their own baccalaureate degree programs have been controversial, in part because they dramatically expand the traditional mission of these schools. But advocates say these programs – which typically require approval from state lawmakers – better respond to student and employer needs by providing affordable, career-oriented, four-year degrees.
Harvard University approves bondage club - Expect some serious discipline at Harvard University’s newest club — the first bondage and sado-masochism hotspot to win official campus approval. Harvard College Munch, as the group is named, promises to give the student body a chance to beat misconceptions about S&M by providing “accurate understandings of alternative sexualities and kink.” In addition to “discussions (and) screenings,” says Munch’s promotional blurb on the Harvard website, the club will feature a more hands-on approach, with “space where college-age adults may reach out to their peers.”
The Economic Case for Higher Education - Treasury Notes - As the semester draws to a close at schools and universities across the country and college applications are submitted, the Treasury Department has released a report that should be food for thought for students scrambling to complete their work and finish their exams. The new report, prepared in conjunction with the Education Department, shows that investing in education expands job opportunities, boosts America’s competitiveness, and supports the kind of income mobility that is fundamental to a growing economy. While post-secondary education has become increasingly important over time, there have also been growing concerns about the accessibility and affordability of higher education. In particular, students and their families are bearing a greater share of college costs than a generation ago. In an effort to help counteract these trends, the Obama Administration has implemented several new policies to provide relief for students and their families, including increasing Pell grants, introducing the American Opportunity Tax Credit, keeping Stafford loan interest rates low, and expanding “income-based repayment.” This report confirms the critical importance of higher education, showing the personal economic benefits of attending college, and includes data and analysis on the broader role of a well-educated workforce, which is vital to our nation’s future economic growth.
Are High College Costs Redistributive? - Mike Konczal - Aaron Bady has a fantastic piece on the boosters who argue that MOOCs and other forms of online education will fundamentally transform higher education, addressed as a response to Clay Shirky. There's a few important moves to watch when people make this line of argument. Many who prize the "disruptive innovation" of higher education usually concede that what it will mostly do is provide a cheaper but poorer alternative to the large number of non-elite public institutions that educate the majority of those who seek higher education. The talk is all "Watch out Harvard and Yale! This online education company is going to take you down like Napster took down the record companies." Then it quickly reverts to the idea of providing "access," which gets much of its power through the ongoing dismantling of mass public higher education. Note that, given that online education's success will be a function of the weakness of public education, there's a huge incentive for for-profit higher education firms to participate in that dismantling project. And sure enough, there's a great new article by Sarah Pavlus at the American Independent, "University of Phoenix fought against community college expansion." There's "so much money to be made online, and [for-profit schools] didn’t want community colleges coming in at a much lower tuition rate,” she writes. Public institutions are attempting to innovate and provide better services to citizens, but for-profit schools are trying to stop them to bolster their own bottom lines.
Are construction costs driving up college tuition? - Andrew Martin has a very long, and not particularly illuminating, article about college indebtedness in today’s NYT. The title of the piece is “Colleges’ Debt Falls on Students After Construction Binges”, and it’s almost 3,000 words long, but somehow Martin fails to even hazard a guess as to the degree to which colleges’ debt is falling on students after construction binges. We’re certainly told that it’s happening: A decade-long spending binge to build academic buildings, dormitories and recreational facilities — some of them inordinately lavish to attract students — has left colleges and universities saddled with large amounts of debt. Oftentimes, students are stuck picking up the bill… Higher debt payments and other expenses have contributed to the runaway inflation of college costs, and the impact on students is real and often substantial. How big are these bills? How substantial is the impact on students? Martin doesn’t hazard a guess: instead, he just says that “the costs are not easy to isolate”. But there are a few hard numbers, far down in the piece: Outstanding debt at the 224 public universities rated by Moody’s grew to $122 billion in 2011, from $53 billion in inflation-adjusted dollars in 2000. At the 281 private universities rated by Moody’s, debt increased to $83 billion, from $40 billion, in that period. Rather than deplete their endowments, some colleges borrowed to help pay bills after the financial crisis, but most borrowing was for capital projects.
US student loans: The trillion dollar debt trap - Jill McDevitt, 27, is well-educated and renowned in her field - but she's overwhelmed by $150,000 (£93,500; 116,300 euros) of student debt. She lives with her partner in the suburbs of Philadelphia, in an 800 sq ft flat that lacks laundry facilities. "I have a PhD, and I do my laundry in the 'coin op' place," she says. "My credit is already in the dumps," she says. "What is the incentive if I'm already screwed?" Ms McDevitt is not alone. Student debt is a one trillion dollar headache for the US economy - and it is only getting worse. As the cost of a university education soars, default rates are on the rise. Some estimates say that more than five million borrowers in the US have defaulted on their student loans. Almost 375,000 people defaulted in the latest year alone, the US Department of Education says. And those borrowers can face dire consequences. The federal government has strong tools to help recover debt from delinquent borrowers, including garnishing 15% of their take-home pay, and retirement income,
Hostess Workers' Pension Money Diverted For Other Uses: Report: Hostess Brands acknowledged for the first time in a news report Monday that the company diverted workers' pension money for other company uses. The bankrupt baker told The Wall Street Journal that money taken out of workers' paychecks, intended for their retirement funds, was used for company operations instead. Hostess, which was under different management at the time the diversions began in August 2011, said it does not know how much money it took. "It's not a good situation to have," Hostess CEO Gregory Rayburn told the WSJ. "Whatever the circumstances were, whatever those decisions were, I wasn't there," Rayburn added. As the founder and owner of Kobi Partners, a restructuring advisory firm, Rayburn was appointed acting CEO in March 2012. Hostess Brands, which filed for bankruptcy for a second time in January, started liquidating its operations in November after the bakers' union refused to take another pay cut and went on strike. The liquidation will leave about 18,000 workers without jobs.
Hostess took workers’ pension money to fund itself - Of all the outrages Hostess has committed against its workers, this may take the cake. In August, 2011, the company just stopped contributing to its workers' pensions, and is now acknowledging that it instead used the money for operational expenses. The money that didn't go into pension funds was money that the workers had bargained for and chosen to take as pension instead of wages. But that doesn't mean there's anything they can do about it:The maneuver probably doesn't violate federal law because the money Hostess failed to put into the pension didn't come directly from employees, experts said. "It's what lawyers call betrayal without remedy," said James P. Baker, a partner at Baker & McKenzie LLP who specializes in employee benefits and isn't involved in the Hostess case. "It's sad, but that stuff does happen, unfortunately." It's a little more than sad. It's infuriating, at a minimum. And the fact that "that stuff does happen" as often as it does is a sign of a diseased economy. This was how these workers were saving for their retirement over decades at Hostess. They were being responsible, planning and saving like we're told we should all do, making that decision at a local level as they bargained their contracts: John Jordan, a union official and former Hostess employee, said workers at a Hostess factory in Biddeford, Maine, agreed to plow 28 cents of their 30-cents-an-hour wage increase in November 2010 into the pension plan.
Muni Pension-Bond Sales May Increase Default Risk, Moody’s Says - State and local governments issuing bonds to bolster their pension funds may increase the chance of defaulting on their debt while probably failing to improve their credit quality, Moody’s Investors Service said. The securities will have either a neutral or negative effect on a government’s creditworthiness, depending on the size of the sale and the use of proceeds, Moody’s said in a report today. Turning unfunded pension promises into bonds keeps liabilities unchanged, though it raises the risk of a default as the amount of debt increases. “Pension bonds are often a red flag associated with greater rigidity of long-term obligations, failure to find sustainable solutions to pension funding and a pattern of pushing costs off into the future.” Moody’s analysts Marcia Van Wagner and Timothy Blake wrote in the report. In some cases, “the issuance of the bonds is sufficiently credit negative to put downward pressure on the issuer’s rating.”
Corporate Pensions on Pace to Hit Year-end Deficit Record -$607.4 billion: The combined amount by which the pension plans of S&P 1500 companies were underfunded at the end of November. Companies in the Standard & Poor’s 1500-stock index will likely post a record end-of-year pension deficit for 2012, according to Mercer, a benefits consulting firm. The gap between their pension-fund assets and liabilities stood at $607.4 billion at the end of last month, an improvement from $619.1 billion at the end of October. Even so, Richard McEvoy, head of Mercer’s financial strategy group, which advises companies on their pension plans, said last year’s record of $483.7 billion will likely be broken once companies report their year-end pension funding. To avoid a new deficit record, the figure would have to make one of its biggest monthly swings in five years. Pension-plan liabilities have soared in the past few years because of ultralow interest rates. Plans use a so-called discount rate, which is based on corporate-bond rates, to calculate the present value of their future liabilities. Lower rates lead to higher liabilities, and the resulting deficits cause companies to take charges against earnings at year-end. It doesn’t look as if any relief is in sight. The Federal Reserve is expected to keep interest rates low until at least 2015, so the pension headache could persist.
SOCIAL SECURITY and Uncle Sam - Most of us have heard the “phony iou” claim about the Social Security Trust Fund, with its accompanying cartoon of a hapless Uncle Sam furiously borrowing from his left pocket to fill up his right pocket, and stuffing "worthless iou's" into the left pocket to pay for what he borrowed. And most of us know there is something wrong with this picture, but find it hard to say just what it is. And of course some of us know exactly what is wrong and say it clearly, only to be met by unbelieving looks from the folks who had nodded their heads wisely when the folly of Uncle Sam borrowing from himself was first "explained" to them. I have tended to “explain” the fallacy of the Uncle Sam cartoon by reminding people that there is more than one person in the United States and that we borrow from each other all the time. The people who pay the income tax tend to be "the rich." And the people who pay the payroll tax tend to be "the poor." Moreover, the people who paid the "excess" payroll tax, the boomers, are NOT the people who will pay back the money. The money will be paid back by the boomers' "children," who will generally have more money than the boomers did, and who presumably get the advantage of living in a richer, stronger country paid for by the money that was borrowed. This explanation has met with no notable success. I thought I’d take the “only one man in America and his name is Sam” hypothesis seriously for a moment and see if i could use it to explain what is wrong with some other aspects of the phony iou claim... including the one that “we pay for our Social Security twice... once when we paid the payroll tax and once again when we pay the income tax to repay the money the government borrowed from Social Security (or “from itself,” in some versions)."
Social Security: Best-Funded Government Program – Video
For the Last Time, the Social Security Trust Fund Is Real - First things first: Social Security is funded via a payroll tax on all income up to $110,000. You pay 6.2 percent and your employer pays 6.2 percent. These numbers were set by the Social Security Reform Act of 1983, and for the next three decades payroll taxes provided more money than was needed to pay out benefits to retirees. Now, suppose this surplus had been invested in corporate bonds. If that's what had happened, there would be no confusion about the trust fund. Everyone agrees that corporate bonds are real things, and that the corporations who sell them have an obligation to pay them back, even though it means less money for shareholder dividends. Now let's change a few words in this story. What actually happened is that the Social Security surplus was invested in treasury bonds. What does that mean? It means that workers gave money to the federal government, which turned around and spent it. In return, the Social Security trust fund received bonds that represented promises to repay the money later out of the federal government's income tax receipts.
Fact-checkers Sputter And Flop Attempting To Explain How Social Security Works, Affects Deficit - A gaggle of fact-checkers recently attempted to bring clarity to the question of whether Social Security adds to the deficit. Much as they did during the campaign, the fact-checkers have instead confused what is in fact quite a simple issue. Social Security, by law, does not add to the deficit. It is not a driver of long-term debt. We’ve been over this. The reason no one can get it right is because here in this season of the fiscal cliff, no one is getting anything right. It’s a full-on headless chicken panic. Everyone needs to calm down, about a lot of things, but especially about Social Security, which does not even have to come up during the “fiscal cliff talks” because it’s totally irrelevant to the situation and will only complicate everything needlessly.
Let’s Play With Some Numbers, Social Security Edition - Well, the current average monthly Social Security payment (for October 2012) is $1,237 per month which works out to be $14,844 per year. This will go up to $1,261 in 2013. Where I had my mythical full time minimum wage earner paying FICA/Medicare taxes, other taxes (and some healthcare costs) and missing work on the “Big 6″ holidays (New Years Day, Memorial Day, July 4, Labor Day, Thanksgiving, and Christmas) before getting into the actual available funds to pay bills (lowering the income from $15,080 by $2,570 to $12,510), the mythical average Social Security recipient pays $99.90 per month for Medicare Part B starting at age 65, going up to $104.90 for 2013. The point of all this is that a mythical person collecting average Social Security benefits is in roughly the same position financially as the mythical person who works a mythical full time minimum wage job. My WAG is that for every person who is collecting Social Security and also has the benefits of a defined pension, 401K, or robust savings, there is another person who is relying solely and completely on Social Security and Medicare to stay alive. With the Great Recession having taken its toll these past few years, I imagine there are many people just trying to hold on until they reach age 62 and can start collecting something. I imagine there are many more, like myself, who have had to cash in their 401k/IRAs early just to try to stay alive for these past few years.
Supplemental Security Income: Where the Program Stands - I have sometimes said that Supplemental Security Income, or SSI, is the federal program to those who are both old and low-income. But while that was an OK if inaccurate shorthand a few decades ago, its no longer appropriate. SSI does cover the low-income elderly, but it also covers those who are low-income from ages 18-64 with disabilities, and also disabled children under the age of 18 in low-income household. Back in 1980, about half of those receiving benefits were in the over-65 low-income. But at present, only 25 percent of the people covered by SSI are elderly, and they receive only 19 percent of the payments from this program. The Congressional Budget Office offers this and other facts about the program in its just-released report: "Supplemental Security Income: An Overview." Here a figure from CBO showing the three main groups in the SSI program, and how their numbers have evolved over time.
Medicaid enrollment rises in New York — The number of New Yorkers enrolled in Medicaid, the government health insurance program for poor and disabled people, has grown by nearly 157,000 since last December, reaching to more than 5.1 million New Yorkers. Enrollment growth in the $52 billion program funded jointly by the state and federal governments is a consequence of the economy, experts said, as people who lose their jobs often also lose their employer-sponsored health insurance. Additionally, the state has recently streamlined the processes of enrolling and staying enrolled in Medicaid, leading more eligible New Yorkers to seek benefits. There are about 1 million residents who are eligible and not enrolled, according to state estimates. In October, the most recent month for which data is available, there were 5.11 million enrollees, the state Department of Health said. That’s up from 4.95 million in December 2011.
White House to States: All or Nothing on the Medicaid Expansion - The move for Republican Governors who didn’t want to be seen as needlessly cruel to their poorest residents was to try and work out an accommodation with the White House on the Medicaid expansion. As you know, the Supreme Court’s ruling allows governors to essentially opt out of the expansion without risking current Medicaid funds. Some Republicans in the states sought to increase Medicaid to perhaps just 100% of the poverty line rather than the prescribed 133%. This would have the advantage of offloading the individuals between 100-133% of poverty to the exchanges, a federal outlay rather than a state one.The White House just shut the door on this. Health and Human Services Secretary Kathleen Sebelius announced that states will not be eligible for funding for the Medicaid expansion unless they expand it all the way to 133% of poverty as envisioned by the law
Coburn: Medicare and Social Security ‘are things we don’t absolutely need’ - Sen. Tom Coburn (R-OK) is encouraging Democrats to cut Social Security and Medicare benefits because the programs are “things we don’t absolutely need.” Speaking to ABC’s George Stephanopolous on Sunday about the so-called fiscal cliff, Coburn said that he would be willing to accept tax hikes for the top 2 percent of earners if Democrats and President Barack Obama agreed to reform Social Security and Medicare. The ABC host pointed out that Obama’s health care reform law had already achieved about $716 billion in Medicare savings and many Republicans — including former Republican presidential nominee Mitt Romney — ran against those cuts. “The $700 billion in savings doesn’t save the government a penny because what it does is takes that $700 billion and spends it on other people,” Coburn insisted. “We’ve seen the president demand that we’re going to solve 7 percent of this problem [with tax hikes on the rich] but he’s totally inflexible on the other 93 percent.”
Raising the Medicare Eligibility Age Isn’t Harmless -I just can’t believe we’re still talking about raising the eligibility age for Medicare from 65 to 67. I’ve written so much about what’s wrong with this policy, that I hesitate to do so again. But when faced with the realization that much of what I said still hasn’t permeated the general thinking of policymakers in Washington, I believe that we could make another go at this. Let’s start with life expectancy. Almost all of the arguments for raising the eligibility age coalesce around the idea that since life expectancy has gone up so much, we have to think about making people work a little longer. Life expectancy at birth has gone up quite a bit since the 1950’s when Social Security was young. But since we’re talking about Medicare, it makes more sense to talk about how much it’s gone up since 1965. It’s still increased since then, about 8-9 years in fact. But hold on a minute – that’s life expectancy at birth. That’s affected by many things, including babies who die in childbirth and diseases that used to prevent children from becoming adults. That’s not what affects Medicare. What we really care about when we talk about how much Medicare costs is life expectancy at age 65. The meaningful question is, if you make it to 65, how many more years will you live? That’s how many years you could expect to be on Medicare, and that’s how much you could cost the rest of us.
How Many People Will Die if We Raise the Medicare Age to 67? - In September, 2009, Rep. Alan Grayson got on the floor of the House of Representatives and said that the Republican health care plan – leaving 44 million uninsured – was killing people. It was a famous speech, in which he said that the Republican health care plan consists of two steps. One, don’t get sick. Two, if you do get sick, die quickly. This speech threw the political world into a temporary tizzy, because Grayson actually made the point that health care is about living and dying, not making charts look nicer. The speech, while rhetorically zesty, was data-driven. It relied on this study from Harvard Medical School. So with that in mind, it’s worth asking the question – how many people will die if the Medicare age is increased to 67? To answer this question, we have to make assumptions about other parts of the health care system going forward. Even so, we can and should start to understand what the human death toll might be if we increase the retirement age to 67. If the age goes up, there will be 5 million 65 and 66 year olds who can’t get Medicare for at least a year (7 million for at least a month), and will have to rely on some other system for health care payments. Kaiser has a study out on what would happen to Medicare if the eligibility age goes to 67, but with the assumption that Obamacare kicks in and covers all 66 and 67 year olds with a mixture of employer/retiree insurance, Medicaid, or insurance through exchanges. We can assume, however, that some of these seniors will be uninsured. The Congressional Budget Office says that this number, by 2020, will be 5% (see page 6). The Center for Budget and Policy Priorities, and fairly centrist think tank which supports cutting Social Security, provides the rationale.
The Reality of Nightmares - J. D. Alt - In his 12/8 Washington Post column, Ezra Klein says, “Projected deficits are driven by two factors: health-care-costs and old people.” He goes on to suggest, quite logically it seems, that in order to pay for all the health-care services elderly American’s are going to require, tax rates will to have to be raised so high they’ll begin “doing real damage to the economy”, or deficits will “grow to the point that they cause a fiscal crisis.” What’s odd about this is that it sounds to me like a huge, growth-industry opportunity: lots of customers (old people) needing lots of services and facilities (nursing-care, hospital beds, heart monitors, breathing tubes, etc.) I could well imagine that if we truly embraced the need to provide all these services and facilities, it might grow our GDP by four or five percent. Just taking really good care of old people—feeding them, reading to them, taking them for walks, massaging their feet, helping them grow tomatoes—could likely lower the national unemployment rate by three or four percentage points. I suppose what Ezra is concerned about is the fact that all these old people don’t have enough money to pay for these services and facilities. It’s true that maybe one out of ten has managed to save enough dollars to buy what they’re going to need, but ninety percent or more simply couldn’t quite manage their lives in a way to set aside that kind of money. Life just doesn’t seems to work out that way. So we have this potentially huge pool of health and elderly-care consumers who are powerless to consume because they have no dollars. And we have this potentially very large pool of health and elderly-care providers who haven’t even been hired yet by the health and elderly-care industries because their potential customers are broke. This strikes me as a very illogical and dysfunctional situation—sort of like not being able to get out of the rain because you’re too wet.
Did you know raising the Medicare age of eligibility will make seniors pay more for their Medicare? - Yep. It will. See, Medicare doesn’t work like your typical insurance company, which rates different people differently. It’s not making a profit, or advertising, or paying out dividends. Whatever it pays out in benefits is what it asks taxpayers and seniors to kick in. If Medicare costs more, then seniors pay more. Take Medicare Part B as an example. Whatever the amount it is projected to cost (or “premium”),the government pays 75% and seniors pay 25%. So if Medicare B spending is calculated to be $5,000 a person, it’s $3750 to the feds and $1250 to seniors.* But if we remove the cheapest seniors from the pool (65 and 66-year-olds) and put them in the Obamacare market, then the remaining seniors are going to cost more than $5,000 a person. I don’t know what the number will be, but it will be higher. Whatever that number is, seniors will be paying 25% of it in premiums.
The "Yes, Minister" Theory of the Medicare Age - Paul Krugman -- Aaron Carroll can’t believe that we’re still talking about raising the age for Medicare eligibility; his disbelief is easy to understand. It is, after all, a truly terrible idea, for reasons he details in the linked post; it would inflict vast hardship on the most vulnerable, while saving the federal government remarkably little money, and would actually raise overall health spending, basically because private insurers have much higher administrative costs and much less bargaining power than Medicare, so shifting seniors out of the program ends up costing a lot of money. Yet the idea just won’t go away. It’s almost surreal. What’s going on here? One answer is that conservatives badly want a rise in the Medicare age, never mind the policy virtues or lack thereof. Why? Partly because liberals hate the idea: pay any attention to right-wing rhetoric and you learn that spite against liberals, even if there’s no gain for their side, is a major motivator. Beyond that, there is some actual strategic thinking here: by reducing the number of people receiving Medicare, they hope to undermine support for the whole program. No, really: The most important likely effect is political. Reforming Medicare is difficult in part because of resistance by beneficiaries, who hold a lot of political influence … Diminishing the size of the beneficiary class is likely to diminish resistance to further change, and while it’s not enough, it might ultimately make reform easier. “Reform”, in this case, means killing the program.
The Tom Coburn samizdat Medicare reform proposal - As reported by Ezra Klein: “If I had the magic wand,” he told me, “I’d change how we pay for Medicare.” That’s a common enough sentiment, but the policy Coburn has in mind is a bit more radical than what’s typically offered in Washington. “I’d change all physicians to time instead of fee-for- service,” he says. “What we’re doing with fee-for-service, and most people don’t realize this, is when you go to the doctor, they have this pressure to see X number of patients a day to meet their numbers.” If we cut payments to doctors, Coburn says, “they’re going to cut the time they spend per patient. When a patient is in a room and you haven’t used your skills as a physician to really listen, you walk out and cover that absence of time by ordering tests. So if you say here’s all the hours we’ll pay for if you’re a Medicare doctor, and we can actually audit that time, doctors would have to demonstrate proof that they’re spending this time with patients.” “It’s just something I’ve thought about a long time. Nobody should be seen for less than 20 or 30 minutes if you’re doing this properly. And if I knew I was going to get paid for my time I wouldn’t be in a hurry to see the next patient.” Here are further ideas on Medicare reform.
New Taxes to Take Effect to Fund Health Care Law— For more than a year, politicians have been fighting over whether to raise taxes on high-income people. They rarely mention that affluent Americans will soon be hit with new taxes adopted as part of the 2010 health care law. The new levies, which take effect in January, include an increase in the payroll tax on wages and a tax on investment income, including interest, dividends and capital gains. The Obama administration proposed rules to enforce both last week. Affluent people are much more likely than low-income people to have health insurance, and now they will, in effect, help pay for coverage for many lower-income families. Among the most affluent fifth of households, those affected will see tax increases averaging $6,000 next year, economists estimate. To help finance Medicare, employees and employers each now pay a hospital insurance tax equal to 1.45 percent on all wages. Starting in January, the health care law will require workers to pay an additional tax equal to 0.9 percent of any wages over $200,000 for single taxpayers and $250,000 for married couples filing jointly. The new taxes on wages and investment income are expected to raise $318 billion over 10 years, or about half of all the new revenue collected under the health care law.
New Health Care Taxes - Robert Pear at the NYTimes has a good piece on the high-income taxes already scheduled to begin in January: For more than a year, politicians have been fighting over whether to raise taxes on high-income people. They rarely mention that affluent Americans will soon be hit with new taxes adopted as part of the 2010 health care law. The new levies, which take effect in January, include an increase in the payroll tax on wages and a tax on investment income, including interest, dividends and capital gains. The Obama administration proposed rules to enforce both last week. Affluent people are much more likely than low-income people to have health insurance, and now they will, in effect, help pay for coverage for many lower-income families. Among the most affluent fifth of households, those affected will see tax increases averaging $6,000 next year, economists estimate.
Obamacare Pre-Existing Condition Fee To Cost Companies $63 Per Person - Your medical plan is facing an unexpected expense, so you probably are, too. It's a new, $63-per-head fee to cushion the cost of covering people with pre-existing conditions under President Barack Obama's health care overhaul. The charge, buried in a recent regulation, works out to tens of millions of dollars for the largest companies, employers say. Most of that is likely to be passed on to workers. Employee benefits lawyer Chantel Sheaks calls it a "sleeper issue" with significant financial consequences, particularly for large employers. "Especially at a time when we are facing economic uncertainty, (companies will) be hit with a multi-million dollar assessment without getting anything back for it," said Sheaks, a principal at Buck Consultants, a Xerox subsidiary. Based on figures provided in the regulation, employer and individual health plans covering an estimated 190 million Americans could owe the per-person fee.
Health care law surprise: $63 per-person fee for three years - Medical plans are facing an unexpected new fee. It's to help cover people with pre-existing conditions under President Obama's health care overhaul. The $63-per-head fee -- buried in a recent regulation -- will hit health plans serving an estimated 190 million Americans, mostly workers and their families. It's payable starting in 2014. Employers are not happy. The cost of compliance works out to tens of millions of dollars for the largest companies, maybe a few hundred for small firms. Most of that will get passed on to workers. The Obama administration says the money will cushion health insurance companies from the hard-to-predict costs of covering uninsured people with pre-existing conditions, so society will benefit in the long run. The fee is temporary, raising $25 billion over three years.
Blue Shield of California seeks rate hikes up to 20% - Health insurer Blue Shield of California wants to raise rates as much as 20% for some individual policyholders, prompting calls for the nonprofit to use some of its record-high reserve of $3.9 billion to hold down premiums. In filings with state regulators, Blue Shield is seeking an average rate increase of 12% for more than 300,000 customers, effective in March, with a maximum increase of 20%. Some consumer advocates and healthcare economists say Blue Shield shouldn't be raising rates that high when it has stockpiled so much cash. The company's surplus is nearly three times as much as the Blue Cross and Blue Shield Assn. requires its member insurers to hold to cover future claims.
Health Care Thoughts: CPA Retirement Funding Act - So I spent a part of the weekend reading summaries of the new IRS regs on the Obamacare 3.8% net investment income tax. Holy complications Batman! These rules are so complex and convoluted CPAs will spend their spare time reading yacht catalogs. Sure, the rules apply to high earners (although not that high, e.g. a two income professional couple may get whacked), but for those in the lofty category these rules are really really messy. There are lots of really difficult issues such as S-corp sales and what happens to real estate professionals. This is not the way to finance a health care system , IMHO.
Caregivers Bloodied Patients as Complaints Drew Laughter - Caregivers at a Florida center for the brain-injured beat patients, goaded them to fight each other and fondle female employees and in one instance laughed at complaints of mistreatment, according to investigative reports released under a court order to Bloomberg News. The center, the Florida Institute for Neurologic Rehabilitation, is fighting a state directive that it move about 50 patients to other facilities. That order followed a Bloomberg story revealing a history of violence at the center southeast of Tampa. At least five patients have died from alleged abuse or neglect there since 1998, two in the last two years.The Wauchula-based facility, known as FINR, draws patients from across the U.S. and abroad and is said by competitors to be the largest such rehabilitation center in the country. It often finds customers among the relatively few brain injured with legal settlements or insurance payments that enable them to pay premium prices. FINR charges some of them $300,000 a year.
America's 20 Dirtiest Cities - Forbes - The booby prize this year for Dirtiest City in America goes to Fresno, California. This Central Valley city suffers some of the worst air in the nation, and a water supply so degraded that the city used to tell pregnant women not to drink from the tap. Fresno epitomizes the environmental challenges of the Golden State. And it’s not alone. Plenty of its neighbors in central California like Modesto, Stockton and Bakersfield have it almost as bad. (Other California metro areas ranked among the 20 Dirtiest Cities include San Jose, Riverside and Los Angeles — but don’t worry, they have lots of company from towns in the Midwest and on the East Coast, too.) The environmental degradation of the Central Valley has many contributing factors. First of all, its geography doesn’t do it any favors. It’s a big, long bowl surrounded on three sides by mountains that trap pollutants from cars and factories and oil fields in an inversion layer. Second, the dried up Owens Lake kicks up clouds of alkali dust that blows throughout the area.Third, all that agricultural activity has wreaked the Valley’s groundwater. Decades of fertilizer and pesticide applications and manure from livestock have caused noxious chemicals to trickle down into the water table.When pumped back up into homes, the water regularly gives people rashes when they shower in it. Nitrates in the water can cause babies who drink it to come down with potentially fatal “blue baby syndrome.” What’s troubling is that rather than getting better, the water problem might be getting worse.
Tests Say Mislabeled Fish Is a Widespread Problem - Fish is frequently misidentified on menus and grocery store counters in New York City, even at expensive restaurants and specialty shops, DNA testing for a new study found. National supermarket chains had the best record for accuracy in seafood labeling, the researchers reported. The researchers, from the conservation group Oceana, said that genetic analyses showed that 39 percent of nearly 150 samples of fresh seafood collected from 81 establishments in the city this summer were mislabeled. The study did not identify any of the restaurants or stores, although it noted that most were in Manhattan. In some cases, cheaper types of fish were substituted for expensive species. In others, fish that consumers have been urged to avoid because stocks are depleted, putting the species or a fishery at risk, was identified as a type of fish that is not threatened. Although such mislabeling violates laws protecting consumers, it is hard to detect.
Why is there Corn in Your Coke? - A good one on the sugar quota.
FDA urged to make public information about antibiotic use - The Johns Hopkins Center for a Livable Future and the Government Accountability Project have spent a couple years asking the Food and Drug Administration (FDA) to release information about the amount of antibiotic use in farm animals. Overuse of antibiotics in farm animals may lead to the evolution of more dangerous drug-resistant strains. FDA releases some summary data each year, but denied the request for more detailed tabulations,citing an exemption in freedom-of-information law that applies to commercial information and trade secrets. This seems wrong. Misuse of antibiotics is an important public health issue, and the aggregated data requested were not firm-specific. In response, the Center for a Livable Future and the Government Accountability Project brought a lawsuit this month. The Center's director Robert Lawrence explains this week: Since 2008, when the Animal Drug User Fee Act (ADUFA) began requiring drug companies to report basic information about antibiotic sales to FDA, the agency has released limited summaries of these data to the public. Sadly, though, the FDA conceals most of what gets reported by the drug companies. This concealment protects the producers and the drug companies, both of which make tidy profits from injudicious dosing of food animals.
Secret Farm Bill Threatens An 'Environmental Cliff' - Congressional leaders in search of a compromise to avoid plunging off the “fiscal cliff” are under growing pressure from the agriculture subsidy lobby and its friends in Congress to attach a subsidy-laden farm bill to legislation ostensibly designed to straighten out the nation’s finances. Bypassing debate and hearings on a five-year, near-trillion-dollar piece of legislation would be profoundly undemocratic. It would also enshrine a bill that is as devastating for the environment as the fiscal cliff would be for the economy. Both the Senate and House versions of the farm bill include $6 billion in cuts to conservation programs. Should a new version emerge from the fiscal cliff negotiations, these misguided cuts are sure to be part of the deal. Industrial agriculture – not manufacturing, gas drilling or mining – is the largest contributor to America’s water pollution problem. And despite the high cost to taxpayers and businesses, most farm operations are exempt from the federal Clean Water Act. State governments, meanwhile, have little authority to compel farmers to control soil, pesticides and chemical fertilizers that flow off their fields and into water supplies. This leaves the farm bill’s current conservation programs – the ones slated for deep cuts – as the only line of defense.
Monsanto Gets Its Way in Ag Bill - “The Farmers Assurance Provision” is the title of a rider, Section 733, inserted into the House of Representatives 2013 Agriculture Appropriations Bill. Somehow, as a farmer, I don't feel the least bit assured.The only assurance it provides is that Monsanto and the rest of the agriculture biotech industry will have carte blanche to force the government to allow the planting of their biotech seeds. In addition, the House Agriculture Committee’s 2012 farm bill draft includes three riders – Sections 1011, 10013 and 10014. These amendments would essentially destroy any oversight of new Genetically Engineered (GE) crops by the United States Department of Agriculture (USDA). If these riders had been in place during the review of GE alfalfa, Monsanto could have requested – no they could have compelled – the Secretary of Agriculture to allow continued planting of GE alfalfa even though a federal court had ruled commercialization was illegal pending completion of an environmental impact study. Essentially, the riders would prevent the federal courts from restricting, in any way, the planting of a GE crop, regardless of environmental, health or economic concerns. USDA's mandated review process would be, like court-ordered restrictions, meaningless. A request to USDA to allow planting of a GE crop awaiting approval would have to be granted. Wow, who's next to get in on a deal like this, the drug companies?
Wheat Set to Climb as Drought Cuts Global Crop, Australia Says - Wheat prices may climb 20 percent in the year through June as drought threatens crops from the U.S. to Russia, boosting global supply concerns, said last year’s second-biggest exporter. The free-on-board Gulf price of U.S. hard-red winter wheat, the so-called world indicator price, may average $360 a metric ton in the year to June 30 from $299 a ton a year earlier, the Canberra-based Australian Bureau of Agricultural and Resource Economics and Sciences, or Abares, said today. World trade may drop 9.7 percent to 131 million tons on reduced supply, it said. Prices in Chicago have climbed 30 percent this year, making the world’s most used food-grain the best performer among the 24 commodities tracked by the Standard & Poor’s GSCI Spot Index. That may boost global food costs. Russia, last year’s third- biggest wheat exporter is bracing for its coldest winter in 20 years after farmers planted crops into parched soil. The crop in the U.S., the top shipper, is in the worst condition in at least 27 years, the U.S. Department of Agriculture said Nov. 26. “Price movements in the second half of 2012-13 are expected to be closely linked to the harvest outcomes of major exporting countries in the southern hemisphere, such as Australia and Argentina, and seasonal conditions for plantings of the 2013-14 wheat crop in the northern hemisphere,” the bureau said. Prices may average significantly higher if dry conditions persist in major producers such as the U.S., it said.
Brazil flooding the world with cheap sugar - According to the International Food Information Council Foundation, 70% of Americans are trying to consume less sugar these days. This goal however is becoming more challenging, as sugar prices hit a 28-month low due to rising supplies. WSJ: - Brazilian sugar and ethanol association Unica reported Monday that the cane-crush and sugar production in the second half of November in that region more than tripled from the same period a year ago. Usually sugar production eases in late November because most of the harvesting is done by then. "I don't think anyone anticipated such a big swing at the tail end of the harvest," said Newedge analyst Michael McDougall. He said the greater supplies from Brazil are bearish for futures prices. Why does Brazil matter so much to the sugar market? Because the nation is the largest sugar exporter in the world - by far. Globally, sugar production has been running ahead of consumption (just recently), contributing to lower prices. WSJ: - Globally, sugar production has been outstripping demand, with 6.2 million tons in excess for the marketing year that began Oct. 1, according to the International Sugar Organization. Extra production from Brazil could exacerbate the situation.
Cuba’s Free-Market Farm Experiment Yields a Meager Crop - The agriculture exchange, which sprang up last year after the Cuban government legalized a broader range of small businesses, is a vivid sign of both how much the country has changed, and of all the political and practical limitations that continue to hold it back. President Raúl Castro has made agriculture priority No. 1 in his attempt to remake the country. He used his first major presidential address in 2007 to zero in on farming, describing weeds conquering fallow fields and the need to ensure that “anyone who wants can drink a glass of milk.” No other industry has seen as much liberalization, with a steady rollout of incentives for farmers. And Mr. Castro has been explicit about his reasoning: increasing efficiency and food production to replace imports that cost Cuba hundreds of millions of dollars a year is a matter “of national security.” Yet at this point, by most measures, the project has failed. Because of waste, poor management, policy constraints, transportation limits, theft and other problems, overall efficiency has dropped: many Cubans are actually seeing less food at private markets. That is the case despite an increase in the number of farmers and production gains for certain items. A recent study from the University of Havana showed that market prices jumped by nearly 20 percent in 2011 alone. And food imports increased to an estimated $1.7 billion last year, up from $1.4 billion in 2006.
GMO giant hires retired cops to hunt down farmers - GMO giants DuPont have contracted dozens of retired law enforcement officers to begin patrolling farms in the US next year to spot any potential intellectual property theft. DuPont Co, the second-largest seed country in the world, is hoping to find farmers that have purchased contracts to use their genetically modified soybean seeds but have breached the terms of agreement by illegally using the product for repeat harvests. Should farmers replant GMO seeds licensed by DuPont, they could be sued for invalidating their contracts. “Farmers are never going to get cheap access to these genetically engineered varieties,” Charles Benbrook, a research professor at Washington State University’s Center for Sustaining Agriculture and Natural Resources, tells Bloomberg. “The biotech industry has trumped the legitimate economic interests of the farmer again by raising the ante on intellectual property.” DuPont competitors Monsanto have been known to relentlessly sue small-time farmers who have been caught abusing their own patented GMO products, but the latest maneuver is being considered by some a form of intimidation. DuPont has cut a deal with Saskatchewan-based Agro Protection International, a company that contracts mostly retired police officers to patrol potential violations of IP law.
The “Golden Rice” Fraud Continues: China Feeding Experiment - In August 2012 Greenpeace broke the story of a joint US-China human feeding experiment with GMOs conducted upon Chinese schoolchildren. The feeding experiment took place in 2008. A Tufts cadre smuggled “golden rice” into China (which has strict import restrictions for GMOs). This GM rice was then fed to schoolchildren in the Hunan province. Chinese technicians presented the parents with consent forms which concealed the fact that GMOs were to be used. They told them it would be normal rice. When the crime was made public and the government launched an investigation, the lead Chinese experimenter tried to cover it all up. This didn’t work, and the government has now fired three upper-level technocrats who led the experiment. That’s impressive in this age of shameless, openly criminal hierarchy. More typical is the reaction of Tufts University, which issued a bland statement, in an annoyed tone, dismissing the Chinese action and referring to its own “investigation”, which we can be sure will be swift, thorough, and seek truth and justice, and won’t be a whitewash at all.
Peak Phosphorous: What Can we Expect? - In an editorial called Be persuasive. Be brave. Be arrested (if necessary) (if necessary) which recently appeared in the science journal Nature, Jeremy Grantham argues that the world's supply of phosphorus and potash is at risk. For your convenience, I have included a graph which appeared in my one and only post on this subject Phosphorus In The Age Of Scarcity..Then there is the impending shortage of two fertilizers: phosphorus (phosphate) and potassium (potash). These two elements cannot be made, cannot be substituted, are necessary to grow all life forms, and are mined and depleted. It’s a scary set of statements. Former Soviet states and Canada have more than 70% of the potash. Morocco has 85% of all high-grade phosphates. It is the most important quasi-monopoly in economic history.What happens when these fertilizers run out is a question I can’t get satisfactorily answered and, believe me, I have tried. There seems to be only one conclusion: their use must be drastically reduced in the next 20–40 years or we will begin to starve. The world’s blind spot when it comes to the fertilizer problem is seen also in the shocking lack of awareness on the part of governments and the public of the increasing damage to agriculture by climate change. Grantham's lugubrious forecast has apparently enraged Vaclav Smil, who wrote a rebuttal called Jeremy Grantham, Starving for Facts. This article appeared yesterday (December 5, 2012) in the online magazine American, which is published by the often less-than-credible American Enterprise Institute. (That is not to say that Smil is not credible.)
Could the rise in CO2 levels play havoc with global food supplies? - Goldman recently published a report discussing global carbon emissions (see discussion on cap & trade issues). Apparently the amount of carbon in the atmosphere now is the highest in over 400,000 years (chart below). Researchers use small air bubbles trapped in the antarctic ice sheets over time to determine historical carbon (CO2) levels.It is difficult to determine what impact this is having on global weather patterns, but between last July being the hottest month on record (since record-keeping started in 1895), and Hurricane Sandy veering inland due to irregular jet stream patters, people are beginning to take this more seriously. In particular the impact on global food supply is a concern because the loss in yield during "bad" years is not recovered during periods of favorable weather (see chart below - this pattern resembles the P&L of a short options portfolio). It means that if what happened this past summer becomes a more frequent occurrence, the impact on global food supplies could be devastating.
2012 Is The Hottest, Most Extreme Year In U.S. History - A warm November and record-breaking early December means 2012 will be the warmest year ever for the U.S. As Jeff Masters reports:…the U.S. heated up considerably in November, notching its 20th warmest November since 1895, said NOAA’s National Climatic Data Center (NCDC) in their latest State of the Climate report. The warm November virtually assures that 2012 will be the warmest year on record in the U.S. The year-to-date period of January – November has been by far the warmest such period on record for the contiguous U.S.–a remarkable 1.0°F above the previous record. During the 11-month period, 18 states were record warm and an additional 24 states were top ten warm. The December 2011 – November 2012 period was the warmest such 12-month period on record for the contiguous U.S., and the eight warmest 12-month periods since record keeping began in 1895 have all ended during 2012. December 2012 would have to be 1°F colder than our coldest December on record (set in 1983) to prevent the year 2012 from being the warmest in U.S. history. This is meteorologically impossible, given the recent December heat in the U.S. As wunderground’s weather historian Christopher C. Burt reported, an early-December heat wave this week set records for warmest December temperature on record in seven states. December 2012 is on pace to be a top-20% warmest December on record in the U.S. The NCDC’s Climate Extremes Index (CEI), which “tracks the percentage area of the contiguous U.S. experiencing top-10% and bottom-10% extremes in temperature, precipitation, and drought,” reports it has also been the most extreme January to November period on record. Some 46% of the continental U.S. saw top-10% extreme weather, which is more than double the average:
Mother Nature Is Just Getting Warmed Up: Record-Smashing Early December Assures 2012 Will Be Hottest In U.S. History - We’ve had spring weather in early December — and that guarantees 2012 will be the hottest year on record for the United States. I had reported on Monday that 2012 was virtually certain to be the hottest on record thanks to the warm November and blistering early December. Now Climate Central has done the math: The chart above is Climate Central’s projection of the 2012 temperature using observations through December 10 and an estimate of typical temperatures for the final 21 days of the month. If this holds true, then 2012 will blow out the previous record (1998) by more than 1°F. How warm was early December? As Capital Climate calculates using National Climatic Data Center (NCDC) figures: For the first 10 days of December, new daily record high temperatures have outnumbered record lows by a ratio of 92 to 1. For the 48 contiguous states, the ratio was an incredible 132 to 1, since 3 out of the 10 low records were in Alaska and Hawaii. During the entire week of December 2-8, not a single low temperature record was tied or broken in any of the 50 states, according to NCDC reports. With 3 weeks remaining in the year, the cumulative ratio of heat records to cold records for 2012 has reached 6.0 to 1, more than double the ratio in 2011.
A New Report on Iowa’s Water Quality - Since farming is now “industrial”, shouldn’t agricultural producers have to abide by industrial rules and regulations? The Environmental Working Group issued a new report on the health of Iowa’s waters. They studied Iowa’s rivers and streams and found that the Clean Water Act, which became law forty years ago, does little to address agricultural pollution, and there is an ongoing lack of direction coming from Washington D.C. Agricultural water pollution made it necessary for Iowa’s largest city of Des Moines to build one of the largest nitrate-removal plants in the world to clean its drinking water. To follow, are a few key excerpts from the EWG’s report.
Mississippi River May Shut Down Due To Low Water Levels: Sections of the Mississippi River may shut down due to extremely low water levels, according to KTVI-TV. The recent drought has caused parts of the Mississippi River to dry up. Although many believe an increase in flow from the Missouri River would help these troubled areas, the Army Corps of Engineers is instead cutting back. If something isn’t done soon to correct the problem, oil, farm, manufacturing, steel, and river industry leaders fear that thousands of jobs will be lost. The Tennessean reports that Army Assistant Secretary Jo-Ellen Darcy doesn’t feel that increasing the flow from the Missouri River to the Mississippi River is the right plan of action at this moment in time. Politicians and business owners feel otherwise. US Senator Claire McCaskill believes the Army Corp of Engineers will ultimately be to blame if things taken a turn for the worse in the coming months.
200 miles of Mississippi River could shut down - video -Business and politicians are very concerned about the falling water levels on the Mississippi River and the impact it could have on surrounding states. HLN reports the river could get too low for barges to get through as early as next year. USA Today reports the portion of the river that could get shut down spans 200 miles. The Christian Science Monitor says the first official estimate of drought damages from the U.S. Department of Agriculture range from $60 billion to $100 billion.
Climate Change Forces the Mississippi River to Shut Down - It was only yesterday when the news broke that the lack of snow brought about by climate change had to be hold accountable for the fact that the tourism industry in the US was losing both profits and job opportunities. Coupled with the severe droughts that have recently hit the country, the same record low snowfalls are now listed as the main reasons for which the Mississippi River might soon be forced to shut down for navigation. Having the Mississippi River no longer available for navigation purposes is bound to translate into the country's economy losing yet another $2 billion (roughly €1.54 billion). Environmental Leader explains that, according to a report published by the US National Oceanic and Atmospheric Administration, a mere 7% of the country's entire surface is presently covered in snow. As if this were not enough, 60.2% of the contiguous US is still experiencing drought conditions. Because of this, the American Wetlands Foundation went as far as to state that, all things considered, the portion of the Mississippi found between St. Louis and Cairo, Illinois, is quite likely to no longer support navigation as early as next month.
U.S. Drought Expands In Kansas, Oklahoma And Texas: (Reuters) - Drought continued to expand through many key farming states within the central United States in the past week, as scattered rainfall failed to replenish parched soils, according to a report issued Thursday by state and federal climatology experts. Drought conditions were most pervasive in the Plains states, including in top wheat producer Kansas, according to the Drought Monitor report. Fully 100 percent of Kansas was in at least "severe" drought as of Tuesday, up from 99.34 percent a week earlier, according to the Drought Monitor, and almost 78 percent remained in at least "extreme drought," the second-worst level of drought. Conditions in Nebraska were unchanged, with 96.15 percent of the state in extreme drought, while the situation worsened in Oklahoma, where the percentage of the state in at least extreme drought increased to 90.92 percent from 90.56 percent a week earlier. Texas drought conditions also worsened over the last week, with more than 32 percent of the state in at least extreme drought, up from 27.40 percent a week earlier, and more than 65 percent in at least severe drought, up from 59.27 percent, the Drought Monitor report said. Overall, roughly 61.87 percent of the contiguous United States was in at least "moderate" drought, a slight improvement from 62.37 percent a week earlier. The portion of the contiguous United States under at least "severe" drought expanded, however, to 42.59 percent from 42.22 percent.
Will the West ever solve its water woes?: The Colorado River provides fresh water to nearly 40 million people in seven states out west: Arizona, California, Nevada, Colorado, New Mexico, Utah and Wyoming. A sizable chunk of U.S. agriculture relies on that water — about 15 percent of the nation’s crops and 13 percent of its livestock. (Indeed, the vast majority of the river’s water is used for irrigation and agriculture.) But there’s a problem: The Colorado River may soon no longer have enough water to satisfy the region’s needs. Thanks to rapid population growth in cities like Las Vegas and Phoenix, water demand is surging. Meanwhile, the supply of water is dropping — and could keep dropping as climate change speeds evaporation, shrinks the snow pack in the Rocky Mountains, and makes droughts more likely. By some recent estimates, annual flows could drop up to 20 percent by mid-century. The dilemma is laid out in a big new report from the U.S. Bureau of Reclamation, looking at the future of the Colorado River. The chart below sums things up. The authors of the study took the best estimates of future population growth in the region and paired them with estimates of future water supply. Trouble ensues:
Sans Polar Satellites, Sandy Forecasts Would've Suffered - Five days before Hurricane Sandy plowed into coastal New Jersey — driving a wall of water over the iconic Jersey Shore boardwalks and deep into portions of New York City — a computer model run by a European weather modeling center accurately predicted its track and strength, causing weather forecasters to sound the alarm. Now that weather center, as well as the U.S. National Oceanic and Atmospheric Administration (NOAA), are warning that without an operational fleet of polar-orbiting satellites, the European model would have missed that forecast, instead predicting that Sandy would have headed out to sea well east of New Jersey. In an analysis NOAA released on Tuesday, but which was first reported in November by the Washington Post’s Capital Weather Gang blog, meteorologists at the European Center for Medium-Range Weather Forecasts (ECMWF) in Reading, England, re-ran their computer model after depriving it of the data that comes from the current fleet of polar-orbiting satellites. The test was done because cost overruns, launch setbacks, and bureaucratic delays in the U.S. satellite program threaten to cause a gap of a year or more between when one of the current polar-orbiting satellites — known as the Suomi NPP — reaches the end of its design lifetime in 2016, and when the next polar-orbiting satellite is ready for launch in 2017, at the earliest.
What Made Sandy So Destructive? - The New Jersey State Climatologist David A Robinson Ph.D. has posted a preliminary report on the recent storm that created devastating damage in New Jersey and also New York State. It is posted on the NJ Office of the Climatologist website. It is a preliminary report. A more complete report may be posted shortly. In this four page report Dr. Robinson makes a number of very significant statements about the conditions in place at the time Sandy slammed into New Jersey. These conditions, according to Dr. Robinson, included:
- A blocking high-pressure system sitting over the North Atlantic east of the Canadian Maritimes. The block, along with a central Atlantic Area of low pressure, were both preventing Sandy’s northeastward progress and suggested that the storm would turn and track to the northwest.
- A vigorous early cold season dip in the jet stream , a trough that that was advancing from central North America toward the East Coast
- As the U-shaped trough began to approach the coast it felt the influence of the blocking high and began to assume a negative tilt.
- Adding insult to injury was the arrival of the storm when the moon was full, thus tides astronomically high.
Global Trends 2030 Predicts Water Struggles And Climate Change Challenges: — The United States could see its standing as a superpower eroded and Asian economies will outstrip those of North America and Europe combined by 2030, according to the best guess of the U.S. intelligence community in its latest forecast. "The spectacular rise of Asian economies is dramatically altering ... U.S. influence," said Christopher Kojm, chairman of the National Intelligence Council, as it released the report Global Trends 2030 on Monday. The report is the intelligence community's analysis of where current trends will take the world in the next 15 to 20 years. Its release was timed for the start of a new presidential administration and it is aimed at helping U.S. policymakers plan for the future. The report also predicted the U.S. will be energy independent. The study said that in a best-case scenario, Americans, together with nearly two-thirds of the world's population, will be middle class, mostly living in cities, connected by advanced technology, protected by advanced health care and linked by countries that work together, perhaps with the United States and China cooperating to lead the way.
The Great Migration of the 21st Century - One lesson we should keep in mind as we recover in the aftermath of Sandy is that we are slow learners. Although the vulnerability of many of these communities is undeniable, we have resolved to rebuild the homes. That resolve will no doubt weaken if the region is revisited by similar disasters, and those displaced will be forced to move on. If climate change is at the root, that will happen. There will be a crescendo of such disasters, replaying thousands of times in populated areas across the globe. Hurricane Sandy thus has given us a glimpse into what will be the dominant theme of the twenty first century: forced migration. The migration may be into uncontested, virgin land; what is referred to as wave migration. Or it may be migration into other populated areas, which can lead to a new elite displacing the existing elite, to changes in status and a redistribution of wealth, but with the two societies existing side by side. A third type of migration, prominent in the barbarian period in the first millennium CE, is not based on economic need or population constraints, but on a nomadic culture pillaging the riches of the lands they invade. I can envision any of these migration models playing out in the next century. Gradual migration and assimilation, or a gradual replacement of the indigenous population with a new elite, or one of invasion and warfare. Or wave migration; less likely but particularly interesting because the very effects of climate change will open up new, previously uninhabitable land even as flood and drought make other land uninhabitable. How bad can this sort of thing get?
U.S. Senator Protests Climate Talks With Activist Who Believes The UN Is The Anti-Christ Senator James Inhofe (R-OK), the lead Republican on the Senate Committee on Environment and Public Works, held a climate-denial press conference at the UN Framework Convention on Climate Change on Thursday. Accompanying Inhofe were two rather questionable characters: an activist who believes the UN is starting the apocalypse and a British Lord who was banned from all UN climate conferences for impersonating the representative from Myanmar. Inhofe’s first guest, Cathie Adams, is the President of the Texas Eagle Forum and former Texas GOP chair. She must have felt quite uncomfortable speaking at a United Nations function, as she has maintained for over a decade that the UN was the anti-Christ’s vehicle for stealthily taking over the world. From a 1999 newsletter: The Bible tells us that in the end times there will be a world government headed by a world leader, called the anti-Christ, who will profess a world religion, but did you ever think you would live in the day when these things would come into being? That is exactly what the United Nations is doing behind the backs of most Americans.
UN Climate Conference: Kyoto Protocol Extended At Doha, Qatar Talks: Seeking to control global warming, nearly 200 countries agreed Saturday to extend the Kyoto Protocol, a treaty that limits the greenhouse gas output of some rich countries, but will only cover about 15 percent of global emissions. The extension was adopted by a U.N. climate conference after hard-fought sessions and despite objections from Russia. The package of decisions also included vague promises of financing to help poor countries cope with climate change, and an affirmation of a previous decision to adopt a new global climate pact by 2015. Though expectations were low for the two-week conference in Doha, many developing countries rejected the deal as insufficient to put the world on track to fight the rising temperatures that are shifting weather patterns, melting glaciers and raising sea levels. Some Pacific island nations see this as a threat to their existence.
Despair after climate conference, but UN still offers hope (Reuters) - At the end of another lavishly-funded U.N. conference that yielded no progress on curbing greenhouse emissions, many of those most concerned about climate change are close to despair. As thousands of delegates checked out of their air-conditioned hotel rooms in Doha to board their jets for home, some asked whether the U.N. system even made matters worse by providing cover for leaders to take no meaningful action. Supporters say the U.N. process is still the only framework for global action. The United Nations also plays an essential role as the "central bank" for carbon trading schemes, such as the one set up by the European Union. But unless rich and poor countries can inject urgency into their negotiations, they are heading for a diplomatic fiasco in 2015 - their next deadline for a new global deal. "Much much more is needed if we are to save this process from being simply a process for the sake of process, a process that simply provides for talk and no action, a process that locks in the death of our nations, our people, and our children," said Kieren Keke, foreign minister of Nauru, who fears his Pacific island state could become uninhabitable.
A “low ambition” outcome in Doha - The annual UN climate conference concluded in Doha last Saturday with “low ambition” both in emission cuts by developed countries and funding for developing countries The UN Climate Conference in Doha ended last Saturday with the adoption of many decisions, including on the Kyoto Protocol’s second period in which developed countries committed to cut their emissions of Greenhouse gases. Many delegates left the conference quite relieved that they had reached agreement after days of wrangling over many issues and an anxious last 24 hours that were so contentious that most people felt a collapse was imminent. The relief was that the multilateral climate change regime has survived yet again, although there are such deep differences and distrust among developed and developing countries. The conflict in paradigms between these two groups of countries was very evident throughout the two weeks of the Doha negotiations, and it was only papered over superficially in the final hours to avoid an open failure. But the differences will surface again when negotiations resume next year. Avoidance of collapse was a poor measure of success. In terms of progress towards real actions to tackle the climate change crisis, the Doha conference was another lost opportunity and grossly inadequate.
Doha schmoha: On Saturday (Dec. 8) another wildly unsuccessful round of climate negotiations, in Doha, Qatar, concluded with applying a band aid to solve the rapidly accelerating climate problem. The 1997 Kyoto accord was extended to 2020. If you think this is a good thing, you are severely mistaken. China, the US and the other usual suspects made no significant concessions. Further, the climate leader — the EU — is internally in disagreement over what reductions should be agreed to. ... While academics have proposed a number of interesting avenues for further studies of so called architectures for future agreements, time is slowly running out. It is simply too difficult to get 200+ countries to agree and then stick to a binding agreement. So what to do? I think a simple handshake between the U.S. and China would be a good start. Each agrees to a carbon tax which is collected fairly far upstream. Any country wanting to sell its goods into the U.S. or Chinese markets could either pay a carbon tariff at the border or start charging its own equivalent carbon tax and be exempt from the tariff. Is this going to happen? Maybe not... But one thing is for sure: We are becoming richer as a species and we will want to consume more energy services. Unless we start pricing carbon, that energy will largely come from coal. And if that happens, limiting warming to 2 degrees is a pipe dream. In fact, it may already be too late.
Scientists Forecast Dramatic Temperature Increase - Pessimism has emerged from the UN Climate Conference in Doha, Qatar. Governments are failing to take realistic steps to combat global warming, despite rising costs associated with extreme weather and rising tidal waters. And researchers are reporting that goals to limit the average increase in Earth’s temperature to 2 degrees Celsius, or 3.6 degrees Fahrenheit, are unrealistic. Instead, current activities could increase Earth’s temperatures by as much as 5 degrees Celsius, with devastating effects, reports Christoph Seidler for Spiegel Online. The effects of releasing huge amounts of carbon into the atmosphere will linger for decades. Convincing humans to change behavior for results that won’t be seen for decades is proving to be a challenge. Europe has decreased carbon emissions, but emissions from emerging economies are rapidly climbing. China is the biggest emitter at 28 percent and the US follows at 16 percent, according to one research study. Nations are negotiating emissions rates that exceed the 2-degree rise, promising melting polar caps and other devastating consequences. – YaleGlobal
Carbon emissions in 2040's US projected to be below 2005; cap & trade programs ineffective as emissions shift to emerging markets - One of the reasons for the failure of the so-called cap & trade program in the US (other than political), has to do with the fact that carbon emissions have declined on their own - without any caps. And why would a company pay for an emissions "allowance" if it can stay under the cap without it. Of course politically it made no sense to force companies to pay at the time when they were emitting materially less carbon on their own. Furthermore, there was no incentive for investors to hold these contracts because each year the long-term projections for carbon emissions in the US have declined. Carbon emissions in 2040 US are now projected by the EIA to be below that of 2005. The sharp declines first took place during the financial crisis, as companies simply produced less and therefore emitted less. Two major factors driving lower emission projections have to do with slower economic growth and increasing usage of natural gas. Other factors are at play as well.
EIA projections for carbon dioxide emissions reflect changes in key drivers - Projections for U.S. energy-related carbon dioxide (CO2) emissions have generally been lowered in recent editions of the Annual Energy Outlook (AEO), the long-term projections of the U.S. Energy Information Administration. The lowered projections reflect both market and policy developments that have reduced recent and projected growth in energy demand and its expected carbon intensity. The chart presents projected energy-related CO2 emissions from AEOs issued since 2009 in terms of changes relative to emissions in 2005, a commonly used comparison year, particularly with regard to mitigation targets. EIA's AEO reflects laws and regulations in place at the time the analysis was performed. New policies are incorporated in subsequent editions of the AEO as they are put in place. For example, updated fuel efficiency standards for light-duty and heavy-duty vehicles were incorporated in AEO2012 and AEO2013, tending to lower CO2 emissions relative to earlier projections. The CO2 projection in AEO2013 generally falls below that in AEO2012, and remains more than 5 percent below the 2005 level throughout a forecast horizon that for the first time extends to 2040. However, near-term expectations of industrial growth in response to the availability of low-priced natural gas result in somewhat higher projected levels of CO2 emissions at the end of the current decade than in last year's outlook.
Report: IPCC Underestimates Climate Risks - Across two decades and thousands of pages of reports, the world's most authoritative voice on climate science has consistently understated the rate and intensity of climate change and the danger those impacts represent, say a growing number of studies on the topic. This conservative bias, say some scientists, could have significant political implications, as reports from the group – the U.N. Intergovernmental Panel on Climate Change – influence policy and planning decisions worldwide, from national governments down to local town councils. As the latest round of United Nations climate talks in Doha wrap up this week, climate experts warn that the IPCC's failure to adequately project the threats that rising global carbon emissions represent has serious consequences: The IPCC’s overly conservative reading of the science, they say, means governments and the public could be blindsided by the rapid onset of the flooding, extreme storms, drought, and other impacts associated with catastrophic global warming.
Report: IPCC Is Underestimating Climate Threat - The Intergovernmental Panel on Climate Change, or IPCC, is a favorite punching bag for climate deniers. The panel, made up of scientists from around the world who evaluate and coalesce the best and latest science on climate change, issues new reports every five to six years; the fifth report is will begin rolling out in 2013. But while deniers love to cry that the IPCC is "alarmist," the comparison between what the panel has predicted over the last 20 years and what actually panned out in the real world shows that the IPCC has "consistently underestimated" the impacts, according to a new report highlighted by the Daily Climate. The piece draws from new research from Naomi Oreskes, a history and science professor at University of California—San Diego, and Michael Oppenheimer, a geoscientist at Princeton University. Among the examples of the panel's conservative predictions: The drastic decline of summer Arctic sea ice is one recent example: In the 2007 report, the IPCC concluded the Arctic would not lose its summer ice before 2070 at the earliest. But the ice pack has shrunk far faster than any scenario scientists felt policymakers should consider; now researchers say the region could see ice-free summers within 20 years. Sea-level rise is another. In its 2001 report, the IPCC predicted an annual sea-level rise of less than 2 millimeters per year. But from 1993 through 2006, the oceans actually rose 3.3 millimeters per year, more than 50 percent above that projection.
UNEP report urges IPCC to address permafrost CO2 and CH4 emissions - The United Nations Environment Program (UNEP) released a report early Tuesday morning that recommended the Intergovernmental Panel on Climate Change (IPCC) address the impact of warming permafrost and the large volume of methane and carbon dioxide that will be emitted from the ground if permafrost continues to melt. The report argues that these additional emissions should be considered in any international negotiation of emissions targets and discussion of climate change policy. The UNEP report, called “Policy Implications of Warming Permafrost,” recommended that the IPCC commission a special report to address the impact of permafrost emissions. It also urged the panel to create a separate, national permafrost-monitoring network, in order to standardize and expand the monitoring of these emissions. That network would include countries such as the United States, Russia, Canada, and China, which have some of the largest areas of permafrost. “The infrastructure we have now is not adequate to monitor future changes in permafrost,” said lead author Kevin Schaefer, a research scientist at the National Snow and Ice Data Center (NSIDC) in a press release. “We need to greatly expand our current networks to monitor permafrost, which requires direct investment of money and resources by individual countries.” Permafrost is the soil in high latitudes that stays frozen year-round. It occupies nearly 24% of the land in the Northern Hemisphere. In order to qualify as permafrost, the soil temperature must remain below 32 °F for at least two years, but there are thick seams of permafrost that have remained solid for thousands of years.
The World Cannot Afford Exxon’s Outlook for the Future - ExxonMobil recently issued its latest global energy projections in a report called the “2013 Outlook for Energy: a view to 2040.” The report (pdf) is chock full of figures and graphs showing an inexorable rise in global energy demand and supply, as well as the growing market for Exxon’s products. As can be expected, the report shows that despite some recent efficiency gains, the world is on course to consume ever growing amounts of energy, a large proportion of which will likely be derived from fossil fuels. Exxon places global growth in energy demand at 35% between 2010 and 2040. In this regard, the report is in line with recent business-as-usual forecasts from the International Energy Agency (IEA) and the U.S. Department of Energy’s Energy Information Administration (EIA). But the report differs greatly from the IEA’s report in some vital areas. The IEA is a public agency, funded by the tax dollars of developed countries including the United States, while Exxon is the world’s largest private oil and gas company, with a self-interested agenda behind every public communication it makes. It’s perhaps no surprise that the Exxon Outlook fails to mention that if energy demand were to rise 35% to 2040, and if 60% of energy demand in 2040 were to be met by oil and gas as Exxon predicts (the IEA has it at 50%), then the planet would be on an unstoppable collision course with a 4 degree Celsius warmer world. While the IEA’s report was very clear about where current energy demand trends will lead it was also clear that this could be avoided if serious action is taken soon.
US intelligence community warns of rising climate security threat - Climate change has the potential to stoke regional instabilities and fuel international tensions, according to a major new report from the US National Intelligence Council. Released yesterday, the Global Trends 2030 report seeks to map out the security trends that will shape international relations over the next two decades. It is the latest in a series of studies from national security bodies around the world to acknowledge that climate change and its likely impacts on food, water, and natural resource supplies represents an emerging security threat. "Demand for food, water, and energy will grow by approximately 35, 40 and 50 per cent respectively, owing to an increase in the global population and the consumption patterns of an expanding middle class," the report states. "Climate change will worsen the outlook for the availability of these critical resources." The report argues that scarcities can be avoided, but only if co-ordinated steps are taken to improve productivity and efficiency across a raft of industries and economies.
ESA: Clearest evidence yet of polar ice losses - After two decades of satellite observations, an international team of experts brought together by ESA and NASA has produced the most accurate assessment of ice losses from Antarctica and Greenland to date. This study finds that the combined rate of ice sheet melting is increasing. Watch the animation in full resolution The new research shows that melting of the Antarctic and Greenland ice sheets has added 11.1 mm to global sea levels since 1992. This amounts to about 20% of all sea-level rise over the survey period. About two thirds of the ice loss was from Greenland, and the remainder was from Antarctica. Although the ice sheet losses fall within the range reported by the Intergovernmental Panel on Climate Change in 2007, the spread of the estimate at that time was so broad that it was not clear whether Antarctica was growing or shrinking. The new estimates are a vast improvement – more than twice as accurate – thanks to the inclusion of more satellite data, and confirm that both Antarctica and Greenland are losing ice. The study also shows that the combined rate of ice sheet melting has increased over time and, altogether, Greenland and Antarctica are now losing more than three times as much ice, equivalent to 0.95 mm of sea-level rise per year, as they were in the 1990s, equivalent to 0.27 mm of sea level rise per year.
Yikes! Government Details 6 Most Terrifying Arctic Trends The National Oceanic and Atmospheric Administration (NOAA) published its seventh-annual Arctic Report Card this week, and though they didn't hand out a grade as they have in the past, it might as well be marked "G" for grim. Here are six of the biggest problems up north.The National Oceanic and Atmospheric Administration (NOAA) published its seventh-annual Arctic Report Card this week, and though they didn't hand out a grade as they have in the past, it might as well be marked "G" for grim. Here are six of the biggest problems up north. Virtually the entire length and width of the surface of the Greenland ice sheet melted for the first time in 2012. This year was also the longest melt season ever witnessed. Snow cover extent in both Eurasia and North America hit new record lows in June—the third time in five years that North America has set a new record low and the fifth year in a row that Eurasia has. The rate of June snow cover loss over Northern Hemisphere lands between 1979 and 2012 is -17.6 percent per decade—a faster decline than sea ice loss. Loss of spring snow cover affects the length of the growing season, the timing and dynamics of spring river runoff, permafrost thawing, and the yearly breeding and migratory clocks of wildlife. Arctic sea ice reached its smallest coverage, or extent, on record, 18 percent smaller than the previous record low set only five years ago and 49 percent below the 1979-2000 average. As the ice pack shrinks the ocean absorbs more sunlight and warming accelerates causing even more ice loss. Consequently wind patterns, clouds, ocean currents, and ecosystems are undergoing rapid transformations. Arctic sea ice used to persist for many years, getting older and thicker with each passing year. And that's what's happening in the 21st century, as you can see in the animation showing ice volume from 1987 to 2012 (below). Watch how old sea ice, on which so much Arctic life depends, is fast disappearing.
2012 Greenland records - Some of the data concerning last summer's impact on the Greenland ice sheet has been released in a first paper by M. Tedesco, X. Fettweis, T Mote, J. Wahr, P. Alexander, J. Box, and B. Wouters: Evidence and analysis of 2012 Greenland records from spaceborne observations, a regional climate model and reanalysis (PDF). As it says on the Greenland Melting blog: Overall, in 2012 ALL of the considered parameters (albedo, bare ice, surface mass balance, melting, total mass change, etc.) set a new record! Records all around, not just for the Arctic sea ice. These two graphs say it all: Al writes: "I scaled the data off the graph & produced a graph of rate of mass loss which shows the year October 2011-September 2012 has smashed through the 500 Gt/year barrier with a value of 570 Gt/year."
Farming to the fore as Greenland ice thaws - "It is not all good," Jensen explained. "The past summer was very warm, but it doesn't just get hotter, the climate patterns change as well and we had a pretty severe drought here which led to very bad crops for many farmers." Still, rising temperatures offer a lot of potential that Greenland is trying to tap into, hoping that farming will prevail here if the infrastructure, like watering systems, is in place. In addition, the receding glaciers also mean that there will be more land will be available for commercial use. Besides farming, an abundance of natural resources are also coming to light and prospecting companies are already busy, hoping for a bonanza. Flying over parts of Greenland it is easy to see exploratory mines and many firms are already in talks with Greenland's government in hopes of exploiting everything from coal to iron, gold, diamonds, and even uranium. Some believe Greenland could because the next Kazakhstan referring to that countries abundance of natural resources. The branch of agriculture with the longest tradition by far is sheep herding. CNN's crew visited the biggest sheep farm in Southern Greenland with about 800 animals during lambing season, when baby sheep are born every few minutes. The land belongs to Aqalooraq Frederiksen, a third generation farmer, who says his business is getting better with rising temperatures.
PIOMAS December 2012 - Another month has passed and so here is the updated Arctic sea ice volume graph as calculated by the Pan-Arctic Ice Ocean Modeling and Assimilation System (PIOMAS) at the Polar Science Center: Last month I wrote: The 2012 trend line isn't quite hugging the 2011 trend line as much as the latter hugged the 2010 trend line, keeping a polite distance. It's still 1069 and 1537 km3 below 2011 and 2010 respectively. Hopefully the trend line starts pulling up a bit. Unfortunately, it seems the trend line didn't pull up and has stayed in position, still 1099 and 1136 km3 below 2011 and 2010 respectively. Here is Wipneus' version of the same grpah, for the first time with a calculated "expected" value for 2013 (dotted lines), based on the same date values of 1979-2011 and an exponential trend. A caveat from Wipneus: "Note that the statistical error bars are quite large."
Something Wicked This Way Comes. - Probably the best analogue for the current Anthropogenic Global Warming (AGW) is the Paleocene Eocene Thermal Maximum (AGW). How good an analogue is it, and are we really at risk of re-running it? I think we are going to re-run the PETM, not in the sense that we are likely to achieve the same absolute temperatures, although that may be possible, but in the sense that a temperature increase of at least 3degC is achievable from our fossil fuel emissions alone and this will be amplified by methane and carbon dioxide emissions from the Arctic region causing a d13C drop as seen in the PETM. Talk of lowering to 350pm or keeping temperature below 2degC is idle fantasy. The Paleocene, before the PETM, was warmer than now, it's been hard to pin down by how much. Robert Rhode has produced this useful graphic, which suggests temperatures were of the order of 4 degC higher than preindustrial, however the PETM itself seems to have involved a temperature increase of about 6degC, the temperature rise in that graphic is much less. The PETM was a minor extinction event, there were no large losses of species on land, and the ocean extinction was restricted to bottom dwellers in the deeps of the oceans in certain regions, probably due to anoxia, which was likely due to changes in ocean overturning circulation. However with regards land species, during the PETM, mammals radiated profusely which indicates environmental stress, changes in the environment driving evolution to suit new niches and niches made available by the decline or movement of other species.
ExxonMobil punches hole in carbon tax bubble - -ExxonMobil said Tuesday that it does not support imposing a carbon tax as a way to raise revenue and help avoid the fiscal cliff — further deflating hopes that the long-shot proposal could find its way into the final deal. Energy experts from both parties, as well as some conservative economists, have been promoting a tax on carbon emissions despite resistance from congressional Republicans and reluctance from the White House. And some advocates have pointed to the fact that a carbon tax has drawn support even from bulwarks of corporate America like ExxonMobil, which has backed the idea since at least 2009. But the company's support goes only so far, Vice President of Public and Government Affairs Ken Cohen said Tuesday. A “revenue-neutral” carbon tax is the oil company’s preferred option only if policymakers are moving forward with putting a price on carbon as an effort to address climate change, Cohen said.
In Florida, An Actual Bipartisan Discussion On How To Deal With Climate Change - Unlike Congress, these public officials aren’t debating the facts of climate change and its impacts or whether we should act. They see current effects and understand that in the face of streets flooding more regularly, drinking water supplies threatened by salinization, and models showing that some neighborhoods could become uninhabitable, what political party you support is irrelevant. Climate change impacts like sea level rise don’t discriminate between Democrats and Republicans. As Congress continues to fail to address climate change at the national level, local officials from Florida’s Broward, Miami-Dade, Monroe, and Palm Beach counties—representing a combined population of 5.6 million—established the four-county Southeast Florida Regional Climate Change Compact and recently completed a 110-point regional action plan. They have developed mitigation and adaptation strategies through joint efforts, which can inform policy-making and government funding at the state and federal levels. Panelists at the summit discussed the tens of millions of dollars already spent on new wells to replace those that have had saltwater seep into them and the hundreds of millions of dollars needed for new drainage systems in Miami. Meanwhile, people having side conversations talked of the Florida Keys eventually becoming a reef and parts of the state’s valuable beachfront property no longer being inhabitable. The fact that Florida is built on porous limestone makes the adaptation challenges even more daunting, as sea water will seep under any barriers that could be constructed.
China Allocates $2 Billion of Solar Subsidies, Xinhua Says - Bloomberg: China allocated a total of 13 billion yuan ($2 billion) this year from central government funds for domestic solar installations, Xinhua News Agency reported. The funds will be spent on solar power demonstration projects with 5.2 gigawatts of capacity, Xinhua said, citing an unidentified official from the Ministry of Finance. China will provide an incentive of 5.5 yuan a watt for projects whose developers will consume the power for their own use. The subsidies will be raised to 18 yuan a watt for residential systems and 25 yuan a watt for independent photovoltaic power plants, the government-owned news agency said. China started offering the subsidies since 2009 to bolster the use of solar power. The nation chose 4.5 gigawatts of solar projects eligible for subsidies under the so-called Golden Sun program this year.
Is The U.S. In The Middle Of A Solar Boom? - In reality, the U.S. solar industry installed record amounts of solar in 2011 while bringing in nearly $2 billion in venture capital. And moving into 2012, that trend continued. In the second quarter of this year, U.S. solar installations jumped 116 percent over the same period in 2011, partly driven by large installations supported by the very loan guarantee program that Romney claimed was killing solar. And according to Shayle Kann, vice president of research at GTM Research, that deployment was just “the opening act” for the final quarter of this year. According to a new report from GTM and the Solar Energy Industries Association, the U.S. market could see 1.2 gigawatts of solar photovoltaics installed through January, bringing 2012 installations to 3.2 gigawatts. That’s enough capacity to power about half a million average American homes.
A Renewable Version of the Oil Sands - in Nova Scotia - On an average day, about 160-billion tonnes of seawater flows into the Bay of Fundy. That's more than four times the combined flow of all of the freshwater rivers in the world. We were in the Minas Passage, an area of the Bay of Fundy where the seafloor and the shoreline pinch together. Here, the water goes from moving at about one metre a second to five. It's like putting your thumb over the garden hose and getting that extra-powerful stream. This is where FORCE decided to put their tidal energy test site. Extraordinary potential but still in the early stages According to recent models Lumley says there is roughly 7,000 megawatts of potentially extractable tidal energy in the Minas Basin. Of that number, researchers say about 2,500 megawatts can be tapped safely. That's more than enough electricity for all of Nova Scotia. Indeed this enormous storehouse of energy is the reason why the province and Premier Darrell Dexter created the Fundy Ocean Research Center on Energy. There are two objectives for the centre. "One, try to figure out how we can extract some of that energy out of the Bay of Fundy and two how we can develop good tidal technology that we can then hopefully sell to the world," says Dexter.
Green Illusions: The Limits of Alternative Energy - Are solar, wind, and other alternatives the magic bullets that will solve the world’s environmental and energy problems? Take a closer look, says Ozzie Zehner in Green Illusions . Zehner not only argues that green energy has technological, environmental and economic limits, but also that without an appropriate policy context, some forms of alternative energy could do more harm than good. The first part of Zehner’s book—by far the best—is devoted to explaining why neither photovoltaic, nor wind, nor biomass, nor any of the other alternatives to fossil fuels will be able to deliver a future of abundant, cheap, clean energy. Chapter by chapter, he brings out the environmental and economic limitations of each technology. Among the highlights—
- Carbon isn’t the whole story. When you count toxic sludge from making solar panels, noise from windmills placed too close to residential areas, or changes in land use patterns from cultivating biofuel crops, you find that alternative energy has negative externalities of its own that offset its low-carbon benefits at least in part, and sometimes entirely.
- Energy not only has to be produced, it has to be delivered when and where it is needed. Solar and wind power work fine in niche applications, but if you think about scaling them up to supply 20 percent or more of our energy needs, as some hope to do, you run into problems integrating these intermittent energy sources with our antiquated national electric grid. If you include the needed costs of upgrading the grid and providing backups, solar and wind start to look a lot more expensive. Of course, upgrading the grid would reduce waste for all production technologies, but as Zehner explains that the remote locations and inherent intermittency of solar and wind make the upgrades even more urgent and expensive.
Japanese nuclear plant 'sitting on active fault line' - The operator of Japan's Tsuruga nuclear power plant may be ordered to decommission the facility after seismologists confirmed that it sits directly atop an active fault line.If regulatory authorities do order Japan Atomic Power Co. to shut down the plant, it would be the first permanent closure of a nuclear facility since the Fukushima power plant was crippled by a tsunami triggered by last year's magnitude-9 earthquake. Tuesday marked 21 months to the day since the second-worst nuclear accident in history, with emergency teams still attempting to limit the damage caused by radiation leaks from four of the Fukushima plant's reactors. The disaster prompted a closer inspection of the nation's nuclear facilities, with the Nuclear Regulation Authority confirming on Monday that an active fault is below the No. 2 reactor at the plant, in the central Japan prefecture of Fukui. The No. 1 reactor at Tsuruga is the oldest commercial reactor in Japan and Japan Atomic Power Co. had announced planned to construct two new reactors at the site, before the Fukushima disaster.
Team studying how to make biofuels from E. coli - -- A team led by University of Colorado Boulder has won a five-year, $9.2 million grant for research on how to manipulate E. coli to produce cost-competitive biofuels. With a grant from the U.S. Department of Energy, the team will use a nonpathogenic strain of E. coli to pinpoint what part of its genome can be used to make biofuels or other chemicals at a low cost. The research team is led by Ryan Gill, who is a fellow at CU's Renewable and Sustainable Energy Institute. The team also includes scientists from the National Renewable Energy Laboratory and the Lawrence Berkeley National Laboratory.
BP plc : BP Biofuels to Invest $350 million to Expand Ethanol Production in Brazil - BP Biofuels announced today that it plans to invest $350 million to expand its ethanol processing capacity of Tropical, one of its sugarcane processing ventures in Brazil. The expansion, which is scheduled to start next year, includes the building of a new mill and is expected to create around 7,650 direct and indirect jobs. Tropical's processing capacity will double to five million tons of sugarcane producing 450 million litres of ethanol equivalent per year. The mill is expected to be operating at full capacity by the end of 2014 or early 2015. Mario Lindenhayn BP Biofuels Brazil CEO, said: "This expansion reinforces our commitment to the Brazilian sugarcane industry and will enable us to grow our business in the future." He said: "Since we started operating in May 2011, we have been improving our operational efficiency and this announcement marks a further milestone in delivering our biofuels strategy."
Fossil Fuel Prospects and Location - Chicago Fed - In mid-November, the International Energy Agency forecasted that “extraordinary growth in oil and natural gas output in the United States will mean that … the United States becomes a net exporter of natural gas by 2020 and is almost self-sufficient in energy, in net terms, by 2035.” Similarly, the U.S. Energy Information Administration recently revised its long-term outlook, and reported U.S. energy production growing faster than consumption through (at least) year 2040. This startling turnabout is due, in no small part, to recent advancements in U.S.-born technologies in the drilling and recovery of hydrocarbon fuels—natural gas, gas liquids, and petroleum. Already over the past several years, U.S. production of these fuels has boomed due to commercial development arising from these technologies. In the past month, two experts on emerging developments in this area reported at conferences held by the Federal Reserve Bank of Chicago. At the recent Economic Outlook Symposium, Loren C. Scott discussed U.S. and global energy developments. He presented a sanguine view on U.S domestic production from natural gas and petroleum resources.
Fracking's Lure, Trap and Endless Damage (Ralph Nader) The fight against fracking in New York is like the recurrent struggle put on by the taxpayer-subsidized fossil fuel and nuclear industries that want to dominate energy policies in government and push the safer alternatives out of the way because energy efficiency and renewable energy don’t make profits for them. As Yoko and Sean point out, through their new group Artists Against Fracking (www.artistsagainstfracking.com), by insulating buildings, for example, they could “save far more energy and create far more jobs than fracking can produce, plus save consumers money forever.” Industry engineering manuals portray the immense complexity of fracturing technology, the huge amount of water used per well, the pipelines and compressor stations, the congested truck traffic, the dozens of chemicals needed in the water to draw out the gas vertically and horizontally under the surface of the land. These materials leave out the emerging, grim reality which is memorably portrayed in the documentary “Gasland” by Josh Fox (gaslandthemovie.com).
UK Lifts Fracking Ban, Now What? - The UK has lifted the ban on hydraulic fracturing, but that doesn’t mean it’s going to be a fracking free-for-all: conditions apply. We expected this to happen, once the EU parliament put the brakes on a proposed fracking ban, taking at least some of the heat off its 27 member states who would have been expected—but not obligated—to follow suit. Essentially, fracking entails creating small explosions underground and then injecting water and chemicals to release gas trapped in shale. It has two potentials: to cause unwanted seismic activity and to unlock major natural gas supplies that could result in lower energy bills. For Cuadrilla Resources Ltd it means that the company can now resume test-drilling at its Lancashire plant, which was halted last year because the process caused two minor earthquakes (1.5 and 2.3 magnitude). (This was the temporary death knell for fracking in the UK). The UK—like the rest of Europe—can barely afford NOT to frack. But the public isn’t exactly keen on the seismic activity involved in this energy-bill-lowering process. With that in mind, the UK has done what it views as a compromise: Fracking will be subject to new rules intended to reduce the risk of seismic activity.
Net Energy, the Key to Energy Investing - Life requires energy. No choice. Investing in energy is obvious. Understanding the keys seems critical. Net Energy is the Long-Term Key. Net Energy is the equivalent of take home pay, or after tax profits. It is useful energy: relative to the energy required to deliver said energy to the economy. Net Energy is expressed as a ratio such as oil in the 1970s of 25:1. Oil has depleted below 5:1. As Net Energy drops below 5:1 the resource drops off the Energy Cliff. Here is link to an excellent presentation on Net Energy.
Is the new boom in domestic natural gas production an economic bonanza or environmental disaster? —For some Americans, it is our energy dreams come true. To others, it is an environmental nightmare. Ever since a new drilling technology, called hydraulic fracturing or fracking, made it possible to extract natural gas from shale deposits about a mile underground, a new gold rush has been under way. While fracking has created jobs and contributed to record-low natural gas prices, it comes with another kind of potential cost: risks to our environment and health that some say are far too high. The fracking process begins with a bore hole drilled some 6,000 feet below ground, cutting through many geological layers and aquifers, which tend to be no more than a few hundred feet below the surface. The shaft is then lined with steel and cement casing. Monitors above ground signal when drilling should shift horizontally, boring sideways to pierce long running sections of shale bedrock. Millions of gallons of water mixed with sand and chemicals are then blasted into the bedrock, the pressure creating cracks that release trapped natural gas from the shale. The gas and water mixture then flows back up to the surface, where the gas is separated from the water. While most of the water stays in the well bore, up to 20 percent is either reused for more fracking or injected into disposal wells thousands of feet underground. The wellpad and related infrastructure take up to eight to nine acres of land, according to the Nature Conservancy. Fracking is currently occurring in Texas and Pennsylvania, the two largest gas-producing states, as well as in North Dakota, Arkansas, California, Colorado and New Mexico. And the oil and gas industry is eager to expand its fracking operations into New York, North Carolina, Maryland and Illinois.
Drilling Methane Emissions Lawsuit: New York And 6 Other States To Sue EPA: — Seven Northeastern and mid-Atlantic states announced plans Tuesday to sue the Environmental Protection Agency, saying it is violating the Clean Air Act by failing to address methane emissions from oil and gas drilling, which has boomed in nearby states such as Pennsylvania and West Virginia. New York Attorney General Eric T. Schneiderman said in a news release Tuesday that the EPA is violating the Clean Air Act by failing to address the emissions. Methane is a potent greenhouse gas, and the oil and gas industry is the largest source of emissions in this country. Other major sources come from landfills and livestock. The EPA said in an email that it plans to review and respond to the notice from the states. Howard Feldman, a spokesman for the American Petroleum Institute, said the lawsuit "makes no sense" since the EPA passed rules on oil and gas emissions earlier this year, and many companies have already started installing new equipment to limit methane leaks and other pollution. Those rules take effect in 2015.
Poisoning the Well: How the Feds Let Industry Pollute the Nation’s Underground Water Supply - Federal officials have given energy and mining companies permission to pollute aquifers in more than 1,500 places across the country, releasing toxic material into underground reservoirs that help supply more than half of the nation's drinking water. In many cases, the Environmental Protection Agency has granted these so-called aquifer exemptions in Western states now stricken by drought and increasingly desperate for water. EPA records show that portions of at least 100 drinking water aquifers have been written off because exemptions have allowed them to be used as dumping grounds. "You are sacrificing these aquifers," said Mark Williams, a hydrologist at the University of Colorado and a member of a National Science Foundation team studying the effects of energy development on the environment. "By definition, you are putting pollution into them. ... If you are looking 50 to 100 years down the road, this is not a good way to go." As part of an investigation into the threat to water supplies [1] from underground injection of waste, ProPublica set out to identify which aquifers have been polluted. We found the EPA has not even kept track of exactly how many exemptions it has issued, where they are, or whom they might affect.
Texas Regulators Prepare Major Drilling Rule Changes - Hydraulic fracturing, or fracking, the controversial process of shooting water, sand and chemicals underground to access oil or natural gas trapped in shale rock, has made plenty of headlines in recent years. But the drilling process involves many other steps beyond breaking up rock, and several opportunities for things to go wrong. Recognizing this, the Railroad Commission, Texas’ oil and gas regulatory agency, is updating its rules to address the broad process of drilling, from the drilling itself to cementing and completing an oil or gas well. The latest version of the proposed rule changes is expected this week. So far, the commission’s work is winning qualified praise from environmentalists and some in the oil industry. Debbra Hastings, the executive vice president of the Texas Oil and Gas Association, said she expected that the new rules would probably be adopted by the Railroad Commission toward the beginning of the state legislative session, which starts in January. Careful construction of oil and gas wells is vital to preventing oil, gas or fracking-related fluids from leaking into aquifers. A study last year for the Groundwater Protection Council found that from 1993 to 2008, faulty drilling or well completion was responsible for 10 documented instances of groundwater contamination in Texas.
Permian Gushers Squeeze Texas Profit as Pipes Lag Output - The glut of U.S. shale oil caused by too few pipelines has spread to West Texas, cutting prices and draining $1.2 billion in potential profit from producers including Concho Resources Inc. (CXO) and Occidental Petroleum Corp. (OXY) Surging output in the Permian basin in West Texas and New Mexico -- the largest onshore oil producing region in the U.S. - - has exceeded pipeline and refining capacity, reducing crude prices by an average of $9.82 a barrel in the past month.The market disparity echoes similar surpluses seen in North Dakota’s Bakken Shale and Oklahoma’s Midwestern pipeline hub as growing supplies from shale rock and Canada’s oil sands created transportation bottlenecks. That’s forcing producers to lower prices, and it may restrain investment in wells.
New Report Could Effect Huge Change in the Pipeline Industry - How are leaks detected on today's oil and gas pipelines? Often times they're found – not by the owners and operators of the pipelines – but by complaining landowners who live where the pipeline crosses. It’s true, says Dr. David Shaw, one of the authors of a draft “Leak Detection Study” prepared for the U.S. Department of Transportation, for a report that will go to the US Congress early in 2013. Dr. Shaw is a project engineer with independent consulting firm Kiefner & Associates, Inc., a high-end, Ohio-based consulting firm that specializes in pipeline engineering. The Study - commissioned and funded by the U.S. Department of Transportation's Pipeline and Hazardous Materials Safety Administration (PHMSA) - analyzed several leak detection systems. What the Federal Aviation Administration (FAA) is to airlines, for example, PHMSA is to the pipeline industry. “Very often pipeline operators haven’t known they have a leak until they get a phone call from somebody saying there’s oil in my field,” Dr. Shaw said in a recent interview with the Oil and Gas Investments Bulletin.
Enbridge Pipeline Faces Scallop-Farmers Fight - A line of yellow buoys marking the boundaries of a scallop farm outside Prince Rupert, British Columbia presents the biggest challenge Enbridge Inc. (ENB) may face in its bid to connect Canada’s oil sands to Asia. The aboriginal communities on British Columbia’s northern coast, already a port for ships to load grain and coal sent by rail from Canada’s interior, are expanding shellfish farming and ecotourism, said Art Sterritt, executive director of Coastal First Nations. The native group seeks to develop an economy based on renewable resources and has attracted investment from former Prime Minister Paul Martin and Chinese companies. Coastal First Nations plans to fight any attempt by Enbridge to bring oil tankers to the area, said Sterritt.
Northern Gateway: UBC Study Suggests Cost Of Worst-Case Spill Outweighs Rewards - The financial costs of a worst-case scenario tanker spill off the north coast of British Columbia could outweigh the economic rewards of the proposed Northern Gateway pipeline for the region, says a study by the UBC Fisheries Centre. The study funded by World Wildlife Fund Canada looked at the potential losses to commercial fisheries, tourism, aquaculture and port activities in the area in the event of a tanker accident. Using the 1989 Exxon Valdez spill as an example, researchers calculated various scenarios, from a spill with no impact to a high-impact spill of 257,000 barrels of crude, in winter, over 52 kilometres of coastline that includes Haida Gwaii and Porcher Island, near Prince Rupert. "The study highlights that if a tanker spill occurs, the economic gains from the Enbridge (TSX:ENB) Northern Gateway project to the North Coast region would be wiped out by the costs of the spill," said Rashid Sumaila, director of the fisheries centre. Ocean-based industries directly employ about 10 per cent of the population of the North Coast. When indirect benefits are included, they account for approximately 30 per cent of regional employment.
Oil sands facing labour shortage as talent search proves a challenge— The “lack of hair” in management boards of Calgary’s oil and gas companies highlights the coming labour shortage in the sector, according to an industry executive. “Getting people with experience and management skills to execute the projects is a real challenge,” Chris Seasons, President of Devon Canada, said Tuesday during a panel discussion at an oil and gas conference here. Alberta’s hydrocarbon -fuelled economy is facing an acute labour shortage with unemployment levels at 4.7%, while Eastern provinces are staring at jobless levels of about 7.8% in Ontario and Quebec and double-digit unemployment in New Brunswick, Prince Edward Island and Newfoundland and Labrador. The oil and gas sector will need to fill a minimum of 9,500 new jobs by 2015, according to Petroleum Human Resources Council of Canada forecasts. While the industry paid $20-billion to Canadian federal and provincial governments in taxes and royalties last year, and employed 550,000 people directly and indirectly, the sector is a victim of “negative” perceptions, said the panellists.
Work on Keystone XL Halts in Texas over “Wrong Type of Oil” Claim - In Texas, a judge ordered the halting of TransCanada's Keystone XL pipeline after a landowner filed a lawsuit claiming that the company lied to Texans about type of oil it would be transporting. Landowner Michael Bishop, a 64-year-old retired chemist in medical school, claims that TransCanada (NYSE:TRP)lied in telling Texans that it would use the pipeline to transport crude oil, which will instead be used to transport tar sands oil, or diluted bitumen. According to Bishop, tar sands oil does not meet the state's definition of crude oil as “liquid hydrocarbons extracted from the earth at atmospheric temperatures,” he told the Associated Press, which mean it “has to be heated and diluted in order to even be transmitted.” Environmentalists argue that tar sands oil is a lot more difficult to cleanup should a spill occur, contaminating nearby water and land. Not to mention, refining the product in Texas will raise its already high greenhouse gas emissions rates.
Pittsburgh inspired Colo. town’s fracking ban - In a suburban Colorado town this fall, Michael Bellmont has been using the city of Pittsburgh as an inspiration and rallying cry. The insurance agent-turned-activist struck out on the warpath against hydraulic fracturing, a process that was coming closer to his hometown of Longmont and one he had come to view as unregulated and risk laden. He had read about the drilling ban approved 1,500 miles away in Pittsburgh in 2010. It left such an impression that he gave the Pennsylvania city a shout-out in the guitar tune he wrote about making sure "we'll have no frickin' frackin' in this town." "I thought, by golly, if Pittsburgh can do it, we can do it too," Mr. Bellmont said in an interview last week. He was right. In last month's balloting, the initiative he worked on to prohibit hydraulic fracturing sailed to victory with support from about 60 percent of Longmont's voters.Their approval turned a recently beefed-up set of local oil and gas drilling regulations -- which already had prompted a lawsuit from state environmental officials -- into an outright ban similar to Pittsburgh's.
BP Oil Spill Flow Rate Vastly Understated For Weeks, Emails Show: Emails that attorneys representing a defendant in the BP oil spill case plan to introduce in February show for the first time that the oil company knew the massive scale of the 2010 blowout in the Gulf of Mexico weeks earlier than previously disclosed. BP has long maintained that it provided full disclosure to the public and the federal government about its knowledge of the spill’s extent and did so promptly. The emails suggest otherwise. BP has said in the past that it learned of the spill's full extent months after the April 2010 blowout. But the emails indicate that the company knew almost immediately after the drilling rig exploded, killing 11 workers and injuring 17, that the spill may be extraordinarily large.
New NASA satellite photos show America’s oil fields at night - NASA has released some new photos and animations of the Earth at Night constructed using cloud-free night images from a new NASA and National Oceanic and Atmospheric Administration (NOAA) satellite – the Suomi NPP. At the “Now It’s All This” blog, the top photo above from NASA is featured in a post titled “Bright Lights, No City.” Amazingly, you can see the bright lights at night spread out all over the Bakken oil fields of western North Dakota, eastern Montana and southern Saskatchewan. The second photo shows Texas at night, and I’ve highlighted the major cities, along with the bright night lights spread across the oil fields in the Eagle Ford Shale region of Texas (the area between the two red lines).
The one chart about oil's future everyone should see - When people read about a long-term forecast of world oil supply--say, out to 2030--they often believe that the forecasters are merely incorporating our knowledge of existing fields and figuring out how much oil can be extracted from them over the forecast period. Nothing could be further from the truth. Much of the forecast supply has not yet been discovered or has no demonstrated technology which can extract or produce it economically. In other words, such forecasts are merely guesses based on the slimmest of evidence. Perhaps the best ever illustration of this comes from a 2009 presentation made by Glen Sweetnam, a U.S. Energy Information Administration (EIA) official. The EIA is the statistical arm of the U.S. Department of Energy. The following chart from that presentation will upend any notion that we know exactly where all the oil we need to meet expected demand will come from.The chart shows that by 2030 world output of oil and other liquid fuels from current fields is expected to drop to 43 million barrels per day (mbpd), some 62 million barrels below projected demand of 105 mbpd. This drop is consistent with the observed decline in the worldwide rate of production from existing fields of about 4 percent per year. Certainly, there will be more projects identified in the 18 years ahead. And, many people will say that we already have a large new resource of tight oil (often mistakenly referred to as shale oil) which can be extracted through hydraulic fracturing or fracking. But even if the optimists are correct--and there can be no guarantee that they will be--this source of oil will only add 3 to 4 million barrels of daily production
Signs of Oil Supply Bounce in November - The November OPEC and IEA reports are out and there is some sign that November total liquid fuel supply may have bounced up a little above the level it's been stuck at all through 2012. Some caution is in order since the initial figures often move around as revisions become available, but that's the picture as it stands. The graph above just shows the (non-zero-scaled) recent history since 2008. This one shows the longer history back to 2002:This shows the entire era since the onset of the bumpy plateau in 2005, in which it's been difficult to raise total liquid fuel production, and most of the increase has come from non-crude components of the liquid fuel supply (mainly NGLs and biofuels). However, by hook-or-by-crook, total liquids does keep creeping up and we have 5-6mbd more today than we did in 2005-2007. That represents a compound average growth rate of about 0.8%/yr over the period 2005-2012.
U.S. EIA raises forecast for oil demand growth in 2013 (Reuters) - Global oil demand growth will be higher next year than was previously expected, the U.S. Energy Information Administration said in a monthly report on Tuesday. The EIA raised its forecast for 2013 global oil demand growth by 70,000 barrels per day (bpd) to 960,000 bpd in its Short-Term Energy Outlook. It left its forecast for 2012 world oil demand growth unchanged at 750,000 bpd.
The Bumpy Plateau Tilts Upward - Every month I post the numbers for total oil supply, which seems to me the best way to get a sense for the issues around peak oil: how much the global oil supply is actually able to increase or decrease. However, when you look closely, "oil" turns out to be a slippery concept with the global liquid fuel stream being made up of a variety of things, not all of which are altogether oil-like. The EIA is the agency that keeps the best track of this, so every few months I like to post some graphs based on their breakdown. The components, through August 2012, look as follows:Here, crude and condensate (C&C: by far the largest part of the stream) are the most truly oil - hydrocarbon liquids that come out of the ground. The other components are NGLs - molecules from ethane to pentane that are condensed out of the natural gas stream and may or may not be liquid depending on circumstances. These are not exactly oil but may substitute for oil in various ways - for example, some butane is added to winter gasoline, propane competes with heating oil as a rural heating fuel, and NGLs and lighter crude fractions are substitutes to some degree as petrochemical feedstocks. So it's not entirely unfair to consider them together with the liquid fuel stream, but nor is it entirely satisfactory. The "other liquids" are mainly biofuels - ethanol and biodiesel that ultimately come from devoting portions of the world's cropland to fuel production. Meanwhile, refinery gains reflect the fact that some heavier crudes expand during refining.
Exxon forecasts energy demand will gain 35% by 2040: Exxon Mobil Corp. (XOM) forecasts global energy consumption will rise 35 percent by 2040, driven by China and India, the Wall Street Journal reported, citing the company’s latest long-term energy outlook. Exxon projects North America will become a net energy exporter by 2025 because of an increase in oil and gas production and improvements in energy efficiency, the newspaper said. The Irving, Texas-based company is the world’s biggest energy producer by market value. The use of coal will decline 33 percent by 2025, compared with a previous estimate of 23 percent, as more natural gas- fired power stations are built, the report said. The growth of U.S. and Canadian oil and gas production may lead to an increase in international shipments, according to the report. Exxon compiles the outlook annually to guide long-term investment decisions. Demand in developed regions such as the U.S., Canada and Europe will be unchanged or decline as they become more efficient, according to the newspaper report. While developed nations by 2040 are forecast to generate 80 percent more economic output than in 2010, they will use the same amount of energy, the newspaper said, citing the outlook.
Price plunge approaching for U.S. crude, BofA forecasts -- The price of U.S. crude is heading for a precipitous decline that could force the nation’s production surge to slow, according to a BofA Merrill Lynch forecast. The benchmark price for domestic oil could drop to $50 a barrel in the next two years, the lowest level since 2009, analysts wrote in the annual market outlook. Currently, the West Texas Intermediate price for crude is hovering around $85 as oil extraction rises in the country. “While the rest of the world will continue to fight for scarce molecules of oil and gas, North America’s energy supplies are surging,” the BofA report stated. “We see a risk of WTI crude oil prices temporarily dropping to $50/bbl over the next 24 months to force a slowdown in output.” Meanwhile, Brent crude, the global benchmark price for oil, will hit an average $110 per barrel in 2013, the researchers projected. It’s trading so far this week around $108.
Oil at $60 or $120 Doesn’t Prevent U.S. Supplanting Saudis - Whether crude costs $60 a barrel or twice that amount, the U.S. is almost free of depending on imported energy and positioned to supplant Saudi Arabia as the world’s No. 1 producer of oil. Even if U.S. benchmark West Texas Intermediate oil drops 30 percent from the current $86 a barrel, oil companies will boost production as new technologies allow them to extract crude from shale formations, said Ed Morse, the global head of commodities research at Citigroup Inc. Saudi Arabia can’t afford a decline of that magnitude after the government pledged an unprecedented $630 billion on social welfare and building projects. The kingdom, which uses Brent crude to help set export rates, couldn’t meet those commitments if prices fell 25 percent from the current $109 a barrel, . “U.S. shale oil producers can’t lose,” . “The Saudis really need to balance their budget at about $95. For the U.S. producers, that is more than ample.”
Vast sums of aid continue to be stolen in Afghanistan - Despite years of supposed effort to stop money laundering out of Kabul airport, billions continue to flow from the country unchecked. With Afghanistan's two principal cash crops being opium and slicing chunks off the top of international aid, there were no prizes for guessing where the tens of billions of dollars transferred from Afghanistan since the US-led war began in 2002 came from, or how the luxury villas of so many Afghan officials in the United Arab Emirates had been paid for. So, the US embassy in Kabul created a "bulk cash flow action plan" and the Karzai government said it was on board. The results since? Well, around $4.5 billion flowed out of Afghanistan in 2011, according to the Congressional Research Service, the vast majority of it unmonitored and unregistered. That's about 22 percent of gross domestic product, an astonishing amount of capital flight. How is the plan doing this year? About the same as last year, according to a report from the Special Inspector General for Afghanistan Reconstruction (SIGAR), a US government auditor, released today.
Iraq boom hands Naimi 2013 oil-supply challenge - Iraq’s biggest jump in oil production since 1998 is increasing the burden on Saudi Arabia to lower crude exports to prevent price declines next year. The kingdom curbed crude output in November to a 13-month low, according to OPEC. Iraq plans next year to pump as much as it did when Saddam Hussein came to power three decades ago, its oil minister said Dec. 9. Supply will also rise in Libya and Nigeria while the U.S. experiences an oil shale bonanza. “Saudi Arabia’s dilemma is that while it is the key OPEC player willing to cut back oil production in order to sustain prices at desired levels, it is also accommodating Iraq’s rising output and market share,” “Ultimately, there will need to be an agreement between the two as how to balance these ambitions.” Saudi Arabian Oil Minister Ali Al-Naimi needs to keep prices high enough to fund social spending plans without incurring the wrath of consumers for hurting the global economy. Iraq, now the second-biggest supplier in the Organization of Petroleum Exporting Countries, has a different priority: to rebuild its industry after decades of war and sanctions.
Oil Production and Violence in The Middle East: There is a growing disconnect between forecasts of prodigious amounts of oil coming out of the Middle East in coming decades and what is likely to happen in the region. The Middle East today is a patchwork of geographical entities known as states. A few, such as Iran, are reasonably coherent and go back hundreds of years, but others such as Iraq, Israel, and Jordan were created by outside powers out of a polyglot of ethnicities. In many countries, the people’s first loyalty is to a tribe or a religion rather than a national government. Overlaying the region is Islam, which goes back to the 7th Century. Unfortunately, so does the intra-religion split which goes back some 1,200 years, and still provokes an amazing amount of animosity between Sunnis and Shiites. In some places this animosity runs deep, and in countries where the population is divided, such as Iraq or Syria, the group in power invariably discriminates against the other. The rapid population growth has been and will be a fundamental cause of instability. Between 1970 and 2012, the population of the Middle East and North Africa grew from 127 to 569 million. Only some 160 million live in countries that enjoy substantial oil revenues, while the other 400 million live mostly in poverty. The region is adding about 8 million people a year, and because of traditional religious and social practices — mostly involved with the lack of empowerment for women — there is no end to rapid growth in sight.
Oil, Iran, and stability in the Gulf: Why the Gulf states want to keep Iran in a box - We are often told that Gulf states like Saudi Arabia and Kuwait are deeply worried about Iran, and eager for the United States to take care of the problem. This is usually framed as a reflection of the Sunni-Shiite divide, and linked to concerns about Iranian subversion, the role of Hezbollah, and of course the omnipresent fretting about Iran's nuclear energy program. I have heard senior Saudi officials voice such worries on more than one occasion, and I don't doubt that their fears are sincere. But there may be another motive at work here, and Americans would do well to keep that possibility in mind. That motive is the Gulf states' interest in keeping oil prices high enough to balance their own budgets, in a period where heightened social spending and other measures are being used to insulate these regimes from the impact of the Arab Spring. According to the IMF, these states need crude prices to remain upwards of $80 a barrel in order to keep their fiscal house in order. Which in turn means that Saudi Arabia et al also have an interest in keeping Iran in the doghouse, so that Iran can't attract foreign companies to refurbish and expand its oil and gas fields and so that it has even more trouble marketing its petroleum on global markets. If UN and other sanctions were lifted and energy companies could operate freely in Iran, its oil and gas production would boom, overall supplies would increase, and the global price would drop.
How Bad do Sanctions Really Hurt Iran? -With 20 governments expressing their commitment to reduce the amount of crude oil purchased from Iran, the U.S. government said oil production from the Islamic republic was down by 1 million barrels per day from October, compared with the same time last year. Sanctions imposed this year were meant to cut into Iran's oil revenue, which could be financing its nuclear activity. Washington said members of the international community were sending a clear message to Iran that it must come clean on its nuclear ambitions or face "increasing isolation and pressure." A report from the Government Accountability Office, however, found that at least seven companies from Asian and African economies were still investing in the Iranian oil and natural gas sector. India's ONGC Videsh was listed by the GAO as an active investor in the Iranian oil sector with a 40-percent stake in the Farsi natural gas block in Iran. The GAO report noted the company's exploration contract there had expired, however. Meanwhile, the China Petroleum and Chemical Corp., known also as Sinopec, holds a majority stake in Iran's Yadavaran onshore oil field and didn't provide a comment to the U.S. government about its ongoing activity in the country. Iranian officials last week said targeted sanctions were beneficial to a struggling economy that depends, in large part, on oil revenue. A member of the Iranian parliament's National Security and Foreign Policy Commission said Clinton's decision suggested Washington had to "think again" in terms of the consequences that sanctions have for U.S. allies.
New report warns of diplomatic costs to the US of Iran sanctions - Crippling international sanctions against Iran spearheaded by the United States are increasingly creating diplomatic headaches for the Obama administration, a panel of national-security experts and former lawmakers and government officials warned in a new report Thursday. The new report from the Iran Project, “Weighing Benefits and Costs of International Sanctions Against Iran,” comes as lawmakers are considering new sanctions on Iran's energy sector as part of House-Senate negotiations over defense legislation. It comes on the heels of a September report from the same group that weighed the pros and cons of military intervention to stop Iran's alleged nuclear weapons program, which concluded that a U.S. strike on Iran’s nuclear facilities could have unintended consequences that would lead to all-out war. “Differences with Russia, China and other countries — including India, Turkey and South Korea — have widened as more comprehensive sanctions take effect that aim to pressure Iran’s leaders by harming the civilian economy,” the report concludes. “Sanctions-related tensions among the United States and Russia and China have complicated U.S. efforts to achieve Security Council unity on international action in Libya and Syria.”
China cautions India against oil exploration in South China Sea - Times Of India: China today cautioned India against any "unilateral" attempt to pursue oil exploration in the disputed South China Sea, saying that it is opposed to nations outside the region to intervene in the disputed area. "China opposes any unilateral oil and gas exploration activities in disputed areas in the South China Sea and hopes relevant countries respect China's sovereignty and national interests, as well as the efforts of countries within the region to resolve disputes through bilateral negotiations," Chinese foreign ministry spokesman Hong Lei said.Lei was reacting to Navy chief Admiral D K Joshi's remarks that Indian Navy was prepared to deploy vessels to the South China Sea to defend India's economic interests there.
China's drawdown of iron ore and steel inventories -This summer we saw massive builds of iron ore (see post) and steel inventories in China. That drove domestic prices to new multi-year lows (see post). With China's economy beginning to stabilize (see post), these inventories are now declining. According to Deutsche Bank, the restocking of these inventories should increase production and result in moderate price increases for iron ore. This is by no means a start of a new commodity boom - the market remains well supplied. DB: - We expect that steel production rates in China could rebound into the end of the first quarter and potentially approach the 2.1mt/day level during the year. We expect that this in addition to a modest restocking event should help to push iron ore prices higher into mid-year.
Chart of the day: China is now world’s No. 1 manufacturer - The United Nations updated its National Accounts Main Aggregates Database today with data for 2011. The chart above compares the annual manufacturing output of the US and China from 1970 to 2011 measured in current US dollars. Before 2004, the United Nations only reported “Mining, Manufacturing and Utilities” for China, so the comparison above is for that measure of manufacturing in both countries, rather than just “manufacturing.” In 2010, the manufacturing output of both countries was almost exactly equal, with China at $2.373 trillion and the US at $2.365 trillion. But in 2011, China’s manufacturing output surged by 23% while manufacturing output in the U.S. only increased by 2.8%. That brought China’s manufacturing output last year to more than $2.9 trillion, which was almost half a trillion dollars (and 20%) more manufacturing output than the $2.43 trillion of manufacturing output that was produced in the U.S. last year.
HSBC Flash China Manufacturing PMI Improves in December; Has China Turned the Corner? - The HSBC Flash China Manufacturing PMI™ report shows Operating conditions continue to improve in December. Key points:
- Flash China Manufacturing PMI™ at 50.9 (50.5 in November). Fourteen-month high.
- Flash China Manufacturing Output Index at 50.5 (51.3 in November). Two-month low.
“As December flash manufacturing PMI picked up further to a 14 month high, it confirmed that China's ongoing growth recovery is gaining momentum mainly driven by domestic demand conditions. However, the drop of new export orders and the downside surprise of November exports growth suggest the persisting external headwinds. This calls for Beijing to keep an accommodative policy stance to counter-balance the external weakness, provided inflation stays benign.”
China's market responds to improving PMI; institutions getting involved - HSBC China PMI shows that manufacturing continued to expand in December. The rate of expansion is still low, but consider the fact that this last reading puts the PMI index at the highest level in 14 months. This confirms earlier indications of stabilizing growth (see discussion).The equity market moved up sharply on the news. Bloomberg: - The Shanghai Composite Index climbed 3.5 percent to 2,134.22 at 1:20 p.m. Trading volumes were more than double the 30-day average for this time of day. Anhui Conch Cement Co. and Sany Heavy Industry Co. jumped more than 3 percent after the preliminary reading for a manufacturing index by HSBC Holdings Plc and Markit Economics increased to 50.9. Citic Securities Co. rose among brokerages, while Industrial & Commercial Bank of China Ltd. rallied the most since May 2011.
Energy Leveraging: An Explanation for China’s Success and the World’s Unemployment - If an employer wants to maximize profits, it will want to leverage its use of high-priced energy sources. From an employer’s point of view, there are basically three kinds of energy, from most to least expensive:
- Human energy
- Petroleum energy
- Everything else
If an employer wants to keep its costs low, it needs to minimize its use of expensive energy sources. The primary way it does this is by leveraging expensive energy sources with cheaper energy sources that help keep overall energy costs in line with what competitors (including overseas competitors) are paying. Thus, employers will want to use as little human and petroleum energy as possible, instead using cheap energy to substitute. Human energy is the most expensive form of energy. It is very expensive because an employer needs to pay the employee enough to live on. This amount includes the cost of energy to fulfill the human’s needs, plus enough extra to cover taxes to cover the cost of energy for those who for some reason cannot work, plus taxes for maintenance of public infrastructure. An employer can keep his cost of human energy low by
- Substituting mechanical or electrical energy, which is usually cheaper.
- Hiring humans whose wage costs are low. Usually this means is humans who use little energy in their personal lives, and what energy is used, is cheap energy.
- Hiring in areas where taxes are low, usually reflecting a lack of benefits to employees.
China’s shadow ponzi - China’s shadowy and increasingly popular wealth management products are back in the headlines, most recently after dozens of investors protested outside a bank branch in Shanghai after they were told they would not receive their money back. Their investment wasn’t with the bank itself, Huxia Bank, but with Zhongding Wealth Investment Centre. It led to a customer manager at Jiading branch of Huaxia Bank being apparently arrested, although several of the investors reportedly told the South China Morning Post that she had the bank’s approval to sell the product. To refresh your memory: WMPs are high-yield investment products that can be marketed by banks, and often invested in illiquid and sometimes risky assets. Chinese investors, looking for something that yields a decent return, or even a real return at all, often believe that the products are as safe as deposits with the banks who market them. More from the South China Morning Post’s report: The Zhongding WMP provides a vivid snapshot of the practices the institutions engage in. Zhongding raised the money through Huaxia Bank to fund the construction of car dealerships in Henan province. The victims said Huaxia Bank informed them the borrower was found to have committed crimes. “Shouldn’t Huaxia take responsibility?” said Zhou Guowu, an investor who spent 500,000 yuan on the Zhongding product. “Our money was deposited into Huaxia’s accounts via the branch’s counters,” said one investor. “For ignorant investors like us, we were buying Huaxia Bank’s product and we want our money back from Huaxia.”
Signals of a More Open Economy in China — In a strong signal of support for greater market-oriented economic policies, Xi Jinping, the new head of the Communist Party, made a visit over the weekend to the special economic zone of Shenzhen in south China, which has stood as a symbol of the nation’s embrace of a state-led form of capitalism since its growth over the last three decades from a fishing enclave to an industrial metropolis. The trip was Mr. Xi’s first outside Beijing since becoming party chief on Nov. 15. Mr. Xi visited a private Internet company on Friday and went to Lotus Hill Park on Saturday to lay a wreath at a bronze statue of Deng Xiaoping, the leader who opened the era of economic reforms in 1979, when Shenzhen was designated a special economic zone. Mr. Deng famously later visited the city in 1992 to encourage reviving those economic policies after they had stalled following the violent crackdown on pro-democracy protests in 1989. “Reform and opening up is a guiding policy that the Communist Party must stick to,” Mr. Xi said, according to Phoenix Television, one of several Hong Kong news organizations that covered the trip. “We must keep to this correct path. We must stay unwavering on the road to a prosperous country and people, and there must be new pioneering.”
China Labor Watchdogs Expose Dark Side of Global Toy Empire - Despite the occasional factory fire or sweatshop media expose, American consumers have largely inured themselves to the status quo of exploiting the Global South as our overseas workshop for cheap clothes, toys and gadgets. With the holiday shopping season in full swing, consumers have affixed even more tightly the corporate blinders, rendering the workers in Santa’s Workshop comfortably invisible. But some of the factories churning out hot toys have recently been exposed as bastions of labor abuse. According to an investigation by the New York-based watchdog group China Labor Watch,several toy-industry supplier factories in China (which have collectively produced for famous clients like Mattel, Disney and Hasbro) have flouted both international ethical standards and Chinese law. The extensive investigation, based in part on worker interviews, uncovered troubling conditions: CLW’s investigation revealed at least 15 sets of violations in four factories together employing about 10,000 workers: illegal overtime pay, excessive overtime, forced labor, myriad safety concerns, a lack of safety training, a lack of physical exams, inability to resign from work, blank labor contracts, unpaid work, a lack of social insurance, use of dispatch workers, a lack of a living wage, poor living conditions, unreasonable rules, and a lack of effective grievance channels.
Move Over, Michigan, China Is The World's Next Rust Belt - Forbes: Six cities in Liaoning province, including Shenyang and Anshan, recently announced they are converting abandoned industrial sites to farmland. Dongguan, once a booming factory center, is on the verge of bankruptcy as companies close, leaving the local government severely cash-strapped. Just two years after China overtook the U.S. to become the world’s largest manufacturer, the country faces the prospect of decades of de-industrialization. And there is little Beijing can do to arrest the slide. Globalization once propelled China. Hong Kong manufacturers flocked to that country’s coastal regions in the early 1980s largely because labor costs were low and regulation lax. Later, companies had little choice but to move to China because their competitors had already located there, and soon suppliers congregated around assemblers, forming efficient industrial communities. The country became an integral link in the production plans of manufacturers, large and small
China's money changes the landscape in Australia: Shenhua Watermark Coal offered to buy farms at unheard-of prices. The decision wasn't easy, Clift says. His pioneer ancestors settled the land in 1832. But farming is a business nowadays, and selling his 6,500 acres (2,600 hectares) made business sense. "If someone offers you a whole heap of money, you've got to take it," says the 50-year-old father of two, sitting at the kitchen table of the palatial hilltop home he built with the windfall. A sea of yellow stretches out below, canola fields planted on less fertile land he bought 25 miles (40 kilometers) to the north.Soaring coal prices fueled by China's economic growth have made mining parts of the Australian landscape far more lucrative than farming it. It's one example of how China's emergence as a global trading power may transform countries in ways never contemplated and not yet fully understood. The Associated Press analyzed China's trade with other countries as a percentage of their gross domestic product, using an International Monetary Fund database. It found that, on average, trade with China had climbed to 12.4 percent of GDP by 2011. By comparison, the peak reached with the U.S. in the past 30 years was 10 percent in 2001. In Australia, where trade with China hit 7.7 percent of GDP last year, exports of coal and iron ore have helped Australia fend off recession for 21 years and deliver the largest trade surpluses in 140 years of record-keeping.
Pettis: Australia should be pessimistic - When I first started to go to Australia four years ago I think few analysts there recognized the vulnerabilities of the Chinese growth model, and so there was a general expectation that the implications of rapid Chinese growth for Australia – mainly very high prices for various commodities – would remain in place for many more years. Australia could count on very high iron ore prices, for example, into the indefinite future. The mood has changed dramatically in Australia in recent years, as it has in the rest of the world, but not completely. In October the Australian government came out with a White Paper, Australia in the Asian Century, that projects a 7% average GDP growth rate for China between 2012 and 2025. This is pretty surprising. Although there are still a few GDP growth rate projections of around 7% to 8%, few of them are from Chinese economists (excluding official projections, of course) and even among optimistic foreigners none that I know expects growth to remain so high for so long. This seems to put the Australian government among the most optimistic in the market when it comes to long-term growth expectations for China. I have always assumed that government projections should generally be on the pessimistic side to prepare for unexpected negative shocks (positive shocks can take care of themselves), but apparently not. I am glad to say that my own conversations with Australian government officials lead me to believe that this White Paper may represent the official view of the government, but it does not represent the private views of all Australian government officials.
Japan in recession after 2Q growth revised down - Japan's economy is technically in recession after authorities said revised figures for the April-June quarter showed the economy shrank for two straight quarters. The Cabinet Office said Monday that gross domestic product for the July-September quarter shrank 0.9 percent from the previous quarter, unchanged from the preliminary release. Going back to the April-June quarter, however, GDP was revised to a 0.03 percent decline from the previous quarter, or a 0.1 percent contraction at an annualized pace. Previously, the Cabinet had said second quarter GDP grew 0.1 percent from the previous quarter. A widely accepted definition of a recession is two consecutive quarters of economic contraction.
Japan officially in recession; USD/JPY testing resistance level - Japan's second quarter GDP was revised from +0.1% to -0.1%. This barely makes a difference to Japan's overall economic situation, other than the fact that it puts it officially in recession (two consecutive quarters of declining GDP). The yen remains relatively weak on these fundamentals, although technically USD/JPY has not been able to break the current resistance level. USD/JPY appreciation is held back by large spec short yen positions (see discussion) that cover as the yen hits certain levels.
Japan in recession, BoJ eyes stimulus - Japan - the world's third largest economy - has fallen into recession, hit by sluggish exports to China. Revised official data on Monday morning showed that the Japanese economy shrank very slightly in the second quarter of 2012, by 0.03%, before contracting by 0.9% between July and September. Analysts expect the country to stay in recession in the final quarter of the year, ratcheting up the pressure on the government to take steps to boost the economy in the runup to the general election on 16 December. Takeshi Minami, chief economist at Norinchukin Research Institute in Tokyo, said: "There have been some positive indicators out in October butthere is still a good chance that Japan's economy will suffer another contraction in the October-December quarter. "The eurozone crisis, a strong yen that has weakened exports and a diplomatic row with major trade partner China have harmed Japan's economy, dampening hopes of a strong recovery after the 2011 tsunami. Last month, Tokyo approved $10.7bn (€6.67bn) of spending, more than double a package announced in October. But polls suggest it will not be enough for PM Yoshihiko Noda and his Democratic party to avoid defeat at the elections on 16 December.
India faces chances of being downgraded to junk, warns Standard & Poor's - -The Indian government's wide fiscal deficit and a heavy debt burden are the most "significant rating constraints" to the country's sovereign rating, Standard & Poor's said, reiterating its warning that India faces a one-in-three chance of being downgraded to junk over the next 24 months. "Broadly, India's fiscal profile is a rating weakness," S&P said in a note, echoing views made in an October note. "Given the political cycle - with the next elections to be held by March 2014 - and the current political gridlock, we expect only modest progress in fiscal and public sector reforms," it said. The rating agency, which in April cut India's outlook rating to negative from stable, said it did not expect the government to reach its fiscal deficit target of 4.5% of gross domestic product in the fiscal year that ends in March 2014.
"Inflation Responses to Commodity Price Shocks – How and Why Do Countries Differ?" - Commodity prices have been particularly volatile during the last decade. They set off on a multi-year rally around 2003, peaked in 2008, plummeted with the global recession, recovered quickly, and surprised recently with renewed surges. They fueled inflationary pressures in economies around the globe and have challenged policymakers striving to find the appropriate policy response. They have also prompted a new debate about which structural characteristics and policy frameworks help economies contain the inflationary effects from commodity price shocks. With this motivation, we examined inflation dynamics for 31 advanced and 61 developing economies. We assessed average pass-throughs of international food and fuel prices to domestic inflation in 2001-2010 using both country-by-country and panel estimations of augmented Phillips curves. We then related the size of the pass-throughs to country characteristics and policy frameworks. We also studied the cross-country performance of headline and core inflation around the 2008 commodity price shock, as the dynamics may be different around large shocks. Our findings confirm the presumption that food price shocks have stronger inflationary effects in countries with higher food weights in the CPI basket. During 2001-2010, a ten percentage-point shock to international food prices, for example, was associated on average with a 1.4 percentage-point increase in inflation for countries with the highest (top 20th percentile) shares of food in their CPI basket, while the pass-through in the bottom 20th percentile was only 0.3 percentage points. Similarly, external fuel price shocks had stronger inflationary impact in highly oil-intensive economies.
Extended Interview: Critics slam continued secrecy of Trans-Pacific Partnership, talks underway in New Zealand | Free Speech Radio News: MP3 - World leaders are meeting in Auckland, New Zealand for the latest round of Trans Pacific Partnership or TPP negotiations. The partnership now involves eleven countries, including the US, Australia, New Zealand, Singapore and Vietnam and newly included Canada and Mexico. Watchdog groups are in Auckland to monitor the highly secretive negotiations. So far, the public has only learned about the trade deal through leaked copies of the proposals. For more spoke to Lori Wallach, Public Citizen’s Global Trade Watch director who is in Auckland. This is an extended version of the interview we broadcast.
IMF May Be on Collision Course with Trade Policy - The International Monetary Fund (IMF) has officially endorsed an “institutional view” on the management of capital flows. Henceforth the IMF will advise nations, under certain circumstances, to deploy capital controls on inflows and outflows of capital. The IMF is aware that such advice may conflict with obligations that nations have under trade and investment treaties, and recommends that such treaties be reformed. On December 3, 2012 the International Monetary Fund made public an Executive-Board approved “institutional view” on capital account liberalization and the management of capital flows. In a nutshell, the IMF’s new “institutional view” is that nations should eventually and sequentially open their capital accounts. This is indeed in contrast with its view in the 1990s that all nations should be uniformly required to open their capital accounts regardless of the strength of a nation’s institutions. The IMF now recognizes that capital flows also bring risk, particularly in the form of capital inflow surges and sudden stops that can cause a great deal of financial instability. Under such conditions, and under a narrow set of circumstances, according to the new “institutional view” the IMF may recommend the use of capital controls to prevent or mitigate such instability in official country consultations or Article IV reports. In other words, the IMF now sanctions staff and management to recommend the use of capital controls to nations under certain circumstances.
Baltic Dry Plunges By Over 8% Overnight, Most Since 2008 - It has been a while since we looked at the Baltic Dry Index, which when normalizing for the excess glut in dry container ship supply (such as right now - 5 years after all the excess supply in the industry - has long been normalized), continues to be one of the best concurrent indicators of global shipping and trade. We look at it today, moments ago it just posted an epic 8.2% plunge, crashing from 900 to 826, or the biggest drop since 2008! Of course, conisdering the collapse in global trade confirmed in past days by both Chinese and US data, this should not come as a surprise, although we are certain it will merely bring out the BDIY apologists who tell us that supply and demand here (like in every other Fed-supported market) are completely uncorrelated.
China's economy to outgrow America's by 2030 as world faces 'tectonic shift' - A US intelligence portrait of the world in 2030 predicts that China will be the largest economic power, climate change will create instability by contributing to water and food shortages, and there will be a "tectonic shift" with the rise of a global middle class. The National Intelligence Council's Global Trends Report, published every five years, says the world is "at a critical juncture in human history". The report, which draws in the opinion of foreign experts, including meetings on the initial draft in nearly 20 countries, paints a future in which US power will greatly diminish but no other individual state rises to supplant it. "There will not be any hegemonic power. Power will shift to networks and coalitions in a multi-polar world," it says. The report offers a series of potential scenarios for 2030. It says the best outcome would be one in which "China and the US collaborate on a range of issues, leading to broader global co-operation". It says the worst is a world in which "the US draws inward and globalisation stalls." "A collapse or sudden retreat of US power probably would result in an extended period of global anarchy; no leading power would be likely to replace the United States as guarantor of the international order," it says, working on the assumption that the US is a force for stability – a premise open to challenge in Iraq and elsewhere in the Middle East and beyond.
GLOBAL TRENDS 2030 (pdf) National Intelligence Council
Synthesising views on west’s poor growth - There is a fierce debate over the origins of the disappointing economic growth seen in advanced economies. On one side there is former world chess champion and political activist Garry Kasparov and internet entrepreneur Peter Thiel, while on the other, there is Kenneth Rogoff, a Harvard economist.Mr Rogoff, who authored This Time is Different: Eight Centuries of Financial Folly (2009) with Carmen Reinhart, argues that the systemic financial crisis is the root cause of the prolonged economic slump in the western world. In their research, Mr Rogoff and Ms Reinhart found economic growth following a systemic financial crisis to be about a full percentage point below trend growth.Mr Kasparov and Mr Thiel, on the other side, disavow Mr Rogoff’s claim that the collapse of advanced-country growth is the result of the financial crisis. In their view, the flailing western economies reflect stagnating technological development and innovation, and without radical changes in innovation policy, advanced economies are unlikely to see any prolonged pickup in productivity growth.Robert Gordon of Northwestern University espouses an even more dire view, suggesting that the 250 years of rapid technological progress that followed the Industrial Revolution may prove to be the exception, rather than the rule.
Bank of England Warns of Global Currency Wars - By the time central banks warn about something, the practice has likely been going on for years. Today's case in point is BoE's King warns of growing currency competition The head of the Bank of England warned on Monday that too many countries were trying to weaken their currencies to offset the impact of the slow global economy and the trend could grow next year. "You can see, month by month, the addition to the number of countries who feel that active exchange rate management, always to push their exchange rate down, is growing," Mervyn King said in a speech. The warnings by King, who is set to step down in July, echo those made in October by U.S. Federal Reserve Chairman Ben Bernanke, who delivered a blunt call for certain emerging economies to allow their currencies to rise. The back and forth of monetary stimulus and foreign-exchange intervention has complicated any coordinated efforts to recover from the Great Recession. It's fair to say the reason there is no recovery is that central bankers like King and Bernanke think competitive currency debasement will solve economic problems. It won't, and that has been proven time and time again. The irony is King bitches about exchange rate management while encouraging Bernanke to do the same, and doing the same himself.
King Sees Risk of More Currency Management on Imbalances - Bank of England Governor Mervyn King said the Group of 20 nations must revive efforts to address global imbalances or more countries may start using exchange rates as their key tool for monetary policy. Since their agreement on stimulus in 2009, “the G-20 has gone backward since then, and there has been no agreement on the need for working together to achieve some element of rebalancing the world economy,” King said in a speech in New York late yesterday. “My concern is that in 2013 we’ll see the growth of actively managed exchange rates as an alternative to the use of domestic monetary policy.” In an overview of the financial crisis and central banks’ responses since 2008, King said the current-account balances that helped to trigger the global recession still linger, and his call for more action echoes previous statements made in recent years. On the global economy, he said it’s “fair to say a recovery of a durable kind is proving elusive.”
The IMF’s Half-Step -“What used to be heresy is now endorsed as orthodox,” John Maynard Keynes remarked in 1944, after helping to convince world leaders that the newly established International Monetary Fund should allow the regulation of international financial flows to remain a core right of member states. By the 1970’s, however, the IMF and Western powers began to dismantle the theory and practice of regulating global capital flows. In the 1990’s, the Fund went so far as to try to change its Articles of Agreement to mandate deregulation of cross-border finance. With much fanfare, the IMF recently embraced a new “institutional view” that seemingly endorses re-regulating global finance. While the Fund remains wedded to eventual financial liberalization, it now acknowledges that free movement of capital rests on a much weaker intellectual foundation than does the case for free trade.
Japan should scare the eurozone - FT.com: Almost exactly 20 years ago I packed my stuff in London and moved to Japan. The Tokyo stock market had crashed some two years previously; the property market was in free fall; lenders that had relied on buildings as collateral were gasping for air. Yet the country was in denial about its problems. Nobody imagined that Japan would today be suffering its fifth recession in two decades.The question is whether Europe is walking the same path. As in Tokyo in the early 1990s, eurozone policy makers believe they are doing as much as politics allows. As in Tokyo, financial markets lull them with periods of calm. And yet, also as in Tokyo, fiscal and monetary policy preclude escape-velocity growth in the short term; structural reform is insufficient to deliver reasonable growth in the medium term; and the authorities underestimate the twin challenges of debt and demography in the long run. The initial shock that Europeans have experienced is more severe than Japan’s. In the four years after the crash in early 1990 Japan’s economy actually grew by a total of 5 per cent. In the four years since the Lehman Brothers bankruptcy the eurozone has shrunk 1.5 per cent. Four years into the crisis, Japan’s equity implosion looked similar to what has befallen peripheral Europe, but its house prices had fallen less than Spain’s or Ireland’s.
Europe Still Slowly Sinking (graphs) A quick round-up of some European stats. Above is the unemployment rate which continues to steadily worsen (through October). Then there's retail sales: October was a bad month and it continues a downward trend since mid 2010. Next is GDP, down in Q3 as it was in Q2: Finally industrial production has also been trending down (data only through September): Makes US economic stats look positively cheery, doesn't it?
Europe clings to scorched-earth ideology as depression deepens - Like the generals of the First World War, Europe’s leaders seem determined to send wave after wave of their youth into the barbed wire of tight money, bank deleveraging, and fiscal austerity a l’outrance. The strategy of triple-barrelled contraction across a string of inter-linked countries has been the greatest policy debacle since the early 1930s. The outcome over the last three years has been worse than forecast at every stage, and in every key respect. The eurozone has crashed back into double-dip recession. It will contract a further 0.3pc next year, according to a chastened European Central Bank. The ECB omitted mention of its own role in this fiasco by allowing all key measures of the money supply to stall in mid-2012, with the time-honoured consequences six months to a year later. The North has been engulfed at last by the contractionary holocaust it imposed on the South. French car sales crashed 19pc last month, even before its fiscal shock therapy -- 2pc of GDP next year. The Bundesbank admitted on Friday tore up its forecast on Friday. Germany itself is in recession. The youth jobless rate has reached 58pc in Greece, 55.8pc in Spain, 39.1pc in Portugal, 36.5pc in Italy, 30.1pc in Slovakia, and 25.5pc in France, with all the known damage this does to the life-trajectory of the victims and the productive dynamism of these economies. EU policy elites blame "labour rigidities". The United Nation’s economic arm UNCTAD counters that the EU demand for "wage compression" is itself perpetuating the crisis.
Monti Plans to Resign as Berlusconi Seeks Return to Power in Italy - Italian Prime Minister Mario Monti told the head of state he has lost support in Parliament and intends to resign, while earlier in the day his predecessor, Silvio Berlusconi announced plans for a return to power. Monti will try to corral his coalition, which includes Berlusconi’s People of Liberty Party, for a vote to pass the budget before handing in his “irrevocable resignation” and leaving his post, President Giorgio Napolitano’s office said in an e-mailed statement late yesterday. Monti, 69, will quit immediately if his allies won’t comply, the premier’s spokeswoman, Elisabetta Olivi, said in a telephone interview.
Next Act in Italian Drama: Exit Monti the Technocrat, Enter Monti the Politician? - Mr. Monti’s surprise announcement on Saturday raised the prospect of more political uncertainty and market turmoil for Italy, Europe’s fourth-largest economy, in what is expected to be a gloves-off political campaign. But it also increased the possibility that Mr. Monti might run as a candidate — a shift from the role of an apolitical leader — who is open to governing if no clear winner emerges from elections expected as soon as February. Three years into Europe’s debt crisis, the new developments in Italy underscored the clash between the economically sound and the politically sustainable. While Mr. Monti, an economist and a former European commissioner, has reassured investors and helped keep Italian borrowing rates down, the tax increases and spending cuts passed by his Parliament have eroded lawmakers’ standing with voters.
Italy's Worst 5-Days In 6 Months - It's all good. That's what Monti says about the political 'vacuum' being left behind. Sure enough those cagey bond chaps did not like the news and with Italian and Spanish bond spreads now wider by 40-50bps in the last 4 days, and Italy seeing its worse 5-day run in over 6 months, one could be forgiven for believing some semblance of sanity was returning to pricing in Europe. But no. Stocks, on average, ended the day nicely green - buoyed by a surge in the US into the European close. Spain and Italy's stock markets did drop but regained a lot of the loss by the close. Credit markets (IG, HY, and financials) remain notable underperformers - just unable to muster the enthusiasm of equity holders into year-end. Europe's VIX rose to 17.4% - breaking back north of the US VIX (after recoupling last week). EURUSD is going out unchanged from Friday's close - having traded 50 pips lower early last night.
Berlusconi cliff? - Over the last week it became obvious that Mario Monti was reaching the end of his tenure and Berlusconi’s party held back support. After talks with Italian President, Giorgio Napolitano, over the weekend Mr Monti pre-announced that he would depart his position as soon as the budget for 2013-15 had passed through parliament. Given the overnight falls in Italian markets this appears to have caught many by surprise but I’m unsure why. Mario Monti was always going to have to relinquish his technocratic position and this announcement only brings forward that departure by a few weeks. Perhaps the concern is more about the possible re-rise of Berlusconi, but as I said in my July piece this was always a possibility as continued economic weakens was guaranteed to provide an opportunistic cantilever to not just to Berlusconi but any other anti-euro/anti-austerity politician. The budget law is due to be put before the parliament in the next 2 weeks and , if approved, we could see Mario Monti resign in the last week of December. Italian parliament would then be dissolved and the campaign would begin in earnest with a election date some time in late February. I don’t think it is too much of a stretch to realise that Mr Monti himself is the likely target of political campaigning as the economy has visibly weakened further under his leadership. That’s not to say that instigation of structural reforms, if followed through, won’t have a long term positive affect but it’s an easy target for Berlusconi. Last night’s industrial production was an example:
Mario Monti’s exit is only way to save Italy - Italy has only one serious economic problem. It is in the wrong currency. The nation is richer than Germany in per capita terms, with some €9 trillion of private wealth. It has the biggest primary budget surplus in the G7 bloc. Its combined public and private debt is 265pc of GDP, lower than in France, Holland, the UK, the US or Japan. It scores top of the International Monetary Fund’s index for “long-term debt sustainability” among key industrial nations, precisely because it reformed the pension structure long ago under Silvio Berlusconi. “They have a vibrant export sector, and a primary surplus. If there is any country in EMU that would benefit from leaving the euro and restoring competitiveness, it is obviously Italy,” said Andrew Roberts from RBS. “The numbers are staring them in the face. We think the story of 2013 is not about countries being forced to leave EMU but whether they choose to leave.” A “game theory” study by Bank of America concluded that Italy would gain more than other EMU members from breaking free and restoring sovereign control over its policy levers.
Notes from the continent where good times are always just around the corner - The markets are going into a minor tizzy this morning thanks to the news that Mario Monti is stepping down earlier than expected. And I can certainly understand why people like Beppe Grillo and Silvio Berlusconi might seem like a cause for alarm. But what if Wolfgang Münchau is right, and the real problem in Italy right now is the austerity policies that Monti is pursuing, and that are being praised to the skies by the entire European establishment as we speak? Bang on cue, we learned this morning that Italian industrial output fell by 1.1% in October, much faster than expected. If Wolfgang is right, then what Europhiles (and the markets) should be devoutly hoping for is centrist, Europhile politicians willing to reject the status quo policies that are doing such damage. Why should Eurosceptics have all the best tunes?One of the things that makes it possible for Europe’s politicians to persist with this nonsense is their conviction, like Mr Micawber, that something will turn up. There is no sign in Ireland that anything at all is turning up. The most important indicator of all, employment, is still falling, and you can see signs of strain all around if you care to look. At the panto last night, I was struck by the lack of sparkly fairy wands, light sabres, and all the rest compared with previous years: it really was very noticeable. And these were the people who could still afford to take their kids to the panto. Also noticeable was the almost complete absence of recession jokes, which were such a feature in 2008 and 2009. It just isn’t funny any more.
Bleeding Europe - Krugman - Europe has surprised me with its political resilience — the willingness of debtor nations to endure seemingly endless pain, the ability of the ECB to do just enough, at the very last minute, to calm markets when the financial situation seems ready to explode. But the economics of austerity have played out exactly according to script — the Keynesian script, that is, not the austerian script. Again and again, “responsible” technocrats induce their nations to accept the bitter austerity medicine; again and again, they fail to deliver results. The latest case in point is Italy, where Mario Monti — a good guy, deeply sincere — is leaving early, ultimately because his policies are delivering Italy into depression. (And yes, for the record, this means that Italy won’t get the full Monti.) So what’s the answer? Stay the course, say the Eurocrats. It will work any day now — the confidence fairy is coming! Kevin O’Rourke has it right: Europe has become the continent where good times are always just around the corner. It really is like medieval medicine, where you bled patients to treat their ailments, and when the bleeding made them sicker, you bled them even more.
Return of the Undead: Berlusconi Revival Puts EU Leaders in Tight Spot -- Just 13 months ago, European heads of state and government joined forces to usher Italian premier Silvio Berlusconi into retirement. Chancellor Angela Merkel and then-French President Nicolas Sarkozy marshalled all of their persuasive powers to clear they way for a reform government in Rome under the leadership of Mario Monti. ANZEIGENow, with Prime Minister Monti having said over the weekend that he would resign as soon as he pushes through a key budget law, Italy's least serious politician is back. And Europe is groaning in displeasure. The French leftist paper Libération wrote "The Mummy Returns," a reference to a 2001 movie of the same name. And the otherwise dour German radio broadcaster Deutschlandfunk noted, "It is like a horror film: The undead keep coming back." European political leaders, of course, tend to avoid such drastic formulations. Officially, capital cities on the continent were mum in response to Berlusconi's weekend pledge that he would seek a fifth term as Italian prime minister now that Monti is leaving. After all, diplomatic custom forbids meddling in other countries' internal affairs. But it was difficult to miss the concern hidden between the lines of statements issued on Monday. German Foreign Minister Guido Westerwelle told SPIEGEL ONLINE that the situation in Italy threatened to spark renewed financial problems in the euro zone. "Italy can't stall at two-thirds of the reform process," he said. "That would just cause turbulence not just for Italy, but also for Europe." His counterparts from Sweden and Austria, Carl Bildt and Michael Spindelegger, were just as blunt.
Europe’s 2013 will bring more of the same - As I covered yesterday the most likely approach for the political campaign of a returning Silvio Berlusconi, amongst others, was to play on the fact that under Mario Monti’s technocratic leadership the country had economically worsened. It certainly didn’t take long for him to show his colours:“The Monti government has followed the Germano-centric policies which Europe has tried to impose on other states and it has created a crisis situation much worse than where we were when we were in government,” Berlusconi said in an interview on his own Canale 5 television network. He dismissed the sharp drop on financial markets which followed news of his return, saying the main gauge of investor trust in Italy, the spread between Italian bonds and their safer German counterparts, was “a con”. He also accused Germany of deliberately speculating on the euro zone debt crisis to favor its banks and drive down its own borrowing costs.He won’t be alone and as Ambrose Evans-Pritchard pointed out yesterday an anti-euro/anti-austerity campaign isn’t just some political fantasy. Italy has an economic structure which could easily convert back to the Lire and take full advantage of a lower currency without causing the country too much up-front damage. If there was a country that I saw as a real “convertibility risk” Italy would certainly be up there.There is rumour that Mr Monti is now looking to run for PM in one of the centrist parties, but at this stage it is just that, a rumour. Whether or not Mr Monti could take the leap is yet to be seen, but just in case Berlusconi is certainly front-loading the dirt.
Spain's El Pais calls for immediate bailout - In a front-page editorial, the paper took Prime Minister Mariano Rajoy's right-leaning government to task for delaying an application for a sovereign bailout from Europe. "Delaying the bailout request is equivalent to condemning the Spanish economy to a prolonged and painful recession," said the centre-left paper. El Pais said economists agreed that high Spanish financing costs were strangling the economy, destroying investor confidence and prolonging the recession, perhaps into 2014. Spanish borrowing costs spiked above seven percent in mid-summer but have tumbled since the European Central Bank outlined plans in September to buy stricken states' bonds if they submit to strict conditions first. Nevertheless, they remain painfully high.
Spain to Provide Regions Up to $30 Billion of Funding for 2013 - Spain will lend as much as 23 billion euros ($30 billion) next year to regional governments that can’t sell debt on their own, adding to the Treasury’s borrowing needs. The so-called regional liquidity mechanism will provide as much as 18 billion euros this year and that figure will swell to as much as 23 billion euros in 2013, the Madrid-based Treasury said in a presentation on its website today. The debt agency hasn’t yet set out its issuance program for 2013. The bailout mechanism was created in July as an emergency measure to prevent cash-strapped regions defaulting. Nine of the 17 semi-autonomous states plan to use it this year. Their demand for cash has outstripped what the central government is prepared to offer. Fitch Ratings estimates that Catalonia alone has about 14 billion euros of debt maturing in 2013.
Paris hit by wave of street muggings and grave robberies - Austerity-struck Paris has been hit by a wave of street muggings and grave robberies with thieves prepared to exhume bodies to steal gold and jewellery. Last week, police in the French capital arrested three people as part of a widening grave robbery investigation. There was further public outrage after two masked intruders shot dead a 52-year old precious metal worker when he tried to stop them stealing gold from his foundry in the chic central Parisian district of Le Marais. Police said sky-high market prices for precious metals are acting as a magnet for thieves with scant regard for the living or the dead. In Pantin cemetery, in the north of Paris, dozens of bodies have recently been dug up, with gold teeth and jewellery stolen from them.
German central bank cuts 2013 growth forecast - — Germany's central bank sharply cut its 2013 economic growth forecast to 0.4 percent on Friday, while poor industrial production figures underlined expectations of a weak winter for Europe's biggest economy. The Bundesbank cut its outlook for gross domestic product growth next year from the 1.6 percent it predicted in June. It also lowered its forecast for 2012 to 0.7 percent from 1 percent. That put the central bank's outlook well below the government's prediction of 0.8 percent growth this year and 1 percent growth in 2013. However, the Bundesbank forecast a rebound to 1.9 percent growth in 2014 if the debt crisis in the 17-country eurozone doesn't escalate further and uncertainty among investors and consumers eases.
Greek Debt Buyback Falls Short Of Goal, Will Reduce Greek Debt/GDP Target Less Than Required - Reuters has disclosed the outcome of the Greek debt buyback, citing a Eurozone official, which while completed at €32 billion, has missed it hard goal by €450 million, and as a result the completely unbelievable Greek 2020 debt/GDP target will be 126.6% instead of 124%. Reuters also reports that the average price on the buyback was 33.5 cents on the euro. As a result of the higher price paid for the buyback, the outcome is that Greek debt/GDP will be reduced by 9.5%, or less than the 11% targeted. Earlier, it was also reported that with virtually all Greek banks having sold out of their Greek bond exposure, all Greek private debt is now in foreign hands. It is unclear how holdouts will be dealt with, and what, if any, rights they will have following the transaction. Finally, as to the 2020 debt/GDP target, one can only hope that the Greek GDP, which is a rather critical component of the debt/GDP calculation, will now rise in a straight diagonal line up and to the right as the Troika expects it to do. Sadly, it won't.
On the sad algebra of the Greek Debt Buyback -- In a previous post, I dissected the recent Eurogroup plan to save Greece (again!). Today I single out the debt buyback operation which is a crucial aspect of that plan. The net debt reduction that any debt buyback operation achieves is simple to compute: By spending sum S on purchasing its own bonds, at a ‘distressed’ y% of face value, the debtor (in this case the Greek government) can expect a net debt reduction equal to NDD = S times {(100-y)/y}. The last Eurogroup decision proclaimed a target of reducing Greece’s debt by 40 billion in aggregate. Of that sum, 2 billion would be the result of a reduction in the interest rate payable on Bailout Mk2 loans and another 7 billion will come from the ECB returning to Greece the profits it is making from past purchases of Greek government bonds (in the context of the ill-fated SMP). Which means that a further 31 billion of debt reduction is placed on the shoulders of the debt buyback. The Eurogroup also decided to set the price at which bonds would be repurchased at y=28% of face value – the price at closing on the preceding Friday. With 10 billion at its disposal, the Greek government would, at best, manage to reduce its debt by 25.7 billion, assuming that Greek banks sell all 15 billion of their holdings and, in addition, hedge funds add another 25 billion (of the 45 they hold) to the pot. We see that, even under these ideal conditions, the debt reduction program agreed at the Eurogroup would be short of 5.3 billion. Alas, the conditions are far from ideal and the benefits will be much, much thinner. Indeed, since the Eurogroup decision, the goalposts have been moved and the rules have changed.
22% Of Irish Population Living In Jobless Households - Today a new research report on Work and Poverty in Ireland by the Economic and Social Research Institute (ESRI) has been published. The report measures changes in the level of jobless households (households where adults spend less than one fifth of the available time in employment) and in-work poverty in Ireland. The focus of the report is on working-age adults and their dependent children between 2004 and 2010, a period spanning economic growth and deep recession. The report finds that the percentage of people in jobless households increased very rapidly after the start of the recession, from 15 per cent in 2007 to 22 per cent in 2010. The percentage in Ireland is now double the average across Europe. The high rate in Ireland is partly due to the level of unemployment, but other important factors are that, compared to other EU countries, jobless adults in Ireland are less likely to live with a working adult and they are much more likely to live with children.
EU seals deal on banks watchdog — The EU looks set to end a difficult year on a high note, clearing bailout funds for Greece on Thursday to tame the debt crisis at its heart after agreeing a key bank oversight deal to bolster the union. EU leaders meet after their finance ministers thrashed out a complex bank supervision deal in marathon talks overnight, a key step towards a banking union which they hope will ring fence banks in trouble to prevent future crises. The 17 eurozone finance ministers meanwhile turn to Greece early on Thursday to review a debt buy-back scheme and see if Athens has done enough for them to finally release long-delayed bailout funds needed to avert a Greek debt default. German Chancellor Angela Merkel said on Thursday that she hoped the Greek funding would be released after the buy-back, designed to cut Greece's overall debt by about 20 billion euros ($26 billion) and put it on a sustainable basis. If as expected Greece gets the go-ahead, EU leaders can go into their summit later in the day in the hope they have made real progress in resolving a debt crisis which has brought the economy to its knees after three gruelling years.
Eurozone agrees ECB banking supervision rules: European finance ministers have reached a deal on rules for supervising eurozone banks, ahead of an EU summit. Around 200 of the biggest banks will come under the direct oversight of the European Central Bank, which will act as chief supervisor of eurozone banks. The agreement - a key step towards banking union - will be put before European leaders later on Thursday. New rules on prudent banking are seen as vital to bolster the euro, as bank failures triggered the financial crash. The measures are also aimed at preventing banking failures, of the type that happened in Greece and Spain, ending up on the books of eurozone governments.
Eurozone bank deal: Group edges towards union: In the middle of the night, Europe's finance ministers took another major step towards closer integration. They agreed to set up a single supervisor for the eurozone's banks. From 2014, the European Central Bank (ECB) will be directly supervising around 200 of the largest banks - but will have the right to intervene if smaller lenders are in trouble. The ECB will have sweeping new powers and ultimately it will allow the EU's main rescue fund to channel aid directly to struggling banks. For countries like Spain this could prove a significant lifeline. For these measures are not just about oversight, they are about breaking the loop where the failures of banks ended up on the books of governments so increasing national debt. This deal represents another significant transfer of authority away from national governments to a European institution.
Europe gets a banking union - Europe’s financial leaders have managed to pull together a deal for the beginnings of a banking union with an agreement to let the ECB become the supervisory authority for major European banks. The statement from the European council can be found here, and a good wrap is provided by OpenEurope: EU finance ministers last night reached a technical agreement on creating a new single financial supervisor at the ECB. The ECB will supervise banks with assets worth more than €30bn or 20% of their state’s GDP – thought to be around 200 out of 6,000 eurozone banks. National supervisors will run the day to day supervision of the other banks, although the ECB can intervene if it sees fit. The aim is to have the new supervisor set up by March 2013, although German Finance Minister Wolfgang Schäuble made it clear that plans to use the ESM, the eurozone bailout fund, to recapitalise banks directly could not be in place before 2014. The UK, Sweden and the Czech Republic rejected joining the single supervisor and secured safeguards to ensure they are not automatically outvoted at the European Banking Authority (EBA). Regulations in the EBA will now need approval by a simple majority of countries in the single supervisor and those not in, as well as a general qualified majority of all EU members – known as the double majority principle. UK Chancellor George Osborne said that the UK had secured a “very good deal” – similar to that proposed by Open Europe – and that the “single market was protected”.
EU Punts on Creating Timetable for Fiscal and Banking Unions - Those looking for a step in the right direction today can find it in the Financial Times Live Blog which announces "EU drops timetable for creating eurozone fiscal and banking union". EU heads of state and government have started gathering in Brussels even though their summit isn’t scheduled to begin until 5pm. Last night, however, Herman Van Rompuy, president of the European Council, circulated a final draft of the summit communiqué, and we got our hands on it. The 12-page document differs from a version circulated last week in several significant ways – most notably completely dropping a timetable for creating a fiscal and banking union in the eurozone. Van Rompuy’s pet idea of getting eurozone countries to commit to signing binding contracts with Brussels on economic reform programmes – essentially forcing upon all euro members the kind of detailed plans now only agreed with bailout countries – has also been significantly watered down. In the original version, EU leaders would have explicitly endorsed the idea. In the new version, they are simply cited as an idea that “could” enhance ownership of reform programmes. Rather than come to any conclusion on the issue, the draft says it will be addressed again at a March summit “after an informal process of consultations with Member States”.
Merkel sets limits on euro zone risk-sharing - Reuters) - European leaders agreed on Friday to press on with further steps to tackle their debt crisis but German Chancellor Angela Merkel threw out a proposal to boost risk-sharing with a fund to help euro zone states in trouble. Germany's rejection of an idea strongly backed by France showed the potential for more tensions over crisis management, a day after the bloc clinched a deal on euro zone-wide banking supervision and approved long-delayed aid to Greece. After more than eight hours of late-night talks, leaders promised to push ahead with setting up a mechanism to wind down problem banks and launched talks on how to make countries stick to economic targets with the help of a common fund. But at an early morning news conference, Merkel made clear that proposals for a substantial "shock absorber" fund and common unemployment insurance were off the table, setting out a far more restrained carrot-and-stick vision. "We are talking about support linked to improvements in competitiveness." Merkel told reporters of the fund envisaged. "We are talking about a very limited budget. Not three digit billions, rather 10 or 15 or 20 billion euros."
Mirabile Dictu! EU Gets Tough on Banker Pay, Proposes Strict Bonus Limits - Yves Smith - Bankers are now hoist on their own austerity petard. The fact that ordinary citizen all across the Eurozone are seeing lower incomes, lower levels of social services, and can expect only more of the same seems to have led to a sudden outburst of resolve to make sure that bankers take the pain along with everyone else. The Financial Times gives the overview: Bankers’ bonuses in Europe would be capped at two times fixed salary under a tentative EU agreement that would mark the most severe crackdown on pay since the 2008 financial crisis. The European parliament and negotiators for member states drafted a deal in Strasbourg on Thursday that would impose a 1:1 bonus to salary ratio, which can be increased to 2:1 with the backing of a supermajority of shareholders.The draft terms, which would apply to all banks operating in the EU, will come as a shock to the industry, which was bracing itself for a fixed cap of some kind but was relying on the UK and Germany putting pressure on to relax the limit. Now this is quite a way from getting done, particularly since at the beginning of the year, Cyprus will no longer be managing the negotiations and Ireland will step into its place. In addition, the idea of setting a cap on bonuses without restricting salaries is just asking for banks to increase salaries, which they also did the last time bonus caps were mooted, right after the crisis. It would be much better to impose a maximum wage, say of 25 times the pay of the lowest paid worker, including contractors who work more than a specified number of weeks a year (with pay of part-timers grossed up to full time equivalent).
Low expectations ahead of EU summit - EU leaders have agreed to stabilize Europe's financial system with a banking union. But as the ideas become more concrete, disagreements among the decision makers have been growing ahead of this week's summit. This week's summit is likely to combine the worst of two worlds: meager results with a lot of quarreling. When EU leaders meet on Thursday and Friday in Brussels, they have to reach agreement on at least one thing, EU Commission President Jose Manuel Barroso said on Wednesday (12.12.2012): what an agreed common body to supervise Europe's banks will look like in detail. This, Barroso said, was the "most important step" toward strengthening the common economic and monetary union. Barroso also emphasized the need to push for further austerity and reforms. Fiscal discipline in the financially-stricken countries had to go hand-in-hand with help from solvent countries, he added. "We need both. It's not a question of choosing between solidarity and responsibility."
Sweden’s Euro Hostility Hits A Record - As the Eurozone flails about to keep its chin above the debt crisis that is drowning periphery countries, and as the European Union struggles to duct-tape itself together with more “integration,” that is governance by unelected transnational eurocrats, Sweden is having second thoughts: never before has there been such hostility toward the euro. Sweden is a special case. It joined the EU in 1995 after its people had graciously been allowed to express their will in a referendum in 1994—with 52.3% voting in favor. As every country that joins the EU, Sweden signed an accession treaty that obligates it to adopt the euro, but without deadline. So in 2003, the government thought time had come to make the move. It asked the people in a non-binding referendum if they wanted to accede to the Eurozone. The people rebelled. They demolished the euro, with 55.9% voting against it and 42% for it. And the European power structure learned a lesson: don’t let the riffraff decide; it was the last time that people in the EU had been allowed to vote on the euro. But in Sweden, the euro is on the table twice a year via a survey by the Swedish statistical agency that asks people how they’d vote if a referendum were held “today” on joining the euro. The results of the survey conducted in November just came out. Sobering results: 82.3% would vote against joining the euro, only 9.6% would vote for it, and 8% were betwixt and between. The euro’s descent into utter unpopularity hell set a new record.
Former President of the Central Bank of Belgium on Why the Money System is a Taboo Topic - from Yves Smith: Lively and provocative. Do yourself a favor and watch it.
Counterparties: Central bankers are the new rockstars - Here’s a type of attention that has escaped most of the financial world in the last few years: resounding praise. And it’s being directed at practitioners of that dullest of financial professions, central banking. Mario Draghi, the head of the European Central Bank, is the FT’s person of the year. Draghi gets the nod for standing against an existential threat with almost Churchillian resolve and rhetoric: “Within our mandate, the ECB is ready to do whatever it takes to preserve the euro… And believe me, it will be enough”. The FT calls that July statement a “turning point in the three-year-old crisis” that “in effect dared financial markets to challenge the ECB’s unlimited firepower”. Draghi has necessarily made the job deeply political: Matt Yglesias compared Draghi’s ECB to a “shadow government” enforcing budget cuts. Draghi’s peers around the world are also receiving lavish plaudits from just about everybody (except, of course, those US politicians with their subtle threats). Zachary Karabel writes that central bankers are not only being forced to repeatedly save the world, “they are tending to the financial system with greater nimbleness, creativity and maturity than their political counterparts or any other societal actor”. The Economist calls this “the grey man’s burden” and says that today’s central bankers are the “most powerful and daring players in the global economy”.If you’re looking to put a number on central bankers’ value: The Atlantic’s Matthew O’Brien, comparing nominal and potential GDP, found that a team of “superstar” central bankers can be worth a trillion dollars a year. No wonder the UK imported its next central banker.
Mark Carney hints at need for radical action to boost ailing economies - Mr Carney, the current Bank of Canada governor who takes over from Sir Mervyn King next June, said central bankers should consider committing to low interest rates until inflation and unemployment met “precise numerical thresholds”, or even changing “the policy framework itself” to stimulate a desperately weak economy. His words were directed at the Bank of Canada but will be seen as a hint that he will push for radical action in the UK, where the economy has been stagnant for two years. On his appointment, he said that he would be going “where the challenges are greatest”. Addressing the Chartered Financial Analyst Society in Toronto, Mr Carney said that in major slumps: “To achieve a better path for the economy over time, a central bank may need to commit credibly to maintaining highly accommodative policy even after the economy and, potentially, inflation picks up. “To 'tie its hands’, a central bank could publicly announce precise numerical thresholds for inflation and unemployment that must be met before reducing stimulus.” He added: “If yet further stimulus were required, the policy framework itself would likely have to be changed. For example, adopting a nominal GDP level target could in many respects be more powerful than employing thresholds under flexible inflation targeting.”
Mark Carney suggests targeting economic output - Mark Carney, who will take over as governor of the Bank of England next year, has suggested targeting economic output instead of inflation. At the moment, the Bank's job is to aim for an inflation target of 2%. Targeting gross domestic product (GDP) that has not been adjusted for inflation would mean the economy would have to catch up with previous shortfalls, Mr Carney said in a speech. He said it might be a good option when interest rates were near zero. Mr Carney is currently governor of the Bank of Canada. He said one problem with changing the target would be that "people must generally understand what the central bank is doing - an admittedly high bar". It was his first speech since the unexpected announcement of his appointment to the Bank of England (BoE) top job. Targeting the country's economic output rather than inflation would be a major change to monetary policy, although it is not within the power of the Bank to change its target.
Carney differs from Bank of England orthodoxy - Mark Carney will not take up his position as Governor of the Bank of England until 1 July 2013, but in the interim he will be speaking frequently about monetary policy in his current role as Governor of the Bank of Canada. It is inevitable that his words will now be judged in a new light, especially when he makes generic comments about monetary policy, rather than specific remarks confined to the Canadian situation. This is why his speech on “Guidance” on Tuesday was so interesting. Although he stated that this speech did not contain any direct signals about policy in Canada or anywhere else, it did give clear indications about his general thinking on the future of unconventional monetary easing. Furthermore, his thinking appears to be different in several important respects from that of the Bank of England’s current Governor and the MPC. Mr Carney is not exactly naive, and he must surely have realised that his words would be interpreted in this way. (See Claire Jones’ news story here.)The Carney philosophy on the next steps on unconventional monetary easing is more Ben Bernanke than Mervyn King in flavour, though it goes even further than the Fed chairman in embracing nominal GDP level targets if circumstances warrant it. There are three areas where Mr Carney’s thinking might unsettle the current orthodoxy at Threadneedle Street, all of them in a more dovish direction.
Carney under pressure as battle for Basel III rages - Financial protectionism and US intransigence blight the Basel III drive, testing the mettle of Basel’s chief cheerleaders, Bank of England governor-designate Mark Carney and Swedish central bank governor Stefan Ingves. The post-Lehman bid to craft harmonized global banking standards is under severe strain amid a global policy rift and fierce lobbying. Global policymakers are understandably putting on a brave face when touting progress made in implementing the Basel III accord, even after the US announced earlier this year it would postpone the January 2013 start date, triggering the ire of EU banks and calls for a tit-for-tat delay. “[Nearly] 90% of the US financial system is on a path to Basel III,” Mark Carney, Bank of Canada governor, and chairman of the Financial Stability Board (FSB) at Basel, said on December 11 in a speech to the Toronto CFA Society. “So the facts on the ground are that the core of the US banking system has built capital, has built around $300 billion of capital. It is being stress-tested back to Basel III norms, and so the core – not just the core but 90% of the US financial system – is on a path to Basel III."
Central banks should see beyond inflation - Like generals, central bankers always fight the last war. Today’s global policy elite is influenced above all by the fight against inflation, which was the predominant challenge of their formative years. Eddie George, a former Bank of England governor, is said to have begged senior politicians shortly before his death to never again loose the inflationary genie he had spent his life bottling. German economists, meanwhile, are obsessed by the (false) idea that the rise of Hitler was a consequence of hyperinflation unleashed by the Reichsbank in the early 1920s, rather than the deflation of the 1930s. But the fight against inflation has been well and truly won. And in recent days there have even been signs – in Shinzo Abe’s flirtation with an inflation target in Japan, and the Federal Reserve commitment to keep interest rates near zero until unemployment falls to 6.5 per cent – that the global policy elite has begun to see inflation as the least painful instrument of debt erosion. In the UK too there is a whiff of change in the air. Since the BoE was granted operational independence over monetary policy in 1998 it has operated under a mandate, set by parliament, to meet an inflation target of 2 per cent. Until now this target has been pursued by an ideologically orthodox governor. An imminent change at the top, however, may provide the perfect occasion to shift the mandate in an American direction. The UK needs more inflation. It is good for the government (less fiscal consolidation would be needed to bring down the stock of debt). It is good for most companies and households (for whom debt exceeds savings and is more likely to be nominally denominated). By reducing real debt, it would make companies and households more creditworthy, making banks more likely to lend, and at lower rates. It should also reduce the value of sterling, boosting exports and reducing imports.
Some Thoughts on Fiscal Rules - In one area macroeconomic policy in the UK is well ahead of the US or the Eurozone: the use of fiscal rules. The US seems to prefer cliffs to rules - yes, I know that is a cheap jibe, but you know what I mean. In the Eurozone fiscal rules now come in packs, the individual parts of which are of variable quality and may not be consistent with each other. By contrast, the surviving UK fiscal rule (or ‘mandate’) makes some limited sense, as did Gordon Brown’s predecessors. It says the government should achieve structural (cyclically adjusted) balance, excluding investment spending, within five years - where that five year period rolls forward. What is good about this rule? Its main advantage is that, by having a rolling target, nothing is adjusted too quickly. One thing that stands out from the literature is that, as long as you are able to sell debt, fiscal adjustments should be slow, and the government’s deficit should act as a shock absorber. The analogy with consumption smoothing is pretty close. Now it is true that a rolling target could allow a government to keep delaying adjustment, but that is hardly a problem right now. Two additional features of the UK rule are the use of the cyclically adjusted deficit and the exclusion of investment. Although cyclical adjustment gets talked about a lot, for this particular rule it would in normal times be largely irrelevant, because we would expect to have a zero output gap in five years time anyway. Right now it is not irrelevant, but I will have more to say about the current conjuncture below.
What Is Wrong with the UK Economy? - Adam Posen - The British economy is lacking productive investment, but not for want of investment opportunities. Banks and large corporations are sitting on cash, households are holding back on large purchases (including of housing), and the public sector is slashing its investment flow. This shortfall reflects the deficiencies of the British domestic financial system, some of them longstanding from well before 2008, as much as lack of confidence in future prospects, and responsible macroeconomic policy can address both problems. The current British coalition government’s economic policy program, however, instead is intended to address a lack of savings, not of investment, and is pursuing that mistaken priority in a self-defeating way. The economic issue facing the UK therefore is not just one of Plan A versus B, or of the amount and pace of austerity versus growth – the issue is that the UK needs investment friendly structural reform and stimulus, not fiscal consolidation as a goal in and of itself. If we were to listen to the Chancellor and Prime Minister, we would be told that the challenge facing the British people is to trim their spending to match their diminished means. The claim is that they cannot get credit anymore the way they used to, either as households or as a government, to borrow against future earnings; in fact they have to pay down the debts from their past spending binge to prevent risk of having their remaining credit lines pulled. Furthermore, any shortfall in paying that debt off would be seen as proof that the British ability and willingness to pay lenders has declined, according to Chancellor Osborne. Unfortunately, the Bank of England Monetary Policy Committee [MPC] and the Office of Budget Responsibility [OBR] have of late supported this mistaken view by adjusting their forecasts for UK economic growth down, essentially assuming that recent that recent poor performance means future performance will be nearly as poor – that is, that the potential or underlying growth rate of the UK economy has diminished.
UK employment hits record levels - FT.com: The labour market provided some respite from gloomy economic data as employment rose to its highest level since records began in 1971. The number of people in work increased by 40,000 to 29.6m in the three months to October, the Office for National Statistics said. But that was the slowest rise since January, confirming that the recent jobs boom was slowing. Unemployment was 2.51m – down 82,000 on the previous quarter but virtually unchanged on the three months to September. The jobless rate was 7.8 per cent of the workforce, unchanged since last month’s data. That was slightly better than expected by economists, who had forecast a rise to 7.9 per cent. Youth unemployment fell for a third successive month, with the number of unemployed 16 to 24-year-olds down 72,000 at 945,000, or 20.3 per cent of the workforce in that age group. The government announced it was extending the youth contract wage incentive, which gives employers up to £2,275 if they take on an unemployed young person. From next week it will be available for employers taking on any 18 to 24-year-old who has been claiming benefits for six months – three months earlier than at present. The number of people claiming jobseekers’ allowance fell by 3,000 in November to 1.58m, after two months of rises. Economists had expected an increase.
Google's tax avoidance is called 'capitalism', says chairman Eric Schmidt - Telegraph: Google chairman Eric Schmidt has insisted that he is "very proud" of the company's tax structure, and said that measures to lower its payments were just "capitalism". Mr Schmidt's comments risk inflaming the row over the amount of tax multinationals pay, after it emerged that Google funnelled $9.8bn (£6.07bn) of revenues from international subsidiaries into Bermuda last year in order to halve its tax bill. However, Mr Schmidt defended the company's legitimate tax arrangements. “We pay lots of taxes; we pay them in the legally prescribed ways,” he told Bloomberg. “I am very proud of the structure that we set up. We did it based on the incentives that the governments offered us to operate.” “It’s called capitalism,” he said. “We are proudly capitalistic. I’m not confused about this.” In Britain Vince Cable was unimpressed by Mr Schmidt’s views. The Business Secretary told The Daily Telegraph: “It may well be [capitalism] but it’s certainly not the job of governments to accommodate it.”
Police raid Deutsche HQ in tax probe - Deutsche Bank co-chief executive Jürgen Fitschen has been drawn into a widening tax evasion investigation related to carbon trading at Germany's biggest lender as hundreds of police and tax inspectors raided the bank's offices. Prosecutors said they were investigating 25 staff on suspicion of tax evasion, money laundering and obstruction of justice, and searched the headquarters and private residences in Berlin, Düsseldorf and Frankfurt. "Two of Deutsche Bank's management board members, Jürgen Fitschen and Stefan Krause, are involved in the investigations as they signed the value-added tax statement for 2009," the lender said. In 2009, Fitschen was Germany chief and Krause was chief financial officer, a post he has retained. About 500 police and tax inspectors raided Deutsche Bank, arresting five staff in an inquiry linked to a tax scam involving the trading of carbon permits. Tax officials clutching backpacks and suitcases were seen leaving the bank's twin-tower headquarters in Frankfurt. About 20 police minibuses and two coaches were parked outside.
Three arrested in Libor manipulation investigation - A former UBS and Citigroup banker and two others had their homes raided early on Tuesday morning and were taken in for questioning as part of the Serious Fraud Office investigation into the manipulation of Libor interest rates. The intervention came amid mounting speculation that the Financial Services Authority is preparing to take action against a number of banks in relation to Libor setting. The SFO and City of London police arrested three men aged 33, 41 and 47 after searching a house in Surrey and two properties in Essex. The three were taken to a London police station to be interviewed "in connection with the investigation into the manipulation of Libor". The three are understood to be Tom Hayes, who has worked for a number of banks including UBS and Citigroup, and two men who worked for City-based inter-dealer broker RP Martin – Terry Farr and Jim Gilmour. They are either on leave or have left the company. Citi and UBS declined to comment. RP Martin stressed it was co-operating with the authorities but not under investigation.
Bank Fraud: Underlings Arrested, Banks Too Big to Indict: The first three arrests have been made in London in connection with the LIBOR (London Interbank Offered Rate) rate-fixing scandal. Three unnamed traders were taken into custody Tuesday (11 December 2012). According to the Associated Press the three were British nationals. Reports have not revealed where the three were employed. The arrests were made by London police in collaboration with the SFO (Serious Fraud Office) of the British government. Other criminal investigations are ongoing around the world, according to Reuters, but the only arrests thus far are these in London. Reuters specifically mentioned that investigations were underway "across Europe, the United States, Canada and Japan." In a separate case, a settlement has been announced in New York for HSBC to settle criminal fraud charges by paying a "fine" and other charges totaling $1.92 billion. The charges concerned the failure of the bank to conform to legal requirements to prevent money laundering for clients doing business with customers in Iran, Libya, Sudan, Burma and Cuba. In other words, these are fines for permitting the bank to commit felonies. Reuters has said that HSBC is "too big to indict."
The City of London is a criminal sink – Understanding the ‘...Anomie of Affluence...’!: If you are one of those who had to save for your own private pension (not one who got some obscene payoff like a rogue banker) then you will know what a bloody raw deal you got after all those with their snouts in the financial trough had finished chewing off lumps of your saved pension pot. If you were one of those who needed a loan and then got shafted with a PPI contract that you didn't want, didn't need but were told you had to have, you will understand. If you were one who had a commercial loan which was pulled from under you when it most suited the bank, leaving you financially ruined, you know what I am talking about. If you have followed the scandals involving the manipulation of LIBOR, or the way in which once-famous British Banks have been openlylaundering money for foreign criminals through foreign branches, but with the vast majority of that money coming back through the City, you will know what I mean. The City of London, in recent years, has become a criminal sink, populated by a criminogenic community of spivs and wideboys made wealthy beyond the dreams of avarice, by the ludicrous pay schemes and bonus awards, made possible in an environment where all sense of worth, value, and ordinary law-conformity, has been jettisoned, in return for vast sums of money far and beyond anything that might normally have been paid only a few years ago. The entire financial sector has become an organised criminal entity. The quid for this pro quo, is that the performers in this financial farrago are required to continue to maintain a steady stream of profit, and increasingly, as that profit becomes harder to achieve by lawful means, so the criminal means take over.


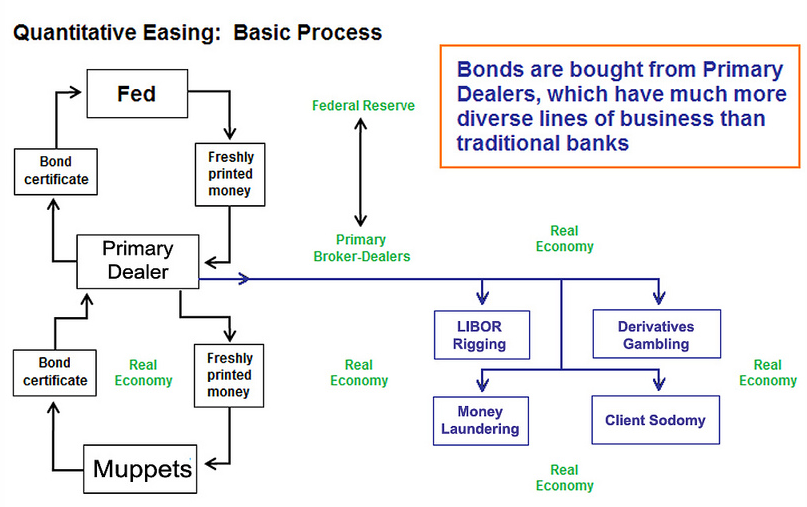
No comments:
Post a Comment