FRB: H.4.1 Release--Factors Affecting Reserve Balances--January 29, 2015 - Federal Reserve statistical release H.4.1: Factors Affecting Reserve Balances of Depository Institutions and Condition Statement of Federal Reserve Banks
The Fed is accused of complacency -- The Federal Open Market Committee of the Federal Reserve (FOMC) will meet on Wednesday amid signs that the broad consensus among economists in favour of an interest rate increase around mid year is beginning to crumble. So far, there is no public indication that Ms Yellen and her key supporters are changing their minds, but many leading economists outside the Fed, from across the spectrum of economic thought, are now vehemently opposed to the Fed’s plan. It would not be surprising if the Yellen camp were reviewing their intended date for lift off, though we are not likely to see much evidence of this at the January FOMC meeting. Since the last FOMC meeting in December, when Ms Yellen gave a very clear signal in favour of a June lift off, the market has moved sharply in a more dovish direction. Bond yields have continued to plummet, with break-even inflation expectations falling markedly. Furthermore, the front end of the bond market is now ignoring the FOMC’s projections for rates almost completely (see the “dots” chart on the right), in effect challenging Chair Yellen to tell them next week that they are wrong. This is getting much more tricky for Ms Yellen. The smooth, fully anticipated, glide path towards a June lift off is now being seriously challenged, both in the markets, and among influential outside economists, who are directly accusing the Fed of complacency (here and here). But there is still some time left before the final decision has to be made. The Fed Chair will probably want to retain her option to move in June in next week’s FOMC statement but, on the other hand, is unlikely want to deliver a major hawkish shock to market opinion at this stage. This week’s meeting will be a holding operation.
Alan S. Blinder: Beware of Woolly-Minded Attacks on the Fed - As almost everyone knows, this year the Federal Reserve will start to “exit” from its hyper-expansionary monetary policies. But the Fed may also spend the year defending itself against a series of congressional attacks on its independence. The barrage started on Jan. 12, when a seemingly innocuous provision was tucked into a piece of must-pass legislation, the Terrorism Risk Insurance Act, with no hearings, no congressional debate and, for the most part, no notice. The law now requires that the seven-member Federal Reserve Board include “at least 1 member with demonstrated primary experience working in or supervising community banks having less than $10,000,000,000 in total assets.’’ Now, there is nothing wrong with having a community banker on the Fed board; and President Obama ’s announced nominee, Allan Landon, seems well qualified. The problem is assigning board seats to specific constituencies. What about big bankers? Labor leaders? Home builders? Professors? Democrats? Republicans? As Fed Chair Janet Yellen explained at a congressional hearing in July, this could lead to “earmarking each seat for a particular kind of expertise.” Yes, the new law could Balkanize and politicize the Fed. For example, what will happen when Democrats realize that virtually all community bankers are Republicans? Worse things are on the horizon. Two related proposals that failed in the 113th Congress are slated for a comeback in the 114th. Each would encourage congressional meddling with monetary policy.
FOMC Statement: "Economic activity has been expanding at a solid pace", "Patient" on Policy - As expected ... solid growth, patient on policy. FOMC Statement: Information received since the Federal Open Market Committee met in December suggests that economic activity has been expanding at a solid pace. Labor market conditions have improved further, with strong job gains and a lower unemployment rate. On balance, a range of labor market indicators suggests that underutilization of labor resources continues to diminish. Household spending is rising moderately; recent declines in energy prices have boosted household purchasing power. Business fixed investment is advancing, while the recovery in the housing sector remains slow. Inflation has declined further below the Committee’s longer-run objective, largely reflecting declines in energy prices. Market-based measures of inflation compensation have declined substantially in recent months; survey-based measures of longer-term inflation expectations have remained stable. To support continued progress toward maximum employment and price stability, the Committee today reaffirmed its view that the current 0 to 1/4 percent target range for the federal funds rate remains appropriate. In determining how long to maintain this target range, the Committee will assess progress--both realized and expected--toward its objectives of maximum employment and 2 percent inflation. This assessment will take into account a wide range of information, including measures of labor market conditions, indicators of inflation pressures and inflation expectations, and readings on financial and international developments. Based on its current assessment, the Committee judges that it can be patient in beginning to normalize the stance of monetary policy. However, if incoming information indicates faster progress toward the Committee’s employment and inflation objectives than the Committee now expects, then increases in the target range for the federal funds rate are likely to occur sooner than currently anticipated. Conversely, if progress proves slower than expected, then increases in the target range are likely to occur later than currently anticipated.
Read the Full Text of the Fed’s Statement -- Here is the full statement text from the Federal Reserve’s policy-making committee.
Parsing the Fed: How the Statement Changed - The Federal Reserve releases a statement at the conclusion of each of its policy-setting meetings, outlining the central bank’s economic outlook and the actions it plans to take. Much of the statement remains the same from meeting to meeting. Fed watchers closely parse changes between statements to see how the Fed’s views are evolving. The following tool compares the latest statement with its immediate predecessor and highlights where policy makers have updated their language. This is the January statement compared with December:
Fed Watch: FOMC Decision -- If you were looking for fireworks from today's FOMC statement, you were disappointed. Indeed, you need to work pretty hard to pull a story out of this statement. It provided little reason to believe that the Fed has shifted its view since December. A June rate hike remains the base case.The Fed's assessment of the current statement is arguably the best in years: Information received since the Federal Open Market Committee met in December suggests that economic activity has been expanding at a solid pace. Labor market conditions have improved further, with strong job gains and a lower unemployment rate. On balance, a range of labor market indicators suggests that underutilization of labor resources continues to diminish. Household spending is rising moderately; recent declines in energy prices have boosted household purchasing power. Business fixed investment is advancing, while the recovery in the housing sector remains slow. The Fed is simply not seeing any warning signs in recent data. Regarding inflation: Inflation has declined further below the Committee’s longer-run objective, largely reflecting declines in energy prices. Market-based measures of inflation compensation have declined substantially in recent months; survey-based measures of longer-term inflation expectations have remained stable. They continue to dismiss headline inflation, and I think they will continue to do so. And if you continue to insist that the Fed is paralyzed with fear over market based measures of inflation expectations, note that they do not refer to these as "expectations" measures. It is inflation "compensation."
Federal Reserve Won’t Raise Interest Rates Before June, at Earliest - The Federal Reserve kept its options open on Wednesday, signaling that it would not raise short-term interest rates any earlier than June, while leaving unresolved how much longer it might be willing to wait before lifting its benchmark rate from near zero, where the central bank has held it for more than six years.Treating the recent turmoil in markets as essentially meaningless noise, the Fed issued its most upbeat assessment of economic conditions since the recession, after its first policy-making meeting of the year, in a statement that noted solid economic growth and strong job growth.But the optimistic tone was tempered by the Fed’s acknowledgment that inflation has slowed markedly in recent months and is likely to slow even more, making it harder for the Fed to determine how quickly to retreat from its stimulus campaign.Fed officials for more than a year have pointed to the summer of 2015 as the likely time for the central bank to increase its benchmark interest rate, but investors are increasingly convinced that the sluggish pace of inflation will force the Fed to wait until fall at the earliest. The Fed, for now, is basically watching economic developments to see what happens. “They don’t want to exclude June from the range of options at this point,” said Tim Duy, an economist at the University of Oregon who follows the Fed closely. “June is still five months off, and they have no intention of deciding just yet.”
Deciphering the Fed: ‘Solid’ Beats ‘Moderate,’ and ‘Strong’ is Even Better - The Federal Reserve chooses its words carefully, though it doesn’t always say exactly what officials mean. The central bank said in its policy statement Wednesday the economy “has been expanding at a solid pace,” and characterized recent job gains as “strong.” Both were tweaks from the December statement, which had said the economy was “expanding at a moderate pace” accompanied by “solid” job gains. The Fed doesn’t distribute an official handbook for translating such subtle changes, but close observers of the central bank have developed an unofficial guide. Among them, it’s generally understood that “moderate” is a little better than “modest.” And “solid” growth represents an upgrade from “moderate.” When the Fed met on Dec. 16-17, the Commerce Department was estimating gross domestic product grew at a 3.9% annual rate in the third quarter. By the end of the year, the government had upgraded its estimate to a 5% pace, making it the U.S. economy’s strongest quarter in 11 years. So what about the job gains that had been “solid” in December but were “strong” by January? That’s also an upgrade, though the data are a little less clear-cut. The final jobs report before the Fed’s December meeting described robust hiring in November, and payroll growth actually slowed in December. But thanks to revisions, the three-month moving average for payroll gains moved higher, to 289,000 in December from 278,000 in November. Unemployment fell to 5.6% last month, the lowest level since June 2008. All subtle distinctions, perhaps, but Kremlinology-like semantic wrangling is nothing new for Fed-watchers.
Another Plunging Economic Indicator: The Fed Yammering Index --If you want to understand the complexity of monetary policy, you could read and interpret the Federal Reserve‘s policy statement or you could just do a word count. The results of the latter method are displayed in our tongue-in-cheek Yammering Index. The length of Federal Open Market Committee statements grew during the recession, as the Fed went from tinkering with interest rates to throwing open its balance sheet and buying trillions of dollars of mortgage-backed securities and Treasury bonds, the policies known as quantitative easing. The statement stayed elevated as the central bank initiated the second round of QE, then a new bond-purchase program called Operation Twist, and then the third round of QE. QE has now ended and the central bank is being “patient” before taking its next steps toward normal monetary policy. The statement is already returning to more normal levels. Today’s statement registered at 569 words, making it the shortest statement since October 2012, just one meeting after the Fed began mortgage purchases in QE3 but before it added outright Treasury purchases.
Fed’s Williams Upbeat on Economy, Says Summer Rate Rise Likely - Federal Reserve Bank of San Francisco President John Williams said Friday the U.S. economy remains on a solid path that will open the door to interest-rate increases in the summer. In an interview with CNBC, Mr. Williams said, “I see a lot of strength in the domestic economy,” adding there’s “a lot of momentum for very good growth.” He indicated he is not worried by the unexpectedly soft 2.6% fourth-quarter gross domestic product reading reported earlier Friday, and predicted 2015 will see activity rise by about 3%. Mr. Williams also expects to see the economy near “full employment” by year-end, with the jobless rate hitting 5% from its current 5.6% level.All of that opens the door for the Fed to raise rates off their current levels near zero. “Around midyear is a good guess for when we are getting around that point that raising rates will be appropriate,” Mr. Williams told CNBC. “I’m not predicting it will be June or any particular meeting, but I think we are getting closer to that point” when the Fed can start to act, he said. Mr. Williams is a voting member of the monetary policy-setting Federal Open Market Committee. That body met earlier in the week. It continued to prepare the way for rate increases, but signaled patience in terms of when it would actually move. Most officials expect to see rates increase this year, with key officials favoring the middle of the year. Mr. Williams has for some time pointed to summer as the most probable time to boost rates. Mr. Williams allowed that inflation levels well under 2% were a “big story” for the Fed. He continues to believe that after a weak start to the year on oil-related factors, job market gains and signs of rising wages will start to push inflation back toward 2%, a level he sees being attained by the end of 2016.
Fed’s Bullard Says Zero Rates No Longer Appropriate for U.S. -- Federal Reserve Bank of St. Louis President James Bullard said on Friday that the U.S. economy remains on a solid path that argues for raising interest rates relatively soon. Keeping interest rates near zero “is not the right interest rate for this economy. We are much closer to our goals than we have been in a long time. Inflation is a little bit low, but it is not low enough to rationalize the zero interest rate policy,” Mr. Bullard told Bloomberg TV. “As long as we feel confident that inflation will go back toward target, and right now that is my baseline projection that inflation will go back toward target, I think we are certainly able and willing” to raise rates, Mr. Bullard said. Mr. Bullard shrugged off the underwhelming U.S. growth data reported earlier in the day, in which the fourth-quarter gross domestic product was reported at an under-expectations 2.6% rise. He said the number was “fine,” adding that “there are a lot of good things going on in the U.S. economy.” The official said that he expects what is currently a 5.6% jobless rate to fall to under 5% in the third quarter of this year. Mr. Bullard was interviewed in the wake of this week’s monetary-policy setting Federal Open Market Committee meeting, when central bankers kept short-term interest rates near zero but continued to prepare the way for increasing interest rates. Most Fed officials have signaled that the increase is likely to happen this year, with some officials pointing to the middle of the year as the most appropriate time to act. In recent comments, however, Mr. Bullard has argued in favor of a more aggressive strategy, saying robust gains in hiring and solid growth indicate the Fed should boost rates by the end of the first quarter. Others believe this is too soon given how far short inflation is of the Fed’s 2% target.
The Fed That Never Sees It Coming -- Yesterday, the Federal Open Market Committee (FOMC) released its policy statement and rattled markets here and abroad overnight. The statement contained a number of economic absurdities. The first sentence argued that “economic activity has been expanding at a solid pace” while a few sentences later we are told “inflation has declined further below the Committee’s longer-run objective.” A solid expansion simply does not correlate with declining inflation in the U.S. and mushrooming deflation among our trading partners. Later in the statement the Fed tells us that inflation will be heading back toward the goal of 2 percent once “the transitory effects of lower energy prices and other factors dissipate.” There is no evidentiary basis offered to support the idea that the historic collapse in oil prices will be “transitory.” The “other factors” remain vague because to enumerate the other factors – slack demand around the globe creating a monster surplus of supply – would destroy the argument that the oil price collapse will be transitory. (And remember, it’s not just energy prices that are swooning, it’s a broad range of industrial commodities which the Fed conveniently fails to mention.) Bond markets around the world, including the U.S. Treasury market, think Yellen is full of it. Shortly after the FOMC statement was released, the 30-year Treasury hit an historic record low yield of 2.295 percent. The yield on our longest dated Treasury bond reflects two elements: the long-range outlook for inflation and a perceived safe-haven to weather a looming economic upheaval. Yesterday, the yield on the 30-year Treasury also represented one more thing: a no confidence vote that the U.S. Fed knows how to read the global tea leaves.
Fed’s Interest Rate Floor May Leak No More - The Fed announced Wednesday that in addition to the overnight reverse repurchase agreements it’s offered since September 2013, it will make multiday operations available, too. The new round of so-called “term” reverse repurchase agreements, building on similar operations put in place around the turn of the year, shows that the central bank is continuing to explore ways it can maintain a firm hold over short-term interest rates. Through reverse repos, the Fed takes in cash from eligible investment banks and money managers in exchange for loans of Treasury securities owned by the central bank. The rate the Fed sets for this transaction—currently at 0.05%–is supposed to set a lower boundary for all short-term rates in the U.S. economy. The Fed has said it will use reverse repos to supplement other tools when officials decide to raise rates from near zero. When the Fed first launched its reverse repo program in September 2013, operations were unlimited in size. But rising concern about the program’s impact on financial stability induced the central bank to place a $300 billion borrowing cap on the program last September. Due to the program’s rules, when bidding interest exceeds the cap, short-term rates can fall below the Fed’s targeted range. That generated widespread concern the reverse repos would not provide consistent control over borrowing costs.Those fears proved to be well-founded at the end of September, when high demand at the end of the quarter sent the rate on the reverse repo facility to 0%, which in turn pushed some other types of short-term borrowing costs into negative territory. In the wake of that experience, the Fed announced a series of multi-day reverse repos over the turn of the year. These longer-term actions helped spread out demand, while at the same time permitting program participants to park additional money at the central bank. The apparent success of those year-end reverse repos appears to be driving the Fed to explore more fully how term operations can help it keep control over rates.
Wage rise puzzle tests the Federal Reserve - FT.com: Barack Obama claimed on Tuesday that wages in America are starting to pick up as America turns the page on the great recession. Whether the president’s optimistic verdict in his State of the Union speech is borne out is a critical question not only for US politics but for the Federal Reserve when it meets this week to consider interest rates. Mr Obama appeared to base his assertion on a recent survey of 568 small businesses that pointed to higher pay intentions in the coming months. The government’s own headline monthly measure of earnings is far less encouraging, however, with average hourly earnings dropping 0.2 per cent in December from November and increasing only 1.7 per cent from the previous year. This comes despite America’s strongest year for job creation since 1999 and an unemployment rate of 5.6 per cent, well below the heights of 10 per cent reached in late 2009. Officials were taken aback by the feeble December wage data, and if downbeat core inflation and earnings numbers continue it could trigger renewed calls for a delay to interest-rate rises. To many Americans, the muted pay growth is a predictable continuation of a longstanding blight. Stephanie Jones, 49, who works in nursing in Greensboro, North Carolina, says basic rates of pay in her sector have shown little movement for five years. “It’s pretty stagnant and the workload is getting heavier and heavier,” she says. The official figures bear that verdict out for many. A breakdown by the Economic Policy Institute shows that wages adjusted for inflation in health and education services were just 2 per cent higher at the end of 2014 than they were half a decade earlier in November 2009 — when unemployment started dropping from its peak. Wages in leisure and hospitality fell in the same period, as they did in construction, while information technology and finance saw better numbers, with earnings up by 6 per cent in both sectors.
The Fed's Not So Excellent Adventure - Quantitive easing, qualitative easing, yield curves, repos, interbank loans, interest rates, reserves, sterilization, discount windows, open market purchases, monetization, and of course mesmerization to calm the speculators are just some of the monetary gears and wheels that to the untrained eye appears to be a Rube Goldberg machine that no mere mortal can comprehend. To others it is not a machine, but a dance where bond and stock markets undulate to the monetary music emanating from the central bankers. It is simply impossible to stand still on the intoxicating monetary dance floor with yesterday's interest rate too low, and tomorrow's too high. But the needle on the old vinyl LP seems to be stuck in a rut. Central bankers around the world have painfully discovered that their textbook theories of money supply and low interest rates fall short (e.g. near zero interest rates did not bring hyper inflation, nor the missing borrowers to the table). So what once sounded like a beautiful melody is grinding louder and louder as noise. In an attempt to separate signal from noise, I thought it might be fun to take my theory of economics which fully rejects the Quantity of Money (QTM) and apply it to the logic of central banking and see where the chips might fall. As the readers of my previous articles (listed below) know, I have argued there has never been a sound theory of economics because there has never been a complete theory of money. In short, I define money as "domestic arbitrary scale" which can only function properly in a closed (protectionist) economy. Under this new definition, fiat (paper) money is treated as effectively infinite in supply, and relies on the critical mechanism of a minimum wage defined by government decree.
Audit the Fed? Not so fast: Not this again. Calls to “Audit the Fed” are back. And just as before, they are extraordinarily dangerous to the health of the U.S. economy. First, a little background. Conspiracy theories about the Federal Reserve’s wacky technical mumbo-jumbo voodoo have a long populist history. Monetary policy is complicated and abstract; entrusting it to a secretive, propeller-headed cabal naturally arouses suspicion. No surprise, then, that libertarian hero and former Texas congressman Ron Paul for years tried to persuade his colleagues to curb the central bank’s power and independence with recurrent calls to “Audit the Fed” (if not kill it entirely). He made Fed audits a centerpiece of his 2008 and 2012 presidential campaigns. Now, with Republicans controlling both houses of Congress, he might finally get his way. Sen. Rand Paul (R-Ky.) has picked up his father’s mantle and reintroduced the proposal as the Federal Reserve Transparency Act of 2015. Sen. Ted Cruz (R-Tex.) — like Paul a likely 2016 presidential contender — has also joined the cause, along with 29 other co-sponsors. A companion bill was introduced in the House by Rep. Thomas Massie (R-Ky.).
The Fed can’t accurately forecast inflation. Here’s why this may hurt Democrats. - A common rule of thumb among economists is that left-wing governments pursue polices that lower unemployment but cause inflation. Right-wing governments are expected to fight inflation even at the cost of higher unemployment. Recent experiences suggest that this rule isn’t all that accurate. There actually isn’t much difference in economic policies under left and right-wing governments. So what then are the consequences of monetary policy-makers sticking to this rule of thumb? In a recent article (gated, ungated) we investigated this question by looking at the United States Federal Reserves’ inflation forecasts. Monetary policy-making is inherently forward-looking. Interest rates are set with expectations of future inflation in mind. In pursuit of price stability, modern central banks aim for moderate inflation. In many places the goal is 2 percent. Crudely, if central bankers think that inflation will be too high, then they raise interest rates to tamp it down. This tends to also slow economic growth and employment. Central bankers can respond to inflation that is too low by lowering interest rates. This tends to also increase economic growth and employment. When inflation is overestimated, central bankers may implement monetary policies that inappropriately slow growth. On the other hand, when inflation is underestimated, policies may fuel economic growth and possibly future bubbles. Expectations about inflation thus have an important impact on our everyday lives.
A Midsummer Disinflation Nightmare for the Fed? - How transitory is the inflation impact of plunging oil prices? The answer to that question could hold the key to whether the Federal Reserve raises interest rates in midyear, as many economists still expect, or waits until September or later, just to make sure inflation is rising toward the central bank’s 2% goal. Persistently low inflation is seen as a sign of weak economic demand, and U.S. consumer price growth has been undershooting the Fed’s target for over 2 1/2 years. Fed officials have said they expect inflation to rise after the temporary effects of lower energy prices fade. Some Wall Street economists, however, have started to predict low inflation will cause the central bank to wait a little longer before raising its benchmark short-term rate from near zero, where it has been since December 2008. “It is all but certain that headline CPI will turn negative on a year-over-year basis starting in January, and deepen into the summer,” write Morgan Stanley economists in a research note, referring to the Labor Department’s consumer price index. “Indeed, deflation is likely to prevail for the first three quarters of this year.” They said Tuesday they expect the Fed to wait until March 2016 to start raising rates. Previously, they had predicted liftoff in January 2016.
Two Fed Officials: Why Very Weak Inflation Unlikely to Deter Rate Hikes - How can the Federal Reserve even think about raising rates when price pressures are falling so short of the central bank’s official 2% target? That’s been a question on the minds of many central bank watchers, some Fed officials and financial market participants for some time. Inflation has fallen short of the Fed’s goal for two-and-a-half years. The crash in oil prices means overall levels of inflation are set to drop from already tepid levels, with a number of analysts predicting negative readings over coming months. And yet, every indication suggests that Fed officials remain unbowed in their desire to begin to raise short-term rates from their near zero levels this year.Two central bankers on Friday explained why they both foresee a likely rise in rates despite an inflation environment that seemingly argues against such a move. For John Williams of the San Francisco Fed and James Bullard of the St. Louis Fed, it comes down to a combination of success in promoting unemployment and growth, and their assessment of the overall influence of monetary policy. Mr. Williams, a close ally of Fed Chairwoman Janet Yellen and a voting member of the monetary-policy setting Federal Open Market Committee, said in an interview on CNBC Friday that he continues to believe “around mid-year is a good guess for when we are getting around that point that raising rates will be appropriate.” He added, “I’m not predicting it will be June or any particularly meeting, but I think we are getting closer to that point.” . “I’m not talking about normalizing monetary policy or even tightening monetary policy,” Mr. Williams said. “I’m talking about starting a process where we trim back some of this extraordinary accommodation,” and small rate increases are unlikely to restrain what he believes will be a recovery in price pressures, the official said.
Get Ready For Negative Interest Rates In The US - With Fed mouthpiece Jon Hilsenrath warning - in no lesser status-quo narrative-deliverer than The Wall Street Journal - that The ECB's actions (and pre-emptive collapse in the EUR) means the U.S. economy must deal with a rapidly strengthening dollar that will make American goods more expensive abroad, potentially slowing both U.S. growth and inflation; and Treasury Secretary Lew coming out his crypt to mention "unfair FX moves," it appears The Fed (and powers that be) are worrying about King Dollar. This suggests, as Mises Canada's Patrick Barron predicts, the Fed will start charging negative interest rates on bank reserve accounts as the final tool in the war on savings and wealth in order to spur the Keynesian goal of increasing “aggregate demand”. If savers won’t spend their money, the government will take it from them.
The Strong Dollar Is Always Good, Except When It Isn’t - The European Central Bank significantly loosened its monetary policy on Thursday, in the process driving down the euro and bolstering the dollar. Measured against a basket of currencies, the dollar’s value has soared 19 percent since May, and the momentum seems to be building. “A strong dollar has always been a good thing for the United States,” Treasury Secretary Jacob J. Lew declared not long ago, a position that he has restated frequently. But is it really a good thing — for the United States and the global economy? A weaker dollar meant that American exports were more competitive in world markets and consumption of imported goods was declining. In turn, that trimmed America’s trade and budget deficits, stimulated the domestic economy, and helped to spur job creation. A weaker dollar was, arguably, one of the reasons for the health of the American economy, compared with other nations. The stronger dollar that has resulted from that period of American advantage could reverse some of the progress that the United States has made. That’s not obviously a good thing for the United States. Paying ritualistic homage to the dollar isn’t limited to recent Democratic administrations. After leaving office, Paul O’Neill, Treasury secretary under President George W. Bush in 2001 and 2002, recalled those years: “I was not supposed to say anything but ‘strong dollar, strong dollar.’ I argued then and would argue now that the idea of a strong-dollar policy is a vacuous notion.” “The notion that a strong country always has a strong currency isn’t something that many countries subscribe to,” he said. As a continental power that doesn’t rely on exports to the extent that many other nations do, he said, “the United States has been able to sustain the illusion of the importance of a strong currency, but really, when the dollar is fairly strong, as it is now, it’s a mixed blessing for the economy of the United States.”
It’s not the euro that’s getting cheaper; it’s the dollar that’s getting more expensive -- You may have noticed that a US dollar goes a lot further in much of Europe than it used to. In fact, it goes about 25 per cent further. Put another way, the euro fell by 20 per cent against the dollar in less than a year. One popular explanation is that weakening economic conditions increased anticipation that the European Central Bank would buy a lot of bonds, which would somehow cause the euro to depreciate against its trading partners. (Cue “currency wars” rhetoric.) This story isn’t completely wrong, but it’s worth comparing the euro to other currencies to get a sense of what has really been driving the move in EURUSD. The chart below compares the performance of the euro against the other major (floating) currencies over the same period, indexed to start at 100 so that it’s easier to make comparisons: The euro actually appreciated against the Swedish krona and Norwegian krone since the start of 2014. If we start on July 1 — when the euro began its precipitous drop against the US dollar — the single currency fell by less than 6 per cent against the pound and held its value even better against the rest of the floating currencies in the G10. (We exclude the Swiss franc because it had been held below its fair value by the Swiss National Bank for several years, only to spike upwards once the intervention ended.) For comparison, here is the dollar against those same currencies. Notice anything different? For one thing, there’s the scale. The euro just hasn’t moved that much against the other G10 currencies when compared to the big swings in the US dollar. The other difference is that while the euro moved up against some currencies and down against others, the dollar has soared against practically everyone else. Since July 1, the greenback appreciated by more than 14 per cent against sterling and significantly more against the other currencies in our sample. Even the Swiss franc’s recent spike only brought it back to where it was at the beginning of May, relative to the dollar.
Oil and the dollar will complicate the U.S. revival - At the start of 2015, two familiar features dominate the global economic outlook: continuing turbulence in financial markets and the relative strength of the US recovery. One aspect of America's superior performance, though, has received surprisingly little attention, and that's the marked decline in the country's external deficit. The shrinking of the current-account deficit -- from its peak of almost 6 percent of US gross domestic product in 2006 to 2.3 percent in 2013 -- ought to be a big story. Bear in mind, it happened even though the US has enjoyed stronger growth in domestic demand than either Europe or Japan, and despite the recent strength of the dollar. That took some doing.One crucial variable is the price of oil. The US is a net oil importer, so the collapse in crude-oil prices has squeezed the current-account deficit. In the short term, it will continue to do so; in the longer term, however, other forces will come into play. Cheap oil will boost the real incomes of U.S. consumers, allowing them to spend more on imports. In addition, if the price of oil stays down, the recent surge of investment in the domestic production of shale oil and gas may stall or even go into reverse. The technological opportunity afforded by fracking -- and the prospect of a permanent improvement in the U.S. balance of trade in oil -- could be undone. Another big factor is the aforementioned strength of the dollar. Over the past year, the dollar has appreciated against almost all the main currencies. Even if the connection isn't apparent yet, a stronger dollar will slow the decline of the US deficit.
GDP: Annual and Q4-over-Q4 -- The advance estimate for Q4 GDP will be released this week. The consensus forecast is that real GDP increased 3.2% annualized in Q4. The FOMC GDP projections are for Q4-over-Q4. The most recent FOMC projection was for real GDP to increase 2.3% to 2.5% Q4 2014 over Q4 2013. However many analysts forecast annual GDP, so here is a discussion of the difference between annual and Q4-over-Q4: The Bureau of Economic Analysis (BEA) reports real GDP growth on a seasonally adjusted annual rate (SAAR) basis. So this is adjusted for inflation (real), seasonally adjusted, and annualized. Other countries report GDP differently - as an example China reports GDP growth on a year-over-year basis, and the UK reports GDP growth for each quarter, but not annualized. A 3.2% annualized real growth rate in the US would be reported at 0.79% quarterly in the UK (not annualized). Not much difference between the annual rate and Q4-over-Q4, but it might be a little confusing when GDP is reported this week. Some articles might report the Q4-over-Q4 growth rate that the FOMC is looking at - other articles might report 2014 over 2013.
Forecasting Q4 GDP: A Look at the WSJ Economists' Collective Crystal Ball -- The big economic number this week will be the Q4 Advance Estimate for GDP on Friday at 8:30 AM EST. Let's take a look at the GDP forecasts from the latest Wall Street Journal survey of economists conducted earlier this month. Here's a snapshot of the full array of WSJ opinions about Q4 GDP. I've highlighted the values for the median (middle), mean (average) and mode (most frequent). In the latest forecast, the median and mean were an identical to one decimal place at 3.0%. The mode (seven of 65 forecasts) was a tad higher at 3.2%, and the second most frequent value was a higher 3.4%. As the visualization above illustrates, despite the matchup of the median and mean, the latest WSJ survey had it outliers, ranging from a grimly pessimistic 1.4% to a trio at 4.0% and an even more optimistic forecast of 4.2%. Investing.com aligns with the median & mean WSJ economists with its 3.0% forecast. The Briefing.com consensus goes with the WSJ mode at 3.2%, but its own estimate is for a higher 3.4%. Friday's release of the Advance Estimate for Q4 GDP is, of course, a rear-view mirror look at the economy. The WSJ survey also asks the participants to forecast GDP for the four quarters of 2015. Here is a table documenting the median, mean and extremes for those forecasts. Interestingly enough (or should I say "boringly enough"), the median to one decimal place is unchanged at 3.0% for the next four quarters, and the mean oscillates by a fractional 0.1%.
U.S. Fourth Quarter Economic Growth Lower than Expected U.S. economic growth slowed sharply in the fourth quarter as weak business spending and a wider trade deficit offset the fastest pace of consumer spending since 2006. Gross domestic product expanded at a 2.6 percent annual pace after the third quarter's spectacular 5 percent rate, the Commerce Department said in its first fourth-quarter GDP snapshot on Friday. The slowdown, which follows two back-to-back quarters of bullish growth, is likely to be short-lived given the enormous tailwind from lower gasoline prices. Most economists believe fundamentals in the United States are strong enough to cushion the blow on growth from weakening overseas economies. "We look for strong domestic consumption to continue supporting growth momentum in the coming quarters even as investment suffers due to falling oil prices," said Gennadiy Goldberg, an economist at TD Securities in New York. Even with the moderation in the fourth quarter, growth remained above the 2.5 percent pace, which is considered to be the economy's potential. Economists had expected GDP to expand at a 3 percent rate in the fourth quarter.
U.S. Economy Slowed in 4th Quarter, but Consumer Spending Boomed - NYTimes.com: Economic growth slowed at the end of 2014, but robust consumer spending during the final quarter of the year, which is expected to continue as Americans enjoy the benefits of lower energy prices, suggested that the economy was likely to pick up speed again in 2015.At 2.6 percent, the rate of growth in the final three months of the year was a significant downshift from the blistering 5 percent pace recorded in the third quarter, but is still considered relatively healthy.For all of 2014, the economy grew at a rate of 2.4 percent, the Commerce Department reported Friday morning, roughly in line with the underlying trend of the last five years.Business investment slowed in late 2014, reversing strong gains in the previous two quarters. Many economists expect business spending to be lackluster in the coming months, hurt by deep cuts among drillers and other energy companies amid plunging oil prices.Economists were looking for growth of just over 3 percent. A large part of the shortfall stemmed from the lower spending by the federal government, which tends to be volatile. Of that, military spending in particular was a major drag on the overall figure, subtracting about 0.4 percentage point from total growth. A weaker trade balance also caused the economy to cool slightly as 2014 came to a close. Imports, which subtract from the rate of expansion in gross domestic product, surged even as export gains slowed, a sign that economic weakness in Europe and other overseas markets was affecting American companies. But consumer spending, which represents the bulk of economic activity, increased at a 4.3 percent rate in the final three months of 2014, the fastest quarterly increase since the first quarter of 2006. Since the beginning of December, gas prices have fallen by roughly 50 cents a gallon across the country to just over $2 a gallon. Although energy prices had been edging lower since the summer, the steepening drop is already translating into more optimism amid consumers, and further savings are expected.
BEA: Real GDP increased at 2.6% Annualized Rate in Q4 - From the BEA: Gross Domestic Product: Fourth Quarter and Annual 2014 (Advance Estimate) Real gross domestic product -- the value of the production of goods and services in the United States, adjusted for price changes -- increased at an annual rate of 2.6 percent in the fourth quarter of 2014, according to the "advance" estimate released by the Bureau of Economic Analysis. In the third quarter, real GDP increased 5.0 percent...The increase in real GDP in the fourth quarter reflected positive contributions from personal consumption expenditures (PCE), private inventory investment, exports, nonresidential fixed investment, state and local government spending, and residential fixed investment that were partly offset by a negative contribution from federal government spending. Imports, which are a subtraction in the calculation of GDP, increased. The deceleration in real GDP growth in the fourth quarter primarily reflected an upturn in imports, a downturn in federal government spending, and decelerations in nonresidential fixed investment and in exports that were partly offset by an upturn in private inventory investment and an acceleration in PCE. The price index for gross domestic purchases, which measures prices paid by U.S. residents, decreased 0.3 percent in the fourth quarter, in contrast to an increase of 1.4 percent in the third. Excluding food and energy prices, the price index for gross domestic purchases increased 0.7 percent, compared with an increase of 1.6 percent. The advance Q4 GDP report, with 2.6% annualized growth, was below expectations of a 3.2% increase. Personal consumption expenditures (PCE) increased at a 4.3% annualized rate - a strong pace! The key negatives were trade (subtracted 1.02 percentage point) and Federal government spending (subtracted 0.54 percentage points).
U.S. Fourth-Quarter GDP – At A Glance - U.S. gross domestic product advanced 2.6% at an annual rate in the fourth quarter, the Commerce Department said Friday. The numbers provide the broadest measure of economic output, though they may end up heavily revised in coming weeks. For now, here are some key takeaways. GDP expanded at a 4.6% seasonally adjusted annual rate in the second quarter and 5.0% in the third, the best figure for a three-month span in 11 years. Advance figures for the final three months of the year show a slowdown in the pace, though overall growth remains positive. Using different measures, fourth-quarter GDP grew by 2.5% from the same period a year earlier, fairly consistent with post-recession performance. Growth for the entire year was 2.4% from 2013. Consumers held up their end of the deal in the final quarter of the year. Friday’s report showed personal consumption expenditures rose 4.3%, the biggest gain since the first quarter of 2006. Americans have been particularly upbeat lately, with the Conference Board’s index of consumer confidence jumping to its highest since August 2007 this month. Stronger hiring and cheaper gasoline, which leave more discretionary income for most people, are likely behind the brighter outlook. Consumer spending accounts for about 70% of demand in the U.S. economy. Business investment, another indicator of broader economic health, has been one recent trouble spot. A separate Commerce Department report out earlier this month showed the fourth straight monthly decline in orders for a key category of capital goods. Friday’s report showed spending on structures, equipment and products like software rose at a 1.9% pace in the fourth quarter. Such so-called nonresidential fixed investment added only .24 percentage point to GDP, the lowest figure since the second quarter of 2013. The cause for the slowdown isn’t entirely clear, though some economists think budget cuts in the oil and gas sector alongside weakness overseas may be squeezing some U.S. companies. The dollar has been rising against the euro, the yen and other currencies since midsummer, posing a challenge for U.S. exporters whose products are suddenly more expensive overseas. Friday’s report showed that exports rose at a 2.8% pace, a marked slowdown from the prior two quarters. Imports, meanwhile, surged, making trade an overall drag on GDP. Government Government spending was another negative for growth in the final three months of the year. The big culprit was oft-volatile national defense spending, which plunged 12.5%. Nondefense spending only inched ahead at a 1.7% pace from the prior quarter. Overall, government activity subtracted 0.4% from GDP.
Q4 Annualized GDP Misses, Tumbles To 2.6% From 5.0%; Surging Personal Consumption Pulled Forward From 2015 -- Following last quarter's upward revised 5.0% GDP, driven higher mostly as a result of even more mandatory Obamacare taxation, Q4 GDP had nowhere else to go but down, the only question was how much. Wall Street estimated 3.0%. Moments ago we got the first estimate for Q4 GDP and it was a miss, printing at 2.6%, and nearly 50% below the Q3 annualized number. This also means that the final 2014 GDP is 2.4%, higher than the 2.2% in 2013 as well as the 2.3% in 2012. And while the overall report was disappointing, with GDP dragged down mostly by Imports which contributed to -1.39% of GDP, which in turn is driven by lower crude prices. Remember when plunging crude was unambiguously good? Well, not for GDP. And what's worse, the impact on Fixed Investment, which contributed 0.37% to GDP in Q4, down from 1.18% in Q2, is yet to be felt as energy company after company cuts its Capex spending.
- The good news: Personal Consumption spending contributed 2.87% of the GDP number or more than the total print, growing 4.3% Q/Q, above the 4.0% expected. This was the highest annualized quarterly consumption since Q1 2006.
- The bad news: much of the consumption that economists had expected would take place in Q1 was pulled forward, and a result Q1 GDP will now be revised even lower.
As US Growth Slows in Q4, Inflation Turns Negative -- The Bureau of Economic Analysis reported today that the growth rate of real GDP slowed to an annual rate of 2.6 percent in the fourth quarter of 2014. That is barely half of the 5 percent rate reported for the third quarter, but still a bit above the 2.4 percent average growth rate since the recovery began in mid-2009. Today’s advance estimate is based on preliminary data and is subject to revision. The average revision from the advance to the third estimate, without regard to sign, is 0.6 percentage points. Today’s release from the BEA includes a set of inflation estimates that are based on data from the national income accounts and thus represent an independent check on the more widely reported consumer price index compiled by the Bureau of Labor Statistics. The most closely watched of the BEA’s inflation indicators is the index for personal consumption expenditures (PCE index), which is used by the Federal Reserve as a guide to monetary policy. The PCE index decreased at a -0.5 percent annual rate in the quarter, putting it far below the Fed’s official target of +2 percent. A supplementary market-based version of the PCE index fell even more rapidly, at -1.1 percent. The market-based index excludes financial services and other items for which there are no observable market prices. Most of the reported decrease in the price level was due to falling energy prices. The core PCE index, which excludes food and energy, increased by 0.7 percent for both the standard and market-based versions. As the chart shows, all three versions of the PCE index have been trending down over the past three years. However, that does not mean that the US is following the Eurozone into outright deflation. For one thing, even the weakest of the US indicators, the market-based PCE index, is still up by 1 percent compared with its level a year ago. That contrasts with the case for the EZ, where prices have fallen on a year-over-year basis. In addition, as explained in this recent post, deflation that is driven mainly by supply-side factors, such as improving productivity or a decrease in import prices, is not “real” deflation that carries a risk of a self-reinforcing downward spiral.
Five takeaways from slower US growth - FT.com: After a powerful growth spurt over the summer, the US economy slowed markedly in the final three months of the year. While aspects of Friday’s figures were undoubtedly disappointing — in particular the export data — they do not by any means suggest an economy that is running off the road. If anything, they could add to the optimism about the outlook for consumer spending — which is in line for a further boost thanks to the halving in oil prices. Gross domestic product rose an annualised 2.6 per cent in the fourth quarter — a marked slowdown from the 5 per cent pace set in the third quarter. The big driver was household consumption, which rose at a 4.3 per cent annualised pace. The main disappointment was weak net exports, which subtracted 1 percentage point from growth. While imports rose 8.9 per cent, export growth was far slower at 2.8 per cent. Public spending also imposed a drag, with falling government consumption subtracting 0.4 percentage point from growth. The figures are weaker than Wall Street expectations for growth of at least 3 per cent, and they highlight the drag that weak demand overseas is imposing on the economy. The rising dollar, which was up more than 8 per cent on a trade-weighted basis in December from a year earlier — could impose further pressure on exporters. However, exports account for a small share of American GDP, and it is important to put these data in context. The 2.6 per cent growth in headline GDP is still faster than the 2.3 per cent annual average set in the first 21 quarters of the recovery. As Jim O’Sullivan of High Frequency Economics pointed out, the Fed’s focus is on inflation and employment — and on the latter front the story is positive with unemployment likely to head lower from the current 5.6 per cent rate. The consumer spending figures were the strongest since 2006, and they suggest the domestic recovery is on track. Consumer optimism is at its highest level since 2004, with households citing a stronger outlook for employment and wages along with falling petrol prices. According to Barclays economists, the numbers provide “clear evidence” that the decline in energy prices is already boosting real household income. That windfall is likely to continue. According to economists at RBC Capital, every penny move in petrol prices is worth an annualised $1.06bn in consumer pocketbooks.
Disappointed by 2.6% Growth? Blame the U.S. Trade Deficit - The U.S. economy expanded a disappointing 2.6% in the fourth quarter—about half the summer’s blowout pace of 5%. What happened? In short, blame the U.S. trade deficit. The government’s GDP number reflects everything that’s produced in the U.S. over the past three months, minus the imported goods and services purchased by Americans. The idea is to measure how much Americans’ demand for goods and services is being met within the U.S., rather than by companies abroad. Imports rose briskly in the fourth quarter while exports rose only modestly, weighing on overall GDP. But that’s not an entirely bad thing, because Americans buying iPhones, Hyundais and other foreign-made items signals they are in good financial shape and gaining confidence. The rise in imports also likely reflects the strengthening dollar that has effectively made them cheaper. Thus “net exports”–the difference between exports and imports—subtracted 1 percentage point from today’s headline GDP. Put another way, the economy would have grown at a healthy 3.6% clip, not the sluggish 2.6%, without the trade effect. A measure within the GDP report–real gross domestic purchases—addresses this by showing total spending over the prior period, regardless of where the products were made. The figure has picked up over the past year. Real gross domestic purchases climbed 3% in the fourth quarter compared with a year earlier, the strongest rate since the final three months of 2010.
Comment on Q4 GDP and Investment: R-E-L-A-X - There are legitimate concerns about a strong dollar, and weak economic activity overseas, impacting U.S. exports and GDP growth. However, overall, the Q4 GDP report was solid. The key numbers are: 1) PCE increased at a 4.3% annual rate in Q4 (the two month method nails it again), and 2) private fixed investment increased at a 2.3% rate. The negatives were trade (subtracted 1.02 percentage point) and Federal government spending (subtracted 0.54 percentage points). As usual, I like to focus on private fixed investment because that is the key to the business cycle. The first graph shows the Year-over-year (YoY) change in real GDP, real PCE, and real fixed private investment. It appears the pace of growth for real GDP and PCE has been picking up a little. Real GDP was up 2.5% Q1 over Q1, and real PCE was up 2.8%. Both will show stronger growth next quarter (since Q1 2014 was so weak). The dashed black line is the year-over-year change in private fixed investment. This slowed a little in Q4, but has been increasing solidly. The graph below shows the contribution to GDP from residential investment, equipment and software, and nonresidential structures (3 quarter trailing average). This is important to follow because residential investment tends to lead the economy, equipment and software is generally coincident, and nonresidential structure investment trails the economy. In the graph, red is residential, green is equipment and software, and blue is investment in non-residential structures. So the usual pattern - both into and out of recessions is - red, green, blue. The dashed gray line is the contribution from the change in private inventories.
Yes, a Northeast Blizzard Can Slow U.S. Economic Growth - Snowstorms are bad for the economy, at least in the short term. Then they might offer an economic lift, as we learned over the last year. A major nor’easter is expected to dump up to three feet of snow in much of the Northeastern U.S. through Tuesday evening, according to the National Oceanic and Atmospheric Administration. Major metropolitan areas including New York City and Boston may experience blizzard conditions. “We’re talking about a highly populated area where a lot of economic activity takes place,” said Ben Herzon, senior economist at Macroeconomic Advisers. “If activity is slowed for a few days, a week, it could have an effect on GDP.” The forecasting group estimated that unusually harsh weather last winter knocked 0.1 percentage point off of fourth-quarter gross domestic product in 2013 and 1.4 percentage point off of the first quarter of 2014. That January to March span saw GDP, the broadest measure of economic output, shrink by 2.1%, marking the weakest performance since the recession. Payroll growth also was particularly poor, with December 2013 through March 2014 averaging just over 163,000 a month, compared with 246,000 for the full year.
CBO Budget and Economic Outlook: 2015 to 2025 -- Lots of numbers here, including a new Jan 2015 Baseline for Social Security Just started poking at the numbers but it seems that CBO has revised projected revenue for SocSec down going forward. Not by a lot but perhaps enough to make Brother Krasting happy. But in the interest of ‘Numbers for All!!!’ and before I dive back in here are the links for Bears to start their own foraging. Update: Well I found the smoking gun that drives those revenue forecasts. It is on page 114 in App A. A change in CBO’s forecast of economic growth lowered revenue projections for the 2017–2024 period. CBO has slightly reduced its projection for the pace of economic growth over the 2016–2019 period: Real (inflationadjusted) GDP is now projected to be about 1.1 percent lower, on average, over the 2017–2024 period than CBO anticipated in August, and nominal GDP—the main source of taxable income—is projected to be lower by 1.2 percent over the same period. (The projection for inflation as measured by the price indexes for GDP is little changed.) Consequently, CBO also has lowered its projections for wages and salaries—the most highly taxed type of income specified in the economic forecast—by an average of 1.2 percent over the 2017–2024 period. That change in the forecast has led CBO to make a downward adjustment—of slightly more than $300 billion (or 1.1 percent)—in its projections of revenue from individual income and payroll taxes for that period.
US budget deficit to shrink again this year: The US budget deficit is expected to shrink in the current fiscal year but climb after 2017 as spending mounts on health and retirement benefits, a government agency said Monday. The Congressional Budget Office, the independent agency that provides economic and budgetary analysis to Congress, projected the deficit in fiscal 2015, which ends September 30, would total $468 billion, or 2.6 percent of gross domestic product, the smallest shortfall relative to GDP since 2007. In 2014, the federal government deficit had hit its lowest level in six years at $483 billion, falling below 3.0 percent of GDP for the first time since 2007. The deficits have been shrinking as the economy pulls out of the deep 2008-2009 recession, supported by trillions of dollars of public aid and sharp government spending cuts. Gross domestic product increased a robust five percent in the third quarter, and although that pace was expected to moderate, the US economy remains a relative bright spot in the slowing global economy.
CBO projects deficit to fall to $468B in 2015 - The annual budget deficit will fall to $468 billion in fiscal 2015, the lowest level of President Obama’s tenure, the Congressional Budget Office (CBO) reported Monday. Lower government spending and the improving economy are driving down the annual deficit, the CBO reported, with the shortfall for the year projected to be 2.6 percent of gross domestic product (GDP), the lowest level since 2007. The CBO projected that the economy will grow at an annual rate of 2.9 percent over the next two years and by 2.5 percent in 2017, with unemployment falling to 5.3 percent by the end of 2017. The new CBO projections provide some good news for Obama, whose approval rating has reached 50 percent partly on the strength of the economy and falling gas prices. "The estimates released today by CBO once again confirm the progress we’ve made in bringing down deficits and expanding access to healthcare under the Affordable Care Act," said White House deputy press secretary Eric Schultz in a statement, touting the new numbers.
CBO: Budget Deficit will Shrink before it Continues to Climb -- The Congressional Budget Office (CBO) has released its 2015 to 2025 Budget and Economic Outlook. In this yearly publication, the CBO examines current laws (taxes and spending) and projects the outlook for the federal government’s budget for the next 10 years.One of the topline projections the CBO makes is the budget deficit. This measures the difference between federal government spending and federal tax revenues (a higher deficit means the federal government is spending more than receives in tax revenue). The budget deficit has been in peoples’ minds for the past few years. The recession drove revenues down and lawmakers pushed through expensive stimulus spending bills, which combined to create massive budget deficits (the budget deficit was about $1.3 trillion in 2010). People were concerned about this, so many have been paying attention to the deficit’s year-to-year movements. In recent years, as the recession has ended and as stimulus spending has wound down, the budget deficit has shrunk from its high. CBO’s latest numbers show that in the next two fiscal years (2015 and 2016), tax revenue growth will keep pace with spending growth. This means that the budget deficit will shrink slightly in fiscal year 2015 to 2.6 percent of GDP from 2.8 percent of GDP in fiscal year 2014. Between 2016 and 2018, it will remain about flat. A reasonably positive outlooks in the near term.
The Debt Non-Spiral -- Krugman - Amid all the other economic news, the CBO has issued its latest budget projections. According to the projections, the US deficit will soon stop shrinking and begin to rise again. Cue the Very Serious People, who are deeply distressed at the failure of the promised fiscal crisis to materialize; I’m sure we’ll see editorials and op-eds in the next few days warning us that the deficit is still public enemy #1. But as Matt Klein points out — and as I pointed out around a year ago, after a similar CBO projection — there’s a funny thing about that projected rise in the deficit: it’s not about rising entitlement spending or any of the usual things the VSPs want to cut. It’s based on an assumption that interest payments will rise. Well, you might say, that makes sense — as debt rises, so do interest payments. Isn’t this about that debt spiral? Well, no. CBO shows the ratio of debt to GDP barely rising; just about all the rise in payments comes from an assumption that interest rates will rise. And as both Klein and I have tried to explain, we don’t really know that; there’s a plausible case that it’s wrong. I’m not attacking CBO, which needs to make some kind of rate assumption. But if you read someone trying to resurrect deficit panic, bear in mind that even the modest rise in the new projections is just an assumption, with nothing solid behind it.
CBO: Interest on federal debt will triple over coming decade - The federal budget deficit will ease slightly to $468 billion this year, the Congressional Budget Office said Monday, but the agency warned that the mounting level of federal debt over the next decade would mean a tripling of interest payments and new spending constraints. The projected deficit, equivalent to 2.6 percent of the size of the economy, would be the smallest since 2007 and close to the 2.7 percent average deficit over the past 50 years. While those deficits would remain stable through 2018, the CBO warned that they would rise after that. Interest payments are also poised to rise, both because of an expected rise in interest rates from the recent historic lows and because of a rising government debt, which the CBO said would hit 100 percent of GDP in 25 years. The interest payments alone are expected to hit $227 billion this year, more than double to $480 billion by 2019 and more than triple to $722 billion by 2024. “The large amount of debt might restrict policymakers’ ability to use tax and spending policies to respond to unexpected future challenges, such as economic downturns or financial crises,” the CBO said.
The Year of the Beast - The Congressional Budget Office just released a new report, The Budget and Economic Outlook: 2015 to 2025 Report (January 26, 2015). In an article at the New York Times titled "Budget Forecast Sees End to Sharp Deficit Declines", they referenced the report, and then quotes Senator Michael B. Enzi (R-Wyoming), the new chairman of the Senate Budget Committee: “The past will catch up to us no matter how fast we run from it." Then the New York Times writes: "The forecast might not change President Obama’s policy proposals, but it will fortify a Republican Congress’s resolve to pass budgets this spring that would fundamentally reorder health care spending, preserve tough spending caps and force Washington to at least look at Social Security. Democrats will say those spending plans are contradicted by efforts to overhaul the tax code without producing any more tax revenue."Senator Bernard Sanders (I-Vermont), the new ranking member of the Senate Budget Committee, anticipated the change in direction with a new report focused on wage stagnation and the shriveling middle class. His budget report calls for increasing spending: He and the Democrats believe that this could be paid for by a change in the tax code. The New York Times goes on to say, "With no changes in policy, aging baby boomers will take more and more of the federal government’s money, with less and less available for anything else. Social Security spending will rise to 5.7 percent of the economy in 2025 from 4.9 percent next year. Health care spending will rise over that period to 6.2 percent from 5.3 percent, while spending to service the national debt will double, to 3 percent from 1.5 percent. All other spending will shrink to 7.4 percent from 9.2 percent." If the Social Security and Medicare trust funds are "the federal government's money", then it must be old and sick people who are driving the fiscal "crisis". In that case, maybe if we eliminated all our old and sick people, then America's deficit problems could finally be resolved. Or maybe, if we could process them into Soylent Green, we can hope that the U.S. never has any more old retirees or unhealthy poor people (aka "the beasts").
Will the US soon have a budget surplus? - The Congressional Budget Office has just come out with its latest ten-year projections on spending, revenue, and debt. As has been the case for a while, the boffins estimate that the deficit will continue to shrink for a few years and then gradually widen, eventually raising the government debt to GDP ratio. The actual arguments in the body of the report contradict elements of this forecast, however. It’s quite possible that, for at least a few years before the next recession, the combination of strong growth and previous austerity measures will combine to produce a budget surplus and an associated scarcity of safe assets. As you might expect, the CBO’s explanation for its forecast boils down to demographics pushing up spending on health and pensions: Projected deficits and debt for the coming decade reflect some of the long-term budgetary challenges facing the nation. The aging of the population, the rising costs of health care, and the expansion in federal subsidies for health insurance that is now under way will substantially boost federal spending on Social Security and the government’s major health care programs relative to GDP over the next 10 years. Yet if we actually look at the tables produced by the CBO, a different answer emerges:More than all of the projected increase in the US federal budget deficit between now and 2025 is expected to come from higher interest payments on the existing debt. Now, it’s entirely possible that interest rates will rise and that the debt service burden will increase commensurately. In fact, one would hope that borrowing costs eventually go up given that low rates are being driven by weak demand for credit and low expectations for real growth and inflation as far as the eye can see. That said, we have several reasons to suspect the CBO’s forecasts.
The $2 trillion question: Is the CBO overly pessimistic about the US budget deficit? - The new CBO budget projection predicts annual deficits will continue to shrink the next few years before rising again in 2018, from 2.5% of GDP in 2017 to 4.0% in 2025. Two reasons: Higher entitlement spending (from 13.0% of GDP in 2017 to 14.2% in 2025) and interest on the national debt (from 1.7% of GDP in 2017 to 3.0% in 2025). The almost doubling in interest costs is based on the assumption that long-term Treasury rates normalize back to prerecession levels. Yet at the same time, CBO predicts real GDP growth to average just 2.2%, below the prerecession pace. Paul Ashworth of Capital Economics finds those two predictions — interest rates and economic growth — to be “inconsistent” with their historical relationship: The CBO assumes that the 10-year Treasury yield rebounds fairly quickly to 4.6% by the end of the decade which, assuming inflation is 2.0%, puts the real long-term rate at 2.6%. At the same time, however, the CBO also assumes that real GDP growth averages only 2.2%. As Chart 4 illustrates, the average real long-run interest rate has historically been lower than average real GDP growth. With the so-called term premium on the 10-year Treasury yield slumping over the past few months, there is a case to be made that real long rates will remain substantially below real GDP growth for quite some time yet. Under those circumstances, the Federal deficit would remain below 3% of GDP for much longer that the CBO currently believes.
Behind the CBO’s Forecast: Visions of the 3rd Longest Expansion in U.S. History - The Congressional Budget Office predicts the government’s deficits will shrink in 2015 and again in 2016. As a share of the economy, it will fall to 2.5% and remain there through 2017 before beginning to rise again with the aging of the population. These small deficits may seem surprising given the ferocity of Congress’s recent budget battles. But perhaps even more noteworthy is the economic forecast underlying it. The CBO currently estimates the recovery will continue through at least the end of 2017. If correct, that will be a 102-month economic recovery: the third-longest in U.S. history. The CBO’s forecasts for growth are not that different from the Federal Reserve’s, where policy makers also forecast at least three more years of economic expansion. The CBO projects growth of 2.9% in 2015 and 2016, as measured by the annual change in the fourth quarter of each year. Growth should slow to 2.5% in 2017. The CBO’s forecasts are all within the range of the Fed’s most recent forecasts, which were released in December. The CBO is slightly less optimistic than the Fed about how quickly the unemployment rate will decline. Most Fed policy makers predicted unemployment of 5.2% to 5.3% at the end of 2015. The CBO predicts 5.5% unemployment. In 2017, Fed officials see unemployment of 4.9% to 5.3%. The CBO’s forecast of 5.3% is at the top of that range. But both CBO and Fed see the unemployment rate continuing to decline through the fourth quarter of 2017.
The Bad News in the CBO Report -- The most troubling feature of the Congressional Budget Office’s updated forecast was not about government spending or about trends in taxes, the deficit, or debt. Not a whole lot has changed on those fronts. The most troubling part is that CBO is growing steadily gloomier about the U.S. economy’s capacity to grow, the potential growth rate of gross domestic product. If CBO is right, that means it would be harder to bring down the historically high ratio of government debt to GDP. And it means living standards in the U.S. will improve more slowly. In August, CBO projected that the economy would grow an average of 2.7% a year from 2014 to 2018; now, it is anticipating 2.5% growth. That doesn’t sound like much, but over time a few tenths of a percentage point add up to significant numbers. So what caused CBO to mark down its numbers again? It is less upbeat about the pace of growth in productivity or output per hour of work. Productivity growth is often depressed during recessions, and CBO had figured that it would bounce back when the economy healed. It hasn’t. Now, CBO economists figure that something more persistent is going on –and they’re not sure what. It could be slower adoption of new skills and technologies during the past few years. Or maybe it’s because we’ve been spending less on R&D. Or perhaps there’s a slowdown in the pace of innovation in the information-technology sector, a subject of vigorous debate among academic economists.
CBO: This is pretty much as good as America gets - The Congressional Budget Office just released its 10-year budget and economic forecast. Let me boil it down for you: These are the good times. Enjoy them because things are unlikely to get much better. In fact, they are likely to get worse. For instance: CBO expects the US economy to grow at 3% this year and next, and at 2.5% in 2017. That’s a definite upturn in post-recession performance, though still below the postwar average of 3.4%. But then deceleration: “For 2020 through 2025, CBO projects that real GDP will grow by an average of 2.2 percent per year—a rate that matches the agency’s estimate of the potential growth of the economy in those years.” Or how about the budget deficit? At 2.6% of GDP, according to CBO, this year’s fiscal shortfall is projected to be the smallest since 2007 and a smidgen below the 2.7% that deficits have averaged over the past 50 years. But then: Although the deficits in CBO’s baseline projections remain roughly stable as a percentage of GDP through 2018, they rise after that. The deficit in 2025 is projected to be $1.1 trillion, or 4.0 percent of GDP, and cumulative deficits over the 2016–2025 period are projected to total $7.6 trillion. CBO expects that federal debt held by the public will amount to 74 percent of GDP at the end of this fiscal year—more than twice what it was at the end of 2007 and higher than in any year since 1950 (see figure below). By 2025, in CBO’s baseline projections, federal debt rises to nearly 79 percent of GDP.
Got Growth? Dynamic Scoring, Deductions and Governors - The GOP says it wants a revolution, but who’s going to change the world? Long touted as a way to prove that tax cuts can pay for themselves by the economic growth they generate, “dynamic scoring” of federal legislation is no simple task. Today’s TPC-Hutchins Center on Fiscal and Monetary Policy webcast at Brookings examines why. But the House, in its dynamic scoring rule, didn’t tell the Joint Committee on Taxation or the Congressional Budget Office what models or assumptions to use. Those key decisions are up to the agencies’ leaders. The JCT’s chief of staff, Thomas Barthold, will stay on. But who will lead the CBO if current director Doug Elmendorf isn’t reappointed? We’d all love to see the plan. You can’t cut a rate without slashing a few breaks. A US corporate tax rate at 25 percent, down from 35: Corporations want it, but how badly? Would they be willing to give up their deduction for business interest expense? How about accelerated depreciation, which allows firms to write off the cost of investments more quickly? They might have to: “Even getting the rate down to 28 or 30 looks really hard without them,” noted TPC’s Bill Gale. “That’s where the money is.” Conservatives argue that ditching the deductions would slow economic growth, but Gale and others figure that dumping certain preferences would boost growth. The Congressional Research Service says the jury is still out.
Is Dynamic Scoring of Tax Bills Ready For Prime Time? -The House has instructed the Joint Committee on Taxation and the Congressional Budget Office to factor in the macroeconomic effects of tax law changes when calculating the official budget score of revenue bills. But are existing models up to the task of what’s commonly called dynamic scoring? A group of experts assembled today by the Tax Policy Center and the Hutchins Center on Fiscal and Monetary Policy at Brookings generally agreed that current models have serious limitations, but disagreed on whether they are good enough to produce acceptable revenue estimates for major tax bills. This arcane debate over how congressional experts score tax bills is enormously important. Until now, the scorekeepers included behavioral responses to new tax law but did not try to figure how tax-driven changes to the overall economy would impact revenues. GOP backers of dynamic scoring are confident that adding macro effects would show that tax rate cuts would increase growth and lose less revenue—making the politics of rate-cutting tax reform vastly easier. Many critics say they'd love to know how tax changes affect the economy but argue existing models simply are not up to the task. And they fear that requiring dynamic scoring would force JCT and CBO analysts to project the unknowable .
Obama on collision course with Congress over budget - FT.com: US President Barack Obama will propose raising domestic and military spending above agreed limits in next week’s budget, setting up a clash with a Republican-controlled Congress committed to curbing the size of government. Mr Obama's budget for the fiscal year 2016, which will be released on Monday, will request an end to the automatic spending caps the White House agreed with Congress as part of a deal struck in 2011, known as sequestration. But in proposing about $70bn in additional discretionary spending, the president will set himself on a collision course with Republicans who want to make deeper cuts in federal expenditures, particularly on social programmes. While the 2011 sequester locked in across-the-board spending cuts for 10 years, its impact was blunted by a two-year bipartisan budget deal struck in 2013. However, those curbs are set to resume in October unless another agreement is reached. Mr Obama previously outlined many of the domestic spending proposals that will be included in the budget in his State of the Union address earlier this month. By increasing the top rate of tax on capital gains and closing a tax loophole on inherited assets that is mainly used by the wealthy, the White House aims to raise $330bn to fund programmes intended to boost the middle class, including paid sick leave for workers and a simplified structure of tax credits for higher education. However, those proposals have already drawn the ire of a GOP-controlled Congress, which continues to champion fiscal restraint and bringing the deficit down. “My budget will fully reverse the sequestration cuts for domestic priorities in 2016,”
White House seeks $534 billion base defense budget, $51 billion for wars (Reuters) - The Obama administration will seek a base defense budget of $534 billion when it sends its 2016 spending request to Congress next week, a U.S. official said on Tuesday, a figure that exceeds federal caps by $35 billion and could trigger mandatory cuts. The administration also will ask for nearly $51 billion in funding for the war in Afghanistan as well as the conflict against Islamic State militants in Iraq and Syria, said the official, who spoke on condition of anonymity ahead of the formal budget presentation next week. The base budget proposal includes $107.7 billion for weapons procurement and $69.8 billion for research, Bloomberg reported. true A source familiar with the budget proposal said it had funding for 57 F-35 Joint Strike Fighters built by Lockheed Martin Corp (LMT.N), two more than planned in last year's budget. The proposal maintains funding for Navy ships and aircraft but will curtail funding for some weapons systems, said the source, who was not authorized to speak publicly. The $534 billion Pentagon base budget request was in line with what it projected it would need for 2016 in last year's budget request. The request is $35 billion above the $499 billion spending cap for the 2016 fiscal year set by law in 2011 and modified two years later. The caps were set to hold down defense budgets in an effort to slash nearly $1 trillion in projected spending over a decade.
Bernie Sanders wants to spend $1 trillion on infrastruture - For years, transportation experts have called for a massive investment to save a network of roads, bridges and transit systems that has fallen into disrepair. A bill introduced in the U.S. Senate Tuesday would meet that need, providing $1 trillion over the next five years. Given that elsewhere on Capitol Hill, members are scrambling for funds to keep annual federal transportation spending just above about $50 billion, coming up with $148 billion on top of that amount would seem problematic. “For too many years, we’ve underfunded our nation’s physical infrastructure. We have to change that and that’s what the Rebuild America Act is all about. We must modernize our infrastructure and create millions of new jobs that will put people back to work and help the economy,” said Sen. Bernie Sanders (I-Vt.), the ranking member of the Senate Budget Committee, who introduced the $1 trillion bill. The American Society of Civil Engineers (ASCE) has calculated that an additional $1.6 trillion should be spent on infrastructure by 2020. A 2010 report by the University of Virginia’s Miller Center estimated that an additional $134 billion to $262 billion must be spent per year through 2035 to rebuild and improve roads, rail systems and air transportation.
Spending Caps? What Spending Caps? - Up next week: The President’s Budget. President Obama will release his budget for fiscal year 2016 on Monday. The plan would increase spending above the sequester limits of the Budget Control Act of 2011. Steep cuts were triggered in 2013 when Congress failed to reach a budget deal, but were then temporarily suspended thanks to a deal struck between former Senate Budget Committee Chair Patty Murray and former House Budget Committee Chair Paul Ryan. The President’s fiscal year 2016 budget would boost the sequester limits on domestic discretionary and military spending by 7 percent. This includes $37 billion in extra non-defense money and $38 billion more for the Pentagon. Treasury Secretary Jack Lew will defend the President’s budget on the Hill, starting Tuesday. The President’s budget is dead on arrival, but Lew will defend it at a House Ways and Means Committee hearing Tuesday morning. Groundhog Day: Extenders are on deck in the House for February. It will consider measures to restore and permanently extend section 179 expensing and revised tax benefits for charitable giving. Charitable giving subsidies include tax-free IRA distributions to charities, donations of real property for conservation, and deductions for food inventory donations. The House passed all these last year but they died in the Senate. Will a GOP Senate embrace them? Will Obama veto them? Will Punxsutawney Phil see his shadow?
White House Defends Tax Proposals to Aid Middle Class - White House Chief of Staff Denis McDonough on Sunday defended the tax proposals aimed at helping the middle class that President Barack Obama outlined in his State of the Union speech. Mr. McDonough said that the Obama administration wouldn’t back down from its push to help moderate-income Americans. “It’s decades now where wages have stagnated for hardworking middle-class families. He is saying enough is enough,” Mr. McDonough said on “Fox News Sunday.” He said the country was out of the crisis of the last several years with unemployment down to 5.6% from a peak of 10%. “The president will not trim his sails on that,” he continued, referring to Mr. Obama’s plan to help the middle class. Mr. Obama’s proposal hinges on raising taxes on higher-income Americans to fund initiatives to benefit those at lower income levels. His plans include some $235 billion in new spending, which he proposes raising through an increase in top capital-gains tax rates and new taxes on many inheritances, among other measures. Many of those proposals will have a very tough time getting through the Republican-controlled Congress. Republican lawmakers have already come out in opposition to key parts of the president’s plan. “You cannot build a little guy up by tearing a big guy down,” Ohio Republican Gov. John Kasich said
How Obama’s Tax Plan Will Redistribute Income from the Very Rich To The Poor - President Obama’s latest tax package, which he’ll unveil in detail next week along with his new budget, would lower taxes for low-income households and significantly raise taxes for the highest income 1 percent—those making $663,000 or more, according to new Tax Policy Center estimates. Middle-income households would see relatively modest changes in their tax bills. On average, in 2016 households making $25,000 or less in expanded cash income could expect an average boost in after-tax income of 1.2 percent, or about $175, while those in the top 1 percent would see their after-tax income fall by an average of 2 percent, or about $29,000. Those in the top 0.1 percent—who make at least $3.4 million—would see their after-tax income cut by about 2.6 percent, or about $168,000 on average. Obama’s tax plan, which was first described in a fact sheet that accompanied his State of the Union address, would raise taxes on capital gains, impose a new tax on big financial institutions, limit the size of tax-advantaged retirement accounts, and eliminate the tax benefits of Sec. 529-like college savings plans. (The administration announced yesterday that they would drop the 529 proposal.) At the same time, it would expand the Earned Income Tax Credit and the Child and Dependent Care Tax Credit, increase other subsidies for higher education, and create new auto-IRA retirement savings plans. The TPC estimates include all of the provisions of the Obama plan except for changes in flexible savings accounts for child care and Sec. 529 plans. The proposal would have very little net impact on middle-income households. For example, those making between $49,000 and $84,000 (the middle 20 percent of households) would see their after-tax incomes fall--by an average of $7.
“Money Is Like Manure… Not Worth a Thing Unless It’s Spread Around.” -- TPC shows how President Obama would redistribute income from the rich to the poor. The President will release his budget next week, and with it, a tax plan analyzed by the Tax Policy Center. TPC’s Howard Gleckman explains that under the plan, after- tax income would increase by about $175 in 2016 for households making $25,000 or less in expanded cash income. After-tax income would drop by about $29,000 for households making $663,000 or more. The very, very rich, who make at least $3.4 million a year, would see their after-tax income cut by about $168,000, on average. Middle-income people would see relatively little change in their average tax bill, though there would be winners and losers. Retirement “loopholes” reflect acts of an extravagant Congress. President Obama’s new budget would close the “loophole” that allows the very rich to stash huge sums of money in tax-favored retirement plans. Under Obama’s plan, once those plans hit $3.4 million, contributions would have to stop. But many of these giant IRAs are not the creation of unintended loopholes at all, TPC’s Steve Rosenthal explains. Congress has explicitly and dramatically expanded both individual and employer-sponsored retirement plans in recent years, often without income limits. “Labeling large IRAs and retirement plans ‘loopholes’ mischaracterizes Congress’ generosity (or profligacy).”
Tax Breaks (for the Rich) Are Forever - This week I returned to one of my favorite topics: raising taxes, particularly on the rich. First I wrote an article for Medium about the single most obvious change that should be made to the tax code: eliminating the step-up in basis at death for capital gains taxes. If you’re not sure what step-up in basis means, or why it’s a ridiculous idea, you should read the article. Then today I wrote an article for the Atlantic about why (a) killing 529 plans was a great idea in President Obama’s latest tax proposals and (b) why 529 plans are impossible to kill. Here’s the crux of the matter: “If you’re poor, a 529 plan gives you nothing, since you don’t pay income taxes; the American Opportunity Tax Credit gives you $4,000 ($5,000 under Obama’s proposal) because you can take $1,000 of the credit per year even if you pay no taxes. If you’re in the ‘middle class’ (making at least $74,900 and able to save $3,000 per year per child), a 529 plan gives you $5,800; the AOTC gives you $10,000 ($12,500 under Obama’s proposal). If you’re in the upper class, a 529 plan gives you $26,300; the AOTC gives you nothing. Do I even need to write the rest of this article?” My editor took out that last sentence, but I liked it so much I’m putting it back here. (Those number are based on some basic scenarios I described in the article.) Every politician likes to say that he is in favor of simplifying the tax code, eliminating tax breaks for people who don’t need them, and helping the middle class. Only it just isn’t true.
How More and More U.S. Corporate Profits Escape the Corporate Income Tax -- Yves here. This post makes an important and simple point about one big source of the fall in the relative importance of corporate income as a source of Federal tax revenue that is often ignored in official discussions: the rise in the use of pass-through entities. An older theory was that, generally speaking, you could get the benefits of limited liability and pass through treatment only if you were a small fry. The S corporation election was meant to promote entrepreneurial activity. If you want to be a partnership and get the tax bennies, fine, but you have to live with the risk of unlimited personal liability. The use of limited liability corporations started to pick up steam in the later 1990s (I recall asking my regular attorney about converting to an LLC in 1997 and she though they were too untested legally to be worth the risk) and are now common. And the impact over time of this change, as well as the use of other tax-reduction strategies, has been significant. In 1952, corporate income tax provided 33% of total Federal tax receipts. By 2013, it had fallen to 10%.
Federal Government Lost Money from 2013 Tax Increases on Investors - As President Obama prepares to roll out another tax increase proposal targeting capital gains and dividends, it’s instructive to look at what happened the last time he did that. Fortunately, the IRS just released preliminary data on tax year 2013, the year the top tax rate on capital gains and dividends went from 15 percent to 23.8 percent. The fiscal cliff deal raised the top rate to 20 percent and the Obamacare investment surtax added 3.8 percentage points. From the IRS data, we can see that investors didn’t just sit there and pay the higher tax rate. Qualified dividend income dropped 25 percent, from $189 billion in 2012 to $141 billion in 2013. Capital gains dropped 12 percent, from $475 billion to $416 billion. Recall this was in the midst of a historic stock market boom. Because the tax base collapsed, tax revenue also fell. We estimate that tax revenue from dividends decreased 11 percent, from $21 billion in 2012 to $19 billion in 2013, and tax revenue from capital gains decreased 7 percent, from $63 billion to $58 billion. This is based on our estimate of average tax rates (effective), since the IRS does not provide these numbers. We estimate the average tax rate (effective) on dividends increased from about 11 percent in 2012 to 13 percent in 2013, and for capital gains it increased from about 13 percent to 14 percent.
Economic Populist Propaganda - Representative Chris Van Hollen of Maryland, the ranking Democrat on the Budget Committee, proposed a plan to tax Wall Street financial transactions and raise taxes on the top 1 percent of earners ——> to pay for a “paycheck bonus credit” of $2,000 a year for couples earning less than $200,000. His plan also calls for a tripling of the tax credit for child care and expanding tax incentives for savers. A “paycheck bonus credit” for those earning $200,000 a year? But might that also include members of Congress? (Assuming a "couple" can also include an unemployed partner.) First, the “paycheck bonus credit” should be double that ($4,000 a year) — and second, it should be made to ALL wage earners (not just to couples) — and third, it should only be given to people who are only making $50,000 a year or less (which is 72.8% of all wage earners). Giving something akin to a "helicopter drop" to households earning $200,000 a year is ludicrous. Assuming two people with incomes of $100,000 each, that still puts them in the top 93 percentile range of all wage earners. FYI: Only 1.7% of all wage earners make more than $200,000 a year — and $118,500 a year is the cap on Social Security taxes. (Why can't Congress ever propose and pass laws that won't also personally benefit them — and/or the very rich?) According to the Social Security Administration (as of 2013), 50% of all wage earners had annual net incomes of $28,031 or less (the median wage). Two people working and earning this "median wage" (and living together) would have a net household income of $56,062 a year. The annaul "median household income" is currently about $53,880 a year — because most households have more than one income.
The Tax Loophole (Almost) Everyone Should Want to Close - In his latest round of tax proposals, President Obama finally called for what is probably the single most obvious change that should be made to the tax code: an end to the step-up in basis at death for capital gains taxes. (The other candidate for “single most obvious change” is eliminating the “carried interest” exemption that allows fund managers to pay capital gains tax rates on their labor income — managing people’s money.) What is step-up in basis, you may ask? Ordinarily, if you buy something for $100 and sell it for $200 — say, a share of stock — your $100 in profit is a capital gain, which counts as a form of income, and you pay tax on it. The capital gain is calculated as your sale price of $200 minus your “cost basis” of $100. You pay tax at a lower rate than on ordinary “earned” income, like your wages, for reasons that not everyone agrees on. In addition, you also benefit from the fact that you can decide when to sell the stock, so you can defer paying capital gains tax for as long as you want, without interest — so the longer your holding period, the lower the effective annual tax rate. But wait, there’s more. Let’s say that, moments before hitting the “sell” button on your computer, you keel over dead from a heart attack. Your daughter inherits the share of stock and sells it the next day for $200. Instead of paying tax on a $100 capital gain, however, she pays no tax at all. The trick is that when the stock transfers from you to your daughter, its basis “steps up” from the $100 you paid to the $200 it is worth when you died; if she sells it immediately, she has no income at all. So who pays tax on that $100 in profit that your family made? No one.
Gains From Economic Recovery Still Limited to Top One Percent -- It’s the economic statistic that spawned the Occupy protest movement (“We are the 99 percent”), reshaped President Obama’s domestic program (“middle-class economics”), and most recently led the eternal Republican presidential hopeful Mitt Romney to bemoan that “the rich have gotten richer.” I am speaking of the income share of the richest 1 percent of American families. Emmanuel Saez, the economics professor who crunches these numbers based on data provided by the Internal Revenue Service, has just released preliminary estimates for 2013. The share of total income (excluding capital gains) going to the top 1 percent remains above one-sixth, at 17.5 percent. By this measure, the concentration of income among the richest Americans remains at levels last seen nearly a century ago. It is tempting to note that the latest reading is somewhat below the 18.9 percent share that was recorded in 2012. But Professor Saez warns against reading too much into this year-to-year change. The problem is that his estimates rely on tax data, and tax rates on the rich rose sharply in 2013, leading many to shift taxable income out of 2013, and into 2012. Thus, the latest estimate is probably too low, just as the previous year’s number was probably too high. Far better instead to focus on the average of the past two years. That average supports the narrative that the economic recovery so far has only boosted the incomes of the rich, and it has yielded no improvement for the bottom 99 percent of the distribution. After adjusting for inflation, the average income for the richest 1 percent (excluding capital gains) has risen from $871,100 in 2009 to $968,000 over 2012 and 2013. By contrast, for the remaining 99 percent, average incomes fell by a few dollars from $44,000 to $43,900. That is, so far all of the gains of the recovery have gone to the top 1 percent. By contrast, this group suffered only one-third of the income declines during the preceding recession.
Nominate A Qualified Undersecretary Of Domestic Finance Now- Simon Johnson - The Obama administration urgently needs to nominate a qualified individual as Undersecretary for Domestic Finance at the Treasury Department. The Dodd-Frank financial reforms are under sustained and determined attack, and the lack of a confirmed Undersecretary is making it significantly harder for Treasury to effectively defend this important legislation. Failing to fill this Undersecretary position would constitute a serious mistake that jeopardizes a signature achievement of this presidency. In the continuing absence of an Undersecretary for Domestic Finance, the administration has recently displayed an inconsistent – or perhaps even incoherent – policy stance on financial sector issues. On the one hand, in mid-December, the White House agreed to rollback a significant part of Dodd-Frank – the so-called “swaps push-out,” which was shamefully attached at the behest of Citigroup to a must-pass government spending bill. The White House put up little resistance to this tactic and, at the critical moment, lobbied House Democrats to support the repeal of Section 716. Also in December, the White House pushed hard for the confirmation of a Wall Street executive, Antonio Weiss, as Undersecretary for Domestic Finance. (In mid-January, in the face of continuing legitimate questions about his qualifications, Mr. Weiss withdrew himself from consideration. He has become a Counselor to the Treasury Secretary, but this in no way addresses the need for a well-qualified Undersecretary and the equally pressing need for a consistent administration policy.)
Warren Asks Wall Street for Answers on Dodd-Frank Rollback - Elizabeth Warren and her allies are keeping up the pressure on the contentious Dodd-Frank rollback that made its way into a must-pass $1.1 trillion spending bill at the end of last year. Ms. Warren (D., Mass.) and Rep. Elijah Cummings (D., Maryland) sent letters to four top Wall Street banks Thursday asking for details about how the firms will alter their derivatives trading operations in the wake of the change. Mr. Cummings is the top Democrat on the House Committee on Oversight and Government reform and Ms. Warren a member of the Senate Banking Committee. The letters are a clear indication that liberal Democrats plan to continue hammering big banks over the change – which all but eliminated a provision forcing banks to “push-out” risky swaps activities into affiliates that aren’t eligible for federal backstops. Ms. Warren led liberal Democrats in a major backlash against the provision, which forced banks to spin off certain operations for swaps – a type of derivative produce that allow financial firms and their clients to hedge against risks or wager on an asset’s value. The lawmakers sent the inquiries to the chief executives of Bank of American Corp., J.P. Morgan Chase & Co., Citigroup Inc. and Goldman Sachs Group Inc. – which, they note in the letters, collectively account for 93% of all derivatives contracts held by U.S. commercial banks. Lawmakers asked the banks to detail the total value of swaps the firm would have pushed out under Dodd-Frank if Congress had not changed the law in December, among other questions.
Did New York Times’ Dealbook Throw a Source Under the Bus in TPG Suit Against Ex-Employee/Ex-White House Staffer? -- Yves Smith - If a lawsuit filed yesterday by TPG is to be taken at face value, the private equity kingpin has been the subject of a nasty extortion attempt by a vengeful now former employee, Adam Levine. Levine allegedly not only threatened to use his PR clout to bring down the firm, but purloined confidential materials from TPG's systems and doctored at least one before sending it to a reporter at New York Times' Dealbook. And TPG further claims it had good reason to be worried because Levine asserted that it was his grand jury testimony, shortly after he left the Bush White House as a member of its communications team, that brought down Scooter Libby. But the real bombshell in the filing is the way that the New York Times' Dealbook looks to have thrown Levine, an alleged source, under the bus.
Billions in Lost 401(k) Savings, Abusive Brokers Under White House Scrutiny - One of President Barack Obama’s top economic advisers said abusive trading practices are costing workers billions of dollars in retirement savings each year and called for stricter rules on Wall Street brokers. Jason Furman, chairman of Obama’s Council of Economic Advisers, drafted a Jan. 13 memo citing research that says some broker practices, such as boosting commissions with excessive trading, cost investors $8 billion to $17 billion a year. The document was circulated to senior aides and indicates the White House may support tighter oversight of brokers who handle retirement accounts. The memo, obtained by Bloomberg News, makes the case for a Labor Department regulation that would impose a fiduciary duty on brokers handling retirement accounts, requiring them to act in their clients’ best interest. Under current rules, brokers are held to a ‘suitability’ standard, meaning they must reasonably believe their recommendation is right for a customer. “Consumer protections for investment advice in the retail and small-plan markets are inadequate,” Furman wrote in the memo, also signed by Betsey Stevenson, another member of the economic council. “The current regulatory environment creates perverse incentives that ultimately cost savers billions of dollars a year.” Wall Street has spent more than four years lobbying against the Labor rule. Led by firms like Morgan Stanley and Bank of America Corp., the industry has argued that costlier regulations would take away options for smaller investors, who would lose access to advice as well as investment choices.
High-Frequency Probe’s First Target Is Barclays - Attorney General Eric Schneiderman’s 10-month investigation into high-speed trading has so far led to one big target: Barclays Plc. (BARC) Almost a year after New York’s top cop made a splash with subpoenas of six high-frequency trading operations, the names of some of these firms cropped up in documents filed this week in the state court in Manhattan. The firms aren’t defendants, though. They are listed as part of Schneiderman’s proposed updated complaint against Barclays, which ran the private trading venue, or dark pool, where these firms traded. Schneiderman’s suit doesn’t allege any wrongdoing by the high-frequency trading firms. Its focus, instead, is whether Barclays lied to its customers about what HFT firms were doing inside Barclays’s dark pool, one of Wall Street’s largest in-house trading platforms. “High-frequency trading and dark pools are legal businesses and can be beneficial to the market,” said Deborah Meshulam, a partner at DLA Piper who specializes in securities enforcement. “Unless there are changes in the regulations, then it is hard to say just how many high-frequency-trading related cases will come to light.” Dark pool trading accounted for 15 percent of total U.S. volume in the third quarter, according to latest figures from research firm Tabb Group.
Junk-Bond Bubble Implodes Beyond Energy, Deals Scuttled, Yields Soar, Suddenly “Insufficient Demand” - Wolf Richter - The year 2015 has just started, and already there have been two junk-bond casualties: the first on Thursday, and the second one yesterday. They weren’t energy companies. Energy companies don’t even try anymore. They’ve been locked out. Both deals had to be scuttled because, even at the high yields they offered, there were suddenly no buyers. 2014 had been a harbinger: 17 junk-bond deals for $5.8 billion in total were shelved, most of them during the last four months. Ever since the Fed unleashed its waves of QE, institutional investors, driven to near insanity by the relentless interest rate repression, have been chasing yields ever lower in a desperate effort to get some kind of return. In the process, junk bonds and leveraged loans boomed and spiraled to such heights that the Fed – which is never able to see any bubbles – and other bank regulators began fretting over a year ago about the risks they posed to “financial stability.” Now QE Infinity is gone, interest-rate hikes are vaguely shaping up on the horizon, and institutional investors – bond mutual funds, for example – are getting second thoughts. Junk bond issuance, at $13.4 billion so far this year, is down 32% from the same period in 2014, according to S&P Capital IQ/LCD’s HighYieldBond.com. Lower-rated companies are “forced to pay-up significantly,” explained LCD’s Joy Ferguson. And some of them, like the Presidio Holdings deal today, are having trouble finding any buyers – despite offering a yield of 11% or higher. Investors are bailing out of junk-bond funds. In the latest week, $241.2 million were withdrawn from high-yield mutual funds and ETFs. The week before had been an exception, with an inflow of $897.5 million, after eight weeks in a row of relentless net outflows. And investors have been abandoning leveraged-loan funds for 28 weeks in a row, yanking out $738 million in the latest week alone. Below-investment-grade companies are feeling the consequences.
Democratising Finance: Big banks eye peer-to-peer lending push - FT.com: Two of the world’s leading investment banks are looking at a move into the fast expanding peer-to-peer lending sector, underlining how even established financial institutions are racing to embrace technology to disrupt traditional finance. Société Générale and Goldman Sachs are among several banks discussing a plan to back Aztec Money, an emerging peer-to-peer financing platform that has created an online market place where people can bid for company invoices, according to three people familiar with the project. When peer-to-peer structures were first set up a decade ago, the rationale was to bypass banks by using state-of-the-art technology to link those who have money to invest with individuals or companies that need it. But as the demand for P2P finance has grown, platforms are turning to large financial services groups to provide funds and spur their growth. The sector is also attracting high-profile individuals, with Arianna Huffington, president and editor-in-chief of Huffington Post Media Group, the latest to join a P2P lender. She has been appointed to the board of Payoff, one of a clutch of new competitors that are emerging to compete in an industry dominated in the US by Lending Club and Prosper. Banks are among the institutions that have bought up loans from Lending Club, the US’s largest P2P site. In the UK Santander and Royal Bank of Scotland have struck partnerships with P2P firms. Their involvement will disappoint purists, who have trumpeted the nascent P2P industry as a democratic innovation with the power to usurp a discredited banking industry.
Hedge Funds, Private Equity Win Big at TARP Auctions —A government program to rid itself of TARP investments in small banks has proved a boon to hedge funds, private-equity and other private investors, according to a new watchdog report. As the Treasury Department looks to exit from its taxpayer-backed investments in these lenders, private investors like hedge funds and others have stepped in and scooped up about 70% of the shares auctioned by the U.S. government. Other buyers included banks, institutional investors and brokers buying shares on behalf of other entities. The Treasury-created market has benefited a few savvy investors, while saddling taxpayers with a loss. Three private funds, which the report didn’t name, have won almost half the shares available at auction, often netting either a profit on paper or on the resale, according to the special inspector general for the Troubled Asset Relief Program. The Treasury, which has held 185 auctions to date, said it has raised about $3 billion on TARP investments that were originally valued at $3.8 billion, for a loss of $800 million at the auctions. The Treasury “set up this market where investors could come in quickly and flip and profit,” said Christy Romero, TARP’s special inspector general, in an interview. As the new owners of the bank’s shares, the funds can profit by reselling them back to the bank at a premium. At one auction, the report said, a bidder won the shares for $3 million less than taxpayers had originally paid. Eight months later, the same bidder sold the shares back to the bank at a $1.6 million profit. Banks sometimes repurchase the shares to avoid dividend payments, which are generally at 9% of principal, or because they don’t want to owe money to the outside investors.
Occupied By Wall Street – The Latest TARP Taxpayer Screw-Job Is Revealed - The Treasury-created market has benefited a few savvy investors, while saddling taxpayers with a loss. The Treasury, which has held 185 auctions to date, said it has raised about $3 billion on TARP investments that were originally valued at $3.8 billion, for a loss of $800 million at the auctions. The Treasury “set up this market where investors could come in quickly and flip and profit,” said Christy Romero, TARP’s special inspector general, in an interview. Three private funds have won almost half the shares available at auction, often netting either a profit on paper or on the resale, according to SIGTARP. “As a banker I was happy, but as a taxpayer I was not at all happy,” said Chief Financial Officer Donald Boyer. “The discount came out of taxpayers’ pockets.”
Unofficial Problem Bank list declines to 390 Institutions -- This is an unofficial list of Problem Banks compiled only from public sources. Here is the unofficial problem bank list for Jan 23, 2015. For the second straight week, there is a bank failure that contributed to changes to the Unofficial Problem Bank List. In all, there were two removals that lowered the list count to 390 institutions with assets of $122.5 billion. A year ago, the list held 600 institutions with $197.9 billion in assets. Highland Community Bank, Chicago, IL ($58 million) was closed today by the FDIC. It was the 62nd bank headquartered in Illinois to fail since the on-set of the Great Recession in 2008. Next week, we anticipate for the FDIC to release an update on its latest enforcement action activities. CR Note: The first unofficial problem bank list was published in August 2009 with 389 institutions. The list peaked at 1,002 institutions on June 10, 2011, and is now back down to 390 - only one more than when we started.
Securitization and Fraud, Used Car Edition - If lenders held their loans, particularly their mortgages, then they would only make good loans. By having a market to dump loans into, lenders loosen criteria to make more mortgages. Ignorant bond holders can't buy enough MBS, so lenders loosen criteria even more to meet demand. Lenders may even engage in fraud or encourage borrowers to engage in fraud. The Dodd-Frank Act tries to remedy these ills by having regulation at the lender end and the MBS end. We'll see if it works. But the NYT this week tells us the securitization evil has spread to used car loans. Because I'm pretty sure used car loans have been securitized since at least 1993, I don't see this as news. However, the article suggests that because of less fun in MBS, those investors now have poured their money into used car loan-backed securities (let's say UCBS). The article doesn't state it's hypothesis, but suggests this is bad because (1) car buyers are defaulting and losing their vehicles and (2) financial players who package UCBS are getting rich. But, the article doesn't go so far as to provide evidence that (1) car buyers are defaulting more than usual or (2) that the demand for UCBS has caused lenders to be more unscrupulous than they have been in the past. In addition, problems in the MBS market, particularly mortgage defaults, have pretty big negative externalities: foreclosures, neighborhoods with empty houses, dislocation of families, home prices, etc. When car borrowers default, the lender takes the car back. The borrower is out the car payments that were made (the NYT focuses on car buyers who never made any payments, so not particularly left worse off), but the car lot now can resell the car again. Cars are more liquid than houses, and repossession is quicker and cheaper than foreclosure. So, I'm not getting very worried about the used car loan bubble just yet. If we think that used car loan rates are too high, then that's another concern. If we think that used car sales people are pressuring or misleading customers, that's another concern. But I don't think securitization is the problem.
Subprime Bonds Are Back With Different Name Seven Years After U.S. Crisis - -- The business of bundling riskier U.S. mortgages into bonds without government backing is gearing up for a comeback. Just don’t call it subprime. Hedge fund Seer Capital Management, money manager Angel Oak Capital and Sydney-based bank Macquarie Group Ltd. are among firms buying up loans to borrowers who can’t qualify for conventional mortgages because of issues such as low credit scores, foreclosures or hard-to-document income. They each plan to pool the mortgages into securities of varying risk and sell some to investors this year. JPMorgan Chase & Co. analysts predict as much as $5 billion of deals could get done, while Nomura Holdings Inc. forecasts $1 billion to $2 billion. Investment firms are looking to revive the market without repeating the mistakes that fueled the U.S. housing crisis last decade, which blew up the global economy. This time, they will retain the riskiest stakes in the deals, unlike how Wall Street banks and other issuers shifted most of the dangers before the crisis. Seer Capital and Angel Oak prefer the term “nonprime” for lending that flirts with practices that used to be employed for debt known as subprime or Alt-A.
Freddie Mac: Mortgage Serious Delinquency rate declined in December - Freddie Mac reported that the Single-Family serious delinquency rate declined in December to 1.88%, down from 1.91% in November. Freddie's rate is down from 2.39% in December 2013, and the rate in December was the lowest level since December 2008. Freddie's serious delinquency rate peaked in February 2010 at 4.20%. These are mortgage loans that are "three monthly payments or more past due or in foreclosure". Note: Fannie Mae will report their Single-Family Serious Delinquency rate for December next week. Although the rate is generally declining, the "normal" serious delinquency rate is under 1%. The serious delinquency rate has fallen 0.51 percentage points over the last year - and the rate of improvement has slowed recently - but at that rate of improvement, the serious delinquency rate will not be below 1% until late 2016. Note: Very few seriously delinquent loans cure with the owner making up back payments - most of the reduction in the serious delinquency rate is from foreclosures, short sales, and modifications. So even though distressed sales are declining, I expect an above normal level of Fannie and Freddie distressed sales for 2+ more years (mostly in judicial foreclosure states).
Lawler: Updated Table of Distressed Sales and Cash buyers for Selected Cities in December - Economist Tom Lawler sent me the updated table below of short sales, foreclosures and cash buyers for a few selected cities in December.On distressed: Total "distressed" share is down in almost all of these markets, mostly due to a decline in short sales. Short sales are down in these areas (except Sacramento). Foreclosures are up in a few areas (working through the logjam, mostly in judicial states - especially in Florida). The All Cash Share (last two columns) is mostly declining year-over-year.
Second-Liens and the Leverage Option -- Susan Wachter and I have a new (short!) paper up on SSRN. It's called Second-Liens and the Leverage Option, and is about the curious absence of negative pledge clauses in US home mortgages, which enabled enormous amounts of second-lien leverage (much more than anyone realized) during the housing bubble. Abstract: The finance literature has long recognized the existence of embedded put options within mortgage contracts, such as a prepayment option and a walk-away default option. This Article identifies a previously unrecognized option embedded in residential mortgages: a mortgagor’s unilateral option to increase total leverage on the collateral property through junior liens irrespective of existing mortgagees’ wishes. We term this the “leverage option.” We show how the leverage option was created as an unintended consequence of a federal law enacted to deal with seller financing arrangements that prevailed during the inflationary economy of the 1970s. The leverage option was of little importance until the housing bubble in the 2000s, as homeowners massively increased their leverage using second-lien mortgages. We demonstrate the problems that the leverage option causes for lenders, for homeowners (who pay for it, regardless of whether they want it), for regulators, and for the economy at large. We propose a discrete legal change that will convert the leverage option from being a mandatory embedded option to a bargained-for, unembedded option that will enable efficient pricing and force the information about total mortgage market leverage that is necessary for both effective market oversight.
MBA: "Mortgage Applications decrease in Latest MBA Weekly Survey" -- From the MBA: Mortgage Applications Decrease in Latest MBA Weekly Survey Mortgage applications decreased 3.2 percent from one week earlier, according to data from the Mortgage Bankers Association’s (MBA) Weekly Mortgage Applications Survey for the week ending January 23, 2015. This week’s results include an adjustment to account for the Martin Luther King holiday. ... The Refinance Index decreased 5 percent from the previous week. The seasonally adjusted Purchase Index decreased 0.1 percent from one week earlier...The FHA share of total applications increased to 9.1 percent this week from 8.0 percent last week. ... The average contract interest rate for 30-year fixed-rate mortgages with conforming loan balances ($417,000 or less) increased to 3.83 percent from 3.80 percent, with points decreasing to 0.26 from 0.29 (including the origination fee) for 80 percent loan-to-value ratio (LTV) loans.The first graph shows the refinance index. 2014 was the lowest year for refinance activity since year 2000. It looks like 2015 will see more refinance activity than in 2014, especially from FHA loans! The second graph shows the MBA mortgage purchase index. According to the MBA, the purchase index is up 1% from a year ago.
The surprising savings from mortgage refinancing - With mortgage interest rates falling once again to near record lows, many homeowners will wonder if they should refinance their homes. They'll find many websites and other information sources that can be used to help make this decision, for example Zillow's refinance calculator. But even so, recent research suggests that homeowners are missing out on billions of dollars in potential savings. In a recent working paper from the National Bureau of Economic Research notes that housing constitutes two-thirds of the wealth of the typical household, so decisions about mortgages "can have substantial long-term consequences for household wealth accumulation." In particular, relatively small changes in the interest rate on mortgage loans can have a much larger impact on a household's monthly mortgage payments, and those changes can add up to considerable sums over a mortgage's typically long life. Here's an example from the nontechnical summary of their research: "... a household with a 30-year, fixed-rate mortgage of $200,000 at an interest rate of 6.5 percent that refinances when rates fall to 4.5 percent will save over $80,000 in interest payments over the life of the loan, even after accounting for typical refinancing costs. With long-term mortgage rates at roughly 3.35 percent, this same household would save roughly $130,000 over the life of the loan by refinancing." But many households fail to take advantage of these savings. For example, in the period they study, December 2010, 20 percent of households that would have benefited from refinancing and had the ability to refinance did not do so. The median amount of unrealized savings was approximately $160 per month, or $11,500 per household over the remaining life of the loan. The total amount across all households was approximately $5.4 billion.
Return of the 3% down payment - It is getting easier for some buyers to land a house with less money up front. More lenders are lowering down-payment requirements, allowing borrowers to commit 3%—or even less—of a home’s purchase price to get a mortgage. Many had been requiring down payments of at least 20% since the recession began. Some lenders also are waiving mortgage-related fees, and more are allowing down payments to be made by other parties, such as the borrower’s family. The deals are aimed at buyers with good credit scores and a steady income who have been unable to save enough for a sizable down payment. They are often targeted at buyers who live in expensive housing markets, where even a small down payment can equal tens of thousands of dollars. Low-down-payment mortgages have long been available. The Federal Housing Administration insures mortgages with down payments as low as 3.5% and it is lowering the annual mortgage-insurance premiums on new mortgages beginning on Monday. The trend has picked up since mortgage-finance giants Fannie Mae and Freddie Mac which buy most mortgages from lenders, recently lowered the minimum down payments they will accept to 3% from 5%. The changes are driven by an Obama administration effort to make homeownership affordable to a wider group of buyers.
Building toward another mortgage meltdown » AEI: The Obama administration’s troubling flirtation with another mortgage meltdown took an unsettling turn on Tuesday with Federal Housing Finance Agency Director Mel Watt ’s testimony before the House Financial Services Committee. Mr. Watt told the committee that, having received “feedback from stakeholders,” he expects to release by the end of March new guidance on the “guarantee fee” charged by Fannie Mae and Freddie Mac to cover the credit risk on loans the federal mortgage agencies guarantee. Here we go again. In the Obama administration, new guidance on housing policy invariably means lowering standards to get mortgages into the hands of people who may not be able to afford them. Earlier this month, President Obama announced that the Federal Housing Administration (FHA) will begin lowering annual mortgage-insurance premiums “to make mortgages more affordable and accessible.” While that sounds good in the abstract, the decision is a bad one with serious consequences for the housing market.
Rent to Own: Wall Street’s Latest Housing Trick - ProPublica: At a conference on housing finance last month, a collection of investors described their innovative "rent-to-own" products. Rent-to-own schemes have long exploited the poor. Naturally, marketers address that problem with euphemisms. Today, it's called lease purchase. The arrangements work in myriad permutations, but the basic deal is that a person rents a home and pays for an option to buy it at a later date. All the panelists hailed the product, calling it a "yield enhancer" that would increase profits. In a standard lease, one panelist explained, the owner covers costs like taxes, maintenance cost and insurance. With lease purchase, the renter pays those expenses. And it's easier to evict because the occupant has only a rental agreement. It's not a foreclosure proceeding against an owner, after all. One went further. Eli Shaashua, of Red Granite Capital Partners, described it this way: "Basically, it's an added fee to the rent. For us, it instills pride in homeownership for some tenants who cannot currently when they rent a house own their own home." Having pride in ownership means that the renter takes care of the property more carefully. So that's a good thing — for the owner, that is. Shaashua went on to explain that his options last generally for two years. A renter pays a bit extra for the right to buy the house at a predetermined price, one above the current value. Then Shaashua delivered the kicker to the roomful of would-be investment managers: "Most times, given the reality, tenants do take it, but it's hard for them to execute the option," he said. "Our experience is that most stay until the end and then they say they cannot come up with the down payment or decide not to stay in the property."
Black Knight: House Price Index up slightly in November, Up 4.5% year-over-year - Note: Black Knight uses the current month closings only (not a three month average like Case-Shiller or a weighted average like CoreLogic), excludes short sales and REOs, and is not seasonally adjusted. From Black Knight: U.S. Home Prices Up 0.1 Percent for the Month; Up 4.5 Percent Year-Over-Year Today, the Data and Analytics division of Black Knight Financial Services released its latest Home Price Index (HPI) report, based on November 2014 residential real estate transactions. The Black Knight HPI combines the company’s extensive property and loan-level databases to produce a repeat sales analysis of home prices as of their transaction dates every month for each of more than 18,500 U.S. ZIP codes. The Black Knight HPI represents the price of non-distressed sales by taking into account price discounts for REO and short sales. The Black Knight HPI increased 0.1% percent in November, and is off 10.1% from the peak in June 2006 (not adjusted for inflation). The year-over-year increases had been getting steadily smaller since peaking in 2013 - as shown in the table below - but the YoY increase has been about the same for the last three months:
Case-Shiller: National House Price Index increased 4.7% year-over-year in November -- S&P/Case-Shiller released the monthly Home Price Indices for November ("November" is a 3 month average of September, October and November prices). This release includes prices for 20 individual cities, two composite indices (for 10 cities and 20 cities) and the monthly National index. Note: Case-Shiller reports Not Seasonally Adjusted (NSA), I use the SA data for the graphs. From S&P: Home Price Gains Continue to Slow According to the S&P/Case-Shiller Home Price Indices Data released today for November 2014 shows a continued slowdown in home prices nationwide, but with price increases in nine cities. ... Both the 10-City and 20-City Composites saw year-over-year growth rates decline in November compared to October. The 10-City Composite gained 4.2% year-over-year, down from 4.4% in October. The 20-City Composite gained 4.3% year-over-year, compared to 4.5% in October. The S&P/Case-Shiller U.S. National Home Price Index, which covers all nine U.S. census divisions, recorded a 4.7% annual gain in November 2014 versus 4.6% in October 2014.The National and Composite Indices were both marginally negative in November. The 10 and 20-City Composites reported declines of -0.3% and -0.2%, while the National Index posted a decline of -0.1% for the month. Tampa led all cities in November with an increase of 0.8%. Chicago and Detroit offset those gains by reporting decreases of -1.1% and -0.9% respectively. The first graph shows the nominal seasonally adjusted Composite 10, Composite 20 and National indices (the Composite 20 was started in January 2000). The Composite 10 index is off 17.4% from the peak, and up 0.7% in November (SA). The Composite 20 index is off 16.4% from the peak, and up 0.7% (SA) in November. The National index is off 9.1% from the peak, and up 0.8% (SA) in November. The National index is up 22.8% from the post-bubble low set in Dec 2011 (SA). The second graph shows the Year over year change in all three indices. The Composite 10 SA is up 4.2% compared to November 2013. The Composite 20 SA is up 4.3% year-over-year.. The National index SA is up 4.7% year-over-year. Prices increased (SA) in all 20 of the 20 Case-Shiller cities in November seasonally adjusted. (Prices increased in 11 of the 20 cities NSA) Prices in Las Vegas are off 41.7% from the peak, and prices in Denver and Dallas are at new highs (SA).
"Prospects For A Home Run In 2015 Aren’t Good" - November Case-Shiller Confirms Ongoing Housing Market Slowdown -- In a day of furious disappointments, the Case-Shiller housing report, albeit looking at the ancient economic picture as of November, confirmed what most had known: that the growth in housing prices slowed down yet again on not only a Year over Year basis, which rose just 4.31%, the lowest annual increase since October 2012 but also dropped by -0.22% decline on a monthly basis, which may not sound like much, but was the worst monthly drop since February 2012!
House Prices: Better Seasonal Adjustment; Real Prices and Price-to-Rent Ratio in November - This morning, S&P reported that the National index increased 0.8% in October seasonally adjusted. However, it appears the seasonal adjustment has been distorted by the high level of distressed sales in recent years. Trulia's Jed Kolko wrote in August: "Let’s Improve, Not Ignore, Seasonal Adjustment of Housing Data" Sharply changing seasonal patterns create problems for seasonal adjustment methods, which typically estimate seasonal adjustment factors by averaging several years’ worth of observed seasonal patterns. A sharp but ultimately temporary change in the seasonal pattern for housing activity affects seasonal adjustment factors more gradually and for more years than it should. Despite the recent normalizing of the housing market, seasonal adjustment factors are still based, in part, on patterns observed at the height of the foreclosure crisis, causing home price indices to be over-adjusted in some months and under-adjusted in others.This graph from Kolko shows the weighted seasonal adjustment (see Kolko's article for a description of his method). Kolko calculates that prices increased 0.6% on a weighted seasonal adjustment basis in November - as opposed to the 0.8% SA increase and 0.1% NSA decrease reported by Case-Shiller.The "better" SA (green) shows prices are still increasing, but more slowly than the Case-Shiller SA.The expected slowdown in year-over-year price increases is ongoing. In November 2013, the Comp 20 index was up 13.8% year-over-year (YoY). Now the index is only up 4.3% YoY. This is the smallest YoY increase since October 2012 (the National index was up 10.9% YoY in October 2013, is now up 4.7% - a little more than the YoY change last month). Looking forward, I expect the YoY increases for the indexes to move more sideways (as opposed to down). Two points: 1) I don't expect the indexes to turn negative YoY (in 2015) , and 2) I think most of the slowdown on a YoY basis is now behind us. This slowdown in price increases was expected by several key analysts, and I think it is good news for housing and the economy.
A Look at Case-Shiller by Metro Area - (interactive table) Home prices in 20 major cities increased 4.3% in year ended in November, according to the S&P/Case-Shiller Home Price Index report. That’s below the 4.5% expected by economists and well below the double-digit gains in early 2014. The price slowdown reflects a decline in housing demand. Regionally, San Francisco and Miami continued to lead all cities, with gains nearing 9% over the past 12 months.
Zillow: Case-Shiller House Price Index year-over-year change expected to slow further in December - The Case-Shiller house price indexes for November were released Tuesday. Zillow has started forecasting Case-Shiller a month early - now including the National Index - and I like to check the Zillow forecasts since they have been pretty close. From Zillow: Expect Recent Trend of Sub-5% Annual Growth in Case-Shiller to Continue into 2015 The November S&P/Case-Shiller (SPCS) data released [Tuesday] showed a slight uptick in the pace of national home value appreciation in the housing market, with annual growth in the U.S. National Index rising to 4.7 percent, from 4.6 percent in October.Despite the modestly faster pace of growth, annual appreciation in home values as measured by SPCS has been less than 5 percent for the past three months. We anticipate this trend to continue as annual growth in home prices slows to more normal levels between 3 percent and 5 percent. Zillow predicts the U.S. National Index to rise 4.5 percent on an annual basis in December.The 10- and 20-City Indices saw annual growth rates decline in November; the 10-City index rose 4.2 percent and the 20-City Index rose 4.4 percent – down from rates of 4.4 percent and 4.5 percent, respectively, in October. The non-seasonally adjusted (NSA) 20-City index fell 0.2 percent from October to November, and we expect it to decrease 0.4 percent in December from November. We expect the same monthly decline in the 10-City Composite Index next month, falling 0.4 percent from November to December (NSA).All forecasts are shown in the table below. These forecasts are based on the November SPCS data release and the December 2014 Zillow Home Value Index (ZHVI), released Jan. 22. Officially, the SPCS Composite Home Price Indices for December will not be released until Tuesday, Feb. 24. So the year-over-year change in the Case-Shiller index will probably slow in December
New Home Sales at 481,000 Annual Rate in December, Highest December since 2007 -- The Census Bureau reports New Home Sales in December were at a seasonally adjusted annual rate (SAAR) of 481 thousand. October sales were revised up from 445 thousand to 462 thousand, and November sales were revised down from 438 thousand to 431 thousand. "Sales of new single-family houses in December 2014 were at a seasonally adjusted annual rate of 481,000, according to estimates released jointly today by the U.S. Census Bureau and the Department of Housing and Urban Development. This is 11.6 percent above the revised November rate of 431,000 and is 8.8 percent above the December 2013 estimate of 442,000." The first graph shows New Home Sales vs. recessions since 1963. The dashed line is the current sales rate. Even with the increase in sales over the previous two years, new home sales are still close to the bottom for previous recessions. The second graph shows New Home Months of Supply. The months of supply decreased in December to 5.5 months from 6.0 months in November. The all time record was 12.1 months of supply in January 2009. This is now in the normal range (less than 6 months supply is normal). "The seasonally adjusted estimate of new houses for sale at the end of December was 219,000. This represents a supply of 5.5 months at the current sales rate."
December New Home Sales Surge, But Annual Sales Up Only 1.2% - The December New Residential Single Family Home Sales increased 11.6% to 481,000 in annualized sales. This change is well within the statistical error margin of ±16.5%, but the highest level in six years. New home sales are notorious to be revised so while this surge seems strong, the figure to pay attention to is the annual sales. For the year, new single family home sales are now just 1.2% above 2013 levels of 429,000 homes sold. Sales figures are annualized and represent what the yearly volume would be if just that month's rate were applied to the entire year. These figures are seasonally adjusted as well. Beware of taking these monthly percentage changes in new home sales to heart, for most months the change in sales is inside the statistical margin of error and will be revised significantly in the upcoming months. The evidence is with the annual 435,000 homes sold 2014 total, as this figures only has a ±2.9% margin of error. The average home sale price was $377,800, a 17.,6% increase from December 2013. December's median new home price was $298,100. These prices are still clearly outside the range of what most wages can afford. From January 2013, the median new home sales price has increased by 8.2%. Taking the year into account, the median price has increased from $268,900 to $283,600, a 5.5% increase. Median means half of new homes were sold below this price and both the average and median sales price for single family homes is not seasonally adjusted. Inventories: New homes available for sale is now 219,000 units. This is a 17.1% increase from a year ago. Below is a graph of the months it would take to sell the new homes on the market at each month's sales rate, currently at 5.5 months The median time a house was completed and on the market for sale to the time it sold was 3.1 months. For 2013 the time period was 3.2 months.The variance in monthly housing sales statistics is so large, in part, due to the actual low volume overall, along with the fact this is a survey. One needs to look at least a quarter to get a real feel for new home sales, but a year of sales data is more in order. Additionally this report, due to it's huge margin of error, is almost always revised significantly the next month.
Seven Consecutive Downward Reivisions To New Home Sales Data Place Serious Doubts On Report Accuracy -- You will pardon us if we don't "buy" the latest attempt by the Census Department to telegraph housing euphoria with the just reported number of 481K new December home sales, a surge of 11.6% compared to November, an increase which was expected by the consensus to be only 2.7%. In fact, the 481K print is now the "highest" since June of 2008. The reason for our disbelief? Because as we have been tracking for the past 6, and now 7 months, every single such euphoric print since May of 2014 has been revised substantially lower after the fact (and after the headline-scanning algos promptly gobbled up stocks on the initial "beat"), and sure enough, the November print of 438K, was also just "revised" downward to 431K.
Comments on New Home Sales -- Earlier: New Home Sales at 481,000 Annual Rate in December, Highest December since 2007 The new home sales for December were at 481 thousand on a seasonally adjusted annual rate basis (SAAR). This was the highest level of sales in over 6 years (best December since 2007). However sales in 2014 were only up 1.2% from 2013 (1.4% rounded in table below). Here is a table of new home sales since 2000 and the change from the previous year: There are two ways to look at 2014: 1) sales were below expectations, or 2) this just means more growth over the next several years! Both are correct, and what matters now is the present (sales are picking up), and the future (still bright). Based on the low level of sales, more lots coming available, changing builder designs and demographics, I expect sales to increase over the next several years. As I noted last month, it is important to remember that demographics is a slow moving - but unstoppable - force! It was over four years ago that we started discussing the turnaround for apartments. Then, in January 2011, I attended the NMHC Apartment Strategies Conference in Palm Springs, and the atmosphere was very positive. One major reason for that optimism was demographics - a large cohort was moving into the renting age group. Now demographics are slowly becoming more favorable for home buying. This graph shows the longer term trend for several key age groups: 20 to 29, 25 to 34, and 30 to 39 (the groups overlap). This graph is from 1990 to 2060 (all data from BLS: 1990 to 2013 is actual, 2014 to 2060 is projected). We can see the surge in the 20 to 29 age group (red). Once this group exceeded the peak in earlier periods, there was an increase in apartment construction. This age group will peak in 2018 (until the 2030s), and the 25 to 34 age group (orange, dashed) will peak in 2023. This suggests demand for apartments will soften starting around 2020 +/-.
NAR: Pending Home Sales Index decreased 3.7% in December, up 6.1% year-over-year -- From the NAR: Pending Home Sales Stall in December The Pending Home Sales Index, a forward-looking indicator based on contract signings, decreased 3.7 percent to 100.7 in December from a slightly downwardly revised 104.6 in November but is 6.1 percent above December 2013 (94.9). Despite last month’s decline (the largest since December 2013 at 5.8 percent), the index experienced its highest year-over-year gain since June 2013 (11.7 percent)...The PHSI in the Northeast experienced the largest decline, dropping 7.5 percent to 82.1 in December, but is still 6.3 percent above a year ago. In the Midwest the index decreased 2.8 percent to 97.1in December, but is 1.9 percent above December 2013. Pending home sales in the South declined 2.6 percent to an index of 116.6 in December, but are 8.6 percent above last December. The index in the West fell 4.6 percent in December to 94.0, but is 6.3 percent above a year ago. Note: Contract signings usually lead sales by about 45 to 60 days, so this would usually be for closed sales in January and February.
Pending Home Sales See 2nd Biggest MoM Plunge Since May 2010 - The 3.7% plunge MoM in December's pending home sales is the 2nd largest since May 2010, drastically missing expectations of a 0.5% rise in sales (buoyed by exuberance from homebuilders). All regions saw weakness but the Northeast was worst with a 7.5% MoM plunge (so weather will be blamed we are sure - though it appears analysts never thought of that). Inventories fell for the first time in 16 months but NAR's chief economist proclaims it is time for "current homeowners to realize their equity gains and trade-up." Yep - more leverage...
U.S. Homeownership Rate Falls to 20-Year Low - The U.S. homeownership fell to its lowest level in 20 years at the end of 2014—levels last seen when national leaders embarked on a broad push to expand homeownership in the mid-1990s. The Commerce Department’s estimates published Thursday show that, after adjusting for seasonal factors, some 63.9% of U.S. households owned their homes in the fourth quarter, a level last recorded in the third quarter of 1994. The homeownership rate hasn’t fallen below that level since 1988. The homeownership rate stood at 65.1% one year earlier. The sharp drop over the past year reflects, in part, a large uptick in household formation, which is good for the economy. That can cause the homeownership rate to fall if more of those households rent, which is exactly what happened over the past year. The latest report showed that household formation increased by 1.66 million from a year earlier, with 2 million more renter households and 350,000 fewer owner households. The quarterly estimates are viewed as not terribly reliable by some economists, but the numbers suggest a step in the right direction. Thursday’s report offered some signs that the long slide in the homeownership rate may be nearing an end, said Paul Diggle, an economist at Capital Economics. Foreclosures and mortgage delinquencies are near their lowest levels in eight years, and the vacancy rate in the rental market is near a 20-year low.
HVS: Q4 2014 Homeownership and Vacancy Rates -- The Census Bureau released the Residential Vacancies and Homeownership report for Q4 2014. This report is frequently mentioned by analysts and the media to track the homeownership rate, and the homeowner and rental vacancy rates. However, there are serious questions about the accuracy of this survey. This survey might show the trend, but I wouldn't rely on the absolute numbers. The Census Bureau is investigating the differences between the HVS, ACS and decennial Census, and analysts probably shouldn't use the HVS to estimate the excess vacant supply or household formation, or rely on the homeownership rate, except as a guide to the trend. The Red dots are the decennial Census homeownership rates for April 1st 1990, 2000 and 2010. The HVS homeownership rate decreased to 64.0% in Q4, from 64.4% in Q3. I'd put more weight on the decennial Census numbers - and given changing demographics, the homeownership rate is probably close to a bottom. The HVS homeowner vacancy increased to 1.9% in Q4. Are these homes becoming rentals? Once again - this probably shows the general trend, but I wouldn't rely on the absolute numbers. The rental vacancy rate decreased in Q4 to 7.0% from 7.4% in Q3. I think the Reis quarterly survey (large apartment owners only in selected cities) is a much better measure of the rental vacancy rate - and Reis reported that the rental vacancy rate increased slightly over the last few quarters - and might have bottomed.
The American Dream Dissipates at Record Pace --- The housing market has been healed by the Fed’s bold actions, we’re told incessantly. We’re also told that the Fed is still keeping an eye on it because it might not be healed enough. Prices have soared over the last three years, and in some cities, like San Francisco, they have soared far beyond the prior crazy bubble peak. So we admit grudgingly that the Fed’s six-year money-printing and interest-rate-repression campaign, designed to inflate every asset price in sight even to absurdity, has worked. However, an essential element in a healthy housing market – people who actually live in homes they own – has been dissipating. The homeownership rate peaked in 2004 at 69.2%. It was during the prior housing bubble. Speculative buying drove up prices beyond the reach of many potential buyers. But an industry that knew no scruples helped and lured folks into homes and mortgages they couldn’t afford and would never be able to pay for. But as prices rose, even those methods were insufficient to keep the boom in homeownership going. And homeownership rates began declining in 2005. During the housing crash, the decline picked up speed, then meandered lower in a more leisurely pace. But now the trend has jumped off the cliff. Homeownership in the fourth quarter dropped to 63.9% on a seasonally adjusted basis, the lowest level since Q3 1994, according to the Commerce Department. In all of 2014, homeownership plunged by 1.2 percentage points, the largest annual drop in the history of the data series going back to 1980.The collapse of the American Dream is accelerating. This is what the “healing housing market” looks like in one heck of a relentless chart. Note the record-setting plunge in 2014:
Record Unaffordability for New Homes in 2014 - In terms of affordability, 2014 became the worst year on record for the median price of new homes sold in the United States. The chart below, showing the relationship between the trailing twelve month average of median new home sale prices and the trailing twelve month average of median household incomes reveals how new homes in the U.S. reached a record level of unaffordability for the typical American household. In this chart, we're measuring the affordability of U.S. median new home sale prices against the trend that existed between these prices and median household income in the pre-housing bubble years from 1987 through 1999. With that base for reference, we see that the previous record was reached in May 2006, when the trailing year average of median new home sale prices peaked at $242,658 in July 2006, which is 34% higher than the projected value of $181,000 that corresponds the same median household income of $46,700 if the stable trend that existed from 1987 through 1999 had held. By contrast, the preliminary figures for December 2014 indicate that the median price of new homes in the U.S. exceeded that ratio, setting a new record. In December 2014, the trailing year average of median new home prices was $282,300, which is 37% above the figure of $206,000 that corresponds to the projection of the 1987-1999 trend at the same median household income level of $53,600. To help put those figures in context, the chart below shows the major trends in the relationship between median new home sale prices and the median household income from 1967 through the present.
Remodeling Market Has Regained its Mojo, New Report Says -- The overall U.S. housing market still is struggling to hit its stride, but the remodeling market meanwhile has fully regained its mojo, according to a report released Thursday by the Harvard University Joint Center for Housing Studies. Kermit Baker, director of the center’s remodeling futures program, forecasts that spending in the U.S. remodeling market will grow by 4% to 5% this year to at least $330 billion, spanning work on both owned homes and rentals. That’s a slower growth rate than in previous years of the recovery, but it would be enough to make 2015 the richest year for remodeling spending of the past 15, surpassing the previous high point of $324 billion in 2007. “The market is largely recovered,” Mr. Baker said. “It will resume growth at its historical level, which has been (an average of ) just about 5% year over year for the past 30 years.” The main reason: A similar easing of home-price appreciation. . The median resale price of existing homes last month of $209,500 marked a 6% increase from a year earlier. In comparison, the increase in 2013 was nearly 10%. Homeowners are less likely to push ahead with an ambitious, pricey renovation if their home equity isn’t growing as rapidly anymore. Another factor sapping a bit of momentum from the robust remodeling market is that homeowners don’t have as much motivation now as they did in previous years to install energy-efficient windows, doors and other features in their house, Mr. Baker said. Part of that is because federal tax credits for such improvements have waned. An additional influence is that energy costs, particularly for gas for heating homes, have declined markedly in recent months. Still other factors will have the opposite effect, keeping remodeling spending from reversing course.
'Housing First' Policy for Addressing Homelessness Hamstrung By Funding Issues: In an era of shrinking financial resources, policymakers, providers, and activists who work on homelessness prevention and care in the United States have been forced to develop new strategies. There was a time when officials at the Department of Housing and Urban Development (HUD) saw it as their responsibility to provide both housing and supportive services for homeless individuals, but now HUD now is refocusing its budget predominately on rent and housing—with the hope that other local, state, and federal agencies will play a greater role in providing supportive care. However, whether other organizations will actually be able to pick up those costs and responsibilities remains unclear. Though exact estimates are hard to come by, HUD recently reported that as of January 2014, the chronically homeless numbered some 84,291, with 63 percent of those individuals living on the streets. HUD says this number has declined by 21 percent, or 22,937 persons, since 2010—in large part because of the embrace of Housing First. (Some, however, have accused the federal government of using data gimmicks to paint a more cheery picture of progress than has actually been made.)
How a Two-Tier Economy Is Reshaping the U.S. Marketplace - WSJ: The emergence of a two-tiered U.S. economy, with wealthy households advancing while middle- and lower-income Americans struggle, is reshaping markets for everything from housing to clothing to groceries to beer. “It’s a tale of two economies,” said Glenn Kelman, chief executive of Redfin, a real-estate brokerage in Seattle that operates in 25 states. “There is a high-end market that is absolutely booming. And then there’s everyone in the middle class. They don’t have much hope of wage growth.” The recession blew holes in the balance sheets of all U.S. households and ended a decadeslong loosening of credit for middle-class borrowers. Now, credit is tight, and incomes have been flat or falling for all but the top 10th of U.S. income earners between 2010 and 2013, according to the Federal Reserve. American spending patterns after the recession underscore why many U.S. businesses are reorienting to serve higher-income households, said Barry Cynamon, of the Federal Reserve Bank of St. Louis. Since 2009, average per household spending among the top 5% of U.S. income earners—adjusting for inflation—climbed 12% through 2012, the most recent data available. Over the same period, spending by all others fell 1% per household, according to Mr. Cynamon, a visiting scholar at the bank’s Center for Household Financial Stability, and Steven Fazzari of Washington University in St. Louis, who published their research findings last year.
For Many U.S. Families, Financial Disaster Is Just One Setback Away - Real Time Economics - WSJ: American families have made big strides repairing their balance sheets from the economic crash, but their finances remain disturbingly vulnerable to emergencies—a major obstacle to economic mobility, a new report says. About 70% of U.S. households are struggling with at least one of three problems with their balance sheets—low incomes, insufficient savings or debt, according to an analysis of government data by the Pew Charitable Trusts on Thursday. More than one-third of households face two or even three of the problems simultaneously, compounding their insecurity. That most U.S. families aren’t secure enough to weather a financial storm matters because when a storm comes, it could wipe away their chances to accumulate wealth, prepare for retirement and generally improve their living standards. “Families can’t be economically mobile if they aren’t economically secure,” says Pew researcher Erin Currier. Here are four things keeping family finances so fragile.
- 1. The economy is growing, but the typical family’s paycheck is not.
- 2. Many families’ incomes tend to lurch up and down, impairing financial (and emotional) stability.
- 3. Americans aren’t saving enough.
- 4. The nation’s growing wealth pile isn’t being shared.
Stop Trying to Make Financial Literacy Happen -- The idea behind the financial literacy movement sounds like common sense. The financial world is complicated? People don’t do the right things? Then educate them! Teach kids about budgets and living within their means, offer employees an investment information session—and voilà! Twenty years later, credit card debt and the retirement savings crisis will be things of the past, and we’ll all be on the road to financial nirvana. There’s only one problem: Financial literacy doesn’t work. One recent study published in the journal Management Science found that studying financial literacy has a “negligible” impact on future behavior and that within 20 months almost everyone who has taken a financial literacy class has forgotten what they learned. For a working paper, Shawn Cole at Harvard Business School, Anna Paulson at the Federal Reserve Bank of Chicago, and Gauri Kartini Shastry at Wellesley College discovered that high school classes imparting financial wisdom don’t seem to make a whit of difference when it comes to how we handle our finances. Others have found that lessons in financial literacy don’t lead to much in the way of increased test scores on the subject. So why do we persevere? Here’s one answer: The organizations most interested in promoting financial literacy are the ones that benefit the most from laws that assume consumers can be educated—and don’t need legal protection from corporate financial predators. This was on display at a Wednesday luncheon hosted by the Financial Services Roundtable, the lobbying organization representing several dozen leading financial firms, to announce a joint financial literacy venture with the Consumer Financial Protection Bureau. The roundtable will work with the federal watchdog agency “to advance a vision for stronger and more capable consumers,” as CFPB head Richard Cordray put it.
Consumer Sentiment January 30, 2015: Consumer sentiment held on to its very strong surge at the beginning of the month, ending January at 98.1 vs the mid-month reading of 98.2 and compared against 93.6 in December. The current conditions component extended its first half gain to 109.3 vs 108.3 at mid-month and against 104.8 in December. The comparison with December points to strength for January consumer activity. The expectations component ends January at 91.0 vs 91.6 at mid-month and 86.4 in December. Price expectations are low, at 2.5 percent for 1-year expectations, up 1 tenth from mid-month but down 3 tenths from December, while 5-year expectations remain at 2.8 percent, unchanged from both mid-month and December. Consumer spirits are now very strong but have yet to translate to a similar pickup in consumer spending. The University of Michigan's consumer sentiment index was up 4.6 points in the mid-January reading to 98.2 for the highest level since January 2004. The expectations component, up 5.0 points to 91.6, was also at its highest level since January 2004 and reflects confidence in the outlook for jobs and income. The current conditions component, up 3.5 points to 108.3, was at its highest level since January 2007. This gain points to ongoing acceleration in consumer activity.
Consumer Confidence Surges To Highest Since The Last Time Markets Crashed -- Despite stagnant wages, surging jobless claims, and global geopolitical anxiety, US consumers have not been this exuberant since August 2007... a month before the great quant fund blow-up and the top of US equities... But it's different this time, we're got money-printing and low oil prices... right? Texas confidence plunged from 119.4 to 111.9 (led by a huige crash in expectations from 95.8 to 83.5). Finally, expectations for higher incomes in the next 6 months surged higher - almost at record levels of hope - despite the slump in hourly average earnings. Highest since Aug 2007 The last time Consumers were this confident marked the top in US equities and the imminent crash of the quant funds... And finally the hope for higher income remains its stringest almost ever... in the face of an ugly reality... Charts: Bloomberg
Americans Are Feeling Better About the Economy—a Lot Better - Consumers are breaking into a happy dance and breaking out their wallets. Ever since oil prices began falling, consumers have been feeling better and been more willing to spend on stuff not flowing through a gas pump. The latest evidence of that came Friday with the release of the fourth-quarter gross domestic product report and the January consumer sentiment index. The Commerce Department reported real consumer spending jumped at a 4.3% annual rate, the fastest pace since 2006 and the main highlight of a disappointing report that showed the economy overall grew just 2.6% at the end of 2014. The consumer acceleration was broad-based. Growth accelerated for spending on durable and nondurable goods well as services. Consumers are more willing to spend because they feel more enthusiastic about the economy and their finances. The consumer sentiment index compiled by the University of Michigan’s Surveys of Consumers ended January at 98.1, the highest reading in 11 years.
Consumer confidence: it's a gas, gas, GAS! -- This is what $2/gallon gasoline does:via Doug Short. This is a 7 year high in consumer confidence, and well in line with economic expansions prior to the Great Recession. Gallup's daily economic confidence index also continues to be positive, after 7 years of being negative. Of a piece, there used to be a site called "Professor Pollkatz" which chronicled the high correlation between George W. Bush's approval ratings and the price of gasoline. Obama's ratings show a similar pattern.
Restaurant Performance Index shows Expansion in December - I think restaurants are happy with lower gasoline prices (except, I hear, McDonald's) ... Here is a minor indicator I follow from the National Restaurant Association: Restaurant Performance Index Finished the Year on a Positive Note Driven by positive sales and traffic and an uptick in capital expenditures, the National Restaurant Association’s Restaurant Performance Index (RPI) finished 2014 with a solid gain. The RPI – a monthly composite index that tracks the health of and outlook for the U.S. restaurant industry – stood at 102.9 in December, up 0.8 percent from its November level of 102.1. In addition, December marked the 22nd consecutive month in which the RPI stood above 100, which signifies expansion in the index of key industry indicators. “Growth in the RPI was driven by the current situation indicators in December, with a solid majority of restaurant operators reporting higher same-store sales and customer traffic levels,” said Hudson Riehle, senior vice president of the Research and Knowledge Group for the Association. “In addition, six in 10 operators reported making a capital expenditure during the fourth quarter, with a similar proportion planning for capital spending in the first half of 2015.”“Overall, the RPI posted three consecutive months above 102 for the first time since the first quarter of 2006, which puts the industry on a positive track heading into 2015,”
Vehicle Sales Forecasts: "Best January in 8 Years" - The automakers will report January vehicle sales on February 3rd. Sales in December were at 16.8 million on a seasonally adjusted annual rate basis (SAAR), and it appears sales in January will be lower - but will probably be the best January in eight years.Note: There were 26 selling days in January this year compared to 25 last year.Here are two forecasts: From WardsAuto: Forecast: U.S. Automakers to Record Best January in Eight Years A WardsAuto forecast calls for U.S. automakers to deliver 1.13 million light vehicles in January, marking the industry’s best kickoff since January 2006. ... the report puts the seasonally adjusted annual rate of sales for the month at 16.4 million units, compared with a year-ago SAAR of 15.2 million and December’s 16.8 million mark. And from TrueCar: TrueCar forecasts strong start for 2015 auto sales with 13.2% volume gain and 16.6 Million SAAR in January TrueCar, Inc. ... forecasts the pace of auto sales in January expanded to a seasonally adjusted annualized rate (SAAR) of 16.6 million new units on continued consumer demand. New light vehicle sales, including fleet, should reach 1,446,600 units for the month, up 13.2 percent over a year ago. On a daily selling rate (DSR) basis, adjusting for one additional selling day this January versus a year ago, deliveries will likely rise 8.9 percent. Another strong month for auto sales.
Cities and the Environment--A first order effect? - I was reading a story about peak driving over the weekend. In the course of reading the story, I discerned that we here in California drive far less than the average American. In fact, California ranks 41st among the states in per capita driving: Date are from the Insurance Institute for Highway Safety. Given the stereotype about California (as a place where everyone drives, always), this was a surprise to me. But then it dawned on me--when one excludes the District of Columbia (which is kind of like a state, just without representation), California is the most urbanized state in the country. And so I drew a scatter plot of VMT per capita against urbanization by state: So a one percentage point increase in urbanization is associated with an 81 mile per year reduction in driving. I think the direction of causality is not too big a problem here (it is hard to tell a story that more driving causes a reduction in urbanization). So Matt Kahn, Ed Glaeser and Richard Florida are all right--cities are environmentally friendly!
Investment Riches Built on Subprime Auto Loans to Poor - The loans were for used Dodges, Nissans and Chevrolets, many with tens of thousands of miles on the odometer, some more than a decade old.They were also one of the hottest investments around.So many asset managers clamored for a piece of a September bond deal made up of these loans that the size of the offering was increased 35 percent, to $1.35 billion. Even then, Santander Consumer USA received more than $1 billion in investor demand that it could not accommodate. Across the country, there is a booming business in lending to the working poor — those Americans with impaired credit who need cars to get to work. But this market is as much about Wall Street’s perpetual demand for high returns as it is about used cars. An influx of investor money is making more loans possible, but all that money may also be enabling excessive risk-taking that could have repercussions throughout the financial system, analysts and regulators caution. In a kind of alchemy that Wall Street has previously performed with mortgages, thousands of subprime auto loans are bundled together and sold as securities to investors, including mutual funds, insurance companies and hedge funds. By slicing and dicing the securities, any losses if borrowers default can be contained, in theory. Led by companies like Santander Consumer; GM Financial, General Motors’ lending unit; and Exeter Finance, an arm of the Blackstone Group, such securitizations have grown 302 percent, to $20.2 billion since 2010, according to Thomson Reuters IFR Markets. And even as rising delinquencies and other signs of stress in the market emerged last year, subprime securitizations increased 28 percent from 2013.
Apple Reportedly Selling More iPhones in China Than in U.S. -- Apple may have sold more iPhones in China than the U.S. for the first time on record, according to advanced reports of Apple’s upcoming earnings report. Analysts expect Apple to announce the historic tipping point on Tuesday, when Apple will unveil its global sales results for the final quarter of last year, the Financial Times reports. UBS analysts told the Financial Times that China alone accounted for an estimated 36% of global iPhone shipments last quarter, while the U.S. slipped behind with 24% of shipments. Analysts say a partnership with the country’s largest carrier, China Mobile, combined with the recent release of the iPhone 6, propelled sales growth in the region to a record high.
Durable Goods Orders Fall Sharply in December - —U.S. businesses broadly cut capital spending in the final months of 2014, raising red flags about the economy’s ability to sustain momentum amid troubles around the globe. Orders for durable goods—products like cars and kitchen appliances designed to last at least three years—fell 3.4% in December from a month earlier, the Commerce Department said Tuesday. Orders have fallen four of the past five months. Falling sales of civilian aircraft—a highly volatile segment—drove December’s decline. But demand fell across the board, hitting machinery, computers, communications equipment and other products. Excluding transportation products, orders fell 0.8%. Some economists were shocked by the broad decline given the spurt of stronger economic growth and job creation in the U.S. last year. They said the report could be an early sign that global turbulence—including a sharp dive in oil prices, a rising dollar and economic woes in Europe and Asia—could hit American manufacturers and weigh on U.S. growth in 2015. “Today’s numbers are stunningly soft, which should pour a hefty pitcher of cold water on those optimistic sentiments regarding business investment in 2015,”
US durable goods orders down 3.4% in Dec vs. up 0.5% expected: Orders for long-lasting manufactured goods dropped sharply in December, dragged lower by a big decline in demand for commercial aircraft. The Commerce Department says orders for durable goods fell 3.4 percent in December following a 2.1 percent decline in November. The weakness was led by a 55.5 percent plunge in the volatile category of commercial aircraft. There was also weakness in a number of areas, and a key category that serves as a proxy for business investment plans edged down 0.6 percent in December after a similar decline in November and a 1.8 percent fall in October.
Durable Goods Plummets for December 2014 - The Durable Goods, advance report shows new orders declined by -3.4% for December 2014. This month the decline was caused by volatile aircraft and parts. Core capital goods also dropped by -0.6%. For the last three of four months durable goods new orders as a whole have declined. Without transportation new orders, which includes aircraft, the durable goods decline would have been -0.8%. Without the Department of Defense's orders, the overall monthly decline would have been -3.2%. Below is a graph of all transportation equipment new orders, which plunged by -9.2% for the month. This all due to volatile aircraft orders. Motor vehicles & parts increased by 2.7%. Aircraft and parts new orders from the non-defense sector decreased -55.5%. Aircraft & parts from the defense sector decreased by -19.9%. Aircraft orders are notoriously volatile, each order is worth millions if not billions, and as a result aircraft manufacturing can skew durable goods new orders on a monthly comparison basis. Core capital goods new orders decreased by -0.6%. November's core capital goods new orders also decreased by -0.6%. Core capital goods is an investment gauge for the bet the private sector is placing on America's future economic growth and excludes aircraft & parts and defense capital goods. Capital goods are things like machinery for factories, measurement equipment, truck fleets, computers and so on. Capital goods are basically the investment types of products one needs to run a business. and often big ticket items. A decline in new orders indicates businesses are not reinvesting in themselves. This month machinery new orders declined by -3.7% and primary metals dropped -1.5%. To put the monthly percentage change in perspective, below is the graph of core capital goods new orders, monthly percentage change going back to 2000. Looks like noise right? We use so many graphs to amplify trends for one month of data does not an economy make, yet so many declines over months does. Even with the drop being caused by aircraft orders, this report is disquieting.
Orders for durable goods sink in December - Orders for durable goods declined sharply in December, raising questions about whether businesses are really ready to ramp up investment in 2015. Durable-goods orders sank 3.4% last month, the Commerce Department said Tuesday, while November’s reading was marked down to a 2.1% decline from a drop of 0.9%. Economists polled by MarketWatch had expected a 0.1% increase in orders, although expectations were all over the map. The weak December reading was the fourth decline in the past five months. Construction equipment maker Caterpillar separately forecast profits well below analyst expectations. The data comes as Federal Reserve officials gather in Washington to set monetary policy for the next six weeks. Economists expect the Fed to say it remains “patient” about the first rate hike.The surprising decline appeared to stem in part from how commercial-aircraft orders are calculated. Nondefense aircraft orders fell 55.5% in December. But there was weakness across the board. Orders excluding the volatile transportation sector were still down 0.8%, the third straight decline. Orders excluding defense were down 3.2%. And orders for core capital goods — a stand-in for general business investment — declined 0.6% in December. The softness in orders casts doubt on whether businesses will boost investment in 2015, a key ingredient for faster economic growth. Many economists predict this will be the year U.S. reaches or exceeds 3% GDP growth.
Dollar tumbles after surprisingly weak durable-goods orders - The U.S. dollar weakened against its main rivals Tuesday after the Commerce Department said durable-goods orders were surprisingly weak in December. The dollar has risen more than 6% against the euro since the year began, which is a drastic move, and some of the buck’s losses were part of a natural pullback, said John Doyle, director of markets at Tempus Inc. “It was a technical pullback from the big moves we saw during the first couple weeks of the year,” Doyle said. “But the bad data didn’t help.” Orders for durable goods dropped 3.4% in December, the fourth decline in the past five months. Economists surveyed by MarketWatch had expected orders to rise 0.1%. Adding to the sense of weakness, durable-goods orders for November were revised to show a 2.1% decline instead of a 0.9% decline. The durable-goods data amplified the dollar’s losses against the yen that had been sparked by a Japanese government minister’s comments about the Bank of Japan’s 2% inflation target, which reduced hopes for extra monetary-easing steps by the central bank.
Following November's across the board ugliness in Durable Goods data, the hockey-stick extrapolators all positioned for the bounce back... Only 1 of 57 economists expected a negative print! But the actual data was a total disaster. Against expectations of a 0.3% rise (following last month's 0.7% drop), December printed down 3.4% and November was revised drasticaly lower to down 2.1%. This is the lowest durable goods ex-transports since March. The breakdown:
- Durables: -3.4%, Exp. +0.3%, Last revised from -0.7% to -2.1%
- Durables ex transports: -0.8%, Exp. +0.6%, Last revised from -0.4% to -1.3%
- Core Cap Goods Orders: -0.6, Exp. 0.9%, Last revised from 0.0% to -0.6%
- Core Cap Goods Shipments: -0.2%, Exp. 1.0%, Last revised from 0.2% to -0.5%
And the ugliness in charts:
"Shadow Of The Crisis Has Not Passed": Durables Goods Orders Collapse -- Following November's across the board ugliness in Durable Goods data, the hockey-stick extrapolators all positioned for the bounce back... Only 1 of 57 economists expected a negative print! But the actual data was a total disaster. Against expectations of a 0.3% rise (following last month's 0.7% drop), December printed down 3.4% and November was revised drasticaly lower to down 2.1%. This is the lowest durable goods ex-transports since March.
Dallas Fed: Texas Manufacturing Activity Stalls and Outlook Worsens -- From the Dallas Fed: Texas Manufacturing Activity Stalls and Outlook Worsens Texas factory activity was flat in January, according to business executives responding to the Texas Manufacturing Outlook Survey. The production index, a key measure of state manufacturing conditions, came in at 0.7, indicating output was essentially unchanged from December. Other survey measures also reflected sluggish activity during the month. The capacity utilization index fell to 5.1, its lowest reading in five months. The shipments index plunged from 20.8 to 6, due to a much higher share of respondents noting a decline in shipments in January than in December. The new orders index moved down from 2.7 to -7.7, registering its first negative reading since April 2013. Perceptions of broader business conditions worsened this month, with both the general business activity index and the company outlook index dropping below zero for the first time in 20 months. The general business activity index dropped to -4.4, and the company outlook index fell 13 points, coming in at -3.8. Labor market indicators reflected unchanged workweeks but continued employment increases. The employment index was 9.0 in January, slightly below last month’s level but close to its average reading over the past two years.
"Unambiguously Good"? Dallas Fed Collapses To 20-Month Lows As Orders Plunge -- Who could have seen this coming? Well apparently all but one economist (TD Securties Greene and Mulraine had a -5.0 est) as the -4.4 print is almost a 4 standard deviation miss from extrapolator's and hockey-stickers' dreams. Following December's drop and miss, the Dallas Fed Manufacturing index is now at its lowest since May 2013. All components dropped, apart from inventories as 11% of firms reported layoffs and wage pressures eased.
Richmond Fed Manufacturing Composite: "Expanded Modestly" in January - The Fifth District includes Virginia, Maryland, the Carolinas, the District of Columbia and most of West Virginia. The Federal Reserve Bank of Richmond is the region's connection to the nation's Central Bank. The complete data series behind the latest Richmond Fed manufacturing report (available here) dates from November 1993. The chart below illustrates the 21st century behavior of the diffusion index that summarizes the individual components. The January update shows the manufacturing composite at 6, down from 7 last month. Numbers above zero indicate expanding activity. Today's composite number was spot on the Investing.com forecast of 6. Because of the highly volatile nature of this index, I like to include a 3-month moving average, now at 5.7, to facilitate the identification of trends. Here is a snapshot of the complete Richmond Fed Manufacturing Composite series.
Chicago PMI picks up to 59.4 in January - Chicago PMI rose in January, helped by growth in new orders and the best reading on employment in 14 months. Chicago PMI rose 0.6 points to 59.4. "This was a solid start to 2015 with current growth in orders and output consistent with ongoing strength in U.S. GDP. Encouragingly, the January survey showed that strength we saw in the second half of 2014 is having a significantly positive impact on employment," said Philip Uglow, chief economist of MNI Indicators. Any reading above 50 indicates expansion.
Chicago PMI Beats But Remains Lower Year-Over-Year - Having tumbled (and missed) for two straight months, hope triumped in January and pushed Chicago PMI above expectations printing 59.4 (against 57.4 consensus). This is still the 2nd worst print since July so let's not get all excited quite yet as only 4 components rose. This is the 4th month in a row of negative YoY prints. So just to clarify - US GDP misses notably and stocks say "meh" but Chicago PMI beats and stocks smash higher on a JPY lifeboat...
Wal-Mart’s manufacturing recovery? - President Obama, in his State of the Union address, told Americans that manufacturing in the United States is back. The president is right to applaud job creation in manufacturing. But both elected leaders and the public should be wary of one company in particular falsely taking credit for this “manufacturing renaissance”: Wal-Mart. Two years ago, Wal-Mart launched the U.S. Manufacturing Initiative, a pledge to create 1 million new jobs over the next 10 years through buying “U.S.-made goods.” But Wal-Mart has done very little to improve American jobs. In fact, it continues to harm our nation’s job market. Wal-Mart is the largest buyer of consumer goods in the world and is the nation’s largest importer of goods. Wal-Mart’s public relations campaign about U.S. manufacturing aims to distract Americans from two core aspects of Wal-Mart’s business model. First, as the country’s largest private sector employer, the company has played a leading role in driving down service-sector wages for millions of working families. The majority of workers in Wal-Mart stores are paid less than $25,000 a year. Second, the company is hoping Americans will forget that Wal-Mart has played a leading role in the offshoring of American jobs.
US Services PMI Improves But New Orders Drop To Post-Recession Low -- Just when you hoped the bad news was bad enough to warrant an uber-dovish Fed statement, Markit's US Services PMI prints 54.0, beating estimates of 53.8 and up from December's 53.0. After 6 months of dropping, January's preliminary data rose; however, as Markit notes, new business expansion fell to a post-recession low, “The 5.0% annualised rate of GDP expansion in the third quarter certainly looks like a peaking in the pace of expansion, with the surveys pointing to 2.5% annualised growth at the start of the year."
Hanjin cargo ship turns away from Portland as port labor issues near crisis - Chronic labor issues at the Port of Portland's marine terminals appear to be reaching a crisis. Dockworkers walked off the job twice this week at Terminal 6, according to the terminal operator, another flash point in months of labor strife at Oregon's only international container shipping terminal. Slowdowns and shutdowns are accompanying contentious contract negotiations between terminal operator ICTSI Oregon and the International Longshore and Warehouse Union. Shippers fear that Hanjin Shipping may again be contemplating pulling out of Portland. That could have major consequences for big importers including Fred Meyer and Columbia Sportswear, while leaving exporters including farmers and timber companies paying substantially more to truck their containers to the Port of Seattle. One Hanjin vessel abandoned plans to call at the Port of Portland this week after repeated delays in loading and unloading another cargo ship already in port. The Port of Portland confirmed the vessel had turned away from Portland. Neither ICTSI nor ILWU immediately returned calls seeking comment. Labor issues are affecting ports up and down the West Coast but shippers, port officials and importers all say the problems are especially severe in Portland, where labor disputes have disrupted work for more than two years.
Crude Oil Price Depression Increasingly Impacts Energy Development Negativity -- A somber note regarding the increasingly negative results emanating from the ongoing oil price crash has sounded depressing tones of cutbacks by the U.S. energy industry's backup manufacturing. U.S. Steel, a major producer of oil field tubular and supplemental products critical to crude oil and natural gas excavation and drilling, has announced a major cutback of such products, including the idling of plants in Ohio and Texas, which will lay off almost 800 workers. A spreading growth in layoffs by technical service providers such as Schlumberger and Baker-Hughes may just be the beginning of major industry layoffs. The subsequent production weakness of hydraulic fracturing (fracking) couldn't come at a worse time for U.S. Steel, which had been expecting a 2015 comeback year, encouraged by a resurgent American auto industry, along with the booming oil and gas sector. The shortfall of "fracking" expansion anticipated in the months to come are also concerning other U.S.-based steelmakers such as Nucor, Steel Dynamics, ArcelorMittal, and AK Steel Holding Corp. Oversupply in oilfield tubular, especially, has been exacerbated by an overage of steel imports, which were up 35%, to 38 million tons during the first 10 months of 2014. Current layoffs contemplated are sure to expand later this spring, barring an unexpected solid upward price reversal during the first quarter 2015. What has gotten lost in the obvious consumer price benefits "at the pump," in addition to the significant reduction of air transport jet fuel, etc., is the scope of reduction in growth by an economic sector that had become the driving force of America's manufacturing comeback.
Most U.S. Businesses Will See a Boost From Cheap Oil, Economists Say - Most U.S. businesses will benefit from lower oil prices this year, but the cheaper energy bill also threatens to derail a recent driver of economic growth, according to a new survey of business economists. Three-fourths of economists said their business or industry will feel the effects of the price drop, with 57% expecting a positive impact, and 18% anticipating a negative impact, according to a survey from the National Association for Business Economics released Monday. “By a three-to-one ratio, it’s positive,” said James Diffley, a senior director at IHS Economics and the survey’s chairman. “The 18% though represent those industries that benefit directly from oil and gas. So, yeah, there’s a negative, but we think the positive outweighs the negative.” Cheap fuel is expected to give the economy a boost this year as consumers turn around and spend what they’re saving at the pump. Gas prices have fallen to close to $2 a gallon, and are poised to fall below that, one of the swiftest declines on record. That led the International Monetary Fund to revise up its projection for U.S. growth this year. But it’s important to keep in mind that some of that extra stimulus could be taken away, Mr. Diffley said, as oil and gas firms scale back investment and development. That affects other jobs in the supply chain for tool makers and pipe fitters, for example.
Robert Reich on Redefining Redefining Full-Time Work, Obamacare, and Employer Benefits -- One of the U.S. Congress’s first acts of 2015? Trying to redefine what counts as full-time work, from 30 hours a week up to 40. It’s part of the latest attempt by Republicans to alter Obama’s signature healthcare law, the Affordable Care Act, and has already passed the House of Representatives. But it has also had the perhaps unexpected effect of putting the divide between full- and part-time workers front and center in American politics. I asked former Clinton Labor Secretary and UC Berkeley professor Robert Reich about the debate, and what it means for employers, employees, and the future of American work. An edited version of our conversation follows.
Did Ending Unemployment Insurance Extensions Really Create 1.8 Million Jobs? -- According to a new study by Marcus Hagedorn, Iourii Manovskii and Kurt Mitman (HMM), Congress failing to reauthorized the extension of unemployment insurance (UI) resulted in 1.8 million additional people getting jobs. But wait, how does that happen when only 1.3 million people had their benefits expire? The answer is by going off the normal path of these arguments in models, techniques and data. The paper has a nice write-up by Patrick Brennan here, but it’s one that doesn’t convey how different this paper is compared to the vast majority of the research. The authors made a well-criticized splash in 2013 by arguing that most of the rise in unemployment in the Great Recession was UI-driven; this new paper is a continuation of that approach. The model here is that UI makes it easier for workers to pass up job offers. As a result they’ll take a longer time to find a job, which creates a larger pool of unemployed people, raising unemployment. In order to test this, researchers use longitudinal data for individuals to compare the length of job searches for individuals who receive UI with those who do not. And though small, they are real numbers. The question then becomes an analysis of the trade-offs between this higher unemployment and the positive effects of unemployment insurance, including income support, increased aggregate demand and the increased efficiency of people taking enough time to get the best job for them. This is not what HMM do in their research. Either in terms of their data, which doesn’t look at any individuals, or their model, which tells a much different story than what we traditionally understand, or their techniques, which add additional problems. Let’s start with the model.
The Unconvincing Claim That Unemployment Benefits Hurt Jobs - CBPP - Many conservatives, including the Wall Street Journal editorial page and House Ways and Means Chairman Paul Ryan, are touting new research claiming that the expiration of emergency federal unemployment insurance (UI) benefits at the end of 2013 led employers to create 1.8 million additional jobs in 2014. The same researchers previously claimed that the existence of emergency federal jobless benefits explained most of the persistence of high unemployment in the recovery from the Great Recession. These findings merit considerable skepticism. Let’s start with the 1.8 million net new jobs. The implication is that if lawmakers had renewed federal UI for 2014 instead of letting it expire, employers would have added fewer than 1.2 million jobs to their payrolls in 2014 instead of the nearly 3 million they did add. That would have been about half the 2.3 million jobs added in 2013 (see chart); it’s also well below the pace earlier in the recovery in 2011 and 2012, when many more people were receiving federal UI benefits. It’s hard to believe that continuing federal UI at 2013 levels would have so completely derailed the jobs recovery in 2014. Dean Baker offers a further reason to doubt this finding. It falls apart when one uses a different dataset that’s arguably superior for estimating job growth. The study takes advantage of the fact that the maximum number of weeks of federal UI available in a state in 2013 depended on the state’s unemployment rate to infer the employment effect of losing more versus fewer weeks of benefits in 2014 after federal UI ended. It relies on state and local data from the Labor Department’s Bureau of Labor Statistics (BLS), whose concepts and definitions BLS says “come from the Current Population Survey (CPS), the household survey that is the official measure of the labor force for the nation.” Those data are necessary for examining unemployment and labor force participation, but labor market analysts usually rely on the BLS survey of employers when evaluating trends in job creation.
U.S. firms raising wages; skills gap in goods producing sector: survey (Reuters) - A significant number of American companies plan to raise wages in the next three months, a survey showed on Monday, bolstering expectations of an acceleration in wage growth this year. The National Association for Business Economics' (NABE) latest quarterly business conditions survey found 51 percent of the 93 economists who participated said their firms expected to increase wages in the first quarter. That compared to 34 percent in the October survey. Almost a third said their firms had increased wages and salaries in the fourth quarter, up from just 24 percent the prior period. The economists represented a broad spectrum of businesses, including goods-producing, transportation, finance and services. "It seems as if a number of companies made a decision to kick-up wages at the end of the year. At this stage of the cycle where the unemployment rate has come down, hiring goals continue to improve and now wages are kicking in," said John Silvia, NABE president. Silvia, who is also chief economist at Wells Fargo, said the latest survey's findings supported the argument for a pickup in wage growth this year. Tepid wage growth has been a blemish on the labor market, which saw nearly 3 million jobs created in 2014 - the largest annual increase since 1999 - as the unemployment rate fell 1.1 percentage points to a 6-1/2-year low of 5.6 percent. The NABE survey found more respondents planned to increase hiring in the first quarter than in the prior quarter. While more than 60 percent of respondents said their firms had no problems filling open positions, 57 percent of those in the goods producing sector reported skills shortages.
Weekly Initial Unemployment Claims decreased to 265,000 -- The DOL reported: In the week ending January 24, the advance figure for seasonally adjusted initial claims was 265,000, a decrease of 43,000 from the previous week's revised level. This is the lowest level for initial claims since April 15, 2000 when it was 259,000. The previous week's level was revised up by 1,000 from 307,000 to 308,000. The 4-week moving average was 298,500, a decrease of 8,250 from the previous week's revised average. The previous week's average was revised up by 250 from 306,500 to 306,750. There were no special factors impacting this week's initial claims. The previous week was revised up to 308,000. The following graph shows the 4-week moving average of weekly claims since January 2000.
Jobless Claims Fall To 15-Year Low -- After reading today’s weekly update on jobless claims the Fed’s commentyesterday that “economic activity has been expanding at a solid pace” carries more weight. Indeed, new filings for unemployment benefits dropped by a staggering 43,000 last week to a seasonally adjusted 265,000—the lowest in nearly 15 years. The shortened business week due to the Martin Luther King holiday no doubt played a role, but for the moment it’s hard to spin today’s numbers into anything other than a positive sign for the economy. Okay, it might be noise. Jobless claims are notoriously volatile from week to week and the revisions can be dramatic and so any one number should be viewed with a hefty dose of suspicion on initial release. That said, today’s number arrives after a long run of falling claims data and so there’s good reason to think that the generally fading pace of layoffs remains intact. Note too that claims tumbled 23% last week vs. the year-earlier level, another sign that the downward momentum is quite strong. If and when we see claims rising on an annual basis we’ll have a compelling reason to worry about the US business cycle. But that warning sign is nowhere in sight.
Initial Jobless Claims Collapse To 15 Year Lows But Shale States Job Losses Explode - After 4 weeks missing expectations (and 3 above the crucial 300k mark), initial jobless claims totally and iutterly collapsed last week. Printing 265k (beating the 300k expectation by the most in years), the 13.9% drop WoW was the biggest since September 2005!!! This is the lowest initial claims data since the financial crisis and in fact the lowest since April 2000. But it is the story from the Shale states that is most troubling as initial claims through the 2nd week of January (data is lagged by state) show a massive surge in initial claims as unambiguously good news is very much not for many thousands across these regions.
Jobless Claims Are Even Lower Than They Appear - The Labor Department reported that 265,000 people filed initial claims for jobless benefits last week. To find a week when fewer people filed jobless claims, you have to go back to April 2000, the tail end of the 1990s economic boom. And these jobless claims figures are not adjusted for the increased size of the U.S. population or the U.S. workforce. Adjusted for the size of covered employment — the number of jobs that are eligible to file jobless claims–the share of workers actually filing new claims is near a record low. Not just the lowest since the 2000s, but the lowest on record. The 265,000 workers who filed jobless claims last week comprise 0.2% of the workforce, ever so slightly lower than the 0.21% attained in 2000. Times are not as good today–the unemployment rate in 2000 was 3.8%. Today, it’s 5.6%. A smaller percentage of people, even in their prime-working years, have jobs. In the late 2000s, layoffs were low and hiring was high. Today, layoffs are low but hiring is far from gangbusters. Wages, of course, have been stagnant for a long-time. So all is not well.
IBM To Cut More Than 110,000 Jobs, Report Says: IBM is reportedly planning its largest corporate layoff ever - cutting 111,800 of its staff.A report by a respected Silicon Valley journalist for Forbes said around 26% of the company's 430,000-strong workforce would be cut this week.The previous largest corporate redundancy was also carried out by IBM, when it cut 60,000 staff in 1993.The company's reorganisation is codenamed Project Chrome, and most of the staff being laid off are in the US.It will pave the way for IBM to focus on cloud computing, it is claimed, rather than its traditional hardware business. Reporter Robert X Cringely wrote: "To fix its business problems and speed up its 'transformation', next week about 26% of IBM's employees will be getting phone calls from their managers."A few hours later a package will appear on their doorsteps with all the paperwork." However, some technology commentators have said they are sceptical about the size of the reported cuts.
US companies cut more than 1m jobs a month. When did workers stop mattering? - IBM will reportedly announce this week the largest corporate layoff ever, at a reported 118,000 jobs. If it does, it is hardly the first time IBM or any other big company will have sacrificed its workers to appease the gods of Wall Street. At American Express, spending by the company’s cardmembers is growing, and so are revenues and profits. But not payroll: American Express just surprised financial markets by announcing plans to slash 4,000 jobs, cutting the number of employees by 6%. At eBay, the planned job cuts, announced days ago, total 7% of the workforce, or 2,400 individuals, and come despite a 9% jump in profits and a 12% increase in revenues. Indeed, even before January has drawn to a close, one calculation puts the number of jobs lost in large-scale layoffs at more than 32,000. “January is the worst month of the year for layoffs, and an increase in layoffs would be very normal after the kind of seasonal uptick in hiring that we tend to see in the fourth quarter,” he says. “Even when things are normal, employers still lay off a total of about 300,000 people every week, or 1.2 million people every month. It’s a staggeringly large number.” The difference is that this time around, the layoffs are large enough, and coming from large employers – American Express, Coca-Cola, US Steel – that don’t seem to have a compelling financial reason to slash jobs.
Fired Before Hired: How Corporations Rigged The Job Market And Killed The American Dream -- The latest corporate scam is to blame workers for the high unemployment rate. They say there is a skills gap. Even President Obama is in on the joke. The real skills gap is the other way around: too many skills for the low-wage menial jobs that pervade the labor market. The person who makes your coffee or your Big Mac might be able to design the next major bridge or write for The New York Times. Instead of high school kids cooking up your lunch, true professionals are behind the counter, and the future of the country is behind it too. The longer they stay there, the odds increase that America will take a permanent backseat in global power. In one short century, we have gone from superpower to super size me, a plutocracy, a nation that wasted its most valuable resource: the energy and innovation of its own people.
Clyde Prestowitz on the Destructive Effects of TPP on American Workers -- In last week’s State of the Union speech, Obama (again) pressed Congress to give him “fast track” negotiating authority (Trade Promotion Authority): I’m asking both parties to give me trade promotion authority to protect American workers, with strong new trade deals from Asia to Europe that aren’t just free, but are also fair. It’s the right thing to do. And then my favorite part: Look, I’m the first one to admit that past trade deals haven’t always lived up to the hype… “But Honey! I’ve changed!” Anyhow, Telesur describes the state of play:This week, officials from 12 countries across the Pacific Rim are meeting behind closed doors in a posh New York City hotel in an attempt to finish negotiations of the controversial Trans-Pacific Partnership (TPP). If concluded, the TPP would set binding rules for nearly half of the global economy. Meanwhile, the nations working on the deal, which in addition to the U.S. includes Australia, Brunei, Canada, Chile, Japan, Malaysia, Mexico, New Zealand, Peru, Singapore, and Vietnam, are moving quickly to finalize the agreement before the public is aware of what they are doing. After missing previous deadlines, President Barack Obama is now pushing for talks to wrap up in the next few months. Although it is called a “free trade” agreement, the TPP is about more than just trade. It is impossible to know everything that is hiding in the text, since civil society and the press are locked out from the negotiating process, and texts are kept completely secret (though more than 500 so-called advisors the vast majority representing corporate interests, have access to the texts). However, what we do know based on leaks is that the agreement is being negotiated to benefit corporations at the expense of workers, consumers, and the environment.
Nancy Pelosi Hopes To Push Obama Trade Agenda While Meeting Democratic Concerns: (Reuters) - U.S. House Democratic leader Nancy Pelosi said on Wednesday she would like to find a way to grant the Obama administration "fast-track" trade negotiating authority while meeting the concerns of many Democrats about major new free-trade deals. Speaking to reporters at a retreat for House Democrats in Philadelphia, Pelosi said her standard for evaluating such authority would be the effect that trade deals would have on the paychecks of American workers. "We'd like to see a path to yes," Pelosi said of fast-track trade authority. Such powers would allow the Obama administration to complete negotiations on major trade pacts with Asia-Pacific and European countries with only a yes or no vote on the final product. The aim is to coax better trade deals from partner countries with the assurance that Congress won't tinker with the final terms. Republicans, who now control both the House and Senate, are pushing hard to pass fast-track trade legislation and have called on Obama to do more to persuade Democrats to go along with the plans. A number of Democrats have voiced opposition to the fast-track powers, which Obama asked for in his State of the Union address last week. U.S. Trade Representative Michael Froman told lawmakers on Tuesday that the Trans-Pacific Partnership talks with Japan and other Asia-Pacific nations could be completed within months. Pelosi said the potential contents of the treaties worry many Democrats after the 1994 North American Free Trade pact led to U.S. manufacturing job losses. They want safeguards against currency manipulation and high standards for labor and environmental protections.
Ten Tall Tales on Trade -- Yesterday was a difficult day for U.S. Trade Representative (USTR) Michael Froman. He had to go before Congress and explain how the administration’s plan to expand a trade model that has offshored U.S. manufacturing jobs and exacerbated middle class wage stagnation fits with President Obama’s stated “middle class economics” agenda. Inconveniently for Mr. Froman, it does not. That did not stop Froman from trying to paint the last two decades of Fast-Tracked, pro-offshoring trade deals – and the administration’s plan for more of the same – as a gift to the middle class. The facts he cited to support this depiction actually sounded great. They just didn’t have the added advantage of being true. Here’s a rundown of the top 10 fibs and half-truths that Froman uttered before the Senate Finance Committee and House Ways and Means Committee yesterday in his sales pitch for the administration’s bid to expand the NAFTA “trade” pact model by Fast-Tracking through Congress the controversial Trans-Pacific Partnership (TPP).
The TPP Will Sink the Middle Class - Six years into his presidency, President Obama is now taking heat from a surprising place: congressional Democrats, who are lining up against his plan to force the Trans-Pacific-Partnership, or TPP, through congress without any debate whatsoever. If approved, the TPP, or as I like to call it, the Southern Hemisphere Asian Free Trade Agreement - SHAFTA - would create a whole new set of rules regulating the economies of twelve countries on four different continents bordering the Pacific Ocean. Unfortunately, because the TPP is being negotiated almost entirely in secret, we don’t know a lot about it. What we do know about it, though, comes almost entirely from leaks, and those leaks paint a pretty scary picture. Thanks to groups like WikiLeaks, we now know that the TPP would give big pharmaceutical companies virtual monopoly patent power, let corporations sue countries in international courts over regulations that those corporations don’t like, and gut environmental and financial rules. Given facts like this, you’d think that President Obama would want Congress to actually take the time and debate whether or not the TPP is a good idea for the American people. But that’s apparently not the case. To push the U.S. onto the TPP as soon as possible, he’s asked Congress to give him “fast-tracking” powers that would prevent lawmakers from making any amendments to the TPP. Instead, the treaty would be sent right to the floor where it would only have to pass a simple majority vote.
Middle Class Shrinks Further as More Fall Out Instead of Climbing Up - The middle class that President Obama identified in his State of the Union speech last week as the foundation of the American economy has been shrinking for almost half a century.In the late 1960s, more than half of the households in the United States were squarely in the middle, earning, in today’s dollars, $35,000 to $100,000 a year. Few people noticed or cared as the size of that group began to fall, because the shift was primarily caused by more Americans climbing the economic ladder into upper-income brackets.But since 2000, the middle-class share of households has continued to narrow, the main reason being that more people have fallen to the bottom. At the same time, fewer of those in this group fit the traditional image of a married couple with children at home, a gap increasingly filled by the elderly. This social upheaval helps explain why the president focused on reviving the middle class, offering a raft of proposals squarely aimed at concerns like paying for a college education, taking parental leave, affording child care and buying a home.
The Shrinking American Middle Class - The middle class, if defined as households making between $35,000 and $100,000 a year, shrank in the final decades of the 20th century. For a welcome reason, though: More Americans moved up into what might be considered the upper middle class or the affluent. Since 2000, the middle class has been shrinking for a decidedly more alarming reason: Incomes have fallen. Here, we walk through the trends in some detail. There is no universal definition of middle class, of course. Some definitions are based on occupation or wealth; others take regional cost of living into account. We have chosen a simple one starting at about 50 percent above the poverty level for a family of four ($35,000) and topping out at six figures of annual income ($100,000), adjusting for inflation over time. We realize many households making more than $100,000 consider themselves middle class, but they nonetheless are making considerably more than most households — even in New York or San Francisco. The 10-year income trends highlight the great 21st-century wage slowdown. Never before — since the Census Bureau’s data on household income began, in 1967 — has there been a decline in the share of households that qualify as high income. An article in Monday’s Times examines this trend in further detail. Younger households have borne the brunt of the slowdown. Those headed by people aged 30 through 44 are more likely to be lower income — and less likely to be middle income — than in 2000. Older households have done better. With more people working into their late 60s and wages rising for older workers, households headed by people 65 and older are now more likely to be middle or upper income than in the past, though they are still overrepresented in the lower-income group.
Working women and the middle class - Noah Smith - Kenneth Thomas of Angry Bear thinks I made an error when I said that things got better for the middle class in the last two decades of the 20th century: Noah Smith put up a post Sunday purporting to show that things aren’t so bad for the middle class. Then he immediately shows us a chart of median household income. Stop right there. As I have argued before, this is always going to give you a rosier picture than reality. We need to look at individual data, aggregated weekly (because average hours per week have fallen for non-supervisory workers), to know what’s going on. Because the individual real weekly wage is still below 1972 levels, households have had to compensate by having more incomes and going into debt. They have traded time and debt for current consumption. This is not an improvement in the middle class lifestyle. Commenter Richard Serlin points out that we also need to consider risk as well as average incomes, and he is right. The middle class is less secure than it was in 1972.Well, here's what I have to say to that. I don't understand the idea that "households have had to" compensate for lower weekly wages (also the choice of weekly over hourly wages continues to mystify me, since long workweeks suck, but OK). What does "have had to" mean?? They did not have to. They chose to. If I can choose how much I work, and my wage stays the same, and I work more and my income rises, then I must be better off. Because if I was not better off, then I wouldn't have chosen to work more and earn more income.Kenneth Thomas is basically saying that the mass entry of American women into the workplace in 1980-2000 represents a real deterioration in the living standards of the average American, despite the fact that it boosted household incomes substantially.
What is Noah thinking? Part 2 -- Kenneth Thomas - Noah Smith has replied to my recent post criticizing his use of median household income to measure middle class living standards. He raises some interesting questions, but some of them still leave me scratching my head. Smith writes:I don’t understand the idea that “households have had to” compensate for lower weekly wages (also the choice of weekly over hourly wages continues to mystify me, since long workweeks suck, but OK). Of course, no one literally had to compensate for the fact that their wages were falling, but people do prefer to maintain (if not improve!) their current level of consumption. So, if wages are falling, and you want to maintain your standard of living, you have to adjust something. Let’s make no mistake, real wages were falling (see Table B-15), and even today remain below their all-time peak. The Bureau of Labor Statistics (BLS) likes to use the period 1982-84 as its base period for inflation calculations, so the numbers that follow are in 1982-84 dollars to adjust for inflation. Smith likes to talk about 1980-2000, working from one business cycle peak to another, but he ignores the previous business cycle peak, 1973, which is a very interesting and important one since that is the year of peak real hourly wages (equal to 1972) and real weekly wages were just 37 cents less than 1972. It seems to me that it’s more interesting to ask if middle class workers are as well off as they were at their peak than to ask if they are as well off in 1979 or 1980.What happened to real wages? In inflation-adjusted dollars, the hourly wage peak of 1972-73 was $9.26 per hour; in 1980 it was $8.26 per hour, in 2000 it was $8.30 per hour, and in 2013 it had increased to $8.78 per hour. But it’s actually worse than that. Unlike professors, whose working time is pretty much their own as long as they teach well enough and publish enough to get tenure, most people cannot choose how much they work: Their employer decides that for them. Your paycheck is hourly wage times hours worked, and hours worked by production and non-supervisory workers has fallen from 36.9 in 1972 and 1973 to a low of 33.1 in 2009 and in 2013 was 33.7 hours per week. That is why we can’t look at just the hourly wage, but need to use the weekly wage (hours per year would be an even better metric, but BLS does not publish the data that way). By the way, this category of workers is no small slice: It makes up about 62% of the entire non-farm workforce and 80% of the non-government workforce.
Crucial Employment Cost Index Growth Slows - The Employment Cost Index (ECI) has become the new black on economic fashion circles and this morning's data will likely disappoint some. While meeting expectations with a 0.6% QoQ rise, this is slower than the 0.7% QoQ growth in Q3 and what is more problematic is much of the rise was driven by 2.5% YoY rise in Natural Resources industries (which we suspect will absolutely not be there going forward given the layoffs and collapse of the Shale industry). Furthermore, the total cost of employment index was pushed higher YoY by the biggest YoY surge in "benefits" costs since March 2012.
Economy Grows Incomes Shrink -- The first data on 2013 incomes show continuing bad news for Americans, my analysis of a new Internal Revenue Service report shows. Average income fell 2.6 percent in 2013, even though the economy grew 3.2 percent in real terms over 2012. Average inflation-adjusted income in 2013 was 8 percent lower than in 2007, the last peak economic year, and 6.9 percent less than in 2000, the year President George W. Bush set as the standard to evaluate the effect of his tax cuts and regulatory policies. This is the latest sign of a disturbing trend. An ever-shrinking share of national income flows to individuals while corporate profits expand. In fact, profits hit a record high in 2013 both in absolute terms and as a share of the economy. By both measures, profits have continued rising. By contrast, labor’s share of national income has been trending downward since 1980, except for a spike during the second term of President Bill Clinton. The decline accelerated after the Bush tax cuts took effect, retroactively, to the first day of 2001.
U.S. Workers Still Waiting for Wage Growth: U.S. employers aren’t yet getting squeezed by workers demanding higher wages. The employment-cost index, a broad gauge of wage and benefit expenditures, rose a seasonally adjusted 0.6% in the fourth quarter last year, the Labor Department said Friday. That’s down from 0.7% in the two earlier quarters and jibes with other data showing only limited wage pressure across the U.S. Wages and salaries, which account for about 70% of compensation costs, climbed 0.5%, a slowdown from the third quarter’s 0.8% pace. Benefit costs rose 0.6%, matching the prior quarter. The data is better than recent hourly earnings figures, which showed wages declining in December despite a postrecession low for the unemployment rate.
The Gender Wage Gap Is Still Hard, Now With More ..…Jodi Beggs - You all seemed to like the conversation about the gender wage gap after Obama’s State of the Union address, so I put together something a bit more formal for the Boston Globe. Here’s a more, let’s say, unfiltered version for those already somewhat familiar with the matter: In terms of “equal pay for equal work,” literally speaking, men and women are in fact on pretty equal footing- about 96 cents on the dollar for non-married women versus men if I recall correctly, so better enforcement of narrowly-defined discrimination laws won’t do a whole lot to narrow the observed wage gap that has been defined as problematic. In other words, let’s cut it out with the 77-cents crap. From a fairness perspective, the matter is somewhat complicated, since women with families (and, by extension, women on average) do in fact work fewer hours than men and ask for more flexibility in terms of working hours and location. So what would be fair? Let’s say that a woman works 20 percent less than an equivalent male- one starting point for fairness might be that she earn 20 percent less than the man. But what if working 20 percent less means that she’s not as “on call” or “present” as the man? This could make her productivity, on an hours-adjusted basis, less than the man’s, in which case it could be considered fair to pay her more than 20 percent less. The situation described above illustrates how an inflexible workplace that likely seems generally fair leaves women with family responsibilities behind in two ways. First, women who care for children can’t work as many hours as men who don’t have such responsibilities if it is mandated that those hours have to be between 8 a.m. and 6 p.m., . Second, inflexibility in terms of worker substitution makes it nearly impossible for a more “part time” employee to have the same productivity (even on an hours-adjusted basis) as one who gives over his entire existence to his employer.
Obama has a modest plan to tackle one of the most underrated economic problems in America - When President Barack Obama unveils his budget on Monday, it will include a proposal for $15 million to study occupational licensing requirements in all 50 states, according to the New York Times. The money will be used to combat a growing problem: states requiring licenses to practice professions like makeup artist, auctioneer, upholsterer, and interior decorator. In many cases, these regulations limit competition and drive up prices without doing much to improve quality. Many of Obama's funding proposals will face skepticism from the new Republican-controlled Congress. But promoting deregulation of state licensing rules is an idea that should be easy for GOP legislators to get behind, as it dovetails with the party's small-government philosophy. Supporters of occupational licensing argue that these kinds of state regulations are necessary to protect the public from unscrupulous or incompetent practitioners. No one wants to get surgery from an undertrained doctor or fly in a plane with an inexperienced pilot. But many states have expanded licensing rules to professions where it doesn't make much sense. A 2012 study from the Institute for Justice, a libertarian advocacy group, catalogued licensing rules in 50 states and the District of Columbia. The study found that 39 states require licensing for massage therapists, 34 states require a license to install security alarms, 29 states require a license to be a teacher's assistant, and 24 states require a license to be a coach. States license animal breeders, bartenders, funeral attendants, shampooers, and dozens of other professions.
Answering President Obama’s Call, House Introduces Paid Sick Leave Bill for Workers - In his State of the Union address last week, President Obama outlined a plan to bring America in line with the rest of the industrialized world and provide paid sick and family leave for workers. Before the address, he had issued a memorandum granting federal employees six weeks of paid sick leave for the birth of a child and asked Congress to legislate another six weeks. On Monday, Rep. Carolyn Maloney (D–New York) took the first step to expanding paid sick time by reintroducing the Federal Employees Paid Parental Leave Act. The bill gives federal employees access to six weeks of paid parental leave. Mahoney has consistently introduce paid parental leave legislation since 2000. Benefitting workers is not the only reason the Congress would want to pass the legislation. Government is competing with the private sector for top talent, and work life balance is consistently a top concern for younger workers. The Office of Management and Budget has said the extra weeks of paid leave would cost $250 million and would fit within the current budget. Currently Papua New Guinea, Oman and the U.S. are the only countries in the world that don’t guarantee paid sick leave for workers.
BLS: Forty-two States had Unemployment Rate Decreases in December - From the BLS: Regional and State Employment and Unemployment Summary Regional and state unemployment rates were generally lower in December. Forty-two states and the District of Columbia had unemployment rate decreases from November, four states had increases, and four states had no change, the U.S. Bureau of Labor Statistics reported today.... Mississippi had the highest unemployment rate among the states in December, 7.2 percent. The District of Columbia had a rate of 7.3 percent. North Dakota again had the lowest jobless rate, 2.8 percent. This graph shows the current unemployment rate for each state (red), and the max during the recession (blue). All states are well below the maximum unemployment rate for the recession. The size of the blue bar indicates the amount of improvement. The states are ranked by the highest current unemployment rate. Mississippi, at 7.2%, had the highest state unemployment rate although D.C was higher. The second graph shows the number of states (and D.C.) with unemployment rates at or above certain levels since January 2006. At the worst of the employment recession, there were 10 states with an unemployment rate at or above 11% (red).
Joblessness Fell in Most States in December. How Does Yours Compare? - The jobless rate fell in all four regions of the country last month, the latest sign of broad improvement in the overall economy. Forty-two states and the District of Columbia saw their seasonally adjusted unemployment rates fall in December compared with November, the Labor Department said Tuesday, and 46 states saw a decrease from a year earlier. The rates rose in four states from November, and held steady in another four. Delaware had the biggest decrease from last month, 0.6 percentage point to 5.4%, followed by Michigan and North Carolina, each of which fell 0.4 percentage point to 6.3% and 5.5% respectively. Illinois and Rhode Island saw the biggest declines over the year, while the rate actually increased 1.3 percentage points in Louisiana from December 2013. North Dakota once again had the lowest jobless rate at 2.8%. Mississippi had the highest unemployment rate in December among the states at 7.2%, while the District of Columbia had a 7.3% jobless rate. The Midwest continued to have the lowest unemployment rate, at 5.2%, while the West had the highest rate at 6.3%. All four regions also saw significant decreases in the jobless rate from a year ago, falling 1.6 percentage points in the Midwest, 1.3 percentage points in the Northeast, 1.1 percentage points in the West and 0.8 percentage point in the South. Overall, 19 states had rates significantly lower than the U.S. figure of 5.6%, 10 states and the District of Columbia had measurably higher rates, and 21 states had rates that were not appreciably different.
Most States End 2014 on the Right Path, Still With a Long Way to Go - The December state employment and unemployment data, released today by the Bureau of Labor Statistics, show that most states closed 2014 on a positive course. Employment growth over the final three months of the year was reasonably strong, and unemployment fell in nearly every state. This all points to an improving labor market, yet there is still considerable ground to make up before we can say that most states are back to prerecession labor market health. From September to December 2014, 44 states and the District of Columbia added jobs, with the largest percentage gains occurring in Alaska (+1.7 percent), Oregon (+1.4 percent), and Wisconsin (+1.2 percent). At the same time, six states lost jobs, with West Virginia (-0.5 percent), Maine (-0.4 percent), and Mississippi (-0.4 percent) experiencing the largest losses. When compared with the same period one year prior, employment growth in the final quarter of 2014 for the country overall was relatively strong: 0.6 percent in 2014 versus 0.4 percent in 2013 (a difference of about 350,000 jobs). In other words, the country added 100,000 more jobs per month this past quarter compared with the same time last year. From September to December, the unemployment rate fell in 44 states and the District of Columbia. The declines were largest in North Carolina (-1.2 percentage points), Delaware (-1.1 percentage points), Georgia (-1.0 percentage point), and Kentucky (-1.0 percentage point). However, at least some of the declines in these states may be attributable to job seekers giving up—not finding jobs—as the labor force shrank in all four of these states. While a shrinking labor force raises questions about the cause of recent unemployment declines in a handful of places, most states seem to have finished 2014 on the right track. Nevertheless, job growth for the country will still have to pick up from last year if the labor market is going to reach its prerecession health before the summer of 2017.
After a Year of Strong Job Growth, Recovery Remains Uneven: Southern States Lead with Smallest Racial Unemployment Rate Gaps in Fourth Quarter of 2014 - In December 2014, the national unemployment rate fell to 5.6 percent, the lowest it’s been since June 2008. Yet, even as the recovery moves ahead slowly, conditions vary greatly across states and across racial and ethnic groups. In December, state unemployment rates ranged from a high of 7.3 percent in the District of Columbia to a low of 2.8 percent in North Dakota. Nationally, African Americans had the highest unemployment rate, at 10.4 percent, followed by Latinos (6.5 percent), whites (4.8 percent), and Asians (4.2 percent, not seasonally adjusted).1 Following is an overview of racial unemployment rates and racial unemployment rate gaps by state for the fourth quarter of 2014. We provide this analysis on a quarterly basis in order to generate a sample size large enough to create reliable estimates of unemployment rates by race at the state level. We only report estimates for states where the sample size of these subgroups is large enough to create an accurate estimate. Interactive Map.
Philly Fed: State Coincident Indexes increased in 46 states in December -- From the Philly Fed: The Federal Reserve Bank of Philadelphia has released the coincident indexes for the 50 states for December 2014. In the past month, the indexes increased in 46 states and remained stable in four, for a one-month diffusion index of 94. Over the past three months, the indexes increased in 50 states, for a three-month diffusion index of 100. Note: These are coincident indexes constructed from state employment data. An explanation from the Philly Fed: The coincident indexes combine four state-level indicators to summarize current economic conditions in a single statistic. The four state-level variables in each coincident index are nonfarm payroll employment, average hours worked in manufacturing, the unemployment rate, and wage and salary disbursements deflated by the consumer price index (U.S. city average). The trend for each state’s index is set to the trend of its gross domestic product (GDP), so long-term growth in the state’s index matches long-term growth in its GDP.
The rise of big business and wage inequality - The potential explanations for the rise in income inequality are myriad. Inequality might be the caused by increasing demand for skilled labor, globalization, the weakening of labor market institutions, or some combination of all of the above. These theories, more or less, focus on changes in workers over time. But changes in the size of employers over time can also be an important source of rising income and wage inequality. A new National Bureau of Economics Research working paper argues that the increasing size of employers can help explain the rise in wage inequality. Firms on average in the United States are getting bigger. The underlying reason for this shift toward bigness isn’t clear yet, but we have evidence in a decline in the start-up rate in the United States. For workers, this trend may be a positive one. Research shows that employees at larger employers receive a wage premium compared to those working at smaller firms. Consider a recent paper that looked at wages at retail stores. Workers at large box retailers make more than similar workers at smaller mom-and-pop retailers. The new paper looks at the distribution of wages as a firm increases in size. The authors, Holger Mueller of New York University, Paige Ouimet of the University of North Carolina, and Elena Simintzi of the University of British Columbia, use a proprietary data set on wages inside firms in the United Kingdom. They divide workers within a firm into 9 groups by skill level, which also corresponds with wage levels inside the firm. What they find is that inequality, measured by wage ratios, increase as the firm grows in size, but this trend is driven entirely by an increasing gap between wages at the top compared to those at the middle of the distribution. The ratio of middle wages to bottom wages actually doesn’t increase as the firm size does.
The Increasingly Unequal States of America: Income Inequality by State, 1917 to 2012 -- Executive summary: Economic inequality is, at long last, commanding attention from policymakers, the media, and everyday citizens. There is growing recognition that we need an inclusive economy that works for everyone—not just for those at the top. While there are plentiful data examining the fortunes of the top 1 percent at the national level, this report uses the latest available data to examine how the top 1 percent in each state have fared over 1917–2012, with an emphasis on trends over 1928–2012 (data for additional percentiles spanning 1917–2012 are available at go.epi.org/topincomes1917to2012). In so doing, this analysis finds that all 50 states have experienced widening income inequality in recent decades.How are the top 1% doing in your state? Income trends have varied from state to state, but a pattern is apparent: the rapid growth of the top 1%. Drill down to individual states and regions in this interactive feature.
Inequality Is Not Just About Wall Street: It’s In All 50 States - For many Americans, the popular image of the top 1%–those Americans who are wealthier than the other 99%–is focused on Wall Street, the symbolic home of America’s financial markets, and where so much of the nation’s record wealth has accrued. In much rhetoric, New York City’s megabanks and hedge funds and private equity firms have become interchangeable with the 1%. But a new study of state-level tax data from the Internal Revenue Service shows that the story is incomplete. In the past 35 years, the gap between the wealthiest 1% and everyone else has widened in all 50 states. Inequality “is not just a story of those in the financial sector in the greater New York City metropolitan area reaping outsized rewards from speculation in financial markets,” The research builds off the work of French economist Thomas Piketty and Emmanuel Saez at the University of California at Berkeley, who previously used the same IRS data to measure the rising incomes of America’s very wealthiest residents. The period from 1979 to 2007 is particularly interesting. Real incomes were growing outside of the top 1% in almost every state (Wyoming, Nevada, Alaska and Michigan the exceptions). On average, incomes grew by 19% for the so-called 99%. But the wealthiest 1% saw their incomes triple during this period. Nationwide, the share of income going to the top 1% rose by about 12 percentage points. That varies from an increase of 3.9 percentage points in Louisiana to an increase of over 22 percentage points in Wyoming and Connecticut, according to the study.
Inequality in America in 10 Charts -- Inequality in America is about more than the rich and the poor. Significant income gaps are present by age, by race, by occupation, by family type, by homeownership and more. Since 1989, the Federal Reserve has compiled detailed data on the wealth of Americans, presented in 10 different charts in this interactive graphic. Seeing which groups rise and which fall provides a window into the trends shaping American wealth, from the lingering effects of the housing bubble to the benefits of higher education.
The average American household was poorer in 2013 than it was in 1983 - -- US net worth rose considerably over that period, which is what you would expect to see. Technology has improved and productivity increased, so society has a greater capacity for wealth building. America was also quite a bit older on average in 2013 than it was in 1983, so average wealth should have gone up. But all of these gains went to the top 20 percent of the population. It's worse than that, actually. Over 100 percent of the gains went to the top 20 percent, because the bottom 60 percent of the population got poorer. The data reflects the fact that economic inequality has grown, by a variety of measures, in recent decades. But the patterns here are also influenced by housing policy. The US government's main approach to helping middle-class families build wealth is to induce them to borrow large sums of money in order to buy houses. Because these investments are financed with so much borrowed money, they can be very lucrative but they're also very risky. As long as house prices go up, up, up, and up then it's all good. But a decline in house prices — like we saw from 2006-2012 — ends up absolutely devastating middle class balance sheets. And there's absolutely no sign anyone in power is even slightly considering revising this approach.
Why wealthy Americans’ delusions about the poor are so dangerous - American politics are dominated by those with money. As such, America’s tax debate is dominated by voices that insist the rich are unduly persecuted by high taxes and that low-income folks are living the high life. Indeed, a new survey by the Pew Research Center recently found that the most financially secure Americans believe “poor people today have it easy.” The rich are certainly entitled to their own opinions — but, as the old saying goes, nobody is entitled to their own facts. With that in mind, here’s a set of tax facts that’s worth considering: Middle- and low-income Americans are facing far higher state and local tax rates than the wealthy. In all, a comprehensive analysis by the nonpartisan Institute on Taxation and Economic Policy finds that the poorest 20 percent of households pay on average more than twice the effective state and local tax rate (10.9 percent) as the richest 1 percent of taxpayers (5.4 percent). ITEP researchers say the incongruity derives from state and local governments’ reliance on sales, excise and property taxes rather than on more progressively structured income taxes that increase rates on higher earnings. They argue that the tax disconnect is helping create the largest wealth gap between the rich and middle class in American history.
Wall Street's Threat to the American Middle Class - Robert Reich -- Presidential aspirants in both parties are talking about saving the middle class. But the middle class can’t be saved unless Wall Street is tamed. The Street’s excesses pose a continuing danger to average Americans. And its ongoing use of confidential corporate information is defrauding millions of middle-class investors. Yet most presidential aspirants don’t want to talk about taming the Street because Wall Street is one of their largest sources of campaign money. Do we really need reminding about what happened six years ago? The financial collapse crippled the middle class and poor — consuming the savings of millions of average Americans, and causing 23 million to lose their jobs, 9.3 million to lose their health insurance, and some 1 million to lose their homes. A repeat performance is not unlikely. Wall Street’s biggest banks are much larger now than they were then. Five of them hold about 45 percent of America’s banking assets. In 2000, they held 25 percent. And money is cheaper than ever. The Fed continues to hold the prime interest rate near zero.This has fueled the Street’s eagerness to borrow money at rock-bottom rates and use it to make risky bets that will pay off big if they succeed, but will cause big problems if they go bad.We learned last week that Goldman Sachs has been on a shopping binge, buying cheap real estate stretching from Utah to Spain, and a variety of companies. If not technically a violation of the new Dodd-Frank banking law, Goldman’s binge surely violates its spirit. Meanwhile, the Street’s lobbyists have gotten Congress to repeal a provision of Dodd-Frank curbing excessive speculation by the big banks.
Repeat after me: Wealth is not income and income is not consumption - The recently published Oxfam report on the distribution of net wealth in the world, released to coincide with the Davos meetings and showing that the global top 1% own almost one-half of world’s wealth, has generated lots of discussion. Some of it reflects the misunderstanding of what distribution of wealth is, and it is on that specific critique that I would like to focus. The critique started by Felix Salmon (and continued by The Economist). Salmon in his piece entitled “Oxfam’s misleading wealth statistics” noticed in the Oxfam report (and in the report on which Oxfam study is based, Credit Suisse Global Wealth Report for 2014) that among the bottom decile of adults, that is, among those with zero net wealth, there are about 40 million Americans and more than 50 million Europeans. That came as a shock: how can almost 100 million people from the rich world be among the poorest people on earth? (Other 80+% of the people in the bottom decile are from Africa, India, Latin America and Asia, as shown here in the graph from Credit Suisse report.)Salmon and others are perhaps not aware that, from the works published by Ed Wolff during the last 20 years and based on US Survey of Consumer Finances, we have known for years (see the graph below) that up to about one-fifth of American households have zero net wealth. When you exclude housing, the percentage of those with zero or negative net worth comes close to 30. How is net wealth defined? It is the sum of housing, cash, checking and savings deposits, financial assets such as stocks and bonds, and current cash value of life insurance and pension plans minus all liabilities (mortgages, loans). Most of the poor and the middle class have almost no financial assets, but their main assets is the homes they “own”. “Own” here comes between the quotes because a large chunk, and at times (as when hosing prices go down) more than 100% of the value of one’s home may be owned by a bank. A person has then a negative housing wealth. Add to that car loans, school loans, credit card loans, and you can see how a large chunk of American households may have negative or zero wealth, and how in the wake of the recent recession that percentage increased by about 3 points (or about 10 million individuals).
Former Mexican President Says Most Undocumented Immigrants Don't Want To Become US Citizens: -- The crackdown on illegal immigration combined with intensified border security has prompted large numbers of undocumented Mexican laborers to remain in the U.S. permanently -- even as many prefer to go home -- out of fear they will never be able to return, former Mexican President Felipe Calderon told International Business Times. In an interview on the sidelines of the World Economic Forum, Calderon, who was president from 2006 to 2012, characterized the primary motive of undocumented Mexican immigrants as economic. Many are simply seeking to stay in the U.S. for a few years to earn money before returning home with cash to build houses and support families, he said. But the American border crackdown has made the crossing so treacherous and expensive, many unauthorized immigrants already in the U.S. are staying put rather than risk being shut out forever, Calderon said. “Many of them are currently trapped,” Calderon told IBTimes. “There are a lot of these people [who] want to be in Mexico eight months every year, but they are unable to go there, because if they cross the border, they will never be able to cross back again.” Calderon said he believes U.S. lawmakers should consider adding provisions to proposed immigration legislation that would permit “temporary work in a massive way,” but without giving immigrants automatic citizenship. “I don’t believe that most of the Mexican workers looking for a job in the United States are wanting to be American citizens,” Calderon told IBTimes. “They are looking for an opportunity to get economic benefits and actually thinking when they are leaving [Mexico] what will be the way in which they can go back to their own home.”
Studies Reveal So-Called ‘Racially Progressive’ White Millennials Are Not So Different From the Racist Generations That Came Before Them -- Millennials have long been praised as one of the most racially progressive generations in America’s history, but a closer look at data about the young generation’s views and overall racial bias suggests that white millennials aren’t actually as progressive as many previously thought. Millennials are the generation that caused #CrimingWhileWhite to trend nationally on Twitter, helped elect the nation’s first Black president, caused a spike in the support of interracial relationships and organized rallies for slain unarmed Black men that generated massive and extremely diverse crowds of protesters. But despite comforting media headlines that assure the nation that millennials will likely deliver a serious blow to racism once they start taking on positions of power, it seems white millennials are only willing to describe themselves as “racially tolerant”—their actual social, political and economic views and inherent racial biases don’t support their illustrious title. While nearly all millennials agreed in a Pew study that “everyone should be treated equally, regardless of their race,” a 2012 study by a Syracuse University professor revealed that “white millennials appear to be no less prejudiced than the rest of the white population,” Perhaps the biggest issue is the fact that many white millennials didn’t even consider racism to be much of a problem in America anymore, claiming that white people face just as much discrimination as Black people do. A 2012 poll conducted by MTV revealed nearly 60 percent of white millennials believed discrimination affects white people just as much as it does people of color. Less than 40 percent of that same group believed white people had “more opportunities than racial minority groups.” To compare, 65 percent of Black millennials believed people of color had fewer opportunities than their white counterparts.
Louisiana budget hole widens even further: -- The Louisiana Legislature is going to have to dig deep to plug holes in the state's budget this year and next. That was the opinion of the Louisiana Revenue Forecasting Committee, which met Monday afternoon at the state capitol. The mid-year cuts for the fiscal year ending in June are now in the range of about $104 million. The Jindal administration had already cut the current budget by about $180 million. The gap for fiscal year 2016 has widened to more than $1.5 billion. The price of oil is mostly to blame. Lawmakers pegged this year's budget at $100 per barrel oil. It's now about half that. For every dollar the price of oil drops, Louisiana loses about $11 million in state revenue. "The news is bad, " said the state's chief economist Greg Albrecht. "Those are substantial downgrades to oil prices in the current fiscal year, and in future years it lowers the general fund baseline."
California county declares fiscal emergency due to oil price plunge - (Reuters) - Plunging oil prices led California's Kern County to declare a fiscal emergency on Tuesday, a move that allows officials to tap into a reserve fund as tax revenue faces a big decline due to the lower oil prices. A roughly 50 percent drop in crude prices since the summer is hitting budgets in U.S. oil regions. Kern County, in central California, is at the heart of the state's oil production. Officials in Kern County, with a population of about 900,000, say the plunge in oil prices has cut projected property tax revenue for the 2015/16 fiscal year budget by $61 million. Oil companies account for about 30 percent of the county's property tax revenues, said Lee Smith, an assistant county assessor. Roughly two-thirds of the county's revenue is gleaned from property tax. Overall, the projected drop in property tax revenues, combined with rising pension costs, will cause a $44 million hit to the county's general fund in 2015/15, said Nancy Lawson, the county budget director. The general fund is currently $781 million and in surplus. But by 2015/16, officials predict a $27 million general fund deficit, Lawson said.
Kasich: Eliminate income tax for business owners: – Ohio Gov. John Kasich wants to eliminate state income tax for many business owners as part of the state budget he plans to unveil Monday. He also plans to increase the personal exemption Ohioans can claim on their state income tax return if they earn $80,000 or less each year. Ohio will be able to afford the tax breaks in part because of surplus tax revenue, Kasich aides said. The governor will outline other measures to pay for the plan on Monday. He's expected to call for an increase in other taxes, such as those on cigarette sales, business sales in Ohio and oil and gas obtained through fracking. Kasich has called for those tax increases before, as a way to pay for income tax cuts. Statehouse Republicans last year stymied the governor's proposals. On Thursday, they praised the governor's desire to cut income taxes for small business owners, but shot down any moves to pay for such tax cuts by increasing other taxes. "The House will not accept tax shifting. We just won't do it," said House Speaker Cliff Rosenberger, R-Clarksville, at a forum held by The Associated Press. "The Senate will not consider a tax reform plan that does not take a significant amount of revenue off the table for the state,"
Census says 16m US children are living on food stamps, double the number in 2007 - American families increasingly need public assistance to help put food on the table. A new report by the US census bureau found that 16 million children live in families that receive food stamps, a number that almost doubled between 2007 and 2014. The numbers imply that one in five US children would have gone hungry last year had their family not qualified for public assistance. The number of children living in poverty has risen sharply since the Great Recession. Before that, just one in eight US children – about 9 million – received food stamps. Bolstering the evidence that more children are living in poverty, a recent report from the Southern Education Foundation found that more than half the children attending public school in the United States qualified for federal programs for free or reduced-price lunches. That percentage is the highest in at least 50 years, the SEF found. In addition, in its annual report on poverty last fall, the US census bureau found that one in five children lives in poverty. According to the UN, out of 35 economically developed countries, the US ranks 34th when it comes to child poverty.
Census 1 in 5 US Children Rely Food Stamps --The number of children in the United States relying on food stamps for a meal spiked to 16 million last year, according federal data, signaling a lopsided economic recovery in which lower income families are still lagging behind. The roughly one in five children who received food stamps in 2014 surpassed pre-recession levels, when one in eight or 9 million children were on food stamps, according to the U.S. Census survey of American families released on Wednesday. Republicans in Congress have sought to cut back on the Supplemental Nutritional Assistance Program or food stamp program as part of a larger plan to balance the budget. Early last year lawmakers proposed $40 billion in cuts from the program over 10 years. The final farm bill signed into law trimmed $8.6 billion from the program, eliminating benefits for about 850,000 people, according to estimates by anti-hunger advocates. While the nationwide employment outlook has improved somewhat in recent years, food banks around the country are reporting soaring levels of food insecurity and demand for emergency food assistance. That is due in part to other recent cuts to food stamps, including a $5 billion across-the-board cut that took effect on Nov. 1, 2013. An additional $6 billion in automatic cuts are expected to occur over the next two years.Recent eligibility cuts are causing up to 1 million current recipients to lose benefits and resulting in “serious hardship for many,” according to a report from the Center on Budget and Policy Priorities.
One in five US children now rely on food stamps: Census data: he number of children in the United States relying on food stamps for a meal spiked to 16 million last year, according federal data, signaling a lopsided economic recovery in which lower income families are still lagging behind. The roughly one in five children who received food stamps in 2014 surpassed pre-recession levels, when one in eight or 9 million children were on food stamps, according to the U.S. Census survey of American families released on Wednesday Republicans in Congress have sought to cut back on the Supplemental Nutritional Assistance Program or food stamp program as part of a larger plan to balance the budget. Early last year lawmakers proposed $40 billion in cuts from the program over 10 years. The final farm bill signed into law trimmed $8.6 billion from the program, eliminating benefits for about 850,000 people, according to estimates by anti-hunger advocates. Other findings of the survey show a rapidly changing America in which more children are being raised in single-parent homes and more young people are delaying marriage. Of the 73.7 million children under 18 in the United States, 27 percent were living in single parent homes last year, tripling the 9 percent in 1960. The number of marriages also dwindled last year with less than half of households in America made up of married couples, compared to three-quarters in 1940, the survey found. The median age for people first getting married in 2014 was 29 for men and 27 for women up from 24 and 21 respectively in 1947.
One in Five U.S. Children Depends On Food Stamps - The use of food-stamps has generally leveled off as the economy has picked up in recent years, but it appears children are still struggling. Roughly 16 million U.S. children under the age of 18—about one in five—received food stamps last year, according to statistics on families released by the Census Bureau on Wednesday. The number of children on stamps remains higher than at the start of the 2007-09 recession. Back then, 9 million children—roughly one in eight— were on food stamps. The findings are the latest evidence of how little America’s less-advantaged groups—children, but also young adults, the poor, minorities, the middle class—have benefited from an economic recovery whose gains have gone disproportionately to the affluent. For years now, even as America’s overall wealth has hit new records, gaps in economic fortunes have widened along class, age, race and ethnicity lines. Median wealth has basically not changed between 2010 and 2013, a sign the middle class has been left out of the recovery. Median earnings for full-time U.S. workers aged 18 to 34 have fallen nearly 10% since 2000, after adjusting for inflation, hindering young adults’ prospects. So it’s not a surprise that America’s children are suffering, too. The rate of children living with married parents getting food stamps has doubled since 2007. Overall food-stamp use, despite plateauing, remains elevated, historically speaking. The latest Census data come from the 2014 Current Population Survey’s Annual Social and Economic Supplement, which has tracked families for over 60 years. Three other notable findings:
- • 15% of America’s 73.7 million children under 18 have a stay-at-home mother (24% of married families with children under 15 have one). For comparison, just 0.6% of overall children have a stay-at-home father.
- • The share of children who live with one parent only has tripled since 1960, from 9% to 27%.
- • Less than half (48%) of U.S. households today are married couples, down from 76% in 1940.
America’s broken program for low-income children with disabilities — and what to do about it -- Children with disabilities who live in poor families are among the most vulnerable Americans. Caring for children with disabilities can be a difficult task for any family — but especially for families who, in the majority of cases, were poor and in need of social services even before the challenge of caring for such a child arose. For these families, the social and economic capital that allows many middle-class families to cope with the difficulties of raising a child with disabilities is often absent. Our nation’s primary means of addressing this need is the Supplemental Security Income (SSI) program. SSI provides monthly cash payments to the families of 1.3 million children with disabilities from low-income households, as well as eligibility for health care through Medicaid. In 2013, SSI issued more than $10 billion in cash payments to the families of these children. SSI is effective at alleviating material hardship — it comprises about half of the total income for the households of children in the program, reducing the poverty rate of this group by 26 percentage points. For many families, SSI plays a vital role in meeting the medical and financial needs of a child with disabilities. But the program deserves scrutiny for what it does not do often enough: lead to positive long-term educational and employment outcomes for children in the program. For many children receiving SSI benefits, long-term or lifetime SSI benefit receipt at near-poverty income levels is a very real possibility.
Implications for Economic Growth of Governor Walker’s Proposed Higher-Ed Funding Cuts - From Foxnews:Wisconsin Gov. Scott Walker is calling for steep cuts to the University of Wisconsin System, while offering the network more freedom in exchange, … [H]is university plan … would cut funding by $300 million over two years… This measure would amount to a 13% cut in state funding to the university system. In addition, the Governor’s proposal includes a continued tuition freeze until 2017, until which time tuition changes would be unconstrained. That means under the Governor’s plan, funding levels would be reduced, while the university is stopped from raising revenues. Layoffs seem plausible. [1] I find this approach to dealing with the state’s calamitous fiscal situation (exacerbated by recent ill-advised tax cuts) interesting to the extent that higher education is important to economic growth. From KNOWLEDGE MATTERS, in the Journal of Regional Science (2012): A state’s knowledge stocks (as measured by its stock of patents and its high school and college attainment rates) are the main factors explaining a state’s relative per capita personal income. We find that these effects are robust to a wide variety of perturbations to the model. Other things equal, being one standard deviation above the states’ average in the stock of patents per capita (75 percent higher) leads to 3.0 percent higher per capita personal income. Similarly, being one standard deviation above the states’ average in high school attainment (a 20 percentage point increase) leads to 1.5 percent higher per capita personal income. Finally, being one standard deviation above the states’ average in college attainment (23 percentage points higher) leads to 1.4 percent higher per capita personal income.
National science standards a possibility for Wyoming schools -- Wyoming public schools will likely meet national science standards after lifting a ban prohibiting lesson plans that link global warming to burning fossil fuels, according to an article in the Houston Chronicle. The state’s House of Representatives gave its preliminary approval Thursday to reverse the ban, which was established last year. The Next Generation Science Standards (NGSS) were developed by partners in 26 states to ensure that students in every state meet the same educational requirements. Today, the standards have only been adopted in 10 states. Last March, Wyoming became the first and only state to seek legislation effectively barring NGSS from state’s curriculum. Rep. Matt Teeters (R-Lingle) proposed a budget amendment prohibiting the Board of Education from considering the standards. State lawmakers took issue with some of the theories asserted by the standards, namely its stance on climate change: “Human activities, such as the release of greenhouse gases from burning fossil fuels, are major factors in the current rise in Earth’s mean surface temperature (global warming).”
The school choice journey: Parents experiencing more than improved test scores - Key Points:
- Studies indicate that low-income parents participating in the District of Columbia’s private-school choice program prioritize—at least initially—the safety of schools over schools’ academic quality as they transition from public schools. Furthermore, when evaluating their child’s academic progress, parents do not view standardized test scores as a key metric of success.
- Most interestingly, these urban parents report that they want to be respected as advocates of their child’s education and will fight hard to keep their child’s private-school choice program if that program’s future is threatened.
- These lessons should be considered when designing and implementing publicly funded, means-tested programs in an effort to break the cycle of poverty among low-income families and disadvantaged communities.
Texas teachers could be allowed to gun down students to protect school property: Lawmakers in Texas are considering a bill that would allow teachers to use deadly force against students. The Teacher’s Protection Act, filed by Rep. Dan Flynn (R-Van), would protect teachers from prosecution for killing students they believe are a threat to other students or anyone else on school grounds. Teachers would also be permitted to kill students to protect school property under the measure, which would protect them from civil liability if they used deadly force against students. Texas already permits teachers and other school employees to carry guns on campus.
High School Career and Technical Education - Roughly two-thirds of the US students who graduate from high school in a given spring go on to attend a college or university that fall. The breakdown is that about 40% of all high school graduates attend a four-year college, and 25% attend a two-year college. Along with the 35% of high school graduates that aren't attending college the next fall, there are also those who did not complete high school About 20% of those who attend high school in the US do not graduate on time with a regular diploma--although some of these will later pass a GED or other high school equivalency test. How will those who do not attend college, or who end up not finishing college, make a connection to jobs that offer a genuine career path: that is, reasonably stable paychecks, building skills and responsibilities over time, wage raises, and health care and retirement benefits? The most popular answer is that public policy should encourage more of these students should attend college, but I'm skeptical about that answer. I've written a number of times on this blog about the need for expanded programs of apprenticeships (for example, here, here, and here). In addition, I regret the trend away from career and technical education at the high school level. The National Center for Education Statistics collects statistics through its Career/Technical Education division. Here's one figure showing trends in the areas where high school students take their credits. Lots of areas are up, but career/technical education (CTE) is down. At a time when one of the major problems of the US economy is connecting those with lower academic skills to decent jobs, this seems like a mistake. My sense is that a lot of high schools are implicitly defining their mission as "pre-college," even while knowing that most of their students will not follow a four-year college path.
The man with 26 million students: The great and good attending the World Economic Forum (WEF) have done much hand wringing over how to address what one report termed a "worrying mismatch between the demand for specific skills and the supply of suitable candidates". While there seems to be a broad consensus on what the causes of the said gap are - outdated teaching methods and course syllabuses, and lack of in-work training - there is less agreement on what needs to be done, or who should be doing it. But one unlikely WEF attendee - a 24-year-old from New York who dropped out of Columbia University before completing his degree - is grabbing the attention of crusty executives gathered in this mountain resort. Introduced by global leaders as the "man who has 26 million students", Zach Sims runs a three-year-old website called Codecademy, which enables users to learn six popular programming languages, via a simple interface, for free."We figured if students at Columbia - a top five school in the country, can't find jobs when they graduate, there was probably a problem." So Zach started to teach himself to code. "We built the first version of Codecademy for me," he explains, and with the help of a friend, Ryan Bubinski, he expanded the site. Mr Bubinski became co-founder and together they launched Codecademy, in August 2011. In the first weekend more than 200,000 people used the product - "it gave the ability to send emails to all those people who said the market size was limited," Zach quips, unable to suppress a smile. The site now reaches almost 26 million students in more than 100 countries, and is helping people from all economic backgrounds to "up-skill", including residents of African refugee camps and single mothers in the US.
Obama Would Improve Tax Subsidies for Higher Education - President Obama will feature higher education prominently in next week’s budget—a choice that makes sense, given that educational attainment is the most straightforward pathway for economic advancement. Many of his ideas, which he highlighted in his State of the Union address, are controversial. And some don’t go far enough. But they’d do a better job helping households who most need education assistance than the current complex array of programs.Obama would restructure both spending and tax subsidies for higher education. Sandy Baum and Judith Scott-Clayton have commented on Obama’s plan for free community college education. But many of his ideas are aimed at tax subsidies. While replacing those tax programs with direct support would be more effective, the president’s proposals would go a long way towards simplifying the existing system. The tax code’s 14 tax preferences for higher education complicate filing and discourage people from choosing the most effective form of government assistance. It’s important consider what these programs should be doing. Should they be aimed at reducing costs for students who’d be going to college anyway? Or at expanding access to those who would otherwise not enroll? If the primary aim is the latter—and it should be—the system need to be easier to navigate and better targeted to low- and middle-income households. The best way to do that through the tax code is to replace deductions with credits—preferably refundable credits-- so that the size of subsidy does not increase with income. By that standard, the President would improve the current system.
Obama dropping plan to tax college savings (Reuters) - President Barack Obama has dropped a controversial proposal to tax "529" college savings plans, a White House official said on Tuesday, calling it a "distraction" from administration efforts to provide middle-class tax relief. The proposal had aroused opposition from Republicans and Democrats in Congress. A source familiar with the situation said House of Representatives Democratic leader Nancy Pelosi had pressed senior administration officials to drop the proposal as she flew with Obama on Air Force One from India to Saudi Arabia. true "Given it has become such a distraction, we’re not going to ask Congress to pass the 529 provision so that they can instead focus on delivering a larger package of education tax relief that has bipartisan support," the White House official said. The official said the plan had been "a very small component of the president’s overall plan to deliver $50 billion in education tax cuts for middle-class families."
Teaching and research are complements, not substitutes -- It could have been anyone's governor: Just what do university professors do all day? Gov. Scott Walker of Wisconsin has been hearing plenty on that topic since he remarked this week, during a discussion of his proposal to cut state appropriations for the University of Wisconsin system by $300-million over two years, that the universities “might be able to make savings just by asking faculty and staff to consider teaching one more class a semester.” ... The question is part of a larger public debate that goes back to at least 1967, when another Republican governor, Ronald Reagan of California, asserted that taxpayers should not be “subsidizing intellectual curiosity.” via chronicle.comGov. Walker is correct. Universities could save in labor costs by having professors teach one more course. That would certainly be a benefit to the taxpayers. But then there is an opportunity cost -- the value of what has been given up by the reallocation of professors' time. This is more difficult to quantify but let me try to describe it. Most professors at most universities conduct research in their field. Some of this research advances knowledge in important ways (and is the stuff that fills up textbooks, by the way) and some ... not so much. For most professors, the act of engaging in research makes them better teachers. It gives them a deeper understanding of the topic, keeps them current in their field, and adds excitement to the classroom. For example, I'm sure I could teach micro principles and do a halfway decent job without conducting any research on the side (or teach "out of the book" in macro principles). But, my teaching in upper level courses, the courses taken by economics majors that they hope helps get them jobs, would certainly suffer as I lose the important insights about what is currently being done in the field.
Is Obama Closing Retirement Savings Loopholes or Just Curbing Congress’ Generosity? -- In his upcoming budget, President Obama will propose to strip away the “loopholes” that permit wealthy individuals to accumulate large amounts in tax-favored retirement plans. He would prohibit a taxpayer from contributing any more to IRAs or other qualified retirement plans once his or her accounts reach a combined value of $3.4 million.For sure, $3.4 million is a lot of retirement savings. But many high-income workers can get there thanks to Congress’ repeated, explicit, and ongoing generosity, not because they exploit some obscure loopholes. Currently taxpayers can participate in a wide array of generous arrangements authorized expressly by Congress (presumably with full understanding of the consequences). And, in recent years, Congress aggressively expanded both individual and employer-sponsored retirement plans—often permitting participation without income limits. An individual taxpayer now can contribute annually up to $5,500 to an IRA (increased from $2,000 in 2000) and, with contributions from his or her employer, up to $53,000 to an employer-sponsored plan (increased from $30,000 in 2000). Additionally, taxpayers age 50 or older may contribute an extra $1,000 to an IRA and $6,000 to an employer plan each year to “catch up” on their retirement savings. Finally, an employer may also contribute to an employee’s defined-benefit plan—and these contributions often exceed $50,000 annually (the limit turns on actuarial calculations). In sum, we now have traditional IRAs, Roth IRAs, SEP IRAs, SIMPLE IRAs, 401(k)s, 403(b)s, 457(b)s, and a range of other employer-sponsored plans (both defined-contribution and defined-benefit plans).
Supreme Court Rules Against Retirees in Union Health Benefits Case -— The Supreme Court on Monday ruled that a chemical company may be able to cut the health benefits of its retired workers, unanimously reversing an appeals court ruling that said the benefits had vested for life.“Courts should not construe ambiguous writings to create lifetime promises,” Justice Clarence Thomas wrote for the court, adding that “retiree health care benefits are not a form of deferred compensation.”The Supreme Court returned the case to the appeals court, telling it to use ordinary principles of contract interpretation to determine whether the collective bargaining agreement at issue had granted free lifetime health care.The appeals court erred, Justice Thomas wrote, “by placing a thumb on the scale in favor of vested retiree benefits in all collective bargaining agreements.”The case concerned a union contract at the Point Pleasant Polyester Plant in Apple Grove, W.Va. Like many other collective bargaining agreements, it did not directly say whether health benefits for retirees would vest for life. M&G Polymers USA bought the plant in 2000. A few years later, it announced that it would require retirees to contribute to the cost of their health care benefits. Several retirees sued, saying they had been promised free health care for life.
CBO says Obamacare Will Cost 20% Less Than Initial Projections -- The CBO lowered its forecast of the cost of the Affordable Care Act by 20%. Here is the CBO report (pdf warning) I clip and past a dramatic graph. They also estimate that it has caused 12 million more people to have insurance. This is the net increase subtracting cancelled non ACA compliant pseudo insurance. I wonder if the official 12 million estimate will convince people to stop saying that the increase is around 10 million (I doubt it). My back of the envelope calculation was 13-14 million. Notably ACA critics claimed that the old CBO estimate, which implied that Obamacare would reduce the deficit, was bogus. Well it was incorrect (making predictions is difficult especially about the future) but because it underestimated the reduction of the deficit due to Obamacare. The CBO cost estimate of costs through is also 7% lower than their estimate made April 2014. That is, the latest estimate of the costs 2015-2024 is reduced by $101 billion (which isn’t pocket change even for the US Federal Government). Also and in addition, the new CBO estimate of the number of people who will gain insurance in 2024 due to the ACA is one million higher than the estimate made long ago in April 2014, so one million more people insured for 101 billion fewer dollars. Not bad at all.
Obamacare program costs $50,000 for every American who gets health insurance - It will cost the federal government – taxpayers, that is – $50,000 for every person who gets health insurance under the Obamacare law, the Congressional Budget Office revealed on Monday.The number comes from figures buried in a 15-page section of the nonpartisan organization's new ten-year budget outlook. The best-case scenario described by the CBO would result in 'between 24 million and 27 million' fewer Americans being uninsured in 2025, compared to the year before the Affordable Care Act took effect. Pulling that off will cost Uncle Sam about $1.35 trillion – or $50,000 per head.The numbers are daunting: It will take $1.993 trillion, a number that looks like $1,993,000,000,000, to provide insurance subsidies to poor and middle-class Americans, and to pay for a massive expansion of Medicaid and CHIP (Children's Health Insurance Program) costs. Offsetting that massive outlay will be $643 billion in new taxes, penalties and fees related to the Obamacare law.That revenue includes quickly escalating penalties – or 'taxes,' as the U.S. Supreme Court described them – on people who resist Washington's command to buy medical insurance.It also includes income from a controversial medical device tax, which some Republicans predict will be eliminated in the next two years. If they're right, Obamacare's per-person cost would be even higher.President Barack Obama pledged to members of Congress in 2009, as his signature insurance overhaul law was being hotly debated, that 'the plan I'm proposing will cost around $900 billion over 10 years.'It would be a significant discount if the White House could return to that number today.
Up to Six Million Households to Pay Penalty for Skipping Health Insurance - WSJ: —The U.S. government estimates as many as six million households may have to pay a penalty for not having had health-insurance coverage last year as required under the Affordable Care Act, officials said Wednesday. About 150 million taxpayers are expected to file returns during the coming tax season, said Mark Mazur, assistant secretary for tax policy at the Treasury Department. The tax-filing process this year is expected to be trickier because Americans will, in some cases, have to pay a penalty or get smaller refunds because credits they received to offset insurance premiums were too large. Up to 20% of tax filers—or about 30 million—who weren’t insured for most or any of last year likely will request and receive an exemption from the penalty, officials said. Many exemptions can be applied for during the tax-filing process. Government agencies are encouraging Americans to file their taxes electronically and are providing filers information via email, phone and text messages. They also are offering support tools on the Internal Revenue Service and other federal websites. The health law requires almost all Americans to have coverage or pay a penalty, with some exemptions. About 2% to 4% of tax filers are expected to have to pay the fine for not having carried insurance in 2014, which is $95 per adult, or 1% of family income, whichever is greater. The numbers are based on the percentages of affected filers provided by the Treasury Department. Taxpayers refers to households because, for tax purposes, taxes are paid by a household.
Doctors' Pay Will Be Linked to Quality in Historic U.S. Overhaul of Medical Billing - The Obama administration will make historic changes to how the U.S. pays its annual $3 trillion health-care bill, aiming to curtail a costly habit of paying doctors and hospitals without regard to quality or effectiveness. Starting next year Medicare, which covers about 50 million elderly and disabled Americans, will base 30 percent of payments on how well health providers care for patients, some of which will put them at financial risk based on the quality they deliver. By 2018, the goal is to put half of payments under the new system. For doctors and health facilities, the system will tie tens, and then hundreds, of billions of dollars in payments to how their patients fare, rather than how much work a doctor or hospital does, lowering the curtain on Medicare’s system of paying line-by-line for each scan, test and surgery.“We believe these goals can drive transformative change,” Sylvia Mathews Burwell, secretary of the Health and Human Services Department, said in the statement. The program would be a major shift for hospitals, health facilities and physicians, eventually more than doubling the reach of programs that the U.S. said has saved $417 million and that have been a model for how the government hopes to influence, and slow down, health spending. Medicare paid about $362 billion to care providers in 2014, the health department said in a statement, making it the biggest buyer of health care services in the U.S. Paying separately for each procedure, called “fee-for-service,” has long been viewed as an inefficient driver of U.S. health spending, which at more than 17 percent of gross domestic product is the highest in the world.
Some doctors won't see patients with anti-vaccine views | Fox News: With California gripped by a measles outbreak, Dr. Charles Goodman posted a clear notice in his waiting room and on Facebook: His practice will no longer see children whose parents won't get them vaccinated. "Parents who choose not to give measles shots, they're not just putting their kids at risk, but they're also putting other kids at risk - especially kids in my waiting room," the Los Angeles pediatrician said. It's a sentiment echoed by a small number of doctors who in recent years have "fired" patients who continue to believe debunked research linking vaccines to autism. They hope the strategy will lead parents to change their minds; if that fails, they hope it will at least reduce the risk to other children in the office. The tough-love approach - which comes amid the nation's second-biggest measles outbreak in at least 15 years, with at least 98 cases reported since last month - raises questions about doctors' ethical responsibilities. Most of the measles cases have been traced directly or indirectly to Disneyland in Southern California.
Don't Trade Away Our Health - Joe Stiglitz - A secretive group met behind closed doors in New York this week. What they decided may lead to higher drug prices for you and hundreds of millions around the world. Representatives from the United States and 11 other Pacific Rim countries convened to decide the future of their trade relations in the so-called Trans-Pacific Partnership (T.P.P.). Powerful companies appear to have been given influence over the proceedings, even as full access is withheld from many government officials from the partnership countries. Among the topics negotiators have considered are some of the most contentious T.P.P. provisions — those relating to intellectual property rights. And we’re not talking just about music downloads and pirated DVDs. These rules could help big pharmaceutical companies maintain or increase their monopoly profits on brand-name drugs. Trade agreements are negotiated by the office of the United States Trade Representative, supposedly on behalf of the American people. Historically, though, the trade representative’s office has aligned itself with corporate interests. If big pharmaceutical companies hold sway — as the leaked documents indicate they do — the T.P.P. could block cheaper generic drugs from the market. Big Pharma’s profits would rise, at the expense of the health of patients and the budgets of consumers and governments.
German hospital gripped by outbreak of multiresistant bacteria - A team of experts has arrived in Kiel following an outbreak of a multiresistant pathogen at a university clinic. At this point, 27 patients have been infected with the strain. Eleven have died. The bacterium in question, Acinetobacter baumannii, has been excluded as the cause of death in nine of the 11 cases, according to a hospital statement. In the other two cases, concerning patients aged 87 and 70, Schleswig-Holstein University Clinic (UKSH) spokesman Oliver Grieve said it "couldn't be ruled out" that the strain was solely responsible for the deaths. As of Saturday, 27 patients had been infected with the bacterium, which, according to experts, is particularly infectious among patients with immune deficiencies. For patients of normal health, the strain is considered far less dangerous. The reason for the alarm - and the impetus for flying in a team of leading specialists from the Frankfurt University Clinic - concerns the strain's almost impregnable resistance to antibiotics, the standard treatment of bacterial infections. "We are dealing with an extremely resistant strain of bacteria,"
Ebola outbreak: Virus mutating, scientists warn: Scientists tracking the Ebola outbreak in Guinea say the virus has mutated. Researchers at the Institut Pasteur in France, which first identified the outbreak last March, are investigating whether it could have become more contagious. More than 22,000 people have been infected with Ebola and 8,795 have died in Guinea, Sierra Leone and Liberia. Scientists are starting to analyse hundreds of blood samples from Ebola patients in Guinea. They are tracking how the virus is changing and trying to establish whether it's able to jump more easily from person to person "We know the virus is changing quite a lot," said human geneticist Dr Anavaj Sakuntabhai. Continue reading the main story “ Start Quote A virus can change itself to less deadly, but more contagious and that's something we are afraid of”End Quote Dr Anavaj Sakuntabhai Geneticist "That's important for diagnosing (new cases) and for treatment. We need to know how the virus (is changing) to keep up with our enemy." It's not unusual for viruses to change over a period time. Ebola is an RNA virus - like HIV and influenza - which have a high rate of mutation. That makes the virus more able to adapt and raises the potential for it to become more contagious. "We've now seen several cases that don't have any symptoms at all, asymptomatic cases," said Anavaj Sakuntabhai. "These people may be the people who can spread the virus better, but we still don't know that yet. A virus can change itself to less deadly, but more contagious and that's something we are afraid of."
Life in the Sickest Town in America - I drove from one of the healthiest counties in the country to the least-healthy, both in the same state. Here’s what I learned about work, well-being, and happiness. When I pulled into the school parking lot, someone was sleeping in the small yellow car in the next space, fast-food wrappers spread out on the dashboard. Inside, the clinic’s patrons looked more or less able-bodied. Most of the women were overweight, and the majority of the people I talked to were missing some of their teeth. But they were walking and talking, or shuffling patiently along the beige halls as they waited for their names to be called. There weren’t a lot of crutches and wheelchairs. Yet many of the people in the surrounding county, Buchanan, derive their income from Social Security Disability Insurance, the government program for people who are deemed unfit for work because of permanent physical or mental wounds. Along with neighboring counties, Buchanan has one of the highest percentages of adult disability recipients in the nation, according to a 2014 analysis by the Urban Institute’s Stephan Lindner. Nearly 20 percent of the area's adult residents received government SSDI benefits in 2011, the most recent year Lindner was able to analyze. According to Lindner’s calculations, five of the 10 counties that have the most people on disability are in Virginia—and so are four of the lowest, making the state an emblem of how wealth and work determine health and well-being. Buchanan county is home to a shadow economy of maimed workers, eking out a living the only way they can—by joining the nation’s increasingly sizable disability rolls.
The Likely Cause of Addiction Has Been Discovered, and It Is Not What You Think - It is now one hundred years since drugs were first banned -- and all through this long century of waging war on drugs, we have been told a story about addiction by our teachers and by our governments. This story is so deeply ingrained in our minds that we take it for granted. It seems obvious. It seems manifestly true. Until I set off three and a half years ago on a 30,000-mile journey for my new book, Chasing The Scream: The First And Last Days of the War on Drugs, to figure out what is really driving the drug war, I believed it too. But what I learned on the road is that almost everything we have been told about addiction is wrong -- and there is a very different story waiting for us, if only we are ready to hear it. If we truly absorb this new story, we will have to change a lot more than the drug war. We will have to change ourselves.I learned it from an extraordinary mixture of people I met on my travels. From the surviving friends of Billie Holiday, who helped me to learn how the founder of the war on drugs stalked and helped to kill her. From a Jewish doctor who was smuggled out of the Budapest ghetto as a baby, only to unlock the secrets of addiction as a grown man. From a transsexual crack dealer in Brooklyn who was conceived when his mother, a crack-addict, was raped by his father, an NYPD officer. From a man who was kept at the bottom of a well for two years by a torturing dictatorship, only to emerge to be elected President of Uruguay and to begin the last days of the war on drugs.
Marijuana’s Surprising Effects On Athletic Performance - When Olympic snowboarder Ross Rebagliati tested positive for a small amount of marijuana in his blood at the 1998 Japan games, his first-place finish was temporarily called into question. But THC, the main mind-altering chemical in marijuana, wasn't even included in the International Olympic Committee's banned-substances list at the time (it is now, but at a much higher level than the one he tested at). Rebagliati was allowed to keep his victory and medal. (He is now in the medical-marijuana business.) Even though it's on the banned list now, does anyone really think of marijuana as a performance-enhancing drug in the first place? After all, as Robin Williams later joked, "the only way it's a performance-enhancing drug is if there's a big f---ing Hershey bar at the end of the run," right? Maybe not. It turns out marijuana might actually help some people perform better at certain sports.
Bee Decline Could Cause Malnutrition In Developing Countries - According to a new study, residents of developing nations could soon be struggling with malnutrition fueled by the decline of pollinators around the world. The study, published this month in the journal PLOS ONE, looked at dietary surveys from women and children in parts of Zambia, Uganda, Mozambique, and Bangladesh. The researchers calculated what percentage of five nutrients — vitamin A, zinc, iron, folate, and calcium — in the women and children’s diets came from foods that are heavily dependent on pollinators (crops such as cocoa and Brazil nuts, for example, rely on bees for pollination). The researchers found that, under a scenario in which all pollinators were removed, up to 56 percent of the people in the areas looked at would be at risk of nutritional deficiencies. Those deficiencies can go far beyond simply not getting proper nutrition, the report notes: vitamin A deficiency causes 800,000 women and children to die every year, and has been found to roughly double the risk of death from measles, diarrhea, and malaria. “The take-home is: pollinator declines can really matter to human health, with quite scary numbers for vitamin A deficiencies, for example, which can lead to blindness and increase death rates for some diseases, including malaria,” Taylor Ricketts, a UVM scientists who co-authored the study, said in a statement.
Food Waste Delusions -- A couple months ago the New York Times convened a conference "Food for Tomorrow: Farm Better. Eat Better. Feed the World." Keynotes predictably included Mark Bittman and Michael Pollan. It featured many food movement activists, famous chefs, and a whole lot of journalists. Folks talked about how we need to farm more sustainably, waste less food, eat more healthfully and get policies in place that stop subsidizing unhealthy food and instead subsidize healthy food like broccoli. They rail against GMOs, large farms, processed foods, horrid conditions in confined livestock operations, and so on. They rally in favor of small local farms who grow food organically, free-range antibiotic free livestock, diversified farms, etc. These are yuppies who, like me, like to shop at Whole Foods and frequent farmers' markets. This has been a remarkably successful movement. Even Walmart is getting into the organic business, putting some competitive pressure on Whole Foods. (Shhhh! --organic isn't necessarily what people might think it is.) This is all great stuff for rich people like us. And, of course, profits. It's good for Bittman's and Pollan's book sales and speaking engagements. But is any of this really helping to change the way food is produced and consumed by the world's 99%? Is it making the world greener or more sustainable? Will any of it help to feed the world in the face of climate change? Um, no. Sadly, there were few experts in attendance that could shed scientific or pragmatic light on the issues. And not a single economist or true policy wonk in sight. Come on guys, couldn't you have at least invited Ezra Klein or Brad Plummer? These foodie journalists at least have some sense of incentives and policy. Better, of course, would be to have some real agricultural economists who actually know something about large-scale food production and policies around the world. Yeah, I know: BORING!
Groups Sue EPA Over Failure To Regulate Emissions From Factory Farms - Livestock make up a substantial percentage of global greenhouse gas emissions, and a group of environmental and animal welfare groups have had enough of what they say is inadequate Environmental Protection Agency oversight on those emissions. This week, a group of eight organizations, including the Humane Society of the United States, Center for Food Safety and the Sierra Club, filed two lawsuits against the EPA for not doing enough to control emissions from large Concentrated Animal Feeding Operations, or CAFOs. One lawsuit deals with ammonia pollution, and the other addresses methane and other air pollutants. The lawsuits say that the EPA hasn’t yet responded to petitions sent in 2009 and 2011 by some of the groups asking the agency to regulate emissions from CAFOs, a delay that one of the lawsuits calls “unreasonable.” The lawsuit also states that, by refusing to respond to the petitions, the EPA has continued with its business-as-usual approach to CAFO emissions, instead of implementing meaningful changes. “CAFOs degrade the environment,” the organizations write in the lawsuit tackling methane and other air pollutants. “Their emissions exacerbate climate change; impair air quality; lead to the formation of haze, fine particulate matter, and ozone; and contribute to the impairment of land and water resources, causing ‘dead zones’ in waterways and acidification of soil and waters. CAFO air pollution is nationally significant, noxious, and dangerous to public health and welfare, wildlife, and the environment.” For that reason, the groups say, the EPA needs to regulate the emissions. The petitions called on the agency to classify CAFOs as pollution sources under the Clean Air Act, and set emissions standards for existing CAFOs. The lawsuits call on the agency to respond to those petitions.
Worldwide field trials show that just one degree of warming could slash wheat yields by 42 million tonnes and cause devastating shortages of this vital staple food − Climate change threatens dramatic price fluctuations in the price of wheat and potential civil unrest because yields of one of the world’s most important staple foods are badly affected by temperature rise. An international consortium of scientists have been testing wheat crops in laboratory and field trials in many areas of the world in changing climate conditions and discovered that yields drop on average by six percent for every one degree Celsius rise in temperature. This represents 42 million tonnes of wheat lost − about a quarter of the current global wheat trade − for every degree. This would create serious shortages and cause price hikes of the kind that have previously caused food riots in developing countries after only one bad harvest.Global production of wheat was 701 million tonnes in 2012, but most of this is consumed locally. Global trade is much smaller, at 147 tonnes in 2013. If the predicted reduction of 42 million tonnes per 1 ˚C of temperature increase occurred, market shortages would cause price rises. Many developing countries, and the hungry poor within them, would not be able to afford wheat or bread. Since temperatures − on current projections by the Intergovernmental Panel on Climate Change − are expected to rise up to 5 ˚C this century in many wheat-growing regions, this could be catastrophic for global food supply.
In Corn Country We Have Two Choices. Let’s Pick the More Logical, Beautiful One. --K. Mcdonald -- In our current world of oversupply and low prices for agricultural commodities, it is time to consider a better way of farming in the Midwest. The pendulum has swung far enough in one direction, a direction that has focused on short term gains derived from mining the topsoil. Both farmers and consumers are frustrated with this broken, policy-induced model. We all feel helpless and we’re not especially proud of today’s production trends, whichever side of the fence we’re on. For the farmer, it’s the constant hamster on the wheel problem of spend more to make more, and then suffer of the resulting low prices from overproduction. For the consumer, it’s the concern over food quality, animal conditions, healthy diet, and environmental degradation. Crop prices have returned to below-input-cost levels. The taxpayer has grown weary of supporting farm policies that don’t make sense. Middle of the nation demographic trends are dismal. The world is over-supplied with too much grain, cotton, milk, you-name-the-commodity. The dollar is high which hurts our commodity exports. There is enough food, in fact, there is overproduction of everything. That’s a reason why we’ve started burning our crops in our gas tanks. But now, we’ve got too much oil and gas, too. We can’t even use the biofuel we’re producing so we’re trying to create export markets for it. And these policies have made farmland so expensive that the next generation can’t afford to begin to farm. In short, we’re in a mess of problems in farm country.In this special post, you will read one reader’s story about what is going on in the middle of corn country in central Minnesota. He’s a keen observer and he’s dismayed with what he’s seeing. Lucky for us, he’s also a good writer and photographer, and is able to show us a window into his world.
Biofuels: Wrong Direction for a Sustainable Food and Climate Future -- How does bioenergy contribute to a sustainable food and climate future? A new World Resources Institute paper finds bioenergy can play a modest role using wastes and other niche fuelstocks, but recommends against dedicating land to produce bioenergy. The lesson: do not grow food or grass crops for ethanol or diesel or cut down trees for electricity. Even modest quantities of bioenergy would greatly increase the global competition for land. People already use roughly three-quarters of the world’s vegetated land for crops, livestock grazing and wood harvests. The remaining land protects clean water, supports biodiversity and stores carbon in trees, shrubs and soils—a benefit increasingly important for tackling climate change. The competition for land is growing, even without more bioenergy, to meet likely demands for at least 70 percent more food, forage and wood.
Food diversity under siege from global warming, U.N. says - Climate change threatens the genetic diversity of the world's food supply, and saving crops and animals at risk will be crucial for preserving yields and adapting to wild weather patterns, a U.N. policy paper said on Monday. Certain wild crops - varieties not often cultivated by today's farmers - could prove more resilient to a warming planet than some popular crop breeds, the U.N. Food and Agriculture Organisation (FAO) said. But these wild strains are among those most threatened by climate change. true Ensuring food security and protecting at-risk species in the face of climate change is one of "the most daunting challenges facing humankind", the paper said. Between 16 and 22 percent of wild crop species may be in danger of extinction within the next 50 years, said the FAO paper. They include 61 percent of peanut species, 12 percent of potato species and 8 percent of cowpea species. "In a warmer world with harsher, more variable weather, plants and animals raised for food will need to have the biological capacity to adapt more quickly than ever before," "Preventing further losses of agricultural genetic resources and diverting more attention to studying them and their potential will boost humankind's ability to adapt to climate change." To improve the resilience of food systems, the paper recommends strengthening gene banks to include crops now considered "minor", a review of breeding practices, the creation of community seed banks, and improving seed exchanges between farmers in different regions.
Cold Nights Are Decreasing Across the U.S. -- It’s easy to think of global warming as something that happens at a steady pace everywhere. But that’s not the full story. It’s true that the global average temperature has been rising overall since modern record-keeping began, and it’s true that 2014 was the hottest year on record, but the rise hasn’t been perfectly steady. Each year isn’t always warmer than the one before, and some places — the Arctic, for example — have warmed faster than others. When you zoom in, even regions in the U.S. have warmed at different rates. Some seasons have warmed faster than others. And the pace of warming can even vary depending on the time of day. For example, a Climate Central analysis in 2013 showed that winter nights in the U.S. have warmed about 30 percent faster than nights over the entire year.Now we've done a new city-level analysis showing the trend in daily low temperatures below freezing. That is, for most of the country. In places where the temperature dips below freezing so rarely that it's hard to establish a trend at that cutoff, we used 40°F or 45°F. You can find your city in the dropdown menu above to see how cold nights have changed since 1970.
U.N. asks countries for climate plans after record warm 2014 (Reuters) - The United Nations asked governments on Thursday to submit plans to cut greenhouse gas emissions as the building blocks of a deal due in Paris in December to limit global warming, after scientists said 2014 was the hottest year on record. Governments have agreed an informal deadline of March 31 to submit plans as the basis of the U.N. deal to slow climate change, which nearly all climate scientists say is mainly due to rising emissions of man-made greenhouse gases. Christiana Figueres, head of the U.N. Climate Change Secretariat, said the meeting in Paris was a chance to get on track "towards a deep de-carbonisation of the global economy, achieving climate neutrality in the second half of the century". true The secretariat launched a website (here) to collect the national plans. Climate neutrality means net zero emissions, or that any emissions from burning fossil fuels are offset by measures such as planting trees that soak up carbon dioxide as they grow.
Climate change will hammer Iowa agriculture, manufacturing - Climate change could [will] hammer the Des Moines and Iowa economies in the decades ahead, as spiking temperatures dramatically reduce crop yields, increase energy costs for manufacturers and reduce worker productivity, according to a new report released Friday. The report's grim assessment for the state, designed to look at the business risks from climate change, is similarly gloomy for other Midwest states and their largest cities, including Chicago, St. Louis, Indianapolis and Minneapolis. Agriculture will be particularly hurt by climate change, it said, with corn, soybeans and wheat yields slashed as much as 85% by the next century in the leading farm states of Iowa, Illinois, Indiana and Missouri. Livestock also is expected to experience reduced productivity and other challenges. The study comes from the Risky Business Project, a group led by Michael Bloomberg, New York City's former mayor, former U.S. Treasurer Henry Paulson, and Tom Steyer, a former hedge fund manager-turned green political activist. It was released just a week after the federal government said that 2014 was the warmest on Earth, breaking previous records set in 2010 and 2005, and reinforcing scientific assessments that humans are causing global warming, and the influence is growing. The report said climate change would hit Iowa's economy the hardest among Midwestern states because of reduced crop yields. Iowa is the nation's largest grower of corn. By the end of the century, "the state could face likely declines in its signature corn crop of 18 to 77% — a huge hit for a corn industry worth nearly $10 billion," the report said. The farming impact would have a domino effect in Iowa because of its ties to manufacturing, insurance and other industries. READ: The full report
The Midwest’s climate future: Missouri becomes like Arizona, Chicago becomes like Texas - The bipartisan trio of climate risk prognosticators for the business community — Michael Bloomberg, former Treasury Secretary Hank Paulson, and billionaire investor Tom Steyer — are back. And this time, their Risky Business Project has produced a report focusing in particular on how a world of rising temperatures could threaten the Midwestern region of the U.S.: the Heartland. Perhaps the most striking finding? A higher prevalence of extremely hot temperatures could severely impact corn and wheat production, the report warns, unless we take serious evasive action. It cites a 1 in 20 chance of an 80% loss for these crops by 2100 – the extreme case. The more likely range for losses, says the document, is 11–69%. Here’s a figure from the report, whose scientific conclusions are based on research performed by a group of scientific and economic experts convened by the Rhodium Group (their more technical report is here): Kate Gordon, lead author of the new Risky Business report, and head of the energy and climate change program at Next Generation, explains that if Midwestern agriculture sustains such losses, food production may move north. “But for those people, in those states, that’s their economy, it’s a pretty severe impact,” she says.
Should tackling climate change trump protecting nature? - Does the need to mitigate the effects of man-made climate change override the need to protect nature? Climate change is with us, and is one of nine reasons why scientists are now concerned that the rate of environmental degradation is a threat to the future of human life on Earth. The loss of biodiversity, dubbed the Sixth Green Extinction by some, is another threat to humanity, with nearly half of the world’s amphibians and a fifth of its plants at risk of extinction. We do not have the luxury of choosing which of these nine challenges to tackle; they are all critical to our survival. Yet last week, here in West Dorset, the council unanimously approved the development of a 25MW solar farm on a Site of Special Scientific Interest (SSSI). Rampisham Down was designated as a SSSI because it is nationally important for wildlife. There are 70ha of heathland and nature-rich grassland, known as lowland acid grassland at Rampisham. Natural England estimate that there is only 5000ha of this lowland acid grassland type left in England. Rampisham is in the top ten largest surviving fragments in England. It is especially rich in grassland fungi, for which Britain has an international responsibility. It is also highly unusual in that the underlying chalk influences the plant communities, creating areas of the extremely rare habitat known as “chalk heath”.
Environmental Agencies Allocate Over $700M to Combat Toxic Algae Blooms in Great Lakes -- State and federal agencies are working to attack a problem that contributed to a water crisis in northwestern Ohio last year: too much phosphorus in the Great Lakes. An overabundance of phosphorus, due in part to fertilizer runoff, is one of the ingredients in the formation of algae blooms. It enables algae growth, which can contribute to fish die-offs and other environmental impacts, the U.S. Department of Agriculture (USDA) said. One of those impacts last year was the water crisis in the Toledo, Ohio, area, where residents were asked not to use the water for cooking, drinking or bathing. Indiana, Michigan and Ohio will work with the USDA through the Tri-State Lake Erie Basin Phosphorus Reduction Initiative to identity watersheds for phosphorus reduction and to help farmers with technical assistance in reducing phosphorus levels. Sunlight, calm water and higher temperatures are also needed to aid in the algae bloom formations. "Lake Erie, especially its western basin (and thus Toledo area), is very shallow given its great size and is the most sensitive among the Great Lakes to becoming exceptionally warm during summer heat waves,"
Flint’s Dirty Drinking Water Conundrum - Flint, Michigan is a city that was devastated by the decline of the American automobile industry, and it never really recovered. Twenty-six years on, things have only gotten worse. In the past few years, several news outlets have declared Flint “America’s Most Dangerous City” by virtue of its extremely high murder rate: there were 64.9 murders per 100,000 people in 2012. The following year, Flint’s population dropped below the 100,000 mark necessary to keep it in the running, so it no longer lays claim to that unfortunate title. But now it has a new distinction to be ashamed of. According to a memo from Michigan’s Department of Environmental Quality (PDF), Flint has been in violation of the Safe Drinking Water Act as of the fourth quarter of 2014, due to excessive levels of trihalomethane (a byproduct of chlorination) in the city’s drinking water. To save money, the City of Flint recently stopped procuring its water from Detroit’s Lake Huron—water that was cleaner, and so required less chlorine to kill any bacteria in it. The local Karegnondi Water Authority, of which Flint is a member, is scheduled to complete a pipeline to Lake Huron, enabling Flint residents to have access to cleaner water by 2016. But in the meantime, the city now gets its water from the notoriously dirty Flint River. While City Hall still maintains the new water is safe, it was required to mail a notice to residents stating that the elderly, infants, and anyone with a severely compromised immune system should seek medical advice regarding the water. According to the notice, the water could increase the risk of cancer if ingested for many years.
Brazil: Drastic Water Rationing May Be Put in Place in São Paulo - The worst drought to hit São Paulo, Brazil’s biggest city, in decades may leave many residents with water service only two days a week. São Paulo’s water utility company, Sabesp, says a five-days-off, two-days-on system would be a last-ditch effort to prevent the collapse of the Cantareira water system. The reservoir is the largest of six that provide water to about six million of the 20 million people living in the metropolitan area of São Paulo. The utility says Cantareira is now down to 5.1 percent of its capacity of 264 billion gallons. A utility official, Paulo Massato Yoshimoto, said Wednesday that “rationing could happen if rainfall does not increase in the reservoir area soon.” Details of how a rationing plan might be put in place were not released.
China's attempts to solve water crisis worsen the situation - Researchers say attempts to solve China’s water crisis − already worsening through population growth, a rampant economy and climate change – are having the opposite effect. A team of international researchers say that water stress is only partially mitigated by China’s current two-pronged approach: transferring water physically to regions that are short of it − for example, by the huge projects to transfer water from the south to the north of the country − and exporting the “virtual” water embodied in products traded domestically and internationally. China needs more water for energy, food and industry, for its rising population, and for its attempts to end poverty. But maintaining even current levels of provision is becoming increasingly difficult as climate change lives up to its dire reputation as a threat multiplier and endangers water and food supplies. Researchers have compiled the first full inventory of physical water transfers and virtual water redistribution via trade between China’s provinces. Their findings are published in the Proceedings of the National Academy of Sciences. They say the efforts to supply northern China are exacerbating water stress in its poorer water-exporting regions, with transfers of virtual water − defined as the total volume of water needed to produce and process a commodity or service − accounting for more than a third of the country’s national water supply.
Chinese geologists duped by Heartland Institute and junk science -- again! Heartland Institute finds route into U.S. science news conduit through China -- For global warming deniers, the latest outlet appears to be the Chinese publishing industry, and through that venue they arrive at the American Association for the Advancement of Science's (AAAS) portal for journalists. After that, a study popped up in a major global newspaper. The study appeared last week in the Science Bulletin, a journal of the Chinese Academy of Sciences (CAS), and was authored by well-known climate change deniers. The study -- not surprisingly -- challenges the basis of climate change models in use today and has been called flawed by numerous scientists. "We didn't even think of publishing in the West," said Christopher Monckton, a climate denier who is also the lead author on the study. "We decided the West is now no longer doing science, it is doing propaganda via the learned journals, so we weren't playing that game anymore."To make the study freely available to the public, Monckton turned to the Heartland Institute, a Chicago-based think tank made infamous in 2012 for its billboard ads on climate change featuring Unabomber Ted Kaczynski. The organization also promotes the tobacco industry. Heartland paid the journal a $3,000 open access fee. The journal's public information officer then submitted a press release, originally penned by Monckton, to EurekAlert, a platform run by AAAS that informs journalists of upcoming studies in over 1,900 journals. EurekAlert published the release, which was picked up by the United Kingdom's Daily Mail Online, which uncritically asked, "Is climate change really that dangerous?"
Shocking Images Of China's Dire Pollution Problem - China has some stunningly beautiful natural landscapes, but, as boredpanda.com explains, they may not count for much when, in other parts of the country, pollution runs totally unchecked. China is very close in size to the USA. Yet, as The Burning Platform notes, their population is the size of the entire Western Hemisphere, plus Japan, Germany, and France. The land can not support this mass of humanity without very dire consequences, and these shocking photos show what severe pollution people have to deal with in some parts of China...
US Senate refuses to accept humanity’s role in global climate change, again -- It is nearly 27 years now since a Nasa scientist testified before the US Senate that the agency was 99% certain that rising global temperatures were caused by the burning of fossil fuels. And the Senate still has not got it – based on the results of three symbolic climate change votes on Wednesday night. The Senate voted virtually unanimously that climate change is occurring and not, as some Republicans have said, a hoax – but it defeated two measures attributing its causes to human activity. Only one Senator, Roger Wicker, a Republican from Mississippi, voted against a resolution declaring climate change was real and not – as his fellow Republican, Jim Inhofe of Oklahoma once famous declared – a hoax. That measure passed 98 to one. But the Senate voted down two measures that attributed climate change to human activity – and that is far more important. Unless Senators are prepared to acknowledge the causes of climate change, it is likely they will remain unable and unwilling to do anything about it.
The US Senate finally admitted climate change is real. Now they need to act -- For some time, the US debate over climate change has been dominated by the question of whether it is happening at all, and only secondarily on its cause — whether it is man-made, or caused by some geophysical process we do not yet understand. But on January 21, there was a breakthrough of sorts. The US Senate voted overwhelmingly to approve a resolution saying, “It is the sense of the Senate that climate change is real and not a hoax.” While this sounds like progress, some US Democrats believe they were tricked into agreeing to a statement that means nothing. I think this is the wrong way to look at it. Whether climate change is man-made or a natural phenomenon is irrelevant to the issue of what to do about it. That is because even if it is 100 per cent man-made, we have left it too late to stop many of its effects in the coming decades. Real action to halt climate change would require a level of international cooperation that is inconceivable, and draconian intervention that would diminish standards of living in a way that is politically impossible in a democracy. Therefore, what is left are policies to limit the extent of the climate change we will see (in particular, exactly how many degrees warmer the atmosphere will get), and policies that can help the world cope with the consequences of climate change, especially rising sea levels, which are undeniable. Many parts of the US are extremely vulnerable to flooding and will require the building of massive infrastructure, such as sea walls, to prevent it. Some occupied areas will have to be evacuated and people prevented from building in flood-prone areas. This will cost a boatload of money. The obvious way to pay for it would be a tax on carbon. If implemented properly, it would essentially be a tax on consumption, the most economically efficient form of taxation according to every economist. Since the US lacks a broad-based national consumption tax, such a tax would not interfere with an existing tax regime.
Obama's Climate Plan Could Threaten U.S. Forests - President Obama’s signature environmental initiative, his Clean Power Plan, is designed to fight climate change and crack down on America’s carbon-emitting power plants. But behind the scenes, a dispute is raging over obscure language that could promote the rapid destruction of America’s carbon-storing forests. This highly technical but consequential fight over the Environmental Protection Agency’s approach to “bioenergy”—energy derived from trees, crops, or other plants—has gotten lost in the larger hubbub over the Obama plan’s impact on coal, and the potential upheaval in an electricity sector that will be forced to rein in its greenhouse-gas emissions for the first time. But while the overall plan was hailed by environmentalists and attacked by industry when it was unveiled in draft form last June, the EPA seems to be taking industry’s side on bioenergy. A November 19 EPA policy memo suggests that the administration intends to treat electricity produced from most forest and farm products as carbon-free. In an interview with POLITICO this week, an EPA official tried to walk back the memo, calling it a mere “snapshot in time,” emphasizing that no firm decisions will be made until the plan is finalized this summer. But in private meetings with advocates on both sides of the issue, the EPA has indicated that it intends to exempt most biomass from its carbon rules.? This would not be the first time Obama has disappointed conservationists, who are upset about his recent plan to allow some offshore drilling and his general “all-of-the-above” approach to energy, even while they celebrate his disdainful rhetoric about the Keystone pipeline, his new efforts to block drilling in the Arctic, and his continuing support for wind and solar power. But the arcane disagreement over biomass could have an outsized impact on the American landscape.
Inconvenient Uncertainties : THE headline in The New York Times yesterday was succinct. “By 2047, Coldest Years May Be Warmer Than Hottest in Past, Scientists Say.” Not, say, “around 2050” or “within our lifetime.” The specificity makes the crisis feel real, imminent and terrible. Call it a convenient truth. The story was about a new study published this week in the journal Nature that calculated that by 2047, the average temperature will be hotter across most parts of the planet than it had been at those locations in any year between 1860 and 2005. In truth, attention to the year 2047 is misguided. Climate around the world has already changed to a point where we can perceive humanity’s fingerprint. Extreme weather events like the two hurricanes that hit New York City in the past two years are going to be only more intense in the future. The study’s authors acknowledged the uncertainties, adding a margin of error of five years to the 2047 estimate. The date will occur at different times in different places, with the tropics being the most immediately vulnerable. Their caveats underscored the uncertainties inherent in making predictions about our climate future.
Climate change will hit Australia harder than rest of world, study shows -- Australia could be on track for a temperature rise of more than 5C by the end of the century, outstripping the rate of warming experienced by the rest of the world, unless drastic action is taken to slash greenhouse gas emissions, according to the most comprehensive analysis ever produced of the country’s future climate. The national science agency CSIRO and the Bureau of Meteorology have released the projections based on 40 global climate models, producing what they said was the most robust picture yet of how Australia’s climate would change. The report stated there was “very high confidence” that temperatures would rise across Australia throughout the century, with the average annual temperature set to be up to 1.3C warmer in 2030 compared with the average experienced between 1986 and 2005. Temperature projections for the end of the century depend on how deeply, if at all, greenhouse gas emissions are cut. The world is tracking at the higher emissions scenario, meaning a temperature increase of between 2.8C and 5.1C in Australia by 2090. According to the report, this “business-as-usual” approach to burning fossil fuels is set to cook Australia more than the rest of the world, which will average a temperature increase of 2.6C to 4.8C by 2090.
Climate change could impact the poor much more than previously thought -- It’s widely accepted that climate change will have bigger negative impacts on poorer countries than wealthy ones. However, a new economic modeling study finds that the economic impacts on these poorer countries could be much larger than previous estimates. As a result, they suggest that we should be aiming to limit global warming to near, or perhaps even less than the international target of 2°C. This conclusion is in sharp contrast to current economic models, which generally conclude that the economically optimal pathway results in a global surface warming around 3–3.5°C. Current economic models mainly treat economic growth as an external factor. In these models, global warming and its impacts via climate change don’t significantly affect the rate at which the economy grows. However, several economic studies have concluded that this is an inaccurate assumption, with a 2012 paper by Melissa Dell and colleagues taking the first stab at quantifying the effects of climate damages on economic growth. The new study calibrates the climate ‘damage functions’ in one of these economic models (DICE, developed by William Nordhaus at Yale) using the results from the Dell paper. They grouped the world into rich and poor countries, finding that while the economies of rich countries continue to grow well in a warmer world, the economic growth of poor countries is significantly impaired.
India's Modi calls for "paradigm shift" on climate -- Narendra Modi has called for “paradigm shift” in attitudes towards climate change, promising to back clean energy and energy efficiency measures. India’s prime minister said he wanted countries with the “greatest” solar energy potential to cooperate more closely to help reduce its costs and offer power to remote communities. “PM called on nations join hands with India for innovation & cutting-edge research,” he tweeted.. Modi made the comments after he had chaired the country’s high-level climate panel on Monday, the first time the body had met in over three years The 18-strong grouping includes environment minister Prakash Javadekar, UN climate science chief Rajendra Pachauri and external affairs minister Sushma Swaraj.Other members include finance minister Arun Jaitley, water resources minister Uma Bharati, agriculture minister Radha Mohan Singh and former climate negotiator Chandrasekhar Dasgupta. India is expected to agree to work more closely with the US on various low carbon issues when US president Barack Obama visits Delhi at the end of this week.
Obama & Modi Link Zero Carbon and Zero Extreme Poverty -At a news conference wrapping up President Obama's visit in India, Prime Minister Narendra Modi was asked whether he felt pressure from his guest to make a big pledge about tackling climate change, as China did a few months ago. "India is an independent country," he replied, "and there is no pressure on us from any country or any person." That might sound prickly, but what Modi said next might as well have come out of the mouth of Obama, a president who covets global warming progress as a jewel in his own crown. India is under the same pressure as the rest of the world to defuse the climate crisis, Modi continued. And that means finding a way to achieve a global agreement on how to address the problem, not shrugging it off as someone else's responsibility. "When we think about the future generations and what kind of world we are going to give them, then there is pressure," said Modi (through an interpreter). "Global warming is a huge pressure. And all those who think about a better life and a better world for the future generations...it is their duty and their conscience...to give a better lifestyle to the future generations, a good life and a good environment. There is pressure for all those people. There is pressure on all countries, on all governments, and on all peoples."
BREAKING: U.S. And India Announce ‘Cooperation’ On Climate Change -- President Obama and Indian Prime Minister Narendra Modi announced on Sunday that the two countries will work together to fight global climate change, laying out a set of goals that the two countries hope “will expand policy dialogues and technical work on clean energy and low greenhouse gas emissions technologies.” While not a concrete emissions reductions agreement like the one Obama reached with China this past November, the deal includes efforts to cooperate on reducing emissions of fluorinated gases, invigorate India’s promotion of clean energy investment, and partner to reduce the debilitating air pollution that has plagued many of India’s cities. The agreement also emphasized that the countries would “cooperate closely” for a “successful and ambitious” agreement at the Paris climate talks at the end of the year. During that conference, 196 nations are expected to meet and tentatively agree a course of action to respond to climate change. It is widely considered the last chance for a global agreement that could feasibly keep the rise in global average temperatures under 2°C.
Climate and population are linked — but maybe not the way you thought -- It’s not a topic that comes up in high-level international negotiations on climate change. Yet who would disagree that when individuals and couples use modern contraception to plan childbearing according to a schedule that suits them, they tend to have fewer children than they would otherwise? Could it be that this aspect of family planning, multiplied hundreds of millions of times, might lessen the severity of human-caused climate change and boost societies’ capacity to adapt to it? The Intergovernmental Panel on Climate Change, after all, recently noted that population and economic growth “continue to be the most important drivers of increases in CO2 emissions from fossil fuel combustion.” Not many analysts see “win-win” opportunities in reining in economic growth. Population growth, by contrast, might be slowed as a side effect of efforts that have multiple other benefits — such as education, empowerment of women, and the provision of reproductive health services including safe and effective contraception. And there’s reason to believe that slower population growth also makes societies more resilient to the impacts of climate change already upon us or on the way. This line of reasoning raises concerns among some groups that are active in climate change advocacy, who argue that linking family planning to climate change amounts to blaming parents of large families in developing countries for a phenomenon caused more by smaller but high-consuming families in industrialized countries. A more pragmatic worry may be the less-than-generous pie of international funding available to address climate change. Should family planning have precedence over renewable energy and direct efforts to adapt to climate change, when the needs are so great and the financial resources to address them are already insufficient?
How a group of conspiracy theorists could derail the debate over climate policy -As governments’ efforts to cut greenhouse-gas emissions continue to sputter, some researchers have discussed another possible tool for combating climate change: “geoengineering” the climate. One particular form of it, “solar geoengineering,” would involve reflecting sunlight away from the Earth to reduce future warming, possibly by deploying an army of mirrors or spraying the air with reflective aerosols that would function like a chemical sunscreen. But as it turns out, some people believe that a global campaign is already underway to have aircraft spray the air with chemicals — whether to control climate change or for other, more sinister purposes. Meet the “chemtrails” crowd, who posit that governments, scientists and other institutions are using airplanes’ “chemtrails” — basically contrails that are allegedly laced with chemicals — to alter the climate, create extreme weather, poison people, or even control our minds. The chemtrails movement has gained a small but passionate following on the Internet, with people across the ideological spectrum — from left-wingers worried about the environment to right-wingers concerned about abuses of government power. We don’t know the size of the community, but followers generally point to seeming irregularities in aircraft contrails as indisputable proof that illicit weather or climate modification is already happening, right now, and being used to control people and nations, especially poor ones. Chemtrails activist Dane Wigington, for instance, points to videos of an airplane spewing out multiple exhaust trails of different lengths, or airplanes spewing trails of different colors. “This amounts to weather warfare — period,” he charges.
The U.S. has caused more global warming than any other country. Here’s how the Earth will get its revenge. Last year, we learned what is probably the worst global warming news yet— that we may have irrevocably destabilized the massive ice sheet of West Antarctica, which contains the equivalent of nearly 11 feet of sea level rise. The rate of West Antarctic ice loss has been ominously increasing, and there are fears that if too much goes, the slow and long-term process of ice sheet disintegration could accelerate. Humans have a hard time conceiving of the incredible scale of an ice sheet, so the consequences of such a change can be lost upon us. But in a new paper in the Proceedings of the Institution of Civil Engineers — Forensic Engineering, researchers Ted Scambos of the National Snow and Ice Data Center in Boulder, Colo., and John Abraham of the University of St. Thomas in St. Paul, Minn. – summarize what we now know about West Antarctica. That includes a finding that may serve as a wake-up call for Americans in particular. Namely: If West Antarctica collapses entirely — a process that would likely play out over centuries, but that could substantially begin in this one – the expected 11 feet of sea level rise won’t just spread out evenly across the ocean. The United States will actually get a lot more sea level rise than many other parts of the world — possibly over 14 feet. Call it geophysical karma — we’re the nation most responsible for global warming and, at least in this particular case, we’ll get more of the consequences. In the event of a collapse of the West Antarctic ice sheet, scientists have determined that the United States will receive more sea level rise than almost any other part of the world.
The oceans are warming so fast, they keep breaking scientists' charts -- Wow, was this a bad year for those who deny the reality and the significance of human-induced climate change. Of course, there were the recent flurry of reports that 2014 surface temperatures had hit their hottest values ever recorded. The 2014 record was first called on this blog in December and the final results were reported as well, here. All of this happened in a year that the denialists told us would not be very hot. But those denialists are having a tough time now as they look around the planet for ANY evidence that climate change is not happening. The problem is, they’ve been striking out.And just recently, perhaps the most important bit of information came out about 2014 – how much the Earth actually warmed. What we find is that the warming is so great, NOAA literally has to remake its graphs. Let me explain this a bit.We tend to focus on the global temperature average which is the average of air temperatures near the ground (or at the sea surface). This past year, global air temperatures were record-breaking. But that isn’t the same as global warming. Global warming is properly viewed as the amount of heat contained within the Earth’s energy system. So, air temperatures may go up and down on any given year as energy moves to or from the air (primarily from the ocean). What we really want to know is, did the Earth’s energy go up or down? The trick to answering this question is to measure the change in energy of the oceans. A thorough review of ocean heat measurement methods is found here; we paid the requisite fee to make the paper open access. Anyone can download and read it. So what do the new data show? Well, it turns out that the energy stored within the ocean (which is 90% or more of the total “global warming” heat), increased significantly. A plot from NOAA is shown above. You can see that the last data point (the red curve), is, literally off the chart.
Sea level rise increase 3-fold in last 25 years -- rate of increase much larger than previously thought − Sea level rise for most of the 20th century may have been over-estimated by as much as 30%. But the less welcome news is that, if that’s the case, then sea levels since 1990 have started to accelerate more sharply than anyone had ever expected. Scientists at Harvard University, in the US, report in the journal Nature that they came to the conclusions after deciding that old data needed fresh analysis − using sophisticated mathematical filtering techniques for handling the uncertainties and gaps in such data. Estimating and accounting for global mean sea level (GMSL) rise is critical to characterising current and future human-induced changes. The catch is that sea level measurement hasn’t been going on for very long, so not all measurement techniques have been the same. In addition, reliable, systematic and sustained sets of data are relatively sparse. The term “sea level” sounds pretty basic, but the oceans are hardly ever level. Tides swell and ebb, regions of sea rise and fall according to temperature and salinity, and the shorelines at which researchers take measurements can also go up because of tectonic movement or sink because of the abstraction of groundwater. Measurements along some of the world’s great estuary systems can be skewed because of human interference over the decades with the flow downstream, and great tracts of ocean cannot be measured directly at all. The challenge, then, is to arrive at an average sea level rise for the whole planet.
Updated ice sheet model matches wild swings in past sea levels - It has been a bit of a head scratcher. Records of sea level during the last few million years tell us that there have been some warm periods where sea level may have been as much as 20 meters higher than it is today. When fed the conditions that prevailed at the time, however, our computer models of ice sheets haven’t been able to reproduce such a swelling of the ocean. The models can simulate that much sea level rise, but it requires temperatures much higher than were seen during those warm periods. Realistic losses of ice from Greenland and the fragile, western part of Antarctica (the West Antarctic Ice Sheet) could only provide something in the neighborhood of 3 to 10 meters of sea level rise. That leaves 10 to 17 meters for the East Antarctic Ice Sheet—the largest and most stable ice sheet—to chip in. Convincing the miserly East Antarctic Ice Sheet to be that generous with its contents isn’t easy, which is why the models required such high temperatures. So what are the models missing? Penn State’s David Pollard and Richard Alley, and University of Massachussetts, Amherst’s Robert DeConto had an idea for something to try. Two things to try, really. They added a pair of physical processes to an ice sheet model that weren’t simulated previously. The first was hydrofracturing. When water reaches the ice sheet from rain or ice melt at the surface, it fills crevasses in the ice. If they're filled to a great enough depth, the water pressure forces the crevasse to open even deeper—that's termed hydrofracturing. The other process results from the simple fact that a sheer cliff of ice can only be so tall before it collapses under its own weight—a condition not encountered in too many places today.
An Arctic ice cap’s shockingly rapid slide into the sea - For years, scientists have documented the rapid retreat of Arctic ice, from melting glaciers in Greenland to shrinking snow cover in far northern Eurasia. Now researchers have discovered one Arctic ice cap that appears to be literally sliding into the sea. Ice is disappearing at a truly astonishing rate in Austfonna, an expanse of frozen rock far north of the Arctic Circle in Norway’s Svalbard island chain. Just since 2012, a portion of the ice cap covering the island has thinned by a whopping 160 feet, according to an analysis of satellite measurements by a team led by researchers at Britain’s University of Leeds. Put another way, the ice cap’s vertical expanse dropped in two years by a distance equivalent to the height of a 16-story building. As another comparison, consider that scientists were recently alarmed to discover that one of Western Antarctica’s ice sheets was losing vertical height at a rate of 30 feet a year. “It is a very large signal,” “The ice cap has slumped out into the ocean with a substantial loss of ice.” McMillan and colleague Andrew Shepherd analyzed changes in Austfonna’s ice using data from satellites that measure, among other things, changes in elevation. They found that the gradual melting of the island’s 1,550-cubic-mile ice cap recently shifted into overdrive, for reasons that aren’t fully understood. Small ice caps like the one over Austfonna are believed to be more vulnerable to climate change-related thawing because relatively more surface area is exposed to the air and sea.
Press release: It is now 3 minutes to midnight - Warning that “the probability of global catastrophe is very high” unless quick action is taken, the Bulletin of Atomic Scientists Science and Security Board today cited unchecked climate change and global nuclear weapons modernization as the basis for their decision to move the hands of the historic Doomsday Clock forward two minutes. The shift of the Doomsday Clock hands to three minutes to midnight is the first such adjustment to be made in three years. The Board also outlined action steps that will need to be taken “very soon” in order to avert catastrophe. The full statement from the Bulletin of Atomic Scientists Science and Security Board -- in consultation with its Board of Sponsors that includes 17 Nobel Prize laureates -- is available online at http://thebulletin.org. The opening paragraph of the statement from the Board reads as follows: “In 2015, unchecked climate change, global nuclear weapons modernizations, and outsized nuclear weapons arsenals pose extraordinary and undeniable threats to the continued existence of humanity, and world leaders have failed to act with the speed or on the scale required to protect citizens from potential catastrophe. These failures of political leadership endanger every person on Earth.” The final paragraph of the statement from the Board warns: “In 2015, with the Clock hand moved forward to three minutes to midnight, the board feels compelled to add, with a sense of great urgency: ‘The probability of global catastrophe is very high, and the actions needed to reduce the risks of disaster must be taken very soon.’”
‘It is profitable to let the world go to hell’ --How depressed would you be if you had spent more than 40 years warning of an impending global catastrophe, only to be continually ignored even as you watch the disaster unfolding?So spare a thought for Jørgen Randers, who back in 1972 co-authored the seminal work Limits to Growth (pdf), which highlighted the devastating impacts of exponential economic and population growth on a planet with finite resources. As politicians and business leaders gather in Davos to look at ways to breathe new life into the global battle to address climate change, they would do well to listen to Randers’ sobering perspective. The professor of climate strategy at the Norwegian Business School has been pretty close to giving up his struggle to wake us up to our unsustainable ways, and in 2004 published a pessimistic update of his 1972 report showing the predictions made at the time are turning out to be largely accurate. What he cannot bear is how politicians of all persuasions have failed to act even as the scientific evidence of climate change mounts up, and as a result he has largely lost faith in the democratic process to handle complex issues. In a newly published paper in the Swedish magazine Extrakt he writes: It is cost-effective to postpone global climate action. It is profitable to let the world go to hell. I believe that the tyranny of the short term will prevail over the decades to come. As a result, a number of long-term problems will not be solved, even if they could have been, and even as they cause gradually increasing difficulties for all voters.
Transmission Line That Could Bring Wind And Solar Power To Millions In West Gets Go-Ahead -- On Saturday, the federal government approved a major renewable energy transmission line that could help open up the West to stranded solar and wind assets and enable up to 3,000 megawatts of renewable energy — enough to power over one million homes — to feed into the grid. The $2 billion project, overseen by SunZia, will span 515 miles across New Mexico and Arizona, and support more than 6,000 jobs during construction and more than 100 permanent jobs according to the Department of the Interior. The SunZia Southwest Transmission Project, which will tap wind resources in New Mexico and solar and geothermal in New Mexico and Arizona, was proposed in 2009. In 2013 it encountered serious pushback from Republican leaders in New Mexico who argued that the route could disrupt the country’s national security efforts. New Mexico Gov. Susana Martinez sent a letter to the DIO warning that the route could interfere with the Army’s White Sands Missile Range. She argued that a 45-mile stretch of the route interfered with a region where missiles were tested. The Bureau of Land Management addressed these concerns, and in working with the Department of Defense will now be burying three short segments of the transmission lines as they pass near the missile range. According to the DIO, the route also avoids major population centers, cultural sites, highways, and pipelines where possible. The project includes two parallel 500-kilovolt transmission lines and related facilities located on federal, state and private lands.
Al Gore: oil companies 'use our atmosphere as an open sewer' - In a recent private conversation, one of the world’s most senior industry leaders, who is considered to be at the more moderate end of the spectrum, insisted that we are going to burn all the world’s hydrocarbons despite the consequences. His reasoning is that a growing population in the developing world needs energy to raise living standards, that renewables will not become a dominant energy source till the end of the century and that politicians don’t have the courage or power to limit production. He acknowledged that the burning of all reserves would almost certainly lead to temperature rises of up to 4C, but argued the best way forward is to focus on limiting the damage through such technologies as carbon capture and storage. He’s hardly alone. In a shareholder letter in May, Shell wrote that – with energy demand growing – the world would need oil and gas for many decades to come and it doesn’t expect to have any stranded assets, or reserves that can’t be tapped. As the World Economic Forum’s annual meeting opens in Davos, Switzerland, I asked the former US vice president Al Gore and climate economist Lord Stern, two of the world’s most respected climate activists, to make sense of the arguments of those running the fossil fuel industry. The simple fact is that their opinions don’t make any sense, Gore told Guardian Sustainable Business. He remembers being astonished by the argument of one oil executive at Davos, who asked: “what good is it to save the earth if humanity suffers?”
US-India Nuke Deal A Big Win for Corporations - Real News Network (video & transcript) The nuclear agreement reached between the U.S. and India during President Obama's visit this weekend is being hailed as a historic breakthrough. It follows up on the 2006 nuclear deal between the two countries that was stalled on the issue of liability for U.S. corporations. That hurdle was cleared by eliminating the financial responsibility for U.S. companies in case of a disaster like what happened to Japan at Fukushima. Obama's visit also witnessed the bolstering of defense ties with Indian Prime Minister Narendra Modi. Now joining us from Northampton, Massachusetts, to discuss all this is Vijay Prashad. He is the George and Martha Kellner Chair in South Asian History and professor of international studies at Trinity College. His latest book is No Free Left: The Future of Indian Communism. He's also the chief editor at Left World Books.
Still No Solution to Storage of High-Level Radioactive Nuclear Waste - A private consortium formed to deal with Europe’s most difficult nuclear waste at a site in Britain’s beautiful Lake District has been sacked by the British government because not sufficient progress has been made in making it safe. It is the latest setback for an industry that claims nuclear power is the low-carbon answer to climate change, but has not yet found a safe resting place for radioactive rubbish it creates when nuclear fuel and machinery reaches the end of its life. Dealing with the waste stored at this one site at Sellafield—the largest of a dozen nuclear sites in Britain—already costs the UK taxpayer £2 billion a year, and it is expected to be at least as much as this every year for half a century. Hundreds of people are employed to prevent the radioactivity leaking or overheating to cause a nuclear disaster, and the cost of dealing with the waste at this site alone has already risen to £70 billion. This extraordinary legacy of dangerous radioactive waste is present in every country that has adopted nuclear power as a form of electricity production, as well as those with nuclear weapons. No country has yet solved the problem of how to deal with waste that remains dangerous to humans for thousands of years.
Obama to propose protecting U.S. Arctic wildlife refuge from drilling (Reuters) - President Barack Obama will call on Congress to expand protection of Alaska's Arctic refuge where oil and gas drilling is prohibited to 12 million acres (5 million hectares), an area that includes 1.4 million oil-rich acres along the coast. The proposal, unveiled by the Interior Department on Sunday, ran into instant criticism from Republicans and will likely face an uphill battle in Congress, where Republicans now control both chambers. The wilderness designation, the highest level of federal protection under which oil and gas drilling is banned, would be extended to a total of 19.8 million acres (8 million hectares) under the proposal, the Interior Department said. true The move was the latest salvo in the energy wars between Obama, a Democrat, and Republican lawmakers. Republicans kicked off the new Congress earlier this month with a bill to approve the Keystone XL pipeline to help move Canadian tar sands oil to refineries on the U.S. Gulf Coast. Obama immediately said he would veto the measure. U.S. Senator Lisa Murkowski of Alaska, Republican chair of the Senate Energy and Natural Resources Committee, called the Obama administration's proposal a politically motivated attack on Alaska. On Friday, she had introduced a bill that would have permitted oil production in the Arctic National Wildlife Refuge. "It's clear this administration does not care about us, and sees us as nothing but a territory. The promises made to us at statehood, and since then, mean absolutely nothing to them. I cannot understand why this administration is willing to negotiate with Iran, but not Alaska," Murkowski said in a statement on Sunday.
White House Proposes Protecting More Than 12 Million Acres Of Alaska’s Arctic Refuge -- President Obama is proposing to protect more than 12 million acres in Alaska’s Arctic National Wildlife Refuge (ANWR), protection that would prohibit oil and gas drilling, the White House announced Sunday. In plans unveiled by the Interior Department, the Obama administration is recommending that 12.28 million acres of ANWR be designated as “wilderness,” the highest level of protection that the government can award to a wild place. That area includes ANWR’s Coastal Plain, which according to the Energy Information Administration likely houses 5.7 billion barrels of technically recoverable oil. The U.S. Fish and Wildlife Service is also recommending that four rivers within ANWR’s boundaries — the Atigun, Kongakut, Marsh Fork Canning, and Hulahula Rivers — be included in the National Wild and Scenic Rivers System, a designation held by just 1/4 of 1 percent of the U.S.’s rivers. Obama said in the video that he’s “calling on Congress to make sure that they take it one step further, designating [ANWR] as a wilderness, so that we can make sure that this amazing wonder is preserved for future generations.” The Washington Post reports that once the federal government recommends that a place be designated a wilderness area, that place is given the highest level of protection until Congress or a future administration says otherwise. So though this announcement does grant ANWR some protection, only Congress has the ability to create a permanent wilderness area. And already, some members of Congress are lambasting the proposal.
Obama Blocks Oil and Natural Gas Drilling in Alaska’s Bristol Bay - WSJ: —President Barack Obama announced Tuesday he is indefinitely blocking oil and natural gas drilling in Alaska’s Bristol Bay, a move that drew cheers from wildlife groups and muted reaction from oil and gas proponents. In a video message posted online, Mr. Obama cited the environmental and economic benefits of Bristol Bay’s natural habitat, including how it provides 40% of the nation’s wild-caught seafood, as reasons why drilling shouldn’t be allowed. “It’s something that’s too precious for us just to be putting out to the highest bidder,” Mr. Obama said. The announcement comes just weeks before the administration intends to release its draft plan for what federal waters it proposes to open up to energy development. Tuesday’s announcement is relatively noncontroversial. There is no oil and gas drilling in the region, which spans about 32.5 million acres of federal waters in Southwestern Alaska. A portion of the region was leased in the mid-1980s. It was never developed due to litigation, according to the Obama administration, and because of souring public sentiment following the 1989 Exxon Valdez oil spill that occurred in a separate region of Alaska. Today, few if any companies have expressed interest in developing Bristol Bay.
This Federal Government Land Grab Would Permanently Lock Up Millions of Alaska Acres With Energy Potential --The Obama administration is calling on Congress to designate more than 12 million acres in Alaska as wilderness, including the coastal plain, barring economic activity and energy development. If Congress chose to act, it would be the largest wilderness designation since President Lyndon Johnson signed the Wilderness Act into law more than a half century ago. ANWR boasts massive energy potential. According to the U.S. Geologic Survey, an estimated 15-42 billion barrels of oil lie in ANWR’s 1002 Area, the Coastal Plain. The entire 1002 area represents 1.5 million acres out of more than 19.6 million. The Survey produced these estimations in 1998, where they said producers could extract 10.4 billion barrels–using 1990s drilling technologies–that lie beneath a few thousand acres with minimal environmental impact.Seventeen years later, the technologies have vastly improved. By opening ANWR we could truly find out Alaska’s energy potential. Importantly, the U.S. Geologic Survey also notes that “nearly 80 percent of the oil is thought to occur in the western part of the ANWR 1002 area, which is closest to existing infrastructure.” Oil produced in ANWR could relieve potential technological challenges Trans Alaska Pipeline System faces if the supply becomes too low.
Obama’s Trans-Alaska Oil Assault - WSJ: Washington’s energy debate has been focused on President Obama ’s endless opposition to the Keystone XL pipeline, but maybe that was only a warm-up. His new fossil fuel shutdown target is Alaska. President Obama announced Sunday that he’ll use his executive authority to designate 12 million acres in Alaska’s Arctic National Wildlife Refuge (ANWR) as wilderness, walling it off from resource development. This abrogates a 1980 deal in which Congress specifically set aside some of this acreage for future oil and gas exploration. It’s also a slap at the new Republican Congress, where Alaska Sen. Lisa Murkowski has been corralling bipartisan support for more Arctic drilling. The ANWR blockade also seems to be part of a larger strategy to starve the existing Trans-Alaska pipeline, the 800-mile system that carries oil south from state lands in Prudhoe Bay. ANWR occupies the land east of that pipeline. The Interior Department this week will release a five-year offshore drilling plan that puts vast parts of the Chukchi and Beaufort Seas—the area to the north of the pipeline—out of bounds for drilling. This follows an Administration move in 2010 to close down nearly half of the 23.5 million acre National Petroleum Reserve-Alaska (NPRA)—the area west of the pipeline. Federal agencies have also been playing rope-a-dope with companies attempting to drill on the few lands that are still available. ConocoPhillips has been waiting years for permits to access a lease it purchased in NPRA—and the Administration is this week expected to make that process even harder. Shell has spent $6 billion on plans to drill in the Chukchi and Beaufort, only to be stymied by regulators.
Obama to Propose Opening More Areas to Drilling - Obama administration is planning to propose opening up new areas of the nation's federally owned waters to oil and natural gas drilling, including areas along the Atlantic Coast, according to people familiar with the plan. The Interior Department is set to propose as soon as Tuesday its plan that will outline what leases the federal government will offer from 2017 to 2022, a step the government is required by law to take every five years. The plan is expected to come under increased scrutiny as low oil prices are testing the profit margins of energy companies and President Barack Obama is pursuing an aggressive climate-change agenda. Jessica Kershaw, an Interior Department spokeswoman, declined to comment Monday evening on the proposal. The plan is expected to include leases off states in the mid- and south-Atlantic coasts, including Virginia and both South and North Carolina, whose governors support offshore drilling. It isn't expected to include offshore Florida, whose policy makers have generally opposed such a move. The plan is also expected to block parts of the Beaufort and Chukchi seas off the coast of Alaska for future oil and gas development, according to Robert Dillon, a spokesman for Sen Lisa Murkowski (R., Alaska).
Obama Proposes Oil And Gas Drilling Along East Coast - On Tuesday, the Obama administration released a proposal to sell offshore oil and gas leases in new areas of federally owned waters, including regions along the Atlantic Coast from Virginia to Georgia. The announcement is part of the Department of Interior’s latest five-year plan, which includes federal leases from 2017 to 2022. Congressional bans on offshore drilling in the Atlantic ended in 2008 and Obama first pushed for Atlantic Coast leasing in 2010. Several weeks after announcing lease plans for south and mid-Atlantic drilling the Deepwater Horizon drilling rig blew up in the Gulf of Mexico, and also blew up these plans. Environmental groups see this revisiting of the plans as a case of “oil spill amnesia.” They argue that the technology or regulations have not advanced significantly in the five years since the Deepwater Horizon Spill, the fallout from which continues in economic recovery and prolonged legal battles over fines and compensation.. “When exploratory drilling was proposed off of North Carolina in the 1980s, the Exxon Valdez oil spill occurred and plans were shelved because we didn’t want that risk here. In 2010 after the BP Deepwater Horizon disaster in the Gulf, the Obama administration cancelled a lease sale off of Virginia because it was also too risky. That risk hasn’t changed.”
Don’t kid yourself, Obama very well might not allow any Atlantic Coast drilling - Right after the Obama administration announced a plan to block drilling in Alaska’s arctic wildlife refuge, it then rolled out a plan to open up parts of the southern Atlantic coast for oil and gas exploration. So a trade-off. What the White House took with one hand, it gave with the other. And what it gave seems pretty significant, opening up a new coastal region to drilling. But as Amy Harder of the Wall Street Journal explained on PBS last night, the swap may not be all it seems to be: Secretary Sally Jewell of the Interior Department stressed that this is the broadest plan that they’re going to consider. When it goes final in the next couple of years, they may whittle it down to something smaller than what they proposed today. … Even if there was drilling off the Atlantic Coast, executives say that wouldn’t happen until 2030. So I think the plan can only get narrower and given the president’s commitment to climate change, I wouldn’t be surprised if they ultimately took it out of the final plan, though at this point it’s far to early to say. Another reminder that Team Obama, while a huge beneficiary of America’s oil and gas boom, ultimately views that gift of American innovation as an unwelcome one.
Federal Coal Program Costing Taxpayers And States More Than $1 Billion Per Year In Lost Royalties - When it comes to paying for publicly-owned coal, the industry is getting a great deal. The American taxpayer, on the other hand, is being shorted not just by coal companies but by loopholes and generous subsidies on the part of the federal government, according to a new study released Wednesday. The report examines the federal coal leasing program managed by the Interior Department’s Bureau of Land Management (BLM), and the royalties collected by the agency. The analysis by Headwaters Economics, an independent research group based in Bozeman, Montana, found that the coal industry is paying an effective royalty rate of just 4.9 percent on the value of coal mined from public lands, most of it from Wyoming and Montana. That is well below the 12.5 percent royalty rate companies are supposed to pay under federal law for surface mined coal and the 8 percent royalty rate for underground coal. Lax regulation and loopholes in the program’s administration have cost the Treasury about $775 million between 2008 and 2012, according to the study. The analysis, “An Assessment of U.S. Federal Coal Royalties,” is the latest in a growing list of highly critical reports on the federal coal program by government watchdog agencies and private sector entities. It covers some of the same ground as a recent Center for American Progress report on measures that should be taken to close loopholes and reduce subsidies lavished on the coal industry by the Department of Interior. The CAP report detailed how two arms of the Interior Department, the BLM and the Office of Natural Resources Revenue (ONRR) “use their royalty-collection authority to subsidize coal production on federal lands” and how “coal companies, in turn, have learned to maximize these subsidies by shielding themselves from royalty payments through increasingly complex financial and legal mechanisms.”
Groups challenge ODNR authority to manage fracking chemical reporting - Today 40 Ohio community and environmental groups fired off a challenge to the Ohio Department of Natural Resources’ (ODNR) authority to manage chemical reporting and emergency response for the state’s oil and gas industry. The challenge, carried in a letter to U.S. EPA Administrator Gina McCarthy, is based on the fact that Ohio law appears to contradict federal law with respect to what agency should receive hazardous chemical information and also respond to chemical accidents and emergencies. The letter to US EPA seeks clarification of these federal requirements in order to forestall an oil and gas industry agenda in Ohio’s legislature to shift custody of the industry’s chemical use data from front-line emergency responders to the industry’s accommodating but unqualified supporters at ODNR. The federal Emergency Planning and Community Right-to-Know Act (EPCRA) states that authority to accept hazardous chemical information and respond to chemical accidents resides with the State Emergency Response Commission (SERC), as well as local emergency planning committees and fire departments. Indeed, every other chemical-intensive industry in the state reports to SERC and SERC coordinates and plans emergency response for them. Ohio law, however, carves out an exception for the oil and gas industry, diverting its hazardous chemical information and emergency response authority to ODNR. Furthermore, the group says that ODNR’s lack of expertise in emergency response puts public health and natural resources at risk.
Environmental groups complain to U.S. EPA about state fracking oversight - Columbus Dispatch - Dozens of environmental-advocacy groups are challenging the authority of the Ohio Department of Natural Resources to manage and respond to emergencies related to the oil and gas industry. The groups — including ProgressOhio, the Sierra Club and Ohio Citizen Action — sent a letter to U.S. Environmental Protection Agency Director Gina McCarthy today saying Ohio law contradicts federal reporting requirements for hazardous chemicals. Read the letter (PDF) The federal Emergency Planning and Community Right-to-Know Act was enacted almost 30 years ago to keep residents and emergency responders informed about the hazardous chemicals in their backyards. Congress passed the act in 1986 in direct response to a 1984 chemical leak in Bhopal, India, that killed more than 1,700 people. Under the act, companies must disclose the names of hazardous chemicals on each site as well as an estimate of the maximum amount of each chemical that was on the site in the previous year. They also must disclose how the chemicals are stored. The U.S. EPA oversees compliance, and the information that companies disclose must be made available to state emergency-response commissions, which then make that information available to the public and local emergency responders. In Ohio, the State Emergency Response Commission has been responsible for collecting that information for the past year or so. Before that, however, Natural Resources handled the information for the oil and gas industry. A bill introduced this past fall in the Statehouse would have brought control back under Natural Resources.
Director’s focus is improving parks Oil and gas safety and regulation, water quality on agenda - The Ohio Department of Resources is focusing its attention on improving state parks, oil and gas safety and regulation as well as the quality of the state’s water. “We were reappointed for another term,” James Zehringer, director of the Ohio Department of Natural Resources said. “We’re looking forward to carrying on the goals we’ve set, not only for 2015, but for the next four years.” The state offers 74 state parks to its residents in addition to nine lodges. Ohio is additionally one in seven states within the nation that offers free admission, and has done so since the parks’ beginning. The department hopes to set improvement projects relating to the state parks in motion within the next two years; the planned undertakings are currently within the bidding stages. “For the first time, we hired a project manager,” he said. “He’s going to make sure these projects are done on time and on budget, systematically too.” The department received $88.5 million to spend on state park updates, promotions and improvements, which include changes in the state parks infrastructure, improving shower houses and restrooms, maintaining lodging areas as well as providing additional necessities state parks may be in need of, such as playground equipment, splash pads, pools and camper and recreational vehicle pull through/turn-around areas and electricity. Zehringer said it was important that individuals are still able to utilize the parks as they are being constructed upon. Therefore, projects may be taken on in sections.
American Petroleum Institute says low prices bolster argument for low severance taxes - The oil and gas industry's top trade group hopes the recent downturn in prices and activity spurs Ohio Gov. John Kasich to lessen his severance tax proposal. Kasich is expected to unveil his budget plan next week, and might give an idea of what his severance tax plan is at a conference this afternoon. Legislators and the governor couldn't agree last session on a compromise – the industry was OK with 2.5 percent, but Kasich said that was too lenient. Oil and gas prices have fallen precipitously since then, causing some drillers in eastern Ohio to pull back investment for at least 2015. That means, says the American Petroleum Institute, that the governor should relent. "The notion that some of these officials want to raise taxes on the industry doesn't make sense," said API chief economist John Felmy. API and the state-focused Ohio Oil and Gas Association always have said high severance taxes could cause drillers here to move elsewhere. But low prices, they say, have bolstered their arguments. "Anytime you have a lower price regime you have a lot of projects that become uneconomical," Felmy said.
Marcellus horizontal well activity - The cutting back and laying off trend has made its way to the Marcellus Shale formation– all because of low energy prices. Across the state of Pennsylvania, counties have seen drops in rigs, permits, jobs and budgets. Lou D’ Amico, president and executive director of the Pennsylvania Independent Oil and Gas Association, states that the main cause there is so little drilling activity in Indiana County, Pennsylvania, is the low natural gas prices. The price of natural gas in 2008 was $14 per 1,000 cubic feet. This past December, prices were less than four dollars. According to an article by the Beaver County Times, PennEnergy Resources LLC stopped drilling new wells in October of 2014. The company has leases located in Beaver, Butler and Armstrong Counties in Pennsylvania. Along with a scaleback in operations, reporting requirements, health concerns and fracking policies are hot topics in the Marcellus shale. The Marcellus Shale Coalition is in a battle with environmental groups over whether or not the oil and gas industry should have to disclose the release of potential pollutants. The environmental groups are strongly pushing for the industry to be added to the Toxic Release Inventory list. The inventory is a public database that keeps records of certain emissions from facilities in specific areas. The following information is provided by the Ohio Department of Natural Resources for the week ending on January 17th. The data is pertaining to the Marcellus Shale activity occurring in the state of Ohio.
- DRILLED: 16
- DRILLING: 1
- PERMITTED: 15
- PRODUCING: 12
- TOTAL: 44
Fourty-four horizontal permits were issued during the week that ended Jan. 17, and twenty-nine wells were drilled in the Marcellus Shale.
Utica well activity | marcellus.com - Drilling doesn’t seem to be slowing down in the Utica Shale. Even with several companies scaling back on spending and rigs, the Utica is still going strong and continuing to provide jobs for Ohio. Over the past years, the unemployment rate in nine Ohio Counties and the entire state has decreased, all thanks to gas operations in the Utica. The counties included are Carroll, Columbiana, Harrison, Belmont, Guernsey, Noble, Jefferson, Mahoning and Trumball. The state of Ohio saw a 5.6 percent drop from 2010 to today. While having $22.5 billion invested in the oil and gas industry, the nine counties have truly benefited from it when it comes to jobs and unemployment. For the week ending on January 17th, drilling and the issuing of permits continued to grow, and the numbers prove it. The following information is provided by the Ohio Department of Natural Resources.
- DRILLED: 307
- DRILLING: 282
- PERMITTED: 466
- PRODUCING: 723
- TOTAL: 1,778
Nine horizontal permits were issued during the week that ended Jan. 17, and 43 rigs were operating in the Utica Shale.
West Virginia, Ohio visitors seek guidance in North Dakota - — Government and economic development leaders from West Virginia and Ohio are visiting northwestern North Dakota to see firsthand what it’s like to deal with an energy boom. The residents from Parkersburg and Vienna, West Virginia, and Belpre and Marietta, Ohio, hope to apply lessons from Minot and Williston to what the mid-Ohio Valley will experience if and when an anticipated ethane cracker plant is built there. Such plants convert ethane from shale oil and natural gas into chemicals used to produce plastics, fertilizer and other products. The 13 officials arrived in Minot on Sunday night and were touring and visiting with officials through Tuesday, the Minot Daily News reported. In Williston, the population has doubled since 2010 and the city’s physical size has tripled. In Minot, on the eastern edge of the patch, the population grew 12 percent between 2000 and 2010, most of it in the latter part of the decade. Minot City Engineer Lance Meyer told the visitors while discussing long-range infrastructure planning. Minot has identified nearly $815 million in needed water, sewer, transportation, airport, landfill, buildings and flood control projects through 2019, he said. Parkersburg Mayor Bob Newell said his region already is seeing growth due to fracking in the oil and gas fields just to the east of his community. That growth will increase significantly if the $4 billion petrochemical complex is built. The project is expected to create thousands of jobs during construction and hundreds when operating, as well as generate jobs in related and supporting businesses.
Bakken crude oil rolls over Ohio rails - Millions of gallons of some of the most volatile crude oil in North America are being transported on rail lines through Ohio each week, according to reports that the state had kept secret until this week. The railroad-company reports show that 45 million to 137 million gallons of Bakken crude oil come through Ohio each week from North Dakota oil fields on the way to East Coast refineries. Two million to 25 million gallons a week come through Franklin County alone. Bakken crude oil is desirable to oil and gas companies because it requires less refining than other shale oil to be turned into diesel fuel and gasoline. It also is highly flammable. Prompted by a 2013 train derailment and explosion that killed 47 people in Quebec and an explosion in Lynchburg, Va., last April, federal regulators began requiring railroads in May to report the average weekly number of trains carrying at least 1 million gallons of Bakken crude. Those reports are sent to state emergency-management agencies. The U.S. Department of Transportation has said the files don’t contain sensitive security details, prompting some states, including Virginia and Washington, to make the reports public. Despite requests from environmental groups, citizens and news outlets, including one from The Dispatch in July, Ohio would not release the reports, citing an exemption in the public-records law meant to prevent acts of terrorism.
Ohio reconsiders and discloses oil train records — More than a dozen trains loaded with over 1 million gallons of crude oil cross Ohio every week. Ohio officials released the information to The Associated Press Thursday after earlier refusing to disclose it. Federal transportation officials ordered the railroads last spring to notify states about trains carrying at least 1 million gallons of crude oil. CSX says it hauls 15 to 30 trains a week across some counties and only 1 to 5 trains a week in other places. Norfolk Southern transports 1 to 14 trains a week across 19 counties. Canadian Pacific hauls three trains a week across northwest Ohio. The crude oil trains are being scrutinized after several fiery derailments, including a July 2013 incident that killed 47 people in a small Canadian city in eastern Quebec.
Utica production soaring for Chesapeake - Chesapeake Energy reported lucrative production gains on its Utica shale properties today as part of its second-quarter earnings report. Oil and gas production rose 373 over the same time period last year, and 34 percent over the previous quarter, reports Shane Hoover of CantonRep.com. That sets Chesapeake’s production at around 67,000 barrels of oil equivalent per day, 60 percent of which was natural gas. 30 percent of this production was natural gas liquids, and the remaining 10 percent was oil. Chesapeake is by far the leading producer of energy in the Utica shale, operating 8 rigs and 48 wells in the region during the quarter. Overall, it owns 210 Utica wells in various stages of completion. The company earned $5.2 billion revenue in the quarter, up 10 percent from a year before. Utica shale production has amplified in recent months following raised production estimates and a rosy outlook for relaxed petroleum exports. Numerous companies, including PDC energy and former Chesapeake CEO Aubrey McClendon’s American Energy Partners, have recently announced expanded operations in the area.
Marcellus shale production hits record high - For the first time, natural gas production in the Marcellus shale has surpassed 15 billion cubic feet per day, the U.S. Energy Information Administration reported Tuesday. Even with July’s record-setting pace, EIA’s monthly Drilling Productivity Report estimates that production will increase by 247 million cubic feet per day this month. The EIA said “production from new wells is more than enough to offset the anticipated drop in production that results from existing well decline rates.” Production in the Marcellus since 2010 has steadily increased from 2 billion cubic feet per day, EIA reported. Marcellus now accounts for 40 percent of domestic shale gas production. The Haynesville shale region, which encompasses portions of east Texas, northwestern Louisiana and southern Arkansas, was second in daily production with 6.7 billion cubic feet per day, closely followed by the Eagle Ford region in Texas with 6.4 billion cubic feet per day. Rising Marcellus production has led to below-market prices in the Northeast, the EIA reported, citing prices in the Dominion South trading point in southwestern Pennsylvania. Production has exceeded demand for natural gas in the winter in Pennsylvania and West Virginia the last few years, but it is now anticipated to also meet demand in those two states as well as New York, New Jersey, Delaware, Maryland and Virginia.
Pipelines key to growth in shale industry - Natural gas producers struggling with prices that recently hit two-year lows are increasingly looking to pipeline builders for relief. They hope projects such as the Constitution Pipeline and Atlantic Sunrise being built by Tulsa-based Williams Cos. will ease a glut of gas in Appalachia by expanding how much fuel they can deliver to profitable markets. “The infrastructure we build is a key ingredient to bringing reliability and price stability to growing markets in the Northeast and along the Eastern seaboard,” said Ryan Savage, vice president and general manager for Williams’ northeast gathering and processing business based in Findlay. "The shale revolution has generated huge infrastructure demands as the appetite for natural gas continues to grow for home heating, electric-power generation and industry. Our job is building and operating pipelines that connect the best basins with the best markets, thus satisfying the needs of the producers and the consumers. Our focus is making these connections in a timely, safe and cost-effective manner. Our commitment to providing natural gas infrastructure remains consistent regardless of short-term fluctuations in natural gas prices. Last winter, when temperatures in New York City fell into the single digits, natural gas delivered in the city spiked to a record $123 per thousand cubic feet on the spot market. Not far away, in Pennsylvania’s Marcellus shale area, the price was about $4. This isn’t a supply problem; it’s an infrastructure problem. And that’s bad for consumers, especially during peak-demand periods in the winter. Williams is helping solve this problem with a multibillion-dollar pipeline expansion program."
Long-term solution for wastewater disposal eludes shale gas industry -- Defining wastewater disposal in the Marcellus shale fields has been a moving target. Drillers initially sent millions of gallons to public water treatment plants, until regulators said the plants were not equipped to properly clean the salt- and metal-laden water that comes from shale gas wells. The traditional method of injecting it back into deep wells is less feasible in Pennsylvania, which has few such wells, and Ohio is accepting less wastewater because of potential links between injection and earthquakes. The search for a solution has spawned an industry of companies and innovators looking for ways to treat or reuse the wastewater that environmentalists feared would foul drinking supplies. “They can barge all this water somewhere else or reuse it, which is what we're seeing now,” said Radisav Vidic, chair of the University of Pittsburgh's civil and environmental engineering program and a leading researcher on management of gas drilling waste. Recycling wastewater from hydraulic fracturing in shale gas production has become the norm in the Marcellus and Utica shale plays. About 90 percent of what comes out of wells goes into the next job, Vidic said. “What we call disposal is disposal to the generator. We find a home for it in the drilling fields,”
Pennsylvania DEP Sticks Head into Radioactive Sand And comes up glowing about fracking. A nice radioactive green. The Pennsylvania Department of Environmental Prevarication has released it’s study on radioactive matter produced by fracking. The TENORM study concluded among other things that:
- - There are potential radiological environmental impacts from fracking flowback spilled in streams at drilling sites, in landfills on roads etc. Radium should be added to the Pennsylvania spill protocol to ensure cleanups are “adequately characterized.” There are also site-specific circumstances and situations where the use of personal protective equipment by workers or other controls should be evaluated, given their potential exposure to radioactive frack wastes.
- - There are potential radiological environmental impacts that should be studied at all facilities in Pennsylvania that treat frack wastes to determine if any areas require remediation. If elevated radiological impacts are found, the development of radiological discharge limitations and spill policies should be considered.
- –Frack filter “cake” from facilities treating wastes could have a radiological environmental impact if spilled, dumped in barns, dropped on roads or buried and there is also a potential long-term disposal issue. TENORM disposal protocols should be reviewed to ensure the safety of very long-term disposal of waste containing TENORM.
- - Further study of radiological environmental impacts from the use of brine from the oil and gas industry for dust suppression, de-icing and road stabilization should be conducted.
- The mining, drilling and burning of fossil fuels produces more hazardous radioactive material than nuclear energy does.
Pennsylvania Fracking Companies Regularly Commit Serious Environmental Violations - Oil and gas companies in Pennsylvania seriously violate environmental rules and regulations, many of them more than once per day, on average. That, according to a report published Tuesday by Environment America, which compiled violation data for Pennsylvania fracking companies between January 1, 2011, and August 31, 2014. It found that the top 20 most frequently-violating companies broke the rules 1.5 times per day on average. “These violations are not ‘paperwork’ violations, but lapses that pose serious risks to workers, the environment and public health,” the report’s authors write. The violations include a 4,700-gallon hydrochloric acid spill that occurred at a Chief Oil & Gas drilling site in Bradford County, PA and that ended up flowing into a nearby creek and causing a fish spill. They also included instances of companies dumping fracking waste into streams and creeks, a practice that drilling company EQT Production was cited twice for in 2012, according to the report. The report also found 243 cases of fracking operations impacting drinking water due to well problems between December 2007 and August 2014. Environment America looked at the number of citations issued to fracking companies in Pennsylvania during that time period in order to gather its data, but the organization notes that the total number of violations committed by fracking companies is probably higher than the total number of citations. Environment America says in the report that this discrepancy is in part due to “Pennsylvania’s consistent pattern of conducting fewer inspections than state rules require, and because inspectors regularly decline to issue violation notices when companies voluntarily agree to fix problems.”
Report Shows How Fracking Industry's Failure to Follow Regulations Impacts Human Health - A new report out today from Environment America Research & Policy Center shows that all types of fracking companies, from small to large, are prone to violating rules intended to protect human health and the environment. The report, Fracking Failures: Oil and Gas Industry Environmental Violations in Pennsylvania and What They Mean for the U.S., analyses Pennsylvania’s oil and gas industry over a four-year period and found that the top offenders of regulations—averaging more than one environmental violation every day—represented a wide range of companies from Fortune 500 companies like Cabot Oil, to mom-and-pop operators, to firms like Chevron. “Fracking is an inherently risky, dirty, dangerous practice, and regulations can’t change that,” . “But this report shows that a range of oil and gas companies struggle to meet even modest protections for our environment and public health.” The report tracks lapses such as allowing toxic chemicals to leach into the air and water, endangering drinking water through improper well construction and dumping industrial waste into waterways. According to Environment America, fracking operators in Pennsylvania have committed thousands of violations of oil and gas regulations since 2011 with violations that are not “paperwork” violations, but lapses that pose serious risks to workers, the environment and public health
Washington County residents speak against gas drilling - Gas well drilling companies can’t be counted on to follow the raft of ordinance changes being proposed in Peters, claim a group of Washington County residents who imparted what they said were their experiences with Marcellus Shale drilling to council Monday. “This is a cautionary tale,” said JoAnne Wagner of Mount Pleasant Township, where the first Marcellus well was drilled 10 years ago. “Drillers not only take an inch, they take a mile. They will ignore your ordinances and do what they want to do.” Ms. Wagner said drillers in her township have built facilities without seeking permits — or even making local officials aware of their plans. She did not list specifics. She said she moved from Peters to Mount Pleasant in 2004, seeking a peaceful life in a country setting. “Little did I know it would be the worst nightmare of my life,” she told council. Ms. Wagner was among more than 100 residents who turned out Monday night for a public hearing into plans by Peters to revamp its shale drilling ordinance. Originally passed in 2011, parts of the ordinance were struck down by council last year after a 2013 Supreme Court ruling changed the drilling landscape for state and local officials.Saying it wouldn’t pass legal muster, council eliminated a drilling overlay district, which would have required a minimum of 40 acres for drilling activities.
Children Given Lifelong Ban on Talking About Fracking - Two young children in Pennsylvania were banned from talking about fracking for the rest of their lives under a gag order imposed under a settlement reached by their parents with a leading oil and gas company. The sweeping gag order was imposed under a $750,000 settlement between the Hallowich family and Range Resources Corp, a leading oil and gas driller. It provoked outrage on Monday among environmental campaigners and free speech advocates. The settlement, reached in 2011 but unsealed only last week, barred the Hallowichs’ son and daughter, who were then aged 10 and seven, from ever discussing fracking or the Marcellus Shale, a leading producer in America’s shale gas boom. The Hallowich family had earlier accused oil and gas companies of destroying their 10-acre farm in Mount Pleasant, Pennsylvania and putting their children’s health in danger. Their property was adjacent to major industrial operations: four gas wells, gas compressor stations, and a waste water pond, which the Hallowich family said contaminated their water supply and caused burning eyes, sore throats and headaches. Gag orders – on adults – are typical in settlements reached between oil and gas operators and residents in the heart of shale gas boom in Pennsylvania. But the company lawyer’s insistence on extending the lifetime gag order to the Hallowichs’ children gave even the judge pause, according to the court documents. The family gag order was a condition of the settlement. The couple told the court they agreed because they wanted to move to a new home away from the gas fields, and to raise their children in a safer environment. “We need to get the children out of there for their health and safety,” the children’s mother, Stephanie Hallowich, told the court.
Gas drilling watchdog group settles suit over terror listing — A gas drilling watchdog group that was characterized in Pennsylvania security bulletins as a potential terror threat has settled its lawsuit against the state, the group’s lawyer said Thursday. The settlement terms between Pennsylvania officials and the Gas Drilling Awareness Coalition were not immediately released. The gas drilling coalition’s lawsuit said the bulletins characterized the group as a possible threat to infrastructure without evidence. A private contractor, the Institute of Terrorism Research and Response, produced the reports under a one-year, $103,000 contract. Then-Gov. Ed Rendell later apologized for the monitoring of peaceful citizens’ groups, and his homeland security director resigned. Yet the coalition’s attorney, Paul Rossi, said Thursday he has evidence that improper monitoring of citizen groups is still happening within state government. “This has to stop,” he said. “State officials ought to … understand they can’t do this, in any form whatsoever.” The security bulletins were issued several times a week and sent to hundreds of people, most of them in law enforcement and private industry. State police have said the bulletins included information taken out of context, some of the analysis was biased and their internal analysis concluded there was no threat to public safety.
Shale development slowing due to market prices - Preparing for a slump in natural gas prices, which nosedived in December, a Findlay Township-based shale development company has halted drilling new wells for five months in Butler and Armstrong counties. The company, PennEnergy Resources LLC, has braced itself for reduced profits, which it expected, and it is now waiting for prices to rise from a point that hasn’t been this low in more than two years. PennEnergy decided to halt drilling new wells around October, said Greg Muse, company president and chief operating officer. Reduced market prices mean hydraulic-fracturing companies are not fracking as many wells, water haulers have reduced runs, and lower revenues are translating to reduced payouts for leaseholders, said Matt Henderson, who recently worked for Pennsylvania State University’s Marcellus Center for Outreach and Research in State College. Henderson was helping with community education, oil and shale gas research and economic development, and he said several factors can curb those effects for leaseholders. Checks to property owners can take 60 to 90 days to be received, so the delay the drop in prices might take longer to affect them. For businesses, futures contracts can lock in prices, and companies can choke back on production so they aren’t hit as hard.
Pennsylvania’s New Governor Will Ban Fracking In State Parks And Forests -- Pennsylvania’s new Governor Tom Wolf will sign an executive order Thursday banning the practice of hydraulic fracturing, or fracking, in state parks and forests, the Associated Press reports. The order will reverse a policy implemented in 2014 by notoriously fracking-friendly former Gov. Tom Corbett, which opened up state parks and forests to the controversial well stimulation technique. Wolf — who was sworn in as governor less than two weeks ago — had promised in his campaign to reverse that decision. . According to NPR, approximately 385,400 acres of state land has already been leased to drillers, and another 290,000 acres where the state does not own the mineral rights are currently under development. The ban on fracking in state parks and forests is a huge deal for Pennsylvania, both for the pro-fracking crowd and environmentalists. Pennsylvania’s fracking boom has fueled its economy for years, but the state has also seen its fair share of environmental problems, including 243 cases of contaminated private drinking water wells across 22 counties. Because approximately two thirds of Pennsylvania’s state forests sit atop Marcellus Shale natural gas deposits, proponents saw opening up the land as an unprecedented economic opportunity, while opponents saw the potential destruction of some of the state’s most treasured natural beauty.
Wolf Gets Cake and Eats it Too - Via an executive order, Governor Tom Wolf issued an executive order #2015-03 which on first glance appears to stop all drilling on state lands and forests. To those who have broken out the champagne and are toasting the Governor’s actions you may want to put the cork back into the bottle and read the actual executive order. Executive Order 2015-03 – Leasing of State Forest and State Park Land for Oil and Gas Development There are two important items in the Executive order: The first is in the “whereas”: WHEREAS, DCNR has concluded that additional leasing of State Forest land or State Park land for oil and gas development would jeopardize DCNR’s ability to fulfill its legislative duty to conserve and maintain these public natural resources, and to sustain its FSC forest certification; Key Words: ADDITIONAL LEASING Wolf’s executive order does not apply to EXISTING DCNR leases only ADDITIONAL (i.e. future) leases. According to a DCNR powerpoint: Impacts of Leasing Additional State Forest for Natural Gas Development, approximately 700,000 acres of state forest land have been leased or severed. Severed lands are not available to leasing by DCNR, these are areas which are held by private owners who own the subsurface rights. See maps below.
Chevron Slashes 23% Of PA Workforce As US Rig Count Collapses To June 2010 Lows -- For the 8th week in a row (something that hasn't happened since June 2009), US total rig count plunged. This week's 90 rig drop to 1543 is the largest so far (with oil rigs down 94 to 1223 - lowest since Jan 2013). The total rig count is now down 20% in the last 8 weeks to the lowest since June 2010 as it tracks the 4-month lagged oil price perfectly. This is the 2nd biggest 8-week drop in 22 years. This - rather unsurprisingly - has led Chevron to decide to cut 23% of its Pennsylvania workforce "due to activity levels." Obviously for oil prices to eventutally stabilize, production will have to slow and rig counts plunge further.. and so will jobs...
The false promise of fracking and local jobs -- During the past five years, I’ve researched and written about the economic impacts of fracking and, as a long-time resident of New York, I have observed its fractious politics. What I’ve found is that most people, including politicians and people in the media, assume that fracking creates thousands of good jobs. But opening the door to fracking doesn’t lead to the across-the-board economic boon most people assume. We need to consider where oil and gas industry jobs are created and who benefits from the considerable investments that make shale development possible. A look at the job numbers gives us a much better idea of what kind of economic boost comes with fracking, how its economic benefits are distributed and why both can be easily misunderstood. Not a recession buster Pennsylvania is one of the centers of dispute over fracking job numbers. In Pennsylvania, the job numbers initially used by the media to describe the economic impact of fracking were predictions from models developed by oil and gas industry affiliates. For example, a Marcellus Shale Coalition press release in 2010 claimed: “The safe and steady development of clean-burning natural gas in Pennsylvania’s portion of the Marcellus Shale has the potential to create an additional 212,000 new jobs over the next 10 years on top of the thousands already being generated all across the Commonwealth.” These job projections spurred enthusiasm for fracking in Pennsylvania and gave many people the impression that oil and gas industry employment would lead Pennsylvania quickly out of the recession. That didn’t happen. Pennsylvania’s unemployment roughly tracked the national average throughout the state’s gas boom. While some counties benefited from the fracking build-up, which occurred during the “great recession,” the state economy didn’t perform appreciably better than the national economy.
Natural gas prices hit an all-time low -- Trailing a momentary price increase during November, natural gas has hit its lowest prices since September 2012, reflecting solid domestic production and inventory builds. According to the U.S. Energy Information Administration (EIA), “Prices remained elevated through the spring and early summer of 2014, but dropped as domestic production continued to set new records and inventory rebuilds remained strong.” This winter, the heating season started with below average temperatures in November. The national benchmark Henry Hub rose to the mid-$4/MMBtu range, which could have been due to supply concerns and the expectation of another freezing winter. The week ending on November 21, 2014, inventory levels dropped by 162 billion cubic feet (Bcf), “tying the largest weekly November withdrawal on record.” Since that week, smaller-than-average withdrawals for this winter have brought stock levels above where they were a year ago and closer to average levels from five years ago. Over recent weeks, natural gas prices have dropped to the lowest levels in over two years. Day-ahead Henry Hub prices fell to $2.97/MMBtu on December 23, 2014, which is the first time prices were below $3 in over two years. Since the end of December, spot and future prices have lingered around the $3 mark and on January 26th closed at $2.92 and $2.88. Reported by the EIA, “Preliminary data sources show increased natural gas production through early winter, with production rebounding quickly from freeze-offs in November and early January.”
Natural Gas Well Production Ranges Widely - - A single Antero Resources well in Tyler County produced 1.4 billion cubic feet of natural gas in 2013, while in Brooke County a well operated by Chesapeake Energy yielded only 111 million cubic feet. The "Timmy Minch" Chesapeake Energy well in Ohio County - from which the Wheeling Park Commission and city of Wheeling draw royalties - supplied 391 million cubic feet of gas, and it also pumped 36,099 barrels of oil in 2013, according to West Virginia Department of Environmental Protection information. Although there are now hundreds of Marcellus and Utica shale wells producing oil and natural gas throughout the Northern Panhandle, the amounts those wells yield - as well as the chemical makeup of their production - can differ significantly. "There are a lot of factors that go into it," said Tim Greene, owner of Land and Mineral Management of Appalachia and a former DEP Office of Oil and Gas inspector. "Are they producing it wide open? Is someone better at fracking than someone else? Is the geology of the shale different in certain areas?" When referring to "wide open," Greene means whether a driller is actively squeezing as much gas out of a single well as possible in as short a period of time as possible. Some companies do not do this because they want the well to produce over a longer period. Greene also said some companies may choose to shut down certain wells periodically if the selling prices for natural gas and oil drop too low for it to make economic sense. Multiple drillers are now slowing down operations amid oil priced at about $47 per barrel and natural gas at about $3 per 1,000-cubic-foot unit.
Companies bid millions to drill under state lands in W.Va. - — West Virginia officials have opened millions of dollars in bids to drill for oil and natural gas beneath state-owned lands, including waterways and a wildlife management area. In one of the biggest offers the state Department of Commerce opened Friday, Jay-Bee Production Company bid amounts ranging from $5,000 to about $16,300 to drill underneath 303 acres of Jug Wildlife Management Area in Tyler County, or about $4.5 million total. The leases for Marcellus and Utica shale mineral rights, which allow for hydraulic fracturing, commonly called fracking, are a new undertaking for the state. So far, only one lease agreement has been finalized — a $6.2 million deal letting Antero drill below 518 acres at the Conaway Run Wildlife Management Area in Tyler County, said Department of Commerce spokeswoman Chelsea Ruby.
Drillers bid millions for oil, gas beneath West Virginia public lands | TribLIVE: — West Virginia officials have opened millions of dollars in bids to drill for oil and natural gas beneath state-owned lands, including waterways and a wildlife management area. One of the biggest offers the state Department of Commerce opened Friday would let Antero Resources Inc. drill underneath 283 acres of Jug Wildlife Management Area in Tyler County for $2.3 million, plus royalties. The leases for Marcellus and Utica shale mineral rights, which allow for hydraulic fracturing, commonly called fracking, are a new undertaking for the state. Only one lease agreement has been finalized: a $6.2 million deal letting Antero drill below 518 acres at the Conaway Run Wildlife Management Area in Tyler County, said Department of Commerce spokeswoman Chelsea Ruby. On Friday, several other bids were submitted:
- • Jay-Bee Production Co. bid amounts ranging from $5,000 to about $16,300 per acre for various tracts of the Jug wildlife land.
- • Noble Energy offered about $685,000 total to drill beneath 134 acres of Fish Creek and adjacent land in Marshall County.
- • StatOil USA Onshore Properties Inc. bid $9,000 per acre to drill under a 2-mile section of the Ohio River in Wetzel County.
Pipeline Explodes In West Virginia, Sends Fireball Shooting Hundreds Of Feet In The Air- A gas pipeline in Brooke County, West Virginia exploded into a ball of flames on Monday morning, marking the fourth major mishap at a U.S. pipeline this month. No one was hurt in the explosion, but residents told the local WTRF 7 news station that they could see a massive fireball shooting hundreds of feet into the air. An emergency dispatcher reportedly told the Pittsburgh Tribune-Review that the flames had melted the siding off one home and damaged at least one power line. The gas pipeline is owned by Houston, Texas-based The Enterprise Products, L.P., which said Monday evening that it is investigating the cause of the explosion. The West Virginia explosion is the fourth in a string of news-making pipeline incidents this month. Earlier this month, a gas pipeline in Mississippi operated by GulfSouth Pipeline exploded, rattling residents’ windows and causing a smoke plume large enough to register on National Weather Service radar screens. On Jan. 17, a pipeline owned by Bridger Pipeline LLC in Montana spilled up to 50,000 gallons of crude oil into the Yellowstone River, a spill that left thousands of Montanans without drinkable tap water. Just a few days later, on Jan. 22, it was discovered that 3 million gallons of saltwater drilling waste had spilled from a North Dakota pipeline earlier in the month. That spill was widely deemed the state’s largest contaminant release into the environment since the North Dakota oil boom began. Here’s some footage of Monday’s explosion’s resulting fire, via WTRF 7:
Boom goes the pipeline, again - On Monday morning another gas pipeline exploded, marking the fourth extreme accident involving a U.S. pipeline just this month. The gas pipeline in Brooke County, West Virginia, is owned by Enterprise Products LP. Several eye witnesses stated all they could see was a massive fireball rocketing hundreds of feet in the air. One witness told emergency dispatchers that the explosion melted siding off of one home and damaged at least one power line. Enterprise Products is conducting an investigation to find the cause of the explosion. This explosion is the fourth pipeline incident that has made headlines this month. Earlier in the month, a gas pipeline in Mississippi operated by GulfSouth Pipeline burst into flames, causing a smoke plume so large it registered on National Weather Service radar screens. On January 17th, a pipeline owned by Bridger Pipeline LLC in Montana spilled an estimated 30,000 gallons of crude oil into the Yellowstone River. The spill left thousands of people living in Montana without consumable tap water. Days later, three million gallons of saltwater drilling waste spilled from a North Dakota pipeline. The spill was deemed North Dakota’s largest pollutant release into the environment since the beginning of the oil boom. Below is footage from the pipeline explosion in Brooke County:
Science, courage behind high-volume fracking ban: According to a statistical evaluation of the peer-reviewed literature by Physicians Scientists & Engineers for Healthy Energy, there were only six peer-reviewed papers on the effects of shale gas development in 2009 — the year that high-volume fracking first became an issue for many New Yorkers. Six more studies were published in 2010. Although anecdotal and media reports of negative effects were plentiful, the science lagged, as is often the case, especially when hindered by secrecy and non-disclosure agreements accompanying the oil and gas industry. By the beginning of 2012, when the state's three outside reviewers began their analyses, there were 44 peer-reviewed papers. By the time they finished, at the start of 2013, there were just over 100, and the signs of harm were piling up. Between the start of 2013 and the end of 2014, and before the outside reviewers wrote their series of letters, however, the science on high-volume fracking came down like an avalanche: Nearly 300 more peer-reviewed papers were published for a total of about 400. What do these peer-reviewed papers show? Overwhelmingly, they revealed risks and adverse effects, giving a fuller picture of the harm and making a strong case that high-volume fracking is not safe. On its own, the science is powerful. But what's so special in New York is the well-informed citizens' movement that had its ear to the track of the science, followed the emergence of the data, and helped carry its message to political leaders. The appetite of the citizenry for scientific knowledge was voracious; they wove this science into their tens of thousands of public comments and other communications with Albany.
Pipelines Prompt Discussion Of Property Rights Law -- Meanwhile, pipeline opponents and some property rights advocates have found common ground in the campaign to repeal or modify the 2004 law. They say pipeline companies should not have access to private property until granted the certificate from FERC that greenlights pipeline construction and the use of eminent domain. The constitutionality of the 2004 law is being challenged by legal action filed in federal and state court. The litigation notes that the Virginia Constitution was amended in 2012 to strengthen the private property rights of Virginians. The amendment holds that the General Assembly “shall pass no law whereby private property, the right to which is fundamental, shall be damaged or taken except for public use.” But the amendment also describes exceptions: “A public service company, public service corporation, or railroad exercises the power of eminent domain for public use when such exercise is for the authorized provision of utility, common carrier, or railroad services.” The office of Attorney General Mark Herring filed a response this week to the federal lawsuit challenging the law. The response contends the law is not unconstitutional. Atlantic Coast Pipeline has asked state courts to support the company’s right to enter private property for surveying without an owner’s consent. A related motion states that if Atlantic Coast Pipeline “is unable to immediately enter the property … timely construction of the project will be jeopardized and the public interest in expanding natural gas transmission capabilities will be negatively affected.”
Keep toxic byproducts out of state - -- One of the most significant problems of fracking is disposal of the flowback fluids. Since millions of gallons of water mixed with chemicals are needed per well, and since a portion of this mixture is returned to the surface along with the natural gas, there is the issue of where and how to dispose of these fluids. Pennsylvania's contaminated water produced in a year exceeds the current supply of its disposal sites, which means sites outside of the state must be found. Much of Pennsylvania's contaminated water is trucked to injection wells in neighboring Ohio. However, Ohio is at capacity to handle wastewater from Pennsylvania, so disposal of toxic waste from Pennsylvania is transported via barges on the Mississippi River to sites in Gulf Coast states. Meanwhile, tailings and toxic sludge byproducts from Pennsylvania are being transported to upstate New York. The environmental group Riverkeeper, through the Freedom of Information Act, discovered that six landfills in western New York are accepting hazardous waste from Pennsylvania's fracking operations. Riverkeeper also found at least 29 municipalities in seven counties in western New York have been authorized by the state to use toxic fracking brine on local roads. The implications could be significant for these upstate municipalities, most of whom rely on tourism, wine production, and recreation. What is the logic in permitting Pennsylvania's toxic byproducts to cross the border? What safeguards are in place to ensure the health and safety of the local population and the environment?
Russkis Back Pseudo Fractavists ? - In an ill-advised attempt to stop fracking. Still groping for ways to rationalize New York’s frack ban, a right wing blog, ““The Washington Free Beacon”, which is indeed free, but not such a beacon, reports that five US environmental NGOs have received donations from a charitable foundation that may or may not have received funds, indirectly, from Russian oil companies, maybe. Or at least those are the allegations. Other than be factually incorrect on some major points, the problem with this story is that it seeks to tie the anti-fracking movement to the Kremlin, which is not how the grass roots anti-fracking movement evolved. And, more glaringly, it purports to trace the money to four US NGOs that were either pro-fracking or actively promoted “safe fracking.” Only one of the five groups supposedly funded by the Russians has been consistently anti-fracking. Two of the groups helped crater the local control initiative in Colorado last year. One of the groups has Ed Cox on its board. I kid you not. If the Russians wanted to stop fracking in the US, they backed the wrong horses. They’d be better off sending the money to me. Let’s talk Ivan. Make me a fracking offer I can’t refuse. Preferably in dollars or Swiss francs, not rubles. These conspiracy theories do not not make much economic sense. Most of the fracking done in the US has been for gas. High cost US fracked gas is not an economically viable threat to Russia or the Mideast on selling gas to Europe or China. The way competing oil exporting countries compete for market share is by doing the limbo on pricing – with the lowest cost producers keeping market share. High cost fracked shale oil cannot compete with conventional lower cost resources.
New England Growing More Dependent On Natural Gas - New England may avoid a spike in natural gas prices this winter, but the region is becoming increasingly dependent on the fuel, ensuring that price spikes in future years are not out of the question.A year ago, the polar vortex brought several bouts of low temperatures and heavy snow to the northeast, causing demand for heating and electricity to jump. Temporary shortages in natural gas flows due to pipeline constraints led spot prices to shoot up. Prices at Algonquin Citygate, a marker for the Boston area, hit an all-time high of $77.595 per million Btu (MMBtu) on January 23, 2014. Thus far, this winter has been milder, and record levels of natural gas production in 2014 have restored inventories, lowering the chance of a repeat in price spikes.And in the short-term at least, there is another reason that New England likely won’t see the dramatic price spikes this winter: more imported liquefied natural gas (LNG). LNG prices are correlated with the price of oil, so the collapse in oil prices have pushed down LNG prices as well. This has made LNG imports much more attractive for the eastern seaboard. In the first three weeks of 2015, two LNG terminals in New England along with the Cove Point terminal in Maryland have together imported more than three and a half times the volume of LNG that was imported during the same period a year ago.
Illinois misses the fracking boom because of falling oil prices - Lyle Weber paid off a sizable chunk of his son’s college loan three years ago with money he got from an oil company intending to drill on his farmland. Weber and thousands of downstate landowners are now watching as those leases begin to expire with dwindling hopes they’ll be renewed. Low oil prices have accomplished in Illinois what environmentalists couldn’t. Horizontal hydraulic fracturing, a controversial method of drilling for oil trapped in shale rock, has been halted even before it began. Officials at the state Department of Natural Resources say not a single company has applied for a fracking permit. That’s because oil prices have tanked. Oil was fetching about $100 a barrel in the U.S. when then-Gov. Pat Quinn signed a law in June 2013 to regulate fracking. By the time the permitting process was in place in November 2014, oil prices were dropping rapidly, ironically a byproduct of fracking’s success in the U.S. Today oil is selling for under $50 a barrel, half of what it was priced at when Illinois dreamed of an oil boom that would help solve its budgetary woes and bring much-needed jobs and revenues to the southern part of the state. Seth Whitehead, Illinois field director for Energy in Depth, a public relations arm of the Independent Petroleum Association of America, said Illinois would have fared better had some fracking wells been drilled. “The shale play is unproven,” Whitehead said, referring to a geological formation that contains oil or natural gas deposits. “If there were wells in production by now, we’d be in much better shape. There’s no doubt about it.” Illinois’ timing couldn’t have been worse. “They finally got the rules passed, and it was days later that the price of oil started falling,” Whitehead said.
Fracking Fraud: Bogus Production Numbers Scam Investors - According to a report from Bloomberg’s Bradley Olson, several studies have found that the results of one-day production tests on shale oil wells were not indicative of how they would perform over 12 months.Investors rely on these test results, which have little or no regulation, as an indication of future performance, and share prices have surged on these results in the past.Here’s what researchers said about them, via Olson: Some producers open flow valves full blast for the tests, an action not generally used in regular production, they said. Others install pumps to create artificial pressure, or measure just the first eight hours of flow, then multiply that by three to represent a full-day’s output. Allen Gilmer, CEO of the research firm Drillinginfo, told Olson: ” It’s hyperbole. There is no relationship between those test numbers and what can be economically delivered on a sustained basis.”A report from Drillinginfo said a better measure would be a month-long test of a well. But producers aren’t willing to wait longer than a day because they often don’t have the infrastructure to go to such lengths.These test results are used to attract the funding they need for more pipelines.For example, Olson noted, shares of Range Resources spiked after a one-day test showed that it could supply gas to 1,000 homes for a year.One Drillinginfo report said that at South Texas’ Eagle Ford shale fields, the 24-hour results did not have a statistically significant relationship to production over a full year.
House votes to speed natural gas pipelines - The House passed legislation on Wednesday to expedite the federal review process for natural gas pipeline applications. Passed 253-169, the bill would allow automatic approval of natural gas pipelines if federal agencies don't act within a certain timeframe. Under the measure, the Federal Energy Regulatory Commission (FERC) would be ordered to approve or deny a pipeline application within 12 months. Agencies responsible for issuing licenses or permits must act within 90 days after FERC issues a final environmental review, though the deadline could be extended by 30 days if the agency demonstrates it can't finish in time. But if the agency doesn't make a decision by then, a pipeline would automatically be approved.
Dominion Pipeline Opponents Rally At Capitol – Environmentalists and western Virginia property owners rallied Friday at the state Capitol in opposition to a proposed 550-mile natural gas pipeline. Richmond-based Dominion Resources is partnering with other utilities to build the $5 billion Atlantic Coast Pipeline, which would cross the Blue Ridge Mountains to deliver gas from Pennsylvania, Ohio and West Virginia. Environmentalists say the project would contribute to global warming because of the extraction method, known as hydraulic fracturing, or “fracking,” used to get the gas out of the ground. Calling climate change an “immense environmental crisis,” Kirk Bowers of the Sierra Club said the project would worsen sea-level rise and flooding in Hampton Roads. Property owners whose land would be crossed by the pipeline say the utilities are trampling on their property rights. Joanna Salidis of Nelson County, a landowner in the pipeline’s path, decried what she called Dominion’s “bullying” tactics.
Coastal Community Fights The Fracking Plan Threatening Its Sole Drinking Water Source -- Since its founding as a Native American trading village, Abita Springs has staked its reputation on its clean air and pure waters. Princess Abita of the Choctaw tribe, as the local legend goes, was wasting away in filthy New Orleans in the 1780s until she traveled north and drank from the healing spring that gave the town its name. A few hundred years later, Abita Brewery set up shop in town because of the “pristine” aquifer water it now uses in its internationally popular beers. “The safe, clean environment has always been very, very important to Abita Springs,” said the town’s mayor Greg Lemons. “The quality of life is high here.” But now, residents fear that pristine aquifer, the sole source of drinking water for miles, could be under threat of contamination as a fossil fuel company eyes the oil and gas deposits below. In December, over the objections of Mayor Lemons and many parish residents, Louisiana’s Department of Natural Resources approved a permit for the corporation Helis Oil & Gas to drill an exploratory well two and a half miles deep in the wooded wetlands just outside Abita Springs. If they find the fossil fuels they’re looking for, the company plans to extract it through the controversial process of hydraulic fracturing, known commonly as fracking.
U.S. oil well shut-ins start as crude rout batters small producers - Collapsing crude prices are confronting scores of smaller U.S. oil producers with the grim choice of either shutting older high-cost wells or burning through cash in the hope of riding out the downturn. As oil prices fell by more than half over the last six months from more than $100 per barrel, the U.S. oil industry responded by slowing its blistering growth and dialing back expansion plans. Now, with U.S. crude around $46 a barrel, operators are already closing some small old wells, known as strippers, and tens of thousands of similar wells are on the verge of losing money. A further slide could, by some estimates, idle an equivalent of up to 2 percent of U.S. supply, slowing overall output growth more than expected or even leaving it flat. Ray Lasseigne, an oilfield veteran and president of TMR Exploration Inc in Louisiana, is deciding which wells to close. TMR looks to close old wells, which produce so much saltwater that disposal costs exceed what the oil can fetch today. Other running costs include repairs and electricity to run the pump jacks, also known as nodding donkeys because they bob up and down while pulling oil out of the ground. “We’ve identified about 20 of our wells that are not economic at these prices,”
Earthquakes Rattle Texas Town: Is Fracking to Blame? - January has been a shaky month for Irving, Texas. Twelve earthquakes rattled the city during a 48-hour period at the end of the first week of the new year. “It was very scary. I was at my job on the 4th floor in a cubicle surrounded by glass,” . “One quake seemed like it lasted five minutes. No one knew what to do.”The earthquake swarm shows no sign of stopping. On Jan. 21, five more quakes struck. The quakes are relatively small, all of them registering under 4 on the Richter Scale. None has caused significant damage to property or resulted in bodily harm—but that hasn’t stopped people from worrying about their personal safety and property. A Dallas suburb, Irving sits atop the Barnett Shale, a geologic formation rich in natural gas. Seismic activity is not something the region is known for, and the fact that the earthquakes are now in the news has many fearing their home values will drop. Residents want to know what is causing the quakes, the likelihood they may increase in size and if anything can be done to stop them. A public meeting held Jan. 21 by city officials to address the earthquakes and other issues overflowed the 250-person capacity of the Irving Arts Center.“Everywhere they’re fracking they have earthquakes,” someone in the audience yelled out, according to the Dallas Morning News.
Kansas Geological Survey Suspects Quakes Caused By Oil, Gas Practices - Officials with the Kansas Geological Survey told legislators Monday they suspect recent earthquakes were caused by oil and gas production practices. Rex Buchanan, interim director of the Kansas Geological Survey, said a byproduct of the drilling process that is disposed of in wells could be increasing seismic activity in the state. “The scientific and regulatory community is focused on salt water from these disposal wells as a possible cause of the seismicity,” he said. Buchanan said his agency has discussed the increase with the U.S. Geological Survey and academics, and information points toward a correlation between the tremors and the increased use of saltwater injection from drilling. Rep. John Carmichael, a Democrat from Wichita, had asked Buchanan about a “reasonable probability” connecting quakes and the use of saltwater injection. Injection wells are used to force wastewater produced by oil and gas extraction back into the earth. Injection wells differ from hydraulic fracturing, also known as fracking, which fractures rock to extract oil and gas. “We need to differentiate between hydraulic fracturing, a well completion technique, and saltwater disposal, a production technique,” Buchanan said.
Let's Shake, Rattle And Roll With These Earthquakes | KMUW: Woo hoo! Roll over, Beethoven! Tell Tchaikovsky the news! Rock and roll is here to stay! And by “rock and roll,” I mean earthquakes. Kansas Geological Survey representatives recently testified at a legislative hearing. They said it’s not the fracking, it's the reinjecting of salty wastewater from the oil and gas drilling process into the earth. In other words, it’s not the frack, it’s the brack--brackish water injection. Hooray! Fracking’s not the problem! It’s wastewater injection, that’s all. Yes, it has to do with the increase in oil and gas drilling that fracking has brought about. That’s because more drilling means more wastewater to be injected. But, let’s not connect those dots. Let’s just think about the dotted lines on which we sign away drilling rights. And let’s not connect any dots between Kansas’ dwindling Ogallala aquifer and wastewater injection into the earth. Hey – it’s hard to draw straight lines connecting dots when the earth you’re standing on is shaking so much. Let’s just roll with it! I paid $1.69 a gallon to fill up yesterday! Sure, it took me a while to get the pump nozzle into my gas tank, the tremors shaking things like they were. But, hey! $1.69!
Oklahoma worries over swarm of earthquakes and connection to oil industry – The earthquakes come nearly every day now, cracking drywall, popping floor tiles and rattling kitchen cabinets. On Monday, three quakes hit this historic land-rush town in 24 hours, booming and rumbling like the end of the world. “After a while, you can’t even tell what’s a pre-shock or an after-shock. The ground just keeps moving,” said Jason Murphey, 37, a Web developer who represents Guthrie in the state legislature. “People are so frustrated and scared. They want to know the state is doing something.”What to do about the plague of earthquakes is, however, very much an open question in Oklahoma. Last year, 567 quakes of at least 3.0 magnitude rocked a swath of counties from the state capital to the Kansas line, alarming a populace long accustomed to fewer than two quakes a year. Scientists implicated the oil and gas industry — in particular, the deep wastewater disposal wells that have been linked to a dramatic increase in seismic activity across the central United States. But in a state founded on oil wealth, officials have been reluctant to crack down on an industry that accounts for a third of the economy and one in five jobs. With seismologists warning that the spreading earthquake swarms could trigger something far bigger and potentially deadly, pressure is building to follow the lead of other oil and gas-producing states and take more aggressive action. “The question is: Is it all about profits, or do the people have any rights at all?” said Robert Freeman, 69, a retired Air Force contracting officer who is trying to rally his neighbors in Guthrie to demand a moratorium on new disposal wells. “I understand the oil and gas industry is the economic lifeblood of the state. I get some of my paycheck from the oil and gas industry,” added Lisa Griggs, 56, a Guthrie environmental consultant. “But they don’t get to destroy my house.”
Court Will Decide If Fracking Companies Can Be Held Responsible For Earthquakes - Oklahoma’s highest court is about to make a decision that could really shake up the way fracking companies do business in the state. In the coming months, Oklahoma’s Supreme Court will decide whether two oil companies should be held financially responsible for injuries suffered by a woman during a 2011 earthquake thought to have been caused by drilling activity. If the woman’s lawsuit is successful, it could set a legal precedent for future earthquake claims against oil and gas companies in Oklahoma. In other words, oil and gas wells in Oklahoma would “become economic and legal-liability pariahs,” attorney Robert Gum said in comments reported by the Tulsa World. The lawsuit in question was brought by Sandra Ladra, a woman who lives in a small town called Prague. Ladra claims that on Nov. 5, 2011, she was sitting at home watching television with her family when a 5.6 magnitude intraplate earthquake struck, causing big chunks of rock to fall from her fireplace and chimney. Some of the rocks fell onto Ladra’s legs and into her lap, causing what the lawsuit describes as “significant injury.” Ladra was taken to the emergency room and treated. Then, two years later in March 2013, scientists from the University of Oklahoma, Columbia University, and the U.S. Geological Survey published a peer-reviewed study in the journal Geology, linking the 2011 earthquake to a process called wastewater injection. During that process, companies take the leftover water used to drill wells and inject it deep into the ground.
Oklahoma Court to Decide Whether Fracking Companies Are to Blame for Spate of Earthquakes -- The Oklahoma Supreme Court is set to make a decision that could, for the first time, legally acknowledge that the oil and gas industry may have something to do with the swarm of earthquakes the state has experienced in recent years, the Tulsa World reports. The case, brought by Prague, Oklahoma resident Sandra Ladra, centers around a 5.7 magnitude earthquake, the strongest ever recorded in the state, that struck the region on November 5, 2011 amid a series of similar quakes, destroying 13 homes. The quake caused pieces of rock to fall from Ladra’s fireplace and chimney onto her legs and lap. She was treated for injuries in an emergency room. Two years later, a peer-reviewed paper in the scientific journal Geology concluded that the quakes were induced by three injection wells in the vicinity, which perform a step in the fracking process—the disposal of vast volumes of salty, chemical-laced wastewater by injecting it deep into the ground.If the court sides with Ladra, the disposal wells in Oklahoma could “become economic and legal-liability pariahs,” attorney Robert Gum, who is representing one of the oil companies named as a defendant in the suit, said to a lower court in comments reported by the Tulsa World. A second oil company, Spess Oil Co., is also named as a defendant. Both have asserted that their activities did not trigger the quakes.
Fracking causing environmental concerns of seismic proportions -- Environmental activists have been dealt a pretty decent hand when it comes to betting against fracking–and as of late–that hand has . Recently, reports of fracking-related earthquakes are popping up in the news nearly as frequent as job cuts in the oil industry. States like Kansas, Oklahoma, Colorado and Ohio have all reported multiple earthquakes recently. A study released earlier this month by the Bulletin of the Seismological Society of America linked nearly 80 earthquakes in Mahoning County, Ohio in March 2014 to nearby fracking operations. Researchers said that the earthquakes were caused when companies fracked into a previously unknown fault. As recently as Monday, geologists in Kansas went to the House Energy and Environment Committee to ask for more funding to investigate an unprecedented spike in earthquakes in the state. Take a look at the map below. The dots on the map show reported earthquakes within the past month. As you can see, most earthquakes are occurring in northern Oklahoma and southern Kansas, 215—according to the USGS—to be exact. While that may seem like a ton of earthquakes to occur in one month, only one-third of them registered a magnitude of 3.0 or higher. Now take a look at this map below. The red lines represent fault lines throughout the United States. As you can see, red is raiding the western-half of the country, but nearly none appears in the Midwest or east coast. A lot of people believe that for a fracking-related earthquake to occur, the given area must be near a fault line. Well, as you can see from this map, that is clearly not the case.
Colorado lawmakers gear up for battle over fracking - — Colorado Republicans are proposing to compensate mineral owners when a local government bans or restricts fracking. The GOP’s approach has bothered Democrats who argue lawmakers should wait for recommendations from a task force studying how to resolve land-use disputes among homeowners, local governments, and energy companies. Regulations over fracking, or hydraulic fracturing, are expected to be one of the most divisive issues state lawmakers take up this year. Recommendations from the task force are due in late February. But Republicans already have two pending proposals to counter any fracking restrictions. A bill in the House would require local governments that ban fracking to compensate mineral owners. A bill in the Senate would also compensate mineral owners if fracking restrictions are imposed.
Energy Transfer Partners to bail out sister company with new deal - - Dallas-based Energy Transfer Partners announced Monday that it would buy its sister company Regency Energy Partners for $11.2 billion, including nearly $6.8 billion in debt, according to FuelFix. The purchase will make Energy Transfer Partners the second largest master limited partnership (MLP), the company said. CEO of Regency Mike Bradley said in a statement: “In light of the current volatility in commodity prices and the changes in the capital markets, it became apparent over the last several months that Regency needed more scale and diversification, along with an investment grade balance sheet, to continue its growth.” The potential deal would be a cash-and-stock deal, with both companies being controlled by parent company Energy Transfer Equity, L.P. Unitholders of Regency will receive 0.4066 Energy Transfer Partners common units and a cash payment of $.032 for a total price of $26.89 per unit, based on Energy Transfer Partners’ closing price on January 23. The price is a 15 percent premium to the average price of Regency’s common units for the past three trading days ending January 23, the company said. The deal will also restructure the amount of cash Energy Transfer partners is required to pass along to its parent company, Energy Transfer equity, by a total of $320 million over a five-year period. Energy Transfer owns and operates approximately 71,000 miles of pipelines, which is combined across several companies.
Fracking paused on gas wells in Western Colorado - The largest natural gas developer in Colorado has instituted a fracking freeze in the Piceance Basin of Western Colorado in response to dropping prices for natural gas and oil. WPX Energy announced in a blog post this week that it will "pause" the completion process for about 20 wells that have been drilled in the Piceance Basin. That means the wells will sit idle for the time being and won't undergo the hydraulic fracturing needed to release gas from underground formations."We are looking at ways to save on costs," said WPX spokesman Jeff Kirtland. WPX employs 380 people in Colorado; the company hasn't announced any layoffs at this time. The stop to fracking is expected to have more of an employment effect on contractors and service companies that are involved in that portion of the well development process. Halliburton and other large oilfield service providers, Schlumberger NV and Baker Hughes, provide those fracking-related services. Those companies announced this week that they are laying off thousands of workers, but the companies have not specified where those layoffs will take place.
Oil and gas spill report for Jan. 19 - The following spills were reported to the Colorado Oil and Gas Conservation Commission in the past two weeks. Noble Energy Inc, reported on Jan. 14 that during a pressure test on a flow line outside of Kersey, it was determined that there was a loss of pressure and a leak. It is approximated that less than five barrels of condensate and less than five barrels of produced water spilled. The impacted area was uncovered, and soil that exceeded compliance with COGCC standards was found. Bonanza Creek Energy Operating Company LLC, reported on Jan. 13 that a Bonanza Creek contractor struck a well head, resulting in a leak from the wellhead piping that spilled approximately 10 barrels of oil and six barrels of water outside of Kersey. An emergency response crew arrived to stop the leak. A clean up of the soil and snow was initiated by a clean up crew. Carrizo Niobrara LLC, reported on Jan. 9 that at about 8 p.m. Jan. 8 a partially cracked valve on a gas buster released an estimated amount of five barrels of E&P waste spill outside of Grover. The spill was released within containment. Cleanup efforts ensued. Bill Barrett Corp., reported on Jan. 8 that crew from Eastern Colorado Well Service Co. cracked a pipe nipple on a well head in the process of removing a base beam outside of Gill. The beam struck the nipple creating a crack that released approximately three barrels of oil, which sprayed onto the location in a mist. It is estimated that the oil mist covered an area of 300 feet long by 100 feet wide. The heaviest mist was approximated to be within a 150-foot area from the wellhead. . The well was depressured and the broken nipple was replaced. Noble Energy Inc., reported on Jan. 3 that a load line for a water tank froze and split outside of Briggsdale. The line released approximately 19 barrels of produced water spill inside of containment.
Wyoming to Strengthen Fracking Chemical Disclosure in Response to Citizen Pressure: Under a settlement agreement approved late Friday, the Wyoming Oil & Gas Conservation Commission must adopt more rigorous policies for scrutinizing industry requests to keep the identities of fracking chemicals secret. The Oil & Gas Commission must require substantially greater factual support for oil and gas industry claims that the identities of fracking chemicals used in Wyoming qualify as trade secrets or confidential commercial information and are therefore exempt from state public disclosure requirements. The settlement is the result of a public-interest lawsuit challenging state regulators’ decisions to withhold the identities of dozens of fracking chemicals from the public, despite evidence that many fracking chemicals cause serious health conditions and have the potential to contaminate soil and drinking water. Earthjustice represented the Powder River Basin Resource Council, Wyoming Outdoor Council, Earthworks, and the Center for Effective Government in bringing the lawsuit and negotiating the settlement with the Oil & Gas Commission and Halliburton Energy Services, Inc., which intervened in the case to represent industry interests. “The family that looks out their kitchen window and sees a drilling rig shouldn’t be left in the dark about what chemicals are being pumped into the ground under their home,” said Katherine O’Brien, Earthjustice attorney. “The reforms required by today’s settlement will ensure that oil and gas companies don’t get a free pass from public disclosure laws in Wyoming.”
Wyoming, Halliburton agree to greater fracking disclosure: A settlement reached by environmental groups, Wyoming regulators and the oil services giant Halliburton means it will be harder for companies to withhold information from the public about the chemicals used in fracking. The deal, announced Monday, represented a win for environmental groups, who have for years sought greater transparency surrounding the use of chemicals used to break open oil and gas bearing rock. They hailed the agreement as a "groundbreaking reform," saying it will provide more information to the public about potentially harmful chemicals being used on frack jobs near homes, schools and businesses. But they said more work remains and the focus will now be on the state to implement the terms of the deal. Under the agreement, the Wyoming Oil and Gas Conservation Commission will be required to implement a review process that effectively makes it more difficult for a company to claim fracking chemicals are exempt from public information requests. The burden of proof will be on firms to show a chemical qualifies as a trade secret, a legal designation afforded to companies in order to protect valuable technology from competitors. And it requires firms resubmit applications for 128 chemicals, which had previously been granted trade secret status by the state and challenged in court by environmentalists. Halliburton, which intervened in the case on Wyoming's behalf and helped negotiate the settlement, will resubmit applications covering 24 chemicals. Now it is up to the Oil and Gas Conservation Commission to effectively implement the agreement.
Deal requires Wyoming fracking trade-secret justification - — A legal settlement will require petroleum companies to provide justification when they ask Wyoming regulators to withhold from the public details about the chemical products they pump underground.Last year, the Wyoming Supreme Court sided with a landowners group and against Wyoming regulators in a lawsuit that sought public disclosure of the ingredients in those products.A state district court judge approved a settlement Friday that requires companies to provide detailed justification when they claim the ingredients are trade secrets.At issue are chemicals used in hydraulic fracturing, the process of pumping water mixed with sand and chemical products into wells to crack open oil and gas deposits.Tom Kropatsch with the Wyoming Oil and Gas Conservation Commission says the settlement will allow the agency to process backlogged trade-secret requests.
Massive oil drilling project in Carson is dropped - — A California firm has dropped plans to launch a massive oil drilling project in the Los Angeles County city of Carson. California Resources Corp. said in a statement Monday that the proposed project “is no longer practical in the current commodity price environment.” Oil prices have plunged in recent months. The decision was hailed by environmental activists and residents who had fought the project for years. City Attorney Sunny Soltani tells the Los Angeles Times that Carson staff will immediately stop work on the project’s application and pending environmental review. The firm, which was spun off from Occidental Petroleum last month, had planned to bore more than 200 wells to extract more oil from the Dominguez Oil Field. The field has produced more than 270 million barrels of oil since its discovery in 1923.
Layoffs in the Bakken and a shifting economy -- As the oil price slump persists consumers are reaping the benefits of lower fuel costs. Towns like Williston, however, with economies structured around the oil and gas industry, are beginning to see the effects of the nation-wide drilling slowdown. A recent report from CNN Money examines how the slowdown is beginning to affect workers in the Bakken oil formation of Montana and North Dakota. Across the nation, oil and gas companies have been announcing layoffs. Schlumberger, the world’s largest oilfield services company, reported that it would cut 9,000 jobs companywide. Earlier this week, Baker Hughes announced the layoffs of about 7,000 employees by the end of March. The rig count in North Dakota has dropped significantly within the past month and has reached the lowest level in five years. As of today, the rig count is 157 compared to 189 the same time last year. CNN reports that CEO of MBI Energy Services Jim Arthaud said, “My prediction is we’re down to 50 rigs by June.” Though, he didn’t express much concern about the effects it would have on his company. The firm repairs area oil field equipment, works to increase well flow and transports oil from the fields to adjacent rail hubs. Arthaud, who grew up in North Dakota, plans to use the layoffs from other companies as an opportunity to hire additional employees. The Belfield-based company currently employs roughly 2,000 people. The effects of the drilling slowdown will likely have a large impact on the region if low oil prices persist, however. Arthaud commented, “I’d say we’ll lose 20,000 jobs by June.” Despite the current slowdown, other residents don’t seem as concerned. While the drilling slowdown may lead to layoffs in the oil and gas sector, the region continues to sustain its population and retains the need for infrastructure related to the industry.
North Dakota oil rigs drop points to U.S. output decline after May: Kemp – The decline in oil drilling that has occurred so far across the United States is probably enough to ensure U.S. production peaks by April or May, though that might not be evident until June or July given delays in publishing production records. In North Dakota, the number of rigs drilling for oil has fallen by almost a quarter in less than four months, according to oil field services company Baker Hughes. Baker Hughes puts the number of active drilling rigs in the state at just 147 last week, down from 189 at the beginning of October, and the lowest number since December 2010. Baker Hughes counts rigs as active only when they are actually drilling – from the time the rig breaks ground and the well is spudded to the time the rig reaches target depth. The company excludes rigs in transit, moving in and rigging up, or engaged in non-drilling activities such as production testing. North Dakota’s Department of Mineral Resources (DMR), which uses a slightly broader definition, puts the count higher at 157 but shows a similar decline over the last three months. Moreover, of the 157 rigs included in the department’s active list, 27 are recorded working on projects that began in 2014; it remains unclear whether they will be deployed on new wells.Many rigs are being stacked. DMR records shows at least four of the 157 active rigs are due to be stacked once their current well is completed rather move to another job. Rigs are said to be “cold stacked” when they are released from contract or stopped and the crew is normally laid off. Warm stacking refers to taking a rig off the market temporarily, in the hope of obtaining a better rate in future, and basic operations and staffing are normally maintained
North Dakota: oil producers aim to cut radioactive waste bills -- North Dakota’s oil industry is pushing to change the state’s radioactive waste disposal laws as part of a broad effort to conserve cash as oil prices tumble. The waste, which becomes slightly radioactive as part of the hydraulic fracturing process that churns up isotopes locked underground, must be trucked out of state. That’s because rules prohibit North Dakota landfills from accepting anything but miniscule amounts of radiation. The most common form of radioactive waste is a filter sock, a mesh tube resembling a sandbag through which fracking water is pumped before it’s injected back into the earth. Tank and pipeline sludge are also radioactive. It’s not clear how much of this waste is generated, as North Dakota officials only began requiring tracking last year; final 2014 reports aren’t due until next month. Some put the number at 70 tons per day; others say 27 tons. Given that, estimates on potential savings aren’t precise. But the oil industry says allowing North Dakota‘s landfills to accept more radioactive material could save at least $10,000 in transportation costs per truckload. There are 11,942 active wells in the state, so assuming each well generates at least one 15-cubic yard Dumpster’s worth of radioactive waste each year – a conservative estimate, state officials say – that translates to an annual savings of about $120 million statewide.
OSHA investigating Bakken oil patch death - The North Dakota oil patch has lost another oil and gas worker, according to The Bismarck Tribune.An employee for C&D Oilfield Services who has not been identified was found dead on January 15 on the catwalk of an oil well tank battery, says Occupational Safety and Health Administration (OSHA) Area Director Eric Brooks. OSHA is currently investigating the incident.The Tribune reports that the worker was gauging the tank setup at a well site operated by Denbury Resources, located between Dickinson and Manning, North Dakota. The cause of death is being investigated by the State Medical Examiner’s office. According to Brooks, incidents like these are generally thought to be caused by exposure to lethal amounts of volatile organic compounds that emanate from the stored oil. Toxic organic compounds such as hydrogen sulfur gas are usually to blame, but it doesn’t appear to the cause of death in this event. Also under continued investigation by Brooks and fellow staff members is the January 14 death of the owner of Watford City-based Legendary Field Services, Wes Herrman. He died as a result of burn injuries sustained after a fire erupted on a heating and treatment unit at a QEP Resources well site located outside Mandaree.
Bakken: 2015 is off to a deadly start - The Occupational Safety and Health Administration (OSHA) is reporting that North Dakota has seen as many oil and gas related deaths this year as the entirety of last year. The figures for 2015 date back to October 1. KX News reports that OSHA tracks the data from October 1 of one year to September 30 of the next. The last few weeks have been especially dangerous according to OSHA Area Director Eric Brooks. Four of the five fatal accidents reported for 2015 have occurred during the first few weeks of January. The deaths are currently being investigated. This is of great concern, he says, because of a possible link between the shifting economy and the safety of work places, according to KX News. “I’m starting to get a little concerned. The drop in oil prices, are they causing companies to maybe try to protect their probability by hiring a contractor that’s not as experienced in this particular industry? Some of the things we’ve seen in the last couple of weeks are things we hadn’t seen in about three years,” Brooks said. According to Brooks, fatalities in the oil and gas industry are generally caused by flammable vapors, being struck by equipment, falls and electrical accidents. Since October 1, OSHA has reported eight work related deaths, five of which were related to oil and gas development. For the 2014 period, OSHA reported 18 work related deaths, five of which were related to oil and gas.
Barriers set up, water being testing at North Dakota site of 3 million-gallon saltwater spill - — Earthen barriers have been set up across a creek and water was being tested Thursday around the site of a nearly 3 million-gallon leak of saltwater generated by oil drilling, the largest spill of its kind during North Dakota's current oil rush. The berms were built at Blacktail Creek to prevent potentially contaminated water from flowing out of the creek and into a bigger body of water that eventually leads into the Missouri River. "So when the ice starts to melt if there's any oil or contaminated water, they can contain it and pump that out before it goes downstream," said Dave Glatt, chief of the North Dakota Department of Health's environmental health section. Pipeline operator Summit Midstream Partners LLC and state inspectors will keep testing the soil and water at the Blacktail Creek and larger Little Muddy Creek until after the ice melts this spring, Glatt said. Saltwater, known as brine, is an unwanted byproduct of oil and natural gas production that is much saltier than sea water and may also contain petroleum and residue from hydraulic fracturing operations. Some previous saltwater spills have taken years to clean up. The spill was detected Jan. 6 during a periodic inspection by the company, which said Thursday the cause of the rupture in the pipeline and when exactly it happened is still unknown. The portion of the pipeline that ruptured has been sent to a laboratory to be analyzed, and Summit Midstream said crews are probing the soils and water close to the rupture to determine the ultimate cause and extent.
EPA: 4M gallons pumped from North Dakota saltwater spill - More than 4 million gallons of a mixture of fresh water, brine and oil have been pumped from the area affected by the largest saltwater spill of North Dakota’s current energy boom, according to a report issued Monday by the Environmental Protection Agency. The report provides an overall assessment on the nearly 3 million-gallon spill of saltwater generated by oil drilling that leaked from a ruptured pipeline that operator Summit Midstream Partners LLC detected on Jan. 6. It remains unclear exactly when the spill occurred and what caused it.The spill happened in Marmon, about 15 miles north of Williston, and primarily contaminated the Blacktail Creek. Saltwater also reached the bigger Little Muddy River and the Missouri River. Saltwater, known as brine, is an unwanted byproduct of oil and natural gas production that is much saltier than sea water and may also contain petroleum and residue from hydraulic fracturing operations. Some previous saltwater spills have taken years to clean up.The EPA’s report also states that underflow dams — which allow clean water to flow freely underneath and can contain materials that float on the water’s surface — are being built in case water levels rise. The mixture of fresh water, brine and oil that has been pumped from several locations along Blacktail Creek is being transported to a well site to be injected underground. Saltwater is usually pumped underground for permanent storage from a network of pipelines that extends to hundreds of disposal wells in the western part of the state.
Pipeline not state-inspected before 3M-gallon saltwater leak - A pipeline that ruptured recently in North Dakota and spilled nearly 3 million gallons of saltwater produced during oil drilling wasn't inspected by the state before being installed, according to state regulators. Alison Ritter, a spokeswoman for the North Dakota Industrial Commission, which oversees the state's oil and gas industry, said Wednesday that it's common for officials not to inspect such small gathering pipelines before they become operational.North Dakota has struggled to find qualified installation inspectors because candidates are often drawn to lucrative jobs in the oil industry, Ritter said. Instead, the state has to rely on the word of companies, which are required to file an affidavit stating that they've followed state-mandated procedures when implementing the smaller pipelines, which typically run from one well pad to another. "We wanted these positions filled a long time ago," Ritter said. "Could they have prevented something like this? I don't know, because hindsight's 20-20 and we still don't know the cause. But does it help to have the people in that position? Absolutely." Nearly 3 million gallons of saltwater, an unwanted byproduct of oil and natural gas production, was unleashed during the spill, the largest of North Dakota's current energy boom. Saltwater, known as brine, is much saltier than sea water and may also contain petroleum and residue from hydraulic fracturing operations. Some previous saltwater spills have taken years to clean up.
Questions and answers about oil and gas wastewater spills - Nearly 3 million gallons of briny water generated by crude oil production has leaked from a North Dakota pipeline and reached two creeks, making it the biggest spill of this type of wastewater since the state’s Bakken formation oil boom began in 2006. Here are some questions and answers about oil and gas saltwater spills:
- Q: What does this liquid consist of, and where does it come from?
- A: Trapped within underground rock is naturally occurring water that can be more than 10 times saltier than the oceans, depending on the location. It accumulates in porous formations that also contain oil and gas deposits, so it rises to the earth’s surface when those hydrocarbons are pumped out. The industry and regulators refer to the wastewater by different terms, including “produced water,” ”saltwater,” ”brine” and “formation water.”
Breached pipeline that spilled oil lies exposed on riverbed — Sonar indicates part of an underground pipeline that spilled almost 40,000 gallons of oil into Montana’s Yellowstone River and fouled a local water supply is exposed on the riverbed. The pipeline is exposed for about 50 feet near where the breach occurred Jan. 17, according to a news release from public agencies involved with the response. The pipeline had been buried at least 8 feet under the riverbed, and the depth was last confirmed in September 2011. The cause of the spill remains under investigation. It prompted a five-day shutdown of drinking water services for 6,000 people in the city of Glendive after oil got into a treatment plant. Prior accidents, including a 2011 Exxon Mobil pipeline spill on the Yellowstone near Billings, have demonstrated that pipelines beneath bodies of water can quickly become exposed by floodwaters or other natural forces. Bridger Pipeline Co., which is based in Casper, Wyoming, says its pipeline will remain shut down from Glendive to near the Canada border until the river section is replaced. The company says the pipeline will be buried deeper beneath the river. Federal rules require lines to be buried at least 4 feet beneath riverbeds. The 193-mile Poplar Pipeline delivers crude from the Bakken oil patch of North Dakota and Montana to a terminal in Baker, Montana, about 55 miles south of Glendive. It was built in the 1950s and has a capacity of 42,000 barrels of oil a day.
Pipeline Break in Montana: The Yellowstone River Is Something We'll Probably Miss: Why do pipelines break? Because they're pipelines, that's why. The Pipeline Hazardous Materials Safety Administration confirmed the location of the break, but couldn't say whether the 12-inch diameter Bridger pipeline, which began releasing oil into the river Saturday, lay bare on the river bottom. Not only that, but this is the second crack that oil has had at fouling this particular river. In 2011, when an exposed oil pipeline ruptured at the bottom of the Yellowstone River near Laurel, the pipe was assumed to be buried well under the riverbed. It was later determined that an unusually high river flow had scoured several feet of rock cover leaving the pipeline vulnerable. Pipelines are state of the art technology, unless they're required to operate in cold weather and amid unexpected phenomona like ice in Montana in January. "There's a limited amount of places where the cleanup can be done: Open water, or thick ice, and there's a lot of places in between," said Tom Livers, state Department of Environmental Quality deputy director. "They can't plug the leak, because there is no way to get at it" under the ice. There is oil sheen on the water as far downstream as Sidney. However, that community relies on well water and hasn't had the contamination problems that Glendive has. The Glendive water supply contains the cancer-causing agent benzene, an oil ingredient. Workers are flushing the Glendive drinking-water system, Livers said. The goal is to have all of the volatile organic compounds out of the system by Thursday.
Williston water is supposedly safe to drink - Despite finding trace amounts of hydrocarbons in Williston’s drinking water, officials are reporting that it is still safe to drink. According to a report from The Williston Herald, Public Works Director David Tuan said, “During this period there are trace amounts of hydrocarbons in the water that are producing an odor. It is still small enough that it is safe to consume. People may not want to consume it, which is understandable because it tastes bad and smells bad, but it is safe to consume.” City officials are currently unsure if the increased levels of hydrocarbons in the water supply are from the recent oil spill in Glendive, Montana, or if they water has been tainted from a different source. Last week, a pipeline owned by Bridger Pipeline LLC ruptured and released an estimated 40,000 gallons of oil into the Yellowstone River. The spill occurred about 50 river miles away from North Dakota where the Yellowstone and Missouri rivers meet. After the spill, Glendive officials shut down the water treatment plant and measured hydrocarbon contents at levels of 15 parts per billion (ppb). In Williston, the highest readings reached 3.39 ppb and have been dropping since the measurement was taken. The state cut off level for hydrocarbon content in water is five ppb. Tuan said, “Water quality has nothing to do with the smell, color and odor … Your water could be yellow, blue or smelly and still be safe. In the spring, water can have a musty smell during the runoff period,” reports The Herald. It takes about two days for water to travel from the water treatment plant to the tap. The odor, coming days after the spill in Glendive, could be the culprit. Tuan said, “It could be a lag effect to get through the system.” However, officials are still uncertain if the spill in Glendive is the cause. The EPA is reporting that no oil has come into North Dakota so officials are unable to assume the spill is to blame.
Oil and brine spill reported in Williams County - The North Dakota Department of Health has announced another oil and brine spill, the third such incident to happen this month. According to a report from United Press International (UPI), the Health Department received notice from Oasis Petroleum that 490 barrels of oil and 455 barrels of brine were released due to storage tank overflow. The health department reports that nearly all of the spilled material has been recovered. Personnel from the Health Department and the North Dakota Oil and Gas Division responded to the scene located in western Williams County. Brine water, also referred to as saltwater, is a byproduct of the oil and gas drilling process. The Environmental Protection Agency states that this water is usually extremely toxic to the environment and contains radioactive material and heavy metals. The water is many times saltier than sea water and the toxic substances can be extremely damaging to the environment and public health if released onto the surface. The company gave no statement regarding the overflow, and the Health Department has given no indication of the incident being a threat to public health. This most recent incident occurred in the same region as the brine spill that happened earlier this month when a Summit Midstream owned salt water pipeline released roughly 70,000 barrels of the byproduct. In other news, last week the Department of Health was notified of a source water spill in Williams County nine miles southwest of Tioga. Hess Bakken Investments reported that 2,500 barrels of source water used for enhanced oil recovery was released from a pipeline. The source water, which is higher in dissolved minerals and solids than fresh water, impacted a local stock damn. The company initiated cleanup and the Department of Health is assisting with remediation planning.
Montana oil spill adds to fears about proposed pipeline - A pipeline oil spill in Montana that contaminated a river and a city’s drinking water supply is adding to fears about a proposed pipeline to carry oil from western North Dakota to a terminal in Illinois for distribution to refineries in eastern states. Many people who commented Thursday at a public hearing in Sioux Falls, South Dakota, on the proposed $3.8 billion Dakota Access Pipeline referenced the Yellowstone River spill that contaminated drinking water in Glendive, Montana, this week. Some residents fear a similar incident could occur with the Dakota Access Pipeline. “If the pipeline fails — and there are plenty of examples of these types of pipelines failing — and cleanup costs exceed what Dakota Access can pay, who is going to end up paying?” Aaron Johnson asked members of South Dakota’s Public Utilities Commission, which must approve a construction permit. Some at the hearing voiced support for the project, citing a promised economic boost and the value of pipelines in pushing the country toward independence from foreign oil. “This crude is being consumed by millions of people across the United States,” said Joe Chastain, who represents union workers in South Dakota. The proposed 1,134-mile Dakota Access Pipeline would stretch from the Bakken oil formation in North Dakota to Patoka, Illinois. North Dakota’s Pipeline Authority has said it would be the largest-capacity pipeline for the state’s crude to date.
Montana's Bakken boom might have gone bust -The Bakken oil boom in Montana has gone bust, or at least that’s the belief held by Terry Johnson, director of energy research at the University of Montana’s Bureau of Business and Economic Research. Montana Public Radio reports that Johnson said, “I would argue that the Bakken boom in Montana actually occurred back in 2005 and 2006. That the boom is really no longer that present in Montana at this point in time.” Last Friday, Johnson gave a presentation in Missoula and said it appears that Montana’s oil wells in the Bakken formation have reached maturity and yielding less with each passing year. Now that the price of oil has declined over half within the past year, there’s not much motivation for companies to drill new wells. According to MPR, Johnson said, “Continental Resources, the largest oil producer in Montana, is projected to cut their spending by 40 percent, and they also are projecting that they will reduce the number of drilling rigs by about a third, or 33 percent.” Oil production in the state has already declined compared to last year, and when combined with the decreased price of oil, the total value of the resource being extracted will be substantially less than the previous year. He predicts the overall value of oil produced in the state will drop by half with the coming year. Natural gas production isn’t looking up either. Johnson said, “I’m not seeing any positive signs there because of our maturing wells, reduced investments, so I’m seeing probably about a 10 percent decline in natural gas.” Coal production, however, is expected to hold steady throughout the year, despite the shrinking of domestic demand as many coal-fired plants are decommissioned or converted to use natural gas.
Washington State Officials Kept in the Dark About Oil Spill for Over a Month: State and federal officials are investigating an oil spill from a railroad tank car at Washington state’s largest refinery last November, but key agencies were kept in the dark about it for at least a month. The delayed notification of the spill highlights gaps in communication and enforcement as more crude oil shipments travel by rail. According to reports reviewed by McClatchy, when the tank car arrived on Nov. 5 at the BP Cherry Point refinery, Federal Railroad Administration inspectors discovered oil stains on its sides and wheels. A closer inspection revealed an open valve and a missing plug. The car was also 1,611 gallons short, enough to fill the gas tanks of 100 Subaru Foresters . Neither the railroad, nor the third-party company that unloaded the oil at the terminal, however, could determine where the missing oil had spilled, making it likely that it had leaked somewhere along the train’s 1,200-mile path between the loading terminal in Dore, N.D., and the refinery, near Ferndale, Wash. The oil train route to Northwest refineries passes through national parks, along rivers and through the region’s population centers. An oil release of that size from a marine tanker, a refinery or a storage facility would automatically trigger a well-establish set of notification requirements that would result in the information about the incident flowing promptly to local, state and federal agencies.
Five Years after Enbridge Oil Spill, Landowners Await Spring Landscaping of Repaired Line - The giant trenching tractors, bulldozers and trucks that once shook his house with the intensity of a small earthquake have disappeared and oil now pulses through the pipeline that runs 14 feet from his house near Ceresco, Mich. The shaking stopped months ago, but Gallagher remains perhaps even more shaken by the emotional aftershocks of the experience. Gallagher, a 45-year-old custom cabinet maker and interior contractor, said memories of living in the house will be spoiled by damage done to the land. His wife's parents built the house in 1973, five years after the original Line 6B had been buried under open farmland. Now that the machines are gone, Enbridge has vowed to heal the landscape this spring with grass, trees and other native plants destroyed by the years of construction all along the course of the new 285-mile pipeline that stretches from Griffith, Ind. across southern Michigan to Sarnia, Ontario, Canada. Enbridge is deactivating the old Line 6B since the new 285-mile pipeline and infrastructure went fully operational late last year.
Enbridge defends northern route for pipeline - Pipeline operator Enbridge Energy on Tuesday defended its proposal to build a northern Minnesota crude oil pipeline in the face of persistent suggestions by state agencies that another route, farther south, might be better. Company executives testified during the first day of a trial-like evidentiary hearing before a regulatory judge in St. Paul. Critics of the $2.6 billion project have questioned whether the line needs to be built Up North, an idea that Paul Eberth, Enbridge’s project director, disputed on the witness stand. He said the project, known as Sandpiper, would allow shippers to carry North Dakota crude oil to a terminal in Clearbrook, Minn., and then on to Enbridge’s storage terminal and other pipelines in Superior, Wis. Rerouting the pipeline without reaching those destinations wouldn’t serve shippers’ needs, he said. “I am not sure the project would proceed,” Eberth said when asked if Enbridge would consider alternate routes proposed by environmental groups and a state agency. State officials have raised concerns about the risk of a major oil spill like the 2010 rupture of an older Enbridge pipeline in Marshall, Mich. It sent crude oil into the Kalamazoo River and has cost more than $1 billion to clean up. Enbridge has since replaced that line with new pipe. “If we have incidents like that I don’t know that we could continue to stay in business,” Eberth said under questioning. “It is hugely important for Enbridge to prevent those kind of incidents.”
Enbridge Gets Another Federal Tar Sands Crude Pipeline Permit As Senate Debates Keystone XL --On January 16, the U.S. Army Corps of Engineers gave Enbridge a controversial Nationwide Permit 12 green-light for its proposed Line 78 pipeline, set to bring heavy tar sands diluted bitumen (“dilbit”) from Pontiac, Illinois to its Griffith, Indiana holding terminal. The permit for the pipeline with the capacity to carry 800,000 barrels-per-day of tar sands dilbit came ten days after the introduction of S.1 — the Keystone XL Pipeline Act — currently up for debate on the U.S. Senate floor, which calls for the permitting of the northern leg of TransCanada's Keystone XL. Griffith is located just south of Whiting, Indiana, home of a massive refinery owned by BP. In November 2013, BP opened its Whiting Modernization Project, which retooled to refine up to 85-percent of its capacity as heavy dilbit from the tar sands, up from its initial 20-percent capacity. In July 2014, environmental groups including the Sierra Club, National Wildlife Federation, Center for Biological Diversity and Environmental Law and Policy Center submitted a letter to the Army Corps, requesting a full National Environmental Policy Act (NEPA) review for Enbridge's proposal. As with TransCanada's Keystone XL southern leg, Enbridge's Flanagan South and Enbridge's Alberta Clipper expansion, Enbridge dodged a more democratic and transparent NEPA review from the U.S. Environmental Protection Agency and other executive agencies. Just as DeSmogBlog has called Enbridge's north-to-south dilbit pipeline network a “Keystone XL Clone,” Enbridge has quietly proposed and is currently permitting into existence a clone of TransCanada's controversial Energy East dilbit pipeline. According to the map of Line 78 on Enbridge's website, the pipeline will connect with Line 6B in Griffith. Line 6B is infamous for the biggest dilbit pipeline spill in U.S. historyin Kalamazoo, Michigan. Line 6B will then connect with Enbridge's proposed Line 9 Reversal project (also known as the Eastern Canadian Refinery Access Initiative), which will bring tar sands dilbit to Canada's east coast — like Energy East — for potential export.
Senate Passes Bill To Approve Construction Of Keystone XL Pipeline -- The Senate wrapped up nearly a month of debate on the Keystone XL pipeline on Thursday, voting 62-36 to approve construction of the controversial project. The bill will now make its way to the House, which has already approved its own separate version of the bill but is said to be taking up the Senate’s version with its amendments next week. When it’s approved in the House, the bill will go to President Obama’s desk. President Obama has pledged to veto the bill. At the moment, neither the House nor Senate has enough votes to override a veto.Aside from providing authorization for the construction of Keystone XL — the proposed 1,700-mile pipeline which would transport up to 830,000 barrels of tar sands oil per day from Canada down to the Gulf Coast — the Senate bill also includes five extra provisions that came from approved amendments. Over the last few weeks, the Senate voted on more than 40 amendments to the Keystone bill, ranging from whether climate change exists to whether the EPA should have armed enforcement officers. The amendments approved include a “sense of the Senate” amendment that states “climate change is real and not a hoax;” a symbolic, but ultimately useless gesture for property rights; and two bipartisan boosts for energy efficiency. More about the passed amendments can be found here.
Kinder Morgan says Freedom Pipeline project is gaining refiner interest - Kinder Morgan Inc’s proposed Freedom Pipeline, which would move West Texas crude oil to Southern California, is “getting more interest” from U.S. West Coast refiners, the head of the company’s natural gas pipeline unit told analysts on Wednesday. Unit President Tom Martin said the company “may have a shot” at moving ahead with converting a natural gas pipeline to move crude and condensate to California “if we can get the refiners on board.” The pipeline and logistics company first proposed the $2 billion project in 2012 but shelved it in May 2013 for lack of shipper interest. Martin said on Wednesday that the revamped proposal included adding a facility at the front end in Texas to provide crude blends that better match the Alaska North Slope (ANS) crude that California refineries typically process. The new proposal also involves shipping ultra-light crude, known as condensate, that could be exported from California, he said during the company’s annual analyst meeting.
America’s fracking ‘boom’ is having its worst months ever - They threw a fracking party in Illinois, and hardly anyone showed up. More precisely, two months after the state completed a long regulatory process and opened the door to hydraulic fracturing, only one company applied. The state hired 36 employees and five lawyers to handle the expected rush of applicants, reported the Chicago Tribune, “for work that doesn’t exist.” This after a land rush by energy companies in Southern Illinois that saw them buy tens of thousands of acres anticipating a North Dakota-style energy boom that would create 10,000 jobs. The disinterest is attributed to the sharp decline in oil and gas prices globally, which makes fracking unprofitable — at best a break-even proposition, at worst a big money-loser.“Smart people don’t invest in things that break-even,” said energy expert Arthur Berman in Oilprice.com. “I mean, why should I take a risk to make no money on an energy company when I can invest in a variable annuity or a REIT that has almost no risk that will pay me a reasonable margin? Oil prices need to be around $90 to attract investment capital. So, are companies OK at current oil prices? Hell no! They are dying at these prices. Oil prices these days are in the $49 range for Brent crude, the global benchmark, and $47 a barrel for West Texas intermediate crude, the U.S. benchmark — 30 percent and 40 precent lower, respectively, than the prices two months ago, according to Reuters.
Price Collapse Hits Scavengers Who Scrape the Bottom of Big Oil's Barrel - In the $1.6 trillion-a-year oil business, there are global titans like Exxon Mobil Corp. (XOM) that wield more economic might than most of the nations on Earth, and scores of wildcatters scouring land and sea for the next treasure troves of crude. Then there are the strippers. For these canaries in the proverbial coal mine, the journey keeps going deeper and darker. Strippers are scavengers who make a living by resuscitating once-prolific oil fields to coax as little as a bathtub full of crude a day from each well. Collectively, the strippers operate almost half-a-million oil wells that produced more than 730,000 barrels a day in 2012, the most recent year for which figures were available. That’s one of every 10 barrels produced in the U.S. -- equivalent to the entire output of Qatar, or half the crude Royal Dutch Shell Plc (RDSA), Europe’s largest energy company, pumps worldwide every day. With oil prices down 58 percent since June, these smallest of producers will be the first to succumb to the Great Oil Bust of 2015. Stripper wells -- an inglorious moniker for 2-inch-wide holes that produce trickles of crude with the aid of iconic pumping machines known as nodding donkeys -- were a vital contributor to U.S. oil production long before the shale revolution. Though a far cry from the booming shale gushers that have pushed American crude production to the highest in a generation, stripper wells are a defining image of the oil business, scattered throughout rural backwaters abandoned by the world’s oil titans decades ago. With the price of crude dipping so low, there’s no way Shulman will be able to drill a new well that regulators have already permitted. Nor is he even going to turn on a well finished last month that’s ready to start production.
Why Fracking & Tar Sands are Doomed: Low-Cost Oil and Pollution - Oil comes in at least these categories:
- · Conventional oil: vertically drilled wells on land or shallow continental shelf. Conventional oil, worldwide, is past its peak of production (it peaked in 2005-8 per the International Energy Agency), and oil production is declining at an average rate of 5.8% per year
- · Unconventional oil comes from oil-laden shale, requiring vertical and horizontal drilling, and also requiring hydraulic fracturing, or “fracking”. It is more expensive to produce than conventional oil....However, the price of all oil has been dramatically declining (today it is about $45/barrel) – more than a 55% decline – and, in most cases, the price is insufficient to cover shale oil production costs plus profit.
- · Tar sands are a mixture of sand and bitumen. Heat is used to separate the bitumen from the sand, and the bitumen is then cut with lighter hydrocarbons and refined to be similar to crude oil. It is generally more expensive than shale oil to produce, but much of the cost is related to building the initial plant.
- · Ultra-deep oceanic wells are expensive and high risk. For example, the Macondo well in the Gulf of Mexico, which blew out, was a major ecological/financial disaster for BP. However, some deep drilling is continuing. Arctic drilling has not been successful and instead has caused huge losses for Shell.
The extent of fracking is declining for economic reasons. However, the decline is a good thing for other reasons. Fracking is a legal technique only because Richard Cheney, VP under President George W. Bush, pushed through laws in 2005 which exempted oil and gas production from these existing laws: The Clean Air Act, Clean Water Act, Safe Drinking Water Act, National Environmental Policy Act, Resource Conservation and Recovery Act, Emergency Planning and Community Right-to-Know Act, the Superfund act, and from various toxic reporting requirements.
BP shedding jobs in Houston - Petro Global News reports that support staff at BP’s Houston office will be seeing a round of layoffs, though the company did not disclose how many will be without jobs. However, the move was to be expected after the oil giant announced yesterday that it will be selling part of its stake in joint projects with Chevron in the Gulf. Houston is the hub of operations for BP’s Gulf of Mexico projects. As of June 2014, the company employed 7,200 people in the city. According to the Economic Impact Report BP released earlier this year, the company has four production platforms and 10 operating rigs throughout the Gulf. The southern states and the Gulf are BP’s strongest areas of operation in the United States. With a daunting $13.7 billion in possible fines under the Clean Water Act, BP is making an effort to slim down and improve efficiency on a global scale. A freeze on base pay was initiated this week for 2015 to help the company minimize costs during the oil price slump. BP also laid off 300 employees in the North Sea and cut 255 jobs in Azerbaijan already this year. Worse yet, BP expects to announce more layoffs throughout the first quarter.
Big Oil’ Cuts $20 Billion in Five Hours to Preserve Dividends -- Royal Dutch Shell Plc will cut $15 billion of investment over the next three years as the crash in oil prices saw fourth-quarter profit miss forecasts. Shell, the first of the world’s largest oil companies to report earnings following the slump in crude to a five-year low, will defer or cancel about 40 projects worldwide, Chief Executive Officer Ben van Beurden said today. Exploration will also be curtailed. “We see pressure on our investment program,” van Beurden said on Bloomberg TV. “It’s a game of being prudent but at the same time not overreacting.” Profit excluding one-time items and inventory changes was $3.3 billion in the quarter, up from $2.9 billion a year earlier, Shell said today. That missed the $4.1 billion average of 13 analyst estimates compiled by Bloomberg. The global industry is scurrying to respond as oil below $50 a barrel guts cash flows. Occidental Petroleum Corp. and ConocoPhilips also announced lower spending today. BP Plc has frozen wages and Chevron Corp. delayed its 2015 drilling budget. By cutting investment, companies aim to protect returns to investors. ConocoPhillips, the third-largest U.S. energy producer, reported its first quarterly loss since 2008 and has announced spending cuts. More than 30,000 dismissals have been announced across the oil industry as companies shrink budgets, according to a tally by Bloomberg News. Exploration and production spending will fall by more than $116 billion, or 17 percent, on weaker oil revenues, according to an estimate from Cowen & Co.
Trio of oil companies announce $20 billion in spending cuts: The year’s first wave of major oil company financial reports sent more dark clouds over the oil patch Thursday, with news of $20 billion in combined spending cuts, profit losses and a growing pricing standoff between oil producers and the companies that drill and service their wells. Lower drilling budgets announced by Royal Dutch Shell, ConocoPhillips and Occidental Petroleum Corp. will have a hand in putting the oil services industry – a major employer in Houston – on a path for sinking profits this year, analysts say, as well as widespread layoffs and, if oil stays below $50 a barrel for long, even deeper cuts. “What we’re seeing thus far is a textbook implosion,” said Bill Herbert, an analyst with Simmons & Company International. Houston-based oil field services giants Schlumberger, Baker Hughes and Halliburton already have announced 17,000 job cuts combined.
Goodrich Petroleum cuts oil drilling in La. and Miss. - — Low oil prices mean the driller that has been the most bullish on an oil region that straddles the Louisiana-Mississippi line is cutting back. Goodrich Petroleum Corp., based in Houston, said Friday that it will spend $80 million to $100 million on exploration and drilling this week, down from $150 million to $200 million it had previously projected. The company had projected that it would drill 16 to 21 wells in the Tuscaloosa Marine Shale region in southwest Mississippi and Louisiana’s Florida Parishes. A spokesman didn’t immediately respond to a request for comment, but the new budget will mean fewer wells drilled. A number of other companies that had been drilling in the region have cut back or pulled out, in part because of high drilling costs per well.
"Oil Drillers Are Going To Die" In Q2, Conway Mackenzie Warns "Expect Outright Liquidations" -- "The second quarter is going to be devastating for the service companies," warns Conway Mackenzie - the largest U.S. restructuring firm - adding that, despite slashing thousands of jobs, delaying (or scrapping) billions in capex amid the prolonged rout in oil prices, "there are certainly companies that are going to die." As Bloomberg reports, oil drillers will begin collapsing under the weight of lower crude prices during the second quarter and energy explorers who employ them will shortly follow with oilfield-service providers are facing a "double-whammy." As we noted here, there are more than a few candidates for this 'death' list as it appears increasingly clear that what was considered an "unambiguously good" narrative for the nation is anything but...
U.S. Shale Boom May Come To Abrupt End -- U.S tight oil production from shale plays will fall more quickly than most assume. Why? High decline rates from shale reservoirs is given. The more interesting reasons are the compounding effects of pad drilling on rig count and poorer average well performance with time. Rig productivity has increased but average well productivity has decreased. Every rig used in pad drilling has approximately three times the impact on the daily production rate as a rig did before pad drilling. At the same time, average well productivity has decreased by about one-third. This means that production rates will fall at a much higher rate today than during previous periods of falling rig counts. Most shale wells today are drilled from pads. One rig drills many wells from the same surface location, as shown in the diagram below: A few charts from the Eagle Ford play will demonstrate why I believe that the shale boom will fall sooner and more sharply than many analysts predict. The first chart shows that the number of active drilling rigs (left-hand scale) in the Eagle Ford Shale play stabilized at approximately 200 rigs as pad drilling became common. The number of producing wells (lower scale), however, has continued to increase. This is because a single rig can drill many wells without taking the time to demobilize and remobilize. In other words, drilling has become more efficient as less time is needed to drill a greater number of wells. The next chart below shows Eagle Ford oil production, the number of producing wells and the number of active drilling rigs versus time. This chart shows that production growth has not kept pace with the rate of increase in new producing wells since mid-2012. That is because the performance of newer wells is not as good as earlier wells. The final chart shows that the rate of daily production is now more dependent on the number of drilling rigs than on the number of producing wells. Rig productivity–the barrels per day per rig–has increased but average well productivity–the barrels per day per well–has decreased. In other words, production can only be maintained by drilling an ever-increasing number of wells.
Scrapped: Oil Prices Shelve an $11 Billion Gulf Coast Project - WSJ: South African energy giant Sasol Ltd. said Wednesday it was shelving an $11 billion project on Louisiana’s Gulf Coast, imperiling one of the largest foreign investments on U.S. soil because of the plunge in oil prices. Sasol has spent years planning to expand its chemical factory outside Lake Charles, La., into a sprawling facility to turn natural gas into industrial compounds and diesel fuel. In October, the company committed $8 billion for equipment that produces ethylene, which is used to make plastics and other products. That plant is still going forward, but Sasol said on Wednesday that a bigger project, to use natural gas rather than crude to make diesel, is on hold. Plummeting oil prices have forced it to push back its own 2016 deadline for deciding whether to build the unusual and expensive plant now that oil prices have fallen from over $100 a barrel to under $50. “This will allow us to evaluate the possibility of phasing in the project in the most pragmatic and effective manner,” Sasol Chief Executive David Constable said in a statement.
Did Obama Forget the BP Oil Spill? - -- After a brief flurry of positive news for environmentalists out of the Obama White House—from a deal with China on reducing greenhouse-gas emissions to a plan to restrict oil drilling in the Alaska wilderness—a news report this week felt like something of a slap in the face: The administration plans to allow offshore oil and gas drilling in the Atlantic Ocean from Virginia to Georgia, beginning two years from now. The move satisfies a long-held desire by many GOP members of Congress, who’d been pushing hard for this big expansion as President Obama’s Interior Department works on a five-year offshore drilling permitting plan that will run from 2017 through 2022. And there had been warning signs that the president would give them what they sought; in July, the administration signed off on oil companies using 250-decibel seismic guns to map the Continental Shelf from Delaware to Florida—despite warnings that the blasts will deafen and even kill marine mammals, interfering with their communications and breeding. As a native son of Louisiana, I’m deeply troubled by Obama’s move. I’ve been an environmental lawyer along the Gulf Coast for a quarter-century. For the last four years, most of my work has been representing fishing boat captains or small business owners whose lives have been turned upside down by the worst offshore drilling disaster in U.S. history: the 5 million barrels of oil that spewed forth from BP’s Deepwater Horizon blowout. I’ve listened to the clean-up workers coping with headaches, nausea, and other ailments from breathing in crude oil or the toxic dispersant used to make the oil “disappear” from the surface of the Gulf. I honestly don’t think America can handle another drilling disaster of the BP magnitude. So how can we move forward on Atlantic drilling when the government has not followed through on its promises to learn from the mistakes that caused the Gulf oil disaster?
Frackdown: Government concedes to national park fracking ban — RT UK: In a victory for the Labour Party and other opponents of fracking, the Conservative-led coalition has announced that fracking will be banned in all national parks. Further restrictive measures were also placed upon shale gas companies. The announcement of new regulations comes as a cross-party group of MPs called for fracking to be banned completely on Monday. Their Commons report was accompanied by an anti-fracking demonstration outside Westminster Palace, attended by Green Party MP Caroline Lucas and campaigner Bianca Jagger. The regulations present a significant U-turn on previous government policy, which Prime Minister David Cameron claimed was going “all out for shale.” Vast areas of national parkland and areas of outstanding natural beauty (AONB) near to groundwater sources will now have a total ban on fracking. The suggestions from the Environmental Audit Committee to ban all future fracking were not passed, but the new measures are expected to halt the development of the UK’s shale gas industry. Prior to the announcement on Monday evening, the regulations stated that fracking was permissible in national parks and AONB under “exceptional circumstances,” but this has now been changed to an “outright ban.”
Tories forced into U-turn on fast-track fracking after accepting Labour plans -- The government made a major U-turn on plans to fast-track UK fracking on Monday after accepting Labour proposals to tighten environmental regulations. David Cameron had previously said the government was “going all out” for shale gas development, but widespread public concern and a looming defeat by worried Tory and Liberal Democrat backbenchers forced ministers to back down. The Guardian revealed on Monday that George Osborne, the chancellor, was demanding “rapid progress” from cabinet ministers, including delivering the “asks” of fracking company Cuadrilla. But the changes accepted by ministers would ban fracking in national parks, areas of outstanding natural beauty and in areas where drinking water is collected, ruling out significant regions of the UK’s shale gas deposits. The new regulations will slow down exploration by, for example, requiring a year of background monitoring before drilling can begin. However, an attempt to impose a moratorium on shale gas exploration, as recommended by a report from MPs, including former Conservative environment secretary Caroline Spelman, was defeated after Labour abstained. The infrastructure bill, which contains the new rules for fracking, now goes to the House of Lords, where further changes could be made.
Petrobras may book $20 billion asset write-down - – Brazilian state-controlled oil company Petróleo Brasileiro SA could take a charge of about 52 billion reais ($20 billion) in its delayed third-quarter results to reduce the value of some assets, a Veja magazine blog said on Monday. The impairment equals 42 percent of the market value of Petrobras , as the company is known, Veja’s Mercados blog said, citing sources close to the company. A Petrobras spokeswoman declined to comment on the report but reiterated the company’s plan to release third-quarter results on Tuesday. On Friday, O Globo newspaper reported that a 10 billion real write-off and a 30 percent cut in capital spending this year were under consideration to help Petrobras preserve cash amid the impact of a contract-fixing, bribery and political kickback scandal. Petrobras faces limited access to financial markets as a result of the scandal and falling oil prices. Petrobras pledged to invest about $44 billion a year under a five-year, $221 billion investment plan announced last year, but it warned in December that it would cut spending.
BHI: Texas anchors 90-unit plunge in US rig count - The US drilling rig count plunged 90 units—a majority of which were in Texas—to settle at 1,543 rigs working during the week ended Jan. 30, Baker Hughes Inc. reported. That total is the lowest since June 18, 2010, and 242 units fewer compared with this week a year ago. The count has now fallen in 9 consecutive weeks, losing 377 units during that time. During the week, 86 of the rigs lost were land-based, which now totals 1,482. Offshore rigs dropped 5 units to 49. Rigs drilling in inland water edged up a unit to 12. Oil rigs plummeted 94 units to 1,223. Gas rigs, meanwhile, continued their upward shift, gaining 3 units to 319. Rigs considered unclassified edged up a unit, representing the only active rig. Horizontal drilling rigs plunged 61 units to 1,168. Directional rigs fell 6 units to 140. Canada’s rig count fell 38 units to a total of 394, 242 fewer than this time a year ago. Oil rigs lost 23 units to 200 and gas rigs fell 15 units to 194. Texas plunged 58 units to 695, the state’s lowest total since Aug. 6, 2010. It now has 147 fewer units compared with this time last year. The dramatic decline reflects a 27-unit drop in the Permian—leading the major US basins—to 454. Also, notably, the Barnett fell 6 units to 19. Oklahoma declined 10 units to 183. The Mississippian fell 9 units to 54. North Dakota and Wyoming each fell 4 units to 143 and 42, respectively. Ohio dropped 3 units to 41. Louisiana, New Mexico, West Virginia each lost 2 units to 108, 87, and 23, respectively. Edging down a unit each, Colorado now has 63, Kansas 22, Utah 14, and Alaska 10. Arkansas is unchanged from a week ago at 12. Pennsylvania and California each edged up a unit to 54 and 16, respectively.
Oil rig count falls by 94 in biggest drop since 1987: Petroleum producers took 94 oil-drilling rigs off the market in the United States this week as sub-$50 oil continued to wreak havoc on the oil industry, Baker Hughes reported Friday. It was the biggest one-week decline for oil rigs since 1987, the earliest year of Baker Hughes data available. That year, the oil industry had faced another oil bust that left hundreds of rigs idle or repossessed by banks, which sold them for scrap. This week’s drop left 1,223 oil units up, the lowest number in three years. In Texas, 58 rigs were taken off the market, cutting the state’s count to 695 rigs. That’s down from 840 at the beginning of this month. All told, the number of oil and gas rigs active in the United States fell by 90 to 1,543, as gas rigs increased by three and one other, so-called miscellaneous rig was propped up. The U.S. offshore rig count declined by 5 rigs, down to 49 units. The decline came a day after the CEO of Helmerich & Payne CEO John Lindsay told investors the Oklahoma-based drilling contractor may have to cut 2,000 jobs in light of the falling rig count.
US Drilling Rig Count at Lowest Point in More Than 5 Years - In the week ended January 30, the total number of rigs drilling for oil in the United States came in at 1,223, compared with 1,317 in the prior week and 1,422 a year ago. Including 320 other rigs mostly drilling for natural gas, there are a total of 1,543 working rigs in the United States, down 90 week-over-week, and down 242 year-over-year. The data come from the latest Baker Hughes Inc. (NYSE: BHI) North American Rotary Rig Count. The number of rigs drilling for oil fell by 199 year-over-year and by 94 week-over-week. The natural gas rig count declined by three to 319 week-over-week and by 39 year-over-year. The two states losing the most rigs were Texas (down 58) and Oklahoma (down 10). North Dakota and Wyoming each lost four and Ohio lost three. California and Pennsylvania were the only states to add to rig counts during the week, and each added just one. In the Permian Basin of west Texas, the rig count dropped 27 to bring the total down to 454; the Eagle Ford Basin in south Texas lost three rigs and now has 178 working; and the Williston Basin (Bakken) has 148 working rigs, down five from the prior week. As of Wednesday, the posted price for Williston Basin sweet crude was just $28.19 a barrel and Williston sour was all the way down to $19.08 a barrel. Eagle Ford Light crude sold for $41 a barrel, the same as West Texas Intermediate (WTI). The difference reflects transportation costs (as well as an adjustment for specific gravity and sulfur content) of around $13 a barrel to get Bakken sweet crude to the U.S. Gulf Coast.
Oil Price Soars, Rig Count Plunges Worst Ever, But Bloodletting Just Beginning - The oil industry is dead-serious when it talks about slashing operating costs and capital expenditures. It has to. Preserving cash is suddenly a priority, after years when money was growing on trees. In the US, the cost cutting has reached frenetic levels. One place where it shows up on a weekly basis is the number of rigs actively drilling for oil. And that rig count dropped by 94 to 1,223 in the latest week, as Baker Hughes reported today. A phenomenal plunge, by far the worst ever. In January, the rig count crashed by 276, the most ever for a calendar month. That’s 18.4%! the rig count is now down 386 from its peak on October 10, by nearly a quarter! And yet, it’s still just the beginning. The chart shows the breathless fracking-for-oil boom that started after the financial crisis. Not included are the rigs drilling for natural gas. That fracking boom had started years earlier and ended in a glut and total price destruction that continues to this day (chart). Note the two-month cliff-dive, the worst ever. During the financial crisis, the oil rig count fell 60% from peak to trough. If this oil bust plays out the same way, the rig count would drop to 642! The bloodletting in the industry would be enormous.
The most important thing to understand about the coming oil production cutbacks -- What the current oil price slump means for world oil supply is starting to emerge. "Layoffs," "cutbacks," "delays," and "cancellations" are words one sees in headlines concerning the oil industry every day. That can only mean one thing in the long run: less supply later on than would otherwise have been the case. But perhaps the most important thing you need to understand about the coming oil production cutbacks is where they are going to come from, namely Canada and the United States. Why is this important? For one very simple reason. Without growth in production from these two countries, world oil production (crude oil plus lease condensate which is the definition of oil) from the first quarter of 2005 through the third quarter of 2014 would have declined 513,000 barrels per day. That's right, declined. Including Canada and the United States, oil production rose just under 4 million barrels per day. That means substantial cutbacks in the development of new oil production in Canada and the United States could lead to flat or falling worldwide oil production. But, why will any oil production cutbacks come primarily from Canada and the United States? For another very simple reason. Post-2005 oil production growth in these countries came from high-cost deposits in Canada's tar sands and in America's tight oil plays. New production from these high-cost resources simply isn't profitable to develop in most locations at current prices.
What’s driving the price of oil down? -- In December I provided some simple calculations of the extent to which a slowdown in the growth of global oil demand may have contributed to the spectacular drop in oil prices since last summer, and I updated those estimates two weeks ago. Some of you have suggested that as conditions keep changing, perhaps I should update those calculations every week. Thanks to the always-helpful Ironman at Political Calculations, I can now go that a step better, and provide eager Econbrowser readers a quick tool they can use to update these calculations on their own on a daily basis, if your heart so desires. The basic idea behind my calculations is the observation that at the same time that oil price has been declining, we’ve also observed big drops in the price of other commodities like copper, the yield on 10-year U.S. Treasuries, and the value of other currencies relative to the dollar. I used a regression estimated using weekly data from April 2007 to June 2014 to summarize the historical correlation between changes in the price of oil and changes in the other three factors. I used the coefficients from that regression to calculate how much of the change in the price of oil in each week since July could have been predicted statistically on the basis solely of changes in copper prices, bond yields, and the value of the dollar, Ironman has put together a little tool you can use to calculate how much of the change in the price of oil between any two dates would be attributed to demand factors with this method. Just input the four prices at your chosen starting date and ending date and press calculate. . If you try it you’ll see the answer is that oil prices would have been expected to fall to $75 a barrel based on changes in demand factors alone since last summer, accounting for a little more than half of the observed decline in the price of oil.
Hedge Funds Bet Oil Will Fall Further - Hedge funds boosted bearish wagers on oil to a four-year high as U.S. supplies grew the most since 2001.Money managers increased short positions in West Texas Intermediate crude to the highest level since September 2010 in the week ended Jan. 20, U.S. Commodity Futures Trading Commission data show. Net-long positions slipped for the first time in three weeks. U.S. crude supplies rose by 10.1 million barrels to 397.9 million in the week ended Jan. 16 and the country will pump the most oil since 1972 this year, the Energy Information Administration says. Saudi Arabia’s King Salman, the new ruler of the world’s biggest oil exporter, said he will maintain the production policy of his predecessor despite a 58 percent drop in prices since June. “There’s been a rush to call a bottom,” “The fundamentals are still stacked against a rebound.”
Oil Slides to Near 6-Year Low; Saudi Arabia Holds Firm Despite Supply Glut - Oil fell from the lowest closing price in almost six years amid signs that Saudi Arabia’s new king will maintain its production policy, bolstering speculation that a global glut will persist. Futures dropped as much as 2.7 percent in New York, extending last week’s 6.4 percent slide. King Salman, who took the Saudi throne on Jan. 23, pledged to maintain the policies of his predecessor. U.S. inventories climbed to the highest level for December since 1930, the American Petroleum Institute reported. Greek voters handed election victory to Syriza, a party that’s pledged to end austerity and renegotiate an international bailout. Oil slumped almost 60 percent since June as the Organization of Petroleum Exporting Countries resisted calls to cut output and the U.S. pumped at the fastest pace in more than three decades. Saudi Arabia, the world’s biggest exporter, has chosen not to reduce supply and counts instead on lower prices to stimulate demand, according to Mohammad Al Sabban, an adviser to the kingdom’s petroleum minister from 1988 to 2013. “All the indications from the Saudis point to no major policy changes,” . “The market’s focus remains on supply that isn’t being met by demand.”
Increasing Demand For Refined Products Will Increase Oil Prices -- In last week’s article I posted a chart from the International Energy Agency’s recent Oil Market Report that shows global demand for refined products catching up to supply by the 3rd quarter of this year. My opinion is that all of the analysts who are now blaming the sharp drop in oil prices on a “glut” of supply could change their tune quickly as consumers adjust to lower fuel costs. Just as higher costs reduce demand for any commodity, lower costs will increase demand. This is especially true for a commodity that has a direct impact on standard of living, like oil does. When the price of gasoline plunged below $1.00/gallon in 1986, demand for motor fuels and other refined products increased by almost 5% within twelve months. Today, world demand for hydrocarbon based liquid fuels (including biofuels) is over 92.5 million barrels per day. You can go to the IEA website and see for yourself that normal seasonal demand is expected to push demand over 94.0 million barrels per day within six months. I think both the IEA and our own Energy Information Administration (EIA) are grossly underestimating the price related demand increase that is already starting to show up in the data. Last week’s EIA report confirms that demand is already surging in the United States. Granted, part of the year-over-year increase in gasoline consumption may be a result of the harsh winter weather we had last year, but I think this story is going to play out. If gasoline prices remain low until this summer, we should see a sharp increase in the number of Americans that decide to take long driving vacations this year. We do love our SUVs.
Why $50 Oil Won’t Last: In the past few weeks I have received numerous questions about the role of a “drop in demand” in the oil price decline. These questions are driven by many stories in the media that have referenced a drop in demand. There are two primary reasons given for this so-called demand drop. One is that years of high oil prices have resulted in reductions in consumption through conservation and improvements in vehicle fleet efficiency. The second reason is due to the strengthening dollar, oil has become more expensive for many countries since oil is generally traded in dollars. There are elements of truth behind both reasons. There has indeed been reduced oil consumption in recent years in most developed regions of the world. It is also true that the dollar has strengthened against many currencies. But despite the rationale that explains this drop in oil consumption, ultimately the data must support the narrative. We have to keep in mind that the developed regions of the world aren’t the entire world. Despite this oft-repeated mantra about falling oil demand, there is no evidence that this is actually true. Last October, the International Energy Agency (IEA) reduced its forecast for 2014 global oil demand growth by 200,000 barrels per day (bpd). Their revised forecast was that global oil demand would only increase by 700,000 bpd from 2013. What has happened is that these reductions in the forecast for oil demand growth or economic growth get mistranslated into forecasts of declining demand. I think we can all agree that if I gained 5 pounds a year each year for the past 5 years, but this year I only project that I will gain 3 pounds — I did not lose weight. I will be 3 pounds heavier than I was instead of 5 pounds heavier.
Plunging Oil Prices Both Underpin and Threaten U.S. Policy Objectives - WSJ: Plunging global oil prices are both underpinning and threatening the foreign policy objectives of the Obama administration and its allies, who face what leaders assembled here described as a dangerous convergence of international crises. Fueling the uncertainty, said U.S., Arab and European officials meeting at the annual World Economic Forum, was the death Thursday of Saudi Arabia’s monarch, King Abdullah —a central player in global energy policy and the fight against international terrorism. Mr. Kerry rallied the world’s business and political elite in Davos to marshal their resources to fight Islamic State and other terrorist organizations that he said posed the greatest collective threat to international order since World War II. “We have to get serious about investing in the things that really make a difference,” Mr. Kerry said, also mentioning the political crisis in Yemen, home to a dangerous al Qaeda affiliate. “And make no mistake: If we don’t make those investments today, we will pay far more for it down the road.”The plunge in oil prices is imperiling the ability of some of Washington’s Arab allies to fight Islamic State, even while the drop also undercuts the terrorist organization’s revenues, according to U.S. and Arab officials. Energy powers Saudi Arabia, the United Arab Emirates and Qatar are part of the five-nation Arab coalition that has joined in U.S. airstrikes against Islamic State in Iraq and Syria. But all three governments have said in recent weeks that their budgets will be constrained with oil prices down to nearly $45 a barrel from over $100 last summer.
Even with low prices, US oil industry pushing for exports - Never mind dropping oil prices. U.S. producers are pushing harder than ever for the right to sell U.S. crude oil overseas. It might seem counterintuitive: Oil prices are as low as they have been at any point since 2009 and the height of the Great Recession, and some say they could drop even further. But oil producers are playing a longer game, betting that long-term demand will be strong and new markets offer lucrative rewards for U.S. producers. Supporters see possible inroads in a Congress controlled by Republicans who generally are considered more receptive to oil exports, as well as some signs that the Obama administration may at least be open to consider changes to longstanding policy, which bans the export of raw crude. The ban was put in place in the 1970s after the OPEC oil embargo led to fuel rationing, high prices and iconic images of long lines of cars waiting to fuel up. The American Petroleum Institute, the oil industry’s top lobbying arm, is running TV ads highlighting the growth of the U.S. shale oil industry as evidence that the there’s enough oil for both domestic and overseas markets. The organization lists overturning the ban as its top priority for 2015. Jack Gerard, the organization’s president, said the policy is the result of “a politically motivated disconnect between today’s much-changed energy landscape and the political orthodoxy of some who continue to push for arbitrary and unfair limits or an outright ban.”
EIA: Record Oil Inventories, Imports at 7.4 million barrels per day - Every week the EIA releases a petroleum status report. I wanted to post an excerpt this week for two reasons: 1) Oil inventories are at a record level for this time of year (see blue line on graph), and 2) the US is a very large oil importer at 7.4 million barrels per day (contrary to some myths). From the EIA: Weekly Petroleum Status Report U.S. crude oil refinery inputs averaged about 15.3 million barrels per day during the week ending January 23, 2015, 347,000 barrels per day more than the previous week’s average. Refineries operated at 88.0% of their operable capacity last week. ... U.S. crude oil imports averaged over 7.4 million barrels per day last week, up by 204,000 barrels per day from the previous week. Over the last four weeks, crude oil imports averaged over 7.2 million barrels per day, 4.8% below the same four-week period last year. ...U.S. commercial crude oil inventories (excluding those in the Strategic Petroleum Reserve) increased by 8.9 million barrels from the previous week. At 406.7 million barrels, U.S. crude oil inventories are at the highest level for this time of year in at least the last 80 years.
Goldman Sachs’s Cohn Says Oil Prices May Hit $30 in Extended Slump - Oil prices will probably continue to decline and could reach as low as $30 a barrel, according to Gary Cohn, president of Goldman Sachs Group Inc. “We’re probably in the lower, longer view,” Cohn, a former oil trader, said Monday in an interview with CNBC. West Texas Intermediate for March delivery fell 44 cents to close at $45.15 a barrel on the New York Mercantile Exchange, the lowest settlement since March 11, 2009. Crude oil has slumped almost 60 percent since June as the Organization of Petroleum Exporting Countries resisted calls to cut output and the U.S. pumped at the fastest pace in more than three decades. Drillers in the U.S. have begun to idle rigs as falling prices make wells aiming to tap shale reserves unprofitable. Cohn, 54, said the commodity business is “very, very strong” because consumers and oil-producing nations are in different positions than they have been in the past few years. “If you’re a consumer today and you can lock in these prices, you’re a lot more aggressive in the markets in hedging than you ever have been,” Cohn said. “The flip side is if you’re an oil-exporting country today and you’re looking at these oil prices and you see a fairly steep forward curve and you see 10 or 15 dollars of price higher a year forward then you do in the spot market, you have to consider trying to lock into that forward price.”
Crude Supplies Surge To Highest Since At Least 1982 -- Remember how exuberant yesterday's small gains in Crude Oil were perceived to be? Yeah - that's all over, with WTI back near a $44 handle - following a large 12.7 million barrel inventory build according to API (EIA reports the 'main event' at 1030ET today - which Saxo Bank warns "a bigger-than-expected build would likely push the mkt over the cliff edge.") Additional weakness overnight is also likely due to Goldman's shift to a 'sell' for the next 3 months. But, as Bloomberg reports, the market is “waiting on the main event of the day, which is the EIA inventory data,” says Saxo Bank head of commodity strategy Ole Hansen. “A bigger-than-expected build would likely push the mkt over the cliff edge, while a not so strong build could be the ammunition the bulls need to trigger some sort of recovery” “The mkt is stuck in a tight range, looking for a breakout, but it is unclear in which direction that breakout will be,” says Hansen. “The mkt is torn between general belief you don’t want to miss the opportunity to buy, while at the same time the fundamentals don’t support the recovery”
Oil dips despite OPEC talk - Oil prices have wavered between gains and losses as traders weighed potentially bullish comments from the Organization of the Petroleum Exporting Countries against ongoing concerns that the market is oversupplied. Oil prices have plunged more than 55 per cent since mid-June on concerns about ample supplies and tepid demand. OPEC decided in November not to lower its output quota, sending prices tumbling lower on the expectation that without intervention from OPEC, it could take months or years for the global glut of oil to shrink. OPEC Secretary-General Abdalla Salem el-Badri said in an interview with Reuters that with prices between $US45 and $US55 a barrel, "I think maybe they reached the bottom and will see some rebound very soon." Prices, which had been trading in the red, turned positive on the news, but then moved lower once again in late trade. US oil for March delivery rose as high as $US46.11 a barrel, up from $US45 a barrel earlier in the day, on the New York Mercantile Exchange. However, prices ended down US44c, or 1 per cent, at $US45.15 a barrel. Brent, the global benchmark, rose from $US48 a barrel to $US49.29 a barrel after the interview was released. Traders again turned bearish in late trade, however, with prices ending down US63c, or 1.3 per cent, at $US48.16 a barrel on ICE Futures Europe.
Bearishness Continues Among Oil Industry Experts: The business world is full of sometimes conflicting theories about what caused the plunge in oil prices during the past seven months, and how low that price will go. But Goldman Sachs seems to have come up with a unified theory. It began late in the afternoon of Jan. 26 when Gary Cohn, the president of Goldman Sachs Group Inc., told the CNBC television program “Closing Bell” that he expected the average price of oil, now around the $45 range per barrel, to fall further, perhaps as low as $30 per barrel. “My view is we’re probably in the lower, longer view,” said Cohn, a former oil trader. “We could definitely get down to $30.” On the same day, Jeff Currie, Goldman’s chief commodity analyst, issued a research paper saying the demand for oil is slowing down in emerging economies, including China, meaning that the price of crude will stay low for a long time, and may never return to the prices they fetched 10 years ago. Related In fact it was Currie who predicted that the price of oil would exceed $100 as it did a decade ago. Now, though, he points to a more recent element in the equation: the surge in shale oil production by the United States.
OilPrice Intelligence Report: Did Saudi Arabia Just Flinch? --As has become the norm, oil markets reacted suddenly to comments by OPEC’s secretary general regarding the possibility of oil reaching $200 a barrel should investment die off due to the current price decline. However, any resurgence (crude futures erased their losses in New York for a time yesterday) was short-lived as news from elsewhere in the space regarding U.S. crude oil reserves and production numbers from around the world, returned market sentiment to normal. At present, the oversupply in the market is estimated at approximately 1.5 million barrels per day. Figures released by the American Petroleum Institute on Jan. 23 showed U.S. inventories reaching their highest December levels since 1930 of 383.5 million barrels. In addition, U.S. production increased by 16 percent to 9.12 million barrels a day, the highest level in a single month since February 1986. A report by the EIA expected on Jan. 28 is expected to show a third consecutive week of growth in U.S. crude inventories. The EIA is predicting consumption by the 34 members of the OECD to drop to 45.6 million barrels a day in 2015. Figures like these, in combination with comments from key oil ministers within OPEC, do little to restore confidence in the markets. Short WTI positions increased by 6,262 contracts to 94,203, net-long positions fell by 3.3 percent to 216,704 with producers increasing their net-short positions by 7,623 to 132,143 contracts. Elsewhere in the markets, bullish bets on gasoline increased by 5.8 percent to 39,418 contracts with futures increasing by 3.5 percent to $1.3128 a gallon. In combination with the spate of recent cuts to capex and employment by many oil majors, with BP opting for a pay freeze in 2015, it is unsurprising that market sentiment is so weary. However, to claim that oil could reach $200 due to a lack of investment is incredibly far-fetched as, even if shale operations continue to be pared back in the U.S., with Canadian tar sands following suit, any oil price rebound to even $100 a barrel would once again make these projects profitable, with supply and demand equilibrium returning quickly given the agility of so many of the major oil companies operating in the U.S,
Oil set for record bear run as OPEC output grows - Oil fell below $49 a barrel on Friday and was on course for its seventh straight month of declines, the longest such bear run on record as a supply glut showed no signs of easing with OPEC increasing production in January. Benchmark Brent crude prices have kept within a band of $45-$50 a barrel since hitting a six-year low on Jan. 13, but analysts have not ruled out further declines as global inventories continue to rise. Supplies from the Organization of the Petroleum Exporting Countries (OPEC) rose in January to 30.37 million barrels per day (bpd), a Reuters survey showed, a sign key members are standing firm in refusing to prop up prices by cutting output. Data this week also showed U.S. crude oil inventories had reached their highest levels since the 1930s. Brent oil futures were down 20 cents at $48.93 per barrel at 1412 GMT (9:12 a.m. ET), while benchmark U.S. WTI futures were down 10 cents at $44.43 a barrel. Brent is on track to post a 14 percent fall for January, marking a seventh month of decline since reaching a peak of around $115 in late June and the longest-running monthly drop since Reuters records started in 1988.
Oil soars on signs US oil companies curtail production - — The price of oil is up 7 percent on indications that production in the U.S. has slowed following the big drop in prices since last June. U.S. oil surged $3.18 to $47.71 a barrel. Baker Hughes reported that the number of rigs drilling for oil in the U.S fell by 94 in the past week to 1,223. That’s down 199 from this time last year. The price of oil plummeted about 60 percent since June as global supplies grew faster than demand. OPEC has declined to cut back on its production, putting pressure on U.S. companies to curtail drilling as oil prices fall to a level that makes some production unprofitable. Futures prices for wholesale gasoline and heating oil also rose sharply, up more than 5 percent.
Former Saudi oil boss says it can cope with low price: Saudi Arabia can cope with low oil prices for "at least eight years", Saudi Arabia's minister of petroleum's former senior adviser has told the BBC. Mohammed al-Sabban said the country's policy was to defend its current market share by enduring low prices. "You need to allow prices to go as low as possible in order to see those marginal producers move out of the market," he said. Mr al-Sabban advised the ministry for 27 years, leaving last year. Saudi Arabia, the largest producer within the Opec oil producers' cartel, has repeatedly said that it will not cut output to try to boost the oil price. Mr al-Sabban said Saudi Arabia's "huge financial reserves" would enable it to cope with the low oil price. The country is now in the process of cutting government spending. Without these cuts, Mr al-Sabban said, Saudi Arabia could not cope with low oil prices for more than four years.
Why Obama and the Saudis Like Low Gas Prices » AEI: Have you heard about the secret conspiracy between the Saudis and the White House? I haven’t either, probably because there isn’t one. But events are playing out exactly as one would expect if such a conspiracy existed. With no help from Barack Obama, the U.S. has launched an energy revolution, becoming the world’s leading oil and natural-gas producer. This has dismayed environmentalists and donors in and out of the Obama administration. After all, Obama bet big — really big — on green energy. The oil and gas boom is not the energy revolution Obama was looking for. Saudi Arabia and other petro-monarchies aren’t happy about it either (which is one reason the United Arab Emirates and other OPEC states bankroll anti-fracking propaganda in the West). Until recently, Saudi Arabia was the world’s biggest oil producer, and it is still arguably the most important one in global markets because its oil is so easy to get out of the ground. The cheaper it is to extract, the easier it is to maintain profits when prices go down. That means the Saudis have an outsized ability to affect the global price of oil. And that’s exactly what they’re doing. “Saudi Arabia,” writes Nathan Vardi of Forbes, “is making a massive $750 billion bet in 2015 that the oil kingdom can endure lower oil prices longer than other major oil producing countries both within and outside OPEC, even including American shale.”
For Saudis, Falling Demand for Oil Is the Biggest Concern - As the world’s oil producers wring their hands over a global glut that’s pushing down prices, evidence is mounting that Saudi Arabia is more concerned about shrinking demand. The world’s largest exporter has chosen not to cut production, counting instead on lower prices to stimulate consumption, said Mohammad Al Sabban, an adviser to Saudi Arabia’s petroleum minister from 1988 to 2013. The Saudis are keeping an eye on investments in fuel efficiency and renewable energy, according to Francisco Blanch, Bank of America Corp.’s head of global commodity research. “Nobody should imagine the world will continue to demand oil as long as you have it in your fields,” Al Sabban said in an interview. “We need to prepare ourselves for that stage.” The U.S. shale revolution showed that forecasts of dwindling world oil supply were premature. It also gave credence to the old adage, attributed to a Saudi oil minister more than 30 years ago, that the Stone Age didn’t end because of the lack of stone. With costs falling for clean energy and international attention focused on slowing climate change, the Saudis are more worried that the world is inching closer to peak demand. Among industrialized countries, that peak was reached 10 years ago, according to the Paris-based International Energy Agency, and fast-developing countries such as India and China won’t become as carbon-intensive, Al Sabban said.
Decapitation Marks the Beginning of Saudi King Salman Reign -- The beheading of a Saudi teacher charged with child sexual abuse has become the first decapitation since the new monarch King Salman bin Abdul Aziz al-Saud took the throne. The online news agency emphasizes that al-Zahrani pleaded not guilty and insisted he was convicted in a "sham trial." His relatives appealed to then King Abdullah, asking him to drop death penalty against Mousa bin Saeed Ali al-Zahrani. In response to their plea, Saudi authorities promised to re-investigate the case carefully. However, on January 23, when the king died, the family of al-Zahrani was notified that in accordance with the new order the teacher would be beheaded on Monday, January 26.
A Saudi Palace Coup - King Abdullah's writ lasted all of 12 hours. Within that period the Sudairis, a rich and politically powerful clan within the House of Saud, which had been weakened by the late king, burst back into prominence. They produced a palace coup in all but name. Salman moved swiftly to undo the work of his half-brother. He decided not to change his crown prince Megren, who was picked by King Abdullah for him, but he may choose to deal with him later. However, he swiftly appointed another leading figure from the Sudairi clan. Mohammed Bin Nayef, the interior minister is to be his deputy crown prince. It is no secret that Abdullah wanted his son Meteb for that position, but now he is out. More significantly, Salman, himself a Sudairi, attempted to secure the second generation by giving his 35- year old son Mohammed the powerful fiefdom of the defense ministry. The second post Mohammed got was arguably more important. He is now general secretary of the Royal Court. All these changes were announced before Abdullah was even buried. The general secretaryship was the position held by the Cardinal Richelieu of Abdullah's royal court, Khalid al-Tuwaijri. It was a lucrative business handed down from father to son and started by Abdul Aziz al Tuwaijri. The Tuwaijris became the king's gatekeepers and no royal audience could be held without their permission, involvement, or knowledge. Tuwaijri was the key player in foreign intrigues -- to subvert the Egyptian revolution, to send in the troops to crush the uprising in Bahrain, to finance ISIL in Syria in the early stages of the civil war along his previous ally Prince Bandar bin Sultan.
Rachel Bronson on King Abdullah’s Death and Its Consequences in Saudi Arabia - Council on Foreign Relations: Abdullah’s greatest contribution to his government, and what will be the most heralded part of his legacy, is the naming of Mohammed bin Nayef as deputy crown prince. This is unprecedented. The passing of power from King Abdullah to King Salman marks the transition to the seventh Saudi king. This is remarkable for any newly formed country—Saudi Arabia was established in 1932—let alone a Middle Eastern nation in the midst of today’s turbulent times. Not only has power yet again transferred peacefully, but the next in line [following King Salman], Prince Muqrin, has already been named. The last six kings have been sons of the first one, King Abdul Aziz, and the biggest challenge was expected to come after Muqrin passed from the scene—when there would be no direct descendants left. Abdullah has avoided that problem with the designation of bin Nayef as deputy crown prince. He is the son of the late Prince Nayef, a son of the founding king. He has been named deputy crown prince and will be the first grandson of the king to rule. This is King Abdullah’s most important act of his tenure.
OilPrice Intelligence Report: New Saudi King Can’t Save Oil Prices -- In recent months, the rhetoric from Saudi Arabia’s oil minister Ali Al-Naimi has been that the Kingdom, home to more than a fifth of the world’s crude oil, would not intervene and instead allow the markets to decide the price of oil. However, traditionally, incoming kings have opted to appoint new ministers to key ministries such as oil and finance. While Al-Naimi has expressed his desire to retire soon, this is not expected until sometime after the June meeting of OPEC, a key catalyst for oil price recovery in 2015. At present, the Saudi budget, which depends on petroleum exports for 85 percent of its annual revenues, balances at around $63 a barrel. This may partly explain Saudi Armaco’s latest decision to diversify its operations by, “investing big in gas,” at a field near Jordan according to its Chief Executive Officer Khalid Al-Falih. With prices hovering around $46 this morning and many predicting a prolonged period of depressed prices, Saudi Arabia will be forced to dip into to its $800 billion dollar cash reserves to handle the largest deficit in its history of $38.6 billion. Meanwhile, two fellow OPEC members are facing their own unique set of challenges. Firstly, Iraq has reportedly lost approximately 50 percent of its revenues from oil exports and has consequently had to boost output to record levels just to stay afloat, according to Bloomberg. Secondly, amid allegations of illegally falsifying Iranian exports as Iraqi by switching ship cargoes off the coast of the United Arab Emirates, Iran is also facing further pressure on its exports from one key trading partner: India. Ahead of President Obama’s visit to India on January 25th, India’s government has asked refiners to cut import numbers from Iran for the next two months in order to maintain year-on-year levels in adherence to the sanctions imposed against Iran.
Can Saudi Arabia Diversify Away From Oil? -- Just off the coast of the Red Sea, about 60 miles north of Jeddah, a massive construction project diverts the eye from an otherwise barren Saudi Arabian landscape. Shiny, modern towers glimmer under the Gulf sun, casting a brief shadow over the empty shipping port and arched gates that boast large billboards of King Abdullah. The project, known as King Abdullah Economic City (KAEC), named after the late king, is one of five planned special economic zones that Saudi Arabia hopes will bring diversity to the Kingdom’s industrial landscape. Scattered along the Red Sea and throughout the Saudi Arabian heartland, each economic city will focus investment in a different industry intended to wean the country off its most precious resource: oil. With oil prices plummeting amid Saudi Arabia’s battle for market share, new industries and economic offerings will help to define the country’s global relevance in the coming decades. Diversity will also provide jobs and opportunities for the 13 million Saudis – about half the population – that are under 25 years old. Attracting global businesses to young cities in the Gulf, however, will require strategic investments and reforms that liberalize the Saudi Arabian operating landscape. The Saudi government envisions the cities, KAEC in particular, as islands of relative liberalism. New economic guidelines would allow for foreign ownership of private companies, accompanied by a streamlined bureaucracy that will reduce turnaround on simple transactions, like visas and customs documents. Relaxed social rules will enhance women’s rights in the cities, cultivating an ambiguous mix of Western and Saudi styles.
Oil Prices Changing The Face Of Global Geopolitics: In a documentary that aired recently on the Canadian Broadcasting Corporation’s popular The Fifth Estate program, an allegory of Vladimir Putin was presented. The wily Russian president was described growing up in a shabby St. Petersburg apartment, where he would often corner rats. Now, punished by low oil prices and Western sanctions against Russian incursions in Ukraine/ Crimea, Putin is himself the cornered rat. Many wonder, and fear, what he will do if conditions in Russia become increasingly desperate. In the last six months oil prices have plunged over 50 percent and the Russian economy is hurting. The country now faces slowing economic growth, a depressed ruble, and runaway inflation estimated to be up to 150 percent on basic foodstuffs. The Kremlin is counting on austerity cuts to help balance its budget, which has revenues coming in at $45 billion lower than earlier projections. The exception, significantly, is defense. With the military exempted from the austerity plan, it begs the question of whether Putin will “play the nationalist card,” such as he did in Crimea, in an effort to strengthen greater Russia during a period of economic weakness.We are already seeing this to be the case. As Oilprice.com reported on Tuesday, Putin is set to absorb South Ossetia – Georgia’s breakaway republic that declared itself independent in 1990. Under an agreement “intended to legalize South Ossetia’s integration with Russia,” Russia would invest 2.8 million rubles (US$50 million) to “fund the socio-economic development of South Ossetia,” according to Agenda.GE, a Tbilisi-based news site.
Oil prices and Nigeria: The north-south divide | The Economist --LOW OIL prices are not good for the Nigerian economy. In its latest forecasts, the IMF's predictions for the Nigerian economy in 2015 have been cut—from over 7% growth to about 5%. The naira, Nigeria's currency, is doing badly. But what are the effects of lower oil in different parts of the country? If new research from two Oxford economists is anything to go by, people in the largely Christian south of the country will do worse than those in the largely Muslim north. The paper looks at the human impacts of oil-price changes. It uses data on 34,000 women between the ages of 15 and 49 taken from the 2008 Nigerian “Demographic and Health Survey” (DHS). Nigeria started producing oil in 1957; the DHS has data on those born from 1958 onwards. The authors compare various measures of well-being to the price of oil in the year that a given person was born. The authors find that in some respects southern ethnic groups benefit most from higher oil prices. Compared to those in the north, dearer oil is linked with an increased likelihood of southern women having a skilled occupation and being in work. Indeed the authors find that economic activity does differentially increase in the south in years of higher oil prices. Why does the south benefit more than the north? It may be because the government, flush with oil rents, increased demand for service-sector industries in the south. But that story seems unlikely: after all, for long periods of the time under investigation the north was politically dominant. The explanation could instead be to do with how northern elites used oil revenue.
Story of the wandering Kurdish tanker finally reaches a conclusion - The oil tanker filled with 1 million barrels of Kurdish crude is finally leaving the coast of Texas and is heading back across the Atlantic with all its cargo still aboard. A report from Bloomberg states that The United Kalavryta is heading to Gibraltar, the British territory on the southern tip of Spain. The ships operator, Kyriakos Maragoudakis, reiterated by email Tuesday that the tanker did not unload any product during its time on the coastal shores of the United States.The tanker found itself in a diplomatic bind lasting six months. In July, the ship turned up on radars close to a Galveston, Texas, port. The potential sale of the Kurdish petroleum left Iraqi officials disgruntled, labeling the cargo “stolen property” and claiming any help to unload the oil would be “in wrongful possession of our client’s crude oil.” In December, Iraq and the Kurds agreed to start selling crude oil cooperatively. At the World Economic Forum in Davos, Switzerland, Iraqi Deputy Prime Minister Rowsch Nuri Shaways claimed the new agreement would allow the two bodies to produce about 550,000 barrels a day more in northern Iraq.
Russia And China’s Growing Energy Relationship -- Russia’s economic freefall and isolation from the West has made it increasingly eager to build its relationship with China, even at the cost of lost leverage with Beijing. But new economic data from China shows that Russia has succeeded in capturing a larger share of the massive – and growing – Chinese oil import market. China’s imports of Russian oil skyrocketed by 36 percent in 2014. The rapid rise in Russian oil exports to China is displacing other sources, such as Saudi Arabia and other OPEC members. The Wall Street Journal reports that China’s oil imports from Saudi Arabia fell 8 percent in 2014, and imports from Venezuela fell 11 percent. The data suggests that Russia and China are finally forging closer trade ties based on energy. They share a massive border, but have been unable to capitalize on what has long appeared to be a well-matched economic opportunity – Russia is a huge energy producer and China is the world’s largest importer of petroleum products. Historic animosity and mutual suspicion had long left a major deal off the table. The sticking point had been price. Years of negotiations over major natural gas trade stalled as each side held out for more favorable terms. However, the conflict in Ukraine and the near-severing of relations between Russia and Europe led to a breakthrough in the Sino-Russian energy relationship – in Beijing’s favor. They agreed to a major natural gas deal in May 2014 that could see Russia export 38 billion cubic meters per year to China beginning in 2018, with the option of ramping those figures up to 60 bcm per year at a later point. Crucially, the two sides appeared to agree on a price in the range of $9-$10 per million Btu (MMBtu), much closer to China’s preferred price point. The exact terms were not disclosed, but China may have even secured a lower price than Europe pays for Russian gas.
Record fall in China industry profits - FT.com: Chinese industrial profits slumped by a record 8 per cent last month, as Beijing’s targeted stimulus efforts failed to arrest a slowdown in the key driver of China’s economy. The fall in profits in December highlights the challenges facing an industrial sector racked by overcapacity and falling prices, adding to pressure on authorities to loosen monetary policy and boost infrastructure spending to cushion the slowdown. The 8 per cent year-on-year drop in profits last month compares with 4.2 per cent in November and is the biggest since the current data series began in late 2011, figures released on Tuesday showed. For the full year, profits rose 3.3 per cent, the slowest growth since at least 2008, when Chinese manufacturers were slammed by the global financial crisis. “As the economy enters the ‘new normal’, the industry sector faces increased downward pressures, unreasonable structures and weak innovation capability,” Mao Weiming, vice-minister at the Ministry of Industry and Information Technology, said at a press conference. While falling prices for oil and other inputs have supported profit margins, the positive impact has been outweighed by falling prices for finished goods, He Ping, a statistician at the bureau’s industrial department, said in a statement accompanying the data.
China lowers its industrial-output target for 2015 - --China has lowered its target for industrial-output growth to around 8% this year from 9.5% in 2014, an official at the industrial ministry said Tuesday. Meeting the target will still be a challenge for the government given China's slowing economy, Zheng Lixin, a spokesman for the Ministry of Industry and Information Technology, said at a briefing. Value-added industrial production rose 8.3% in 2014 from a year earlier, down from an increase of 9.7% in 2013, official data showed. The Chinese economy expanded 7.4% last year, the slowest pace in decades. Excess capacity and the government's efforts to curb environmental pollution have hurt industrial growth and manufacturers' profits. Profit at major Chinese industrial companies was up 3.3% in 2014, down sharply from a growth of 12.2% in 2013, the National Bureau of Statistics said Tuesday.
Chinese Currency Plunges To Peg Limit Against USDollar, Strongest Against Euro In 14 Years -- The drop in the Yuan over the past 2 days is the largest against the USDollar since Nov 2008 as USDCNY nears its highest (CNY weakest) since mid-2012. What is more critical is that for the first time since the new 2% CNY peg bands, USDCNY is trading at the extremes - 11.5 handles cheap to the fix. At the opposite end of the spectrum, the EURCNY just dropped below 7.00 for the first time since June 2001 with the biggest 2-day strengthening of the Chinese currency against the Euro in almost 4 years. It appears the consequences of ECB QE, SNB volatility, and now Greek concerns continue to ripple through the rest of the world.. and at a time when China faces its ubiquitous new year liquidity squeeze, that is not a good sign.
PRC Goes From Devaluing to Defending Yuan - China amassing $4 trillion in foreign exchange reserves by 2014 is an astounding if somewhat mindless feat. Everyone thought that a developing country amassing $1 trillion in reserves was mad; what more four times that amount? It's not because the dollar is tanking at the moment--quite the opposite. Rather, all that money cannot be spent on things that can spur Chinese development like health and education. After all, they are foreign reserves whose previous purpose was to keep the yuan weaker than economic fundamentals would apply to help Chinese export competitiveness. Apparently, with dollar strength causing turmoil in global markets, China is hardly immune. The fear in China is not that it will become the next Brazil or Russia hemorrhaging reserves since it is not quite in as bad a shape. Rather, it is the possibility of a disorderly outflow induced by dollar strength--investors dumping the yuan all of a sudden--that is causing a unique trend after all these years. Instead of keeping the yuan down, Chinese monetary policymakers now appear to have instituted measures to keep the yuan up: After more than a decade of curbing the currency’s gains to help turn the nation into a manufacturing colossus, there are signs the People’s Bank of China is now propping up the yuan to stem an exodus of capital that’s threatening the economy,, A gauge of capital flows on the PBOC’s balance sheet fell by the most since 2003 last month in a sign it’s selling foreign currency, while the yuan’s reference rate set daily by policy makers is at its strongest-ever level compared with the market price. Chinese Premier Li Keqiang said today the nation would implement measures to manage the economy more effectively and boost competition... China amassed a world-leading $4 trillion of foreign-exchange reserves by mid-2014 as exports surged and capital flowed in, attracted by a currency that strengthened for four consecutive years. Now that the yuan’s gains are faltering, the PBOC is trying to prevent its declines from turning into a rout that could deter investment just as the economy suffers its slowest growth in 24 years.
As China's Offshore Yuan Crashes To A 2 Year Low, Beijing Warns Its Citizens: "Don't Buy Dollars" - We won't go into the specific details of China's burst housing bubble, the shady underworld of its pyramid scheme wealth-management products, the fact that any hard asset in China is rehypothecated literally a countless number of times, the nuances of its deflating shadow banking system, or even the complexities of its alleged capital controls (alleged, because as a reminder, they only exist for the common folks - the really wealthy Chinese are naturally exempt from any capital flow constraints). We will point out something even more disturbing. The Offshore Yuan just hit a two-year low, reaching a level not seen since September 2012.
China’s currency war problem won’t just go away -- Pretty obviously — with ECB QE, a presumed resultant euro funded carry trade, and all sorts of central banks rushing to cut rates — there’s some sort of renewed currency war movement going on. And while we’re all ears for arguments about positive-sum outcomes (in a deflationary world), it’s worth remembering those who might struggle to get involved. First from JPM’s Niko Panigirtzoglou (our emphasis): QE can exacerbate so called “currency wars”. From a policy point of view, Denmark’s central bank decision this week to take its deposit rate deeper into negative territory to -0.30%, and the SNB’s decision last week to abandon the defense of its minimum exchange rate vs. the euro and to lower its depo rate to -0.75%, shows how difficult it is becoming for neighboring countries to follow the ECB’s shift towards even easier monetary policy. But the ECB does not pose a challenge only for its closest neighbors. Euro area’s main competitors across EM and DM will feel the pressure from a sharply weaker euro inducing them to ease or tighten by less. In EM, currency wars typically result in FX intervention and accumulation of foreign currency reserves or capital controls in more extreme cases, pushing back DM bond investors back to their own markets. That means Asia and, in particular, China. Poor, currency-war innocent, China. From BNPP’s Richard Iley:Asia ex-Japan is inevitably caught in the increasingly dangerous cross fire of these currency wars. In essence, there are two pernicious dynamics at play. First, those economies with USD pegs – de facto (China) or de jure (Hong Kong) are inevitably directly importing the stronger USD and so are accordingly seeing a dramatic loss of competitiveness vs. the EUR and the JPY. Secondly, with the world likely to remain awash of liquidity for the next 12-18 months, the inevitable normalisation of still permissive global financial conditions is likely to remain impeded.
Yuan Passes Canada Dollar to Rank Fifth for Global Payments - -- The yuan overtook Canada’s dollar to rank fifth for use in global payments, bolstering the case for the International Monetary Fund to endorse it as a reserve currency. The proportion of transactions denominated in yuan climbed to a record 2.17 percent in December, from 1.59 percent in October, the Society for Worldwide Financial Telecommunications said in a statement. Later this year, the IMF will conduct the next twice-a-decade review of the basket of currencies in its Special Drawing Rights that members can count toward their official reserves. The basket currently comprises U.S. dollars, euros, yen and British pounds. “The yuan has a very high chance of being chosen as a reserve currency in the next IMF review,” . “The yuan could even surpass the yen in the rankings this year.” China is the world’s second-largest economy, behind only the U.S., as well as the biggest exporter, and the yuan passed the euro in 2013 to become the second-most used currency in global trade finance. The nation is promoting greater usage of its currency by appointing clearing banks in the world’s financial centers and expanding a program that allows yuan held offshore to be invested in its domestic capital markets. The dollar and the euro remained the two most-used currencies globally in December with respective shares of 44.6 percent and 28.3 percent, according to Swift, a Belgium-based financial-messaging platform. The pound ranked third with 7.92 percent and Japan’s yen was fourth with 2.69 percent.
Currencies Hit as Monetary Policies Shift - WSJ -- A surprise move by Singapore to ease monetary policy sent the city’s currency tumbling to its lowest level in more than four years, the latest action by central banks struggling to cope with a surging U.S. dollar and the threat of deflation. Investors are scrambling to deal with volatile shifts in exchange rates. Currencies have slumped across Asia in recent months as countries from India to China rushed to cut interest rates to fight faltering economic growth. In Europe, the euro is plunging, the Swiss franc has soared and Denmark’s central bank has cut interest rates twice to keep its currency from taking off. As the U.S. economy recovers, bringing closer the day when the U.S. Federal Reserve raises interest rates, the dollar has risen, adding to pressure on other economies. The hope behind the rate cuts elsewhere is that weaker foreign-exchange rates will boost exports, while also pumping up the prices of imported goods to help stave off deflation and counter slumping demand. In Singapore, the central bank changed its policy without holding a regularly scheduled meeting for the first time since October 2001, underscoring policy makers’ apparent desire to act swiftly to counter sliding oil prices and an increasingly uneven global outlook.
South Korea finance minister sees price deflation risk: South Korea’s finance minister warned on Monday of deflation risks and promised to keep prices at an appropriate level, but analysts played down chances of any policy shift in the short term. Bond futures prices pared gains and the won was almost unchanged after Finance Minister Choi Kyung-hwan made the remarks at a scheduled meeting with leaders of the country’s largest industry association. “Regarding the consumer price trends, there are fears of deflation. The government will make efforts to manage prices at certain (appropriate) levels,” Choi said at the meeting with leaders of the Korea Chamber of Commerce and Industry. He did not elaborate on the possible measures. Analysts said the remarks could be interpreted as either pressuring the central bank to consider further lowering interest rates or warning against currency traders betting on a stronger won, but doubted he would make any change in policy
Kuroda remarks open possibilities for shift in BoJ stimulus: Governor Haruhiko Kuroda says the Bank of Japan may need to get creative in any further monetary stimulus. Among options analysts highlight: regional-government bonds, a type of security that could aid public support. Kuroda, speaking in an interview with Bloomberg Television on Friday in Davos, Switzerland, said “there are many options and I don’t think it’s constructive to say this or that could be done.” He reiterated that if inflation expectations are “seriously” affected by disinflation, policy can be changed. The bulk of the central bank’s record asset buying is currently concentrated in debt issued by the national government, yields on which have been pulled down toward zero, even on 10-year notes. BoJ officials had different views on how much capacity there was to expand the purchases, people familiar with the discussions said last month. “This could be a reflection of his thoughts that bond purchases are coming close to their limit because it’s buying almost all of the newly issued bonds each month,” Takahiro Sekido, a strategist at Bank of Tokyo-Mitsubishi UFJ who used to work at the BoJ, said after Kuroda’s remarks. “Options he could take include derivatives and regional bonds. By buying regional bonds, the BoJ could say it’s supporting the government’s efforts to revitalise regional economies.”
Japan Exports Grow Most In Year, Signaling Steady Recovery From Recession: (Reuters) - Japan's exports grew the most in a year in December, helped by a weak yen and a pick-up in overseas demand led by the United States, an encouraging sign for the recession-hit economy even as doubts persist about the strength of global consumption. The 12.9 percent year-on-year rise in exports marked a fourth straight month of growth, supported by shipments of cars to the United States and of electronics parts to China, data by the Ministry of Finance (MOF) showed on Monday. A recovery in exports, which has been a soft spot in the world's third-largest economy, could be a source of comfort for Prime Minister Shinzo Abe, who is battling to re-kindle growth after an April sales tax hike drove Japan into a recession. Still, with the exception of the United States, a largely gloomy global economic outlook has cast a cloud over external demand. The slump in oil prices to below $50 a barrel has also heightened global consumption and deflation concerns.
Japan Logs Record Trade Deficit in 2014 on Weakening Yen - ABC News: Japan's trade deficit ballooned to a record 12.8 trillion yen ($109 billion) last year as a weakening yen pushed the cost of imports higher despite a moderate recovery in exports. Preliminary data from the Finance Ministry released Monday showed Japan's exports rose 4.8 percent to 73.1 trillion yen ($620 billion) in 2014 while imports climbed 5.7 percent to 85.9 trillion yen ($763.7 billion). The trade deficit rose by 11.4 percent from the 11.5 trillion yen ($97.7 billion) gap in 2013. The data show exports from the world's third-largest economy rising nearly twice as fast in the latter half of the year than in the first half, while the increase in imports fell sharply, suggesting the deficit will narrow in coming months. The Japanese yen has weakened over the past year to about 117 yen to the dollar compared with about 100 yen in early 2014. That raises the value of Japan's exports in yen terms. But it also pushes up costs for imports of fuel and food. Japan ran trade surpluses for decades until its nuclear reactors were idled following a disaster at the Fukushima Dai-Ichi power plant in March 2011. Imports of oil and gas rose to compensate for the lost nuclear power capacity.
Japan offers compromise on rice in Asia-Pacific trade talks: Nikkei (Reuters) - Japan has offered to import more rice from the United States in a compromise aimed at pushing forward the Asia-Pacific regional trade talks, the Nikkei reported on Sunday.A stand-off between the United States and Japan over access to farm and auto markets has been holding up negotiations over the 12-nation trade pact, known as the Trans-Pacific Partnership (TPP). The Nikkei business daily, citing unidentified sources, said Japan was offering to increase its tariff-free quota for imported rice and import some "tens of thousands" of tonnes of additional rice from the United States. It plans to maintain existing rice tariffs, it said. true In turn, the United States has dropped its request that Japan ease safety standards on car imports, the report said, adding that such moves were likely to help the two countries reach an agreement in the spring and conclude the TPP deal. U.S. President Barack Obama's top Asia adviser said on Wednesday the administration's goal was to complete the trade pact this year. In his State of the Union address, Obama called on Congress to approve "fast track" authority for big trade agreements with Asia-Pacific and European countries, which allow only a "yes" or "no" vote on the finished product.
Currency Fight Hinders Talks on U.S.-Pacific Trade Deal - WSJ: Concern that some trade partners are manipulating their currencies to gain an export edge has emerged as a major hurdle to the Obama administration’s efforts to move a Pacific trade agreement through Congress. Sharp disagreements over whether rules on currency manipulation should be included in trade deals pit the White House and multinational companies, which oppose such measures, against scores of lawmakers from both parties, labor unions and U.S.-based manufacturers. Critics say a deal under negotiation with Japan and 10 other Pacific countries should include enforceable rules to deter trading partners from directly intervening in currency markets to obtain a trade advantage. Any gains American companies get from the lower tariffs negotiated in trade deals, skeptics fear, could be wiped away if foreign countries take steps to weaken their currencies as they have in the past, making their own products more competitive. The issue is all the more pressing as the U.S. dollar has soared in recent months against most other major currencies. “The 21st-century trade barrier is currency manipulation,” Ziad Ojakli, a Ford Motor Co. vice president, said Thursday at the Washington Auto Show. “This market-distorting practice has the effect of subsidizing foreign exports to the U.S., while blocking American-made products sold overseas.”
Pacific pact nearly ready, says top US trade negotiator: The top US trade official told lawmakers on Tuesday an ambitious Pacific trade pact could be wrapped up within months as he urged Congress to back the administration’s trade agenda. In testimony to congressional committees, US Trade Representative Michael Froman said the administration looked to lawmakers to pass bipartisan legislation allowing a streamlined approval process for trade deals, such as the 12-nation Trans-Pacific Partnership (TPP). TPP chief negotiators are meeting in New York this week and a US negotiator said the talks aimed to close all but the trickiest issues. Some see a mid-March completion date. “We are not done yet but I feel confident that we are making good progress and we can close out a positive package soon,” Froman told the Senate Committee on Finance, adding parties aimed for a deal in a “small number of months.” Still, outstanding issues were “significant.” There was no consensus on how long to protect the exclusivity of biologic drugs and gaps on other intellectual property protections, environmental protection rules, investment and state-owned enterprises, he said. At hearings with the Senate and House committees responsible for trade, both Republicans and Democrats said trade negotiations should seek to stop trading partners from manipulating their currencies. Senator Charles Schumer, a New York Democrat, said he would not support the TPP without action on currencies. Froman said Treasury had the lead on exchange rates and was pushing the issue one-on-one and in international forums. The White House’s plans to seal a trade agreement covering 40% of the world economy and fast-track legislation in 2015 face opposition from some Democrats worried about the impact on jobs at home and some conservative Republicans opposed to giving President Barack Obama more power.
How Trade Agreements Facilitate Short-Term Profits for Multinational Corporations -- In 1997, Canada restricted import and transfer of the gasoline additive MMT because it was a suspected neurotoxin that had already been banned in Europe. Ethyl Corp., the U.S. multinational that supplied the chemical, sued the government for $350 million under the North American Free Trade Agreement and won! Canada was forced to repeal the ban, apologize to the company and pay an out-of-court settlement. The free trade agreement between Canada, the U.S. and Mexico was never designed to raise labor and environmental standards to the highest level. In fact, NAFTA and other trade agreements Canada has signed—including the recent Foreign Investment Promotion and Protection Agreement with China—often take labor standards to the lowest denominator while increasing environmental risk. The agreements are more about facilitating corporate flexibility and profit than creating good working conditions and protecting the air, water, land and diverse ecosystems that keep us alive and healthy. Canada’s environment appears to be taking the brunt of NAFTA-enabled corporate attacks. And when NAFTA environmental-protection provisions do kick in, the government often rejects them.
Obama and Modi to Discuss Ways to Invigorate Trade - When President Barack Obama and Prime Minister Narendra Modi meet this week they will likely discuss how the world’s two biggest democracies can expand their countries’ trade ties. As India’s economy has blossomed in the past decade it has been buying more from America, but its imports from China have grown at a much higher rate. After years as India’s biggest trading partner, the U.S. was dethroned by China in 2007. A look at India’s trade data shows how badly the U.S. is losing to China. From being ranked as India’s 10th most important trading partner in terms of total amount of exports and imports in 2004, China has risen to become India’s top trading partner in less than a decade. India’s merchandise imports from China grew more than ten fold to $51 billion in the year through March, from $4 billion a decade earlier. Over the same period imports from the U.S. into India only quadrupled to $22 billion. Of course China is making more of the things that India’s companies and consumers want and at prices they can afford.“In manufacturing, China has an edge over many countries,” Still, both the U.S. and India think trade between their two counties could be much higher if some barriers could be lowered. India’s total trade with the U.S., including of services and goods, currently stands at about $100 billion. The two countries want to raise that figure to $500 billion. Increasing the opportunities for trade in defense, aviation and nuclear-energy products, where the U.S. has an advantage, will be among the areas of focus during Mr. Obama’s visit.
Three takeaways from Obama's India trip --So what was achieved on this visit? Three signs show growing optimism for this partnership. First, Obama’s visit was marked by strong symbolism. He is not only the first U.S. president to be the chief guest at India’s Republic Day – a grand celebration of India’s democratic constitution and military might – but also the only U.S. president to visit India twice. Obama even moved the date of his State of the Union address just so he could accept Modi’s invitation. Modi’s invitation to Obama signals that India is unafraid to show that a closer U.S.-India partnership is in India’s national interest. Dismissing protocol, Modi received Obama at the airport with a warm bear hug. Both leaders announced a string of agreements, jointly addressed the Indian masses on national radio (another first time for a U.S. president visiting India), and engaged with top business leaders. Finally, the signing of the Delhi Declaration of Friendship clearly highlighted their common goals and commitments. Second, Obama and Modi reportedly broke the seven-year-old impasse on a civil nuclear deal. In 2008, former President George W. Bush and former Prime Minister Manmohan Singh created a landmark in U.S.-India ties by signing a civil nuclear deal that paved the way for India to buy nuclear reactors to produce fuel. With this in hand, India became the only country with nuclear weapons that wasn’t party to the nuclear Non-Proliferation Treaty to be allowed to access civilian nuclear technology from other countries. However, India’s passage of a liability law in 2010 compromised the deal by calling for foreign suppliers to shoulder all risks from potential accidents. Third, Obama and Modi renewed the U.S.-India defense framework agreement for another 10 years. For the first time since its inception in 2012, the Defense Trade and Technology Initiative is set to become fully operational with four distinct projects – including unmanned Raven drones, equipment for C-130 transport planes, and military gear – selected for codevelopment and coproduction..
2017, the Year Indian Growth (Finally?) Beats China's - As per the story of the and the hare, the World Bank is predicting something that's been a long time coming: With China slowing from its years of (reported) double-digit growth year in and year out to focus more on growth quality rather than quantity on one hand and India (hopefully) speeding up with a reformist, pro-market leadership under Nejendra Modi on the other, the World Bank is predicting that 2017 is the year Indian's growth rate moves ahead of China's. See the 2015 Global Economic Prospects from which the chart above is taken from. Onto the story: India, for example, now has a credible central banker [Raghuram Rajan] doing sensible things like tackling inflation. The country's popular new government is finally building infrastructure and cutting the red tape that held the economy back for so many years. If India keeps it up, the World Bank expects its economy to grow 7 percent in 2017, up from 5.5 percent in 2014. Meanwhile, the forecast calls for growth in China to slow as its government reduces spending, tightens credit, and unwinds its housing bubble. The bank expects China's growth to fall from 7.4 percent in 2o14 to a modest 6.9 percent in 2017. There are reasons to believe that the slowdown isn't a temporary blip and that, over the long term, India's economy will ultimately overtake China's. At the moment, both countries are growing so quickly because they're catching up to richer economies. They are shaking off the effects of market isolation, under-educated populations, limited access to technology, poor infrastructure, and regulations that stifled business development. Eventually, when these economies catch up, adding machines won't increase productivity. Then there are the supposed advantages of superior demographics and openness that should see to it that India pulls ahead:
US-India Ties' Impact on Pakistan and Afghanistan; Middle East After Saudi King Abdullah's Death - How will President Obama's India visit change US-Pakistan ties? How will it impact the situation in Afghanistan? What is China's role in Afghanistan? Why are the Afghan Taliban visiting Beijing? How will Saudi King Abdullah's passing change the situation on the ground in the Middle East? Why has the Punjab governor Muhammad Sarwar resigned his position? What's next for him? ViewPoint from Overseas host Sabahat Ashraf (iFaqeer) discusses these questions with panelists Ali H Cemendtaur , Misbah Azam(www.politicsinpakistan.com) and Riaz Haq (www.riazhaq.com)
Militant Attack Plunges Pakistan Into Darkness: Power has been restored to much of Pakistan after more than 140 million people were plunged into darkness due to an apparent rebel attack on a key power line. Up to 80% of the country's population lost electricity in the early hours of Sunday and disruption was reported at Lahore's international airport, but flights were not affected. The power failure, one of the worst Pakistan has experienced, caused electricity to be cut in major cities, including the capital Islamabad. The outage started after midnight when a transmission line connected to the national grid was damaged in an explosion, officials said. Authorities blamed the attack on a separatist group in the Baluchistan province in the country's southwest. "The fault in the system was caused by a main transmission line being blown up in Baluchistan," water and power minister Abid Sher Ali said. A spokesman added: "The blowing up of two power pylons in Naseerabad... created a backward surge which affected the system. It was an act of sabotage."
Lawless Leaders Changing the World - Catherine Austin Fitts -- Financial expert Catherine Austin Fitts says the world is changing through crime by our leaders. Fitts contends, “We are dealing with a lawlessness that is happening with the build out of the global systems, which is very ugly. If you look at what has happened to the Ukraine, so far, over a million people have lost their homes. That’s pretty lawless. The fighting is getting very, very painful. The other thing you have is as people see a power vacuum and the lawlessness of the leaders, they say hey let’s be lawless too. It translates all the way down into our communities. The lawlessness of drug dealing and organized crime is enormous, and it’s happening globally. . . . For markets to function, they require trust in the rule of law. We’ve seen the breakdown in the rule of law.” Fitts predicts that 2015 is going to be “volatile and violent.” Fitts says, “I think 2015 is going to be a very rough year. I think you have to be prepared for wild swings. We’ve seen oil come down 50%.” Fitts also points out, “The creative destructive aspects are pretty scary. The thing that your listeners are struggling with is we’ve been through a lot of change. The change has been painful because the American leadership encouraged the taxpayer to misbehave. . . . I think a lot of people feel they have been left high and dry; and in fact, they have. The reality is if you look at the change we’ve experienced over the last 20 years, it’s nothing compared to the next 10 years. In the next 10 years, the change is going to accelerate. We need to stop and take a big breath, and say I don’t want to be a patsy. I was a patsy in the last 20 years. I don’t want to be a patsy in the next 10 years.”
The Davos oligarchs are right to fear the world they’ve made -- The billionaires and corporate oligarchs meeting in Davos this week are getting worried about inequality. It might be hard to stomach that the overlords of a system that has delivered the widest global economic gulf in human history should be handwringing about the consequences of their own actions.But even the architects of the crisis-ridden international economic order are starting to see the dangers. It’s not just the maverick hedge-funder George Soros, who likes to describe himself as a class traitor. Paul Polman, Unilever chief executive, frets about the “capitalist threat to capitalism”. Christine Lagarde, the IMF managing director, fears capitalism might indeed carry Marx’s “seeds of its own destruction” and warns that something needs to be done. The scale of the crisis has been laid out for them by the charity Oxfam. Just 80 individuals now have the same net wealth as 3.5 billion people – half the entire global population. Last year, the best-off 1% owned 48% of the world’s wealth, up from 44% five years ago. On current trends, the richest 1% will have pocketed more than the other 99% put together next year. The 0.1% have been doing even better, quadrupling their share of US income since the 1980s. This is a wealth grab on a grotesque scale. For 30 years, under the rule of what Mark Carney, the Bank of England governor, calls “market fundamentalism”, inequality in income and wealth has ballooned, both between and within the large majority of countries. In Africa, the absolute number living on less than $2 a day has doubled since 1981 as the rollcall of billionaires has swelled.
Panicked super rich buying boltholes with private airstrips to escape if poor rise up - Super rich hedge fund managers are buying 'secret boltholes' where they can hideout in the event of civil uprising against growing inequality, it has been claimed. Nervous financiers from across the globe have begun purchasing landing strips, homes and land in areas such as New Zealand so they can flee should people rise up. With growing inequality and riots such as those in London in 2011 and in Ferguson and other parts of the USA last year, many financial leaders fear they could become targets for public fury. Robert Johnson, president of the Institute of New Economic Thinking, told people at the World Economic Forum in Davos that many hedge fund managers were already planning their escapes. He said: “I know hedge fund managers all over the world who are buying airstrips and farms in places like New Zealand because they think they need a getaway." Mr Johnson, said the economic situation could soon become intolerable as even in the richest countries inequality was increasing. He said: "People need to know there are possibilities for their children – that they will have the same opportunity as anyone else."There is a wicked feedback loop. Politicians who get more money tend to use it to get more even money." WATCH THE INTERVIEW IN FULL HERE
As inequality soars, the nervous super rich are already planning their escapes --With growing inequality and the civil unrest from Ferguson and the Occupy protests fresh in people’s mind, the world’s super rich are already preparing for the consequences. At a packed session in Davos, former hedge fund director Robert Johnson revealed that worried hedge fund managers were already planning their escapes. “I know hedge fund managers all over the world who are buying airstrips and farms in places like New Zealand because they think they need a getaway,” he said. I know hedge fund managers who are buying airstrips in places like New Zealand because they think they need a getaway Robert Johnson Johnson, who heads the Institute of New Economic Thinking and was previously managing director at Soros, said societies can tolerate income inequality if the income floor is high enough. But with an existing system encouraging chief executives to take decisions solely on their profitability, even in the richest countries inequality is increasing. Johnson added: “People need to know there are possibilities for their children – that they will have the same opportunity as anyone else. There is a wicked feedback loop. Politicians who get more money tend to use it to get more even money.” Global warming and social media are among the trends the 600 super-smart World Economic Forum staffers told its members to watch out for long before they became ubiquitous. This year, income inequality is fast moving up the Davos agenda – a sure sign of it is poised to burst into the public consciousness. Jim Wallis, founder of Sojourners and a Davos star attraction after giving the closing address in 2014, said he had spent a lot of time learning from the leaders behind recent social unrest in Ferguson. He believes that will prove “a catalytic event” which has already changed the conversation in the US, bringing a message from those who previously “didn’t matter”.
Cash for passports: How much it costs to buy a visa - The world is a decidedly unstable place these days. And rich people are rushing to buy passports in search of safe places to shelter their families and their money. Many countries offer so-called golden visas that grant residence permits and, in some cases, citizenship in exchange for sizable investments. The investments are typically made in bonds, property or cash donations to the host government. The programs are luring growing numbers of nationals from the Middle East, China and Russia. And demand is expected to increase as political instability drives rich individuals to seek economic and geographic safety. "Wealthy people are looking for safe places to relocate in case of crisis," said Armand Arton, chief executive of Arton Capital, a company that advises on investor citizenship programs. He said demand is growing by as much as 15% per year, and the threat of ISIS in the Middle East along with international sanctions in Russia will continue to fuel interest. Investors are also lured by the promise of visa-free travel, plus access to education and services. Among the beneficiaries are the U.K., which has seen a record number of applications from Russia as economic conditions in the country deteriorate.
Meet The Extreme Super Rich: A List Of The 80 People Who Own As Much As The World’s Poorest 3.6 Billion -- "Eighty people hold the same amount of wealth as the world’s 3.6 billion poorest people, according to an analysis just released from Oxfam. The report from the global anti-poverty organization finds that since 2009, the wealth of those 80 richest has doubled in nominal terms — while the wealth of the poorest 50 percent of the world’s population has fallen." There you have it. The reason the wealth of the richest has doubled since 2009, is because “it’s not a recession, it’s a robbery.” Central bank and government policy has done this, it is no accident.
Secrets of modern mercenaries: Inside the rise of private armies - The private military industry has surged since the end of the Cold War and is now a multibillion-dollar business. Today’s military firms are sophisticated multinational corporations with subsidiaries around the world and quarterly profit reports for investors. These companies are bought and sold on Wall Street, and their stocks are listed on the London and New York exchanges. Their boards consist of Wall Street magnates and former generals, their corporate managers are seasoned Fortune 500 executives, and their ranks filled with ex-military and law-enforcement personnel recruited from around the world. They work for governments, the private sector, and humanitarian organizations. The industry even has its own trade associations: the International Stability Operations Association (ISOA) in Washington, D.C., the British Association of Private Security Companies in London, and the Private Security Company Association of Iraq. Despite the surfeit of coverage in recent years, the industry remains confusing, because it is notoriously impervious to outside investigators. Consequently, little is known about how and why these private military actors exist.
Missing Mexico students murdered and incinerated, says attorney - Mexican attorney general Jesus Murillo Karam has said there is "no doubt" that the 43 Mexican students who went missing in September were killed and incinerated. He said the students had been mistaken for a rival gang. Jesus Murillo Karam said at a press conference on Tuesday that his announcement was based on 386 declarations from interviewees, 16 police raids and two reconstructions. "The evidence allows us to determine that the students were kidnapped, killed, burned and thrown into the river," Murillo Karam said. Contrary to claims made by the missing students' families, Murillo Karam added that "there is not a single shred of evidence that the army intervened ... not a single shred of evidence of the participation of the army."
Canada Just "Revised" All Of Its 2014 Job Gains 35% Lower -- Who can forget the farce conducted by Canada's labor statistics office back in August when, as we reported, "Canada Releases Atrocious Jobs Data; Then Revises It Above The Highest Estimate Following Public Outcry." It was then that we got our first hint that when it comes to massaging data, Canada is on par with China and even the US. Well, Statistics Canada just outdid itself moments ago when it reported that those 185,700 jobs gains it had previously reported for all of 2014... well, it was only kidding, and after a second look, the number has been revised a whopping 35% (!) lower to only 121,300. How long until a lightbulb goes over the BLS' head and the US department of seasonal adjustments decides to do the same?
Brazil's Economy Is On The Verge Of Total Collapse -- Today's Brazilian economic data follows up quite well to our article from a month ago "Brazil's Economy Just Imploded" and as the earlier article on the crashing Brazilian Real hinted, things for the Brazilian economy how gone from imploding to, well, worse because not only did the twin fiscal and current account deficits rise even more, hitting a whopping 11% of GDP - the worst since August 1999, but its government debt soared to 63.4% in 2014, up from 56.7% a year ago, and the highest since at least 2006. In short - the entire economy is now on the verge of total collapse.
Did Argentina ‘Default’? -- A US court ruling has warped the otherwise precise meanings of three key words – “republic”, “sovereign”, and “default” – leading to absurdities like a New York district court holding the Republic of Argentina in “contempt of court”! The entire understanding of sovereign debt and its restructuring is being read through private “contract law” that cannot address the complex questions that are inherently public in nature, à la questions around restructuring Argentina’s debt. It appeared that a misreading of key words could benefit some vulture funds, but so far no one has seen as much as a penny! Maybe they never will.
Baltic Dry Index: 666 - Forget The Hindenburg Omen and The Hilsenrath Omen, today we have the real deal as The Baltic Dry Index hits the ominous 666 level - the lowest print for this time of year on record. Of course, just like with oil - this is brushed off as over-supply (not under-demand) and we are sure someone will opine how positive this drastic deflation of shipping rates is for global business... but still - this is the lowest print since September 2012 (and practically the lowest since the recession).
World Prices - The problem of deflation is not just a concern for fans of American Football. It has been troubling economists and financial market observers since Japan slipped into deflation in their lost decade of the 1990’s and the concern has become more pronounced as the European Economy, particularly the Eurozone, has struggled to escape from a lost decade of its own following the financial crisis of 2007-2009 and has been on the brink of deflation – a sustained fall in the price level – for the past few years. Now, with commodity prices falling and the European Economy in continued stagnation, the ECB has finally decided to undertake some serious monetary stimulus in the form of large scale purchases of sovereign debt, as has been done in most of the other major economies of the world over the past few years. Their goal is to stimulate their stagnant economy, improve their competitiveness by lowering the value of the Euro relative to the dollar, and stave off deflation. In a global economy domestic policy actions have ripple effects, sometimes large ones, on other economies. If countries were all trying to improve their competitiveness at once it can look like a currency war or at least be confusing.The U.S. Bureau of Labor Statistics recent release showed the U.S. CPI declining at the end of 2014 raising the issue of downward price pressures in the U.S. Not all of this was a reflection of declining energy prices – they have been falling rapidly in the past year – because core inflation, excluding food and energy, has been falling as well. What is going on with world prices and how does it impact the U.S. economy? Since the economy is recovering well as we have documented in previous posts, the pressure on the Federal Reserve to normalize monetary policy and begin raising interest rates should come about largely because of concerns about inflation. But, the current environment is one in which the struggles of some our most important trading partners has incentivized them to push the value of their currencies down, lowering import prices in the U.S. but also stimulating capital inflows to the strong U.S. economy. First, lets look at prices in a collection of important economies. The picture below shows the broad CPI or equivalent for Japan, the U.S. and some key European economies.
S&P cuts Russia to junk, outlook negative - Standard & Poor's Ratings Services on Monday lowered Russia's long-term foreign currency rating to a junk grade of BB+ from BBB-. "Russia's monetary policy flexibility has become more limited and its economic growth prospects have weakened," said S&P in a statement. Russia's ability to shield the economy from external shock and fiscal instability have also been compromised, it added. The outlook on the rating is negative. S&P also downgraded the country's short-term foreign currency rating to B from A-3.
What Does Russia’s Junk Rating Mean? - S&P said Russia's weaker economic prospects justified the decision to cut the credit rating to below investment grade. The action on sovereign debt will be followed by many other downgrades of Russian corporate bonds and banks. In addition, it is likely other rating companies will follow S&P's lead. By excluding investors who are restricted from buying junk bonds -- such as investment-grade only corporate funds and some core bond investors -- the immediate impact of the downgrade will be to narrow the universe of buyers of Russian debt, especially if other agencies follow suit. The downgrade could also force some existing holders to sell, limiting the appetite of high-yield investors and buyers of distressed debt to step in despite the attraction of wide spreads. The Russian economy is already battling the combined impact of sharply lower oil export revenues, Western sanctions and domestic economic mismanagement. The downgrade is likely to lead to further currency depreciation, capital flight, and could advance the timetable for import and capital controls. The hope is that intensifying economic and financial pressures will convince Putin to reverse course on Ukraine and engage in a more constructive dialogue with the West. The risk, however, is that he will do more of the same – namely by continuing to pursue regional adventures and interference as a means of diverting the Russian public's attention from the imploding economy. That could trigger further Western sanctions on Russia that, in turn, would prompt Russian countersanctions (including on energy supplies to Central and Western Europe). The result would be deeper economic and financial turmoil in Russia, and a return to recession for Europe -- both of which would contribute to a higher risk of global financial instability.
Russian PM vows ‘unrestricted’ response if banned from SWIFT payment system — Russia’s response to a possible cut-off from the SWIFT international banking payment system will be “unrestricted,” Prime Minister Dmitry Medvedev vowed. The West is pushing for hitting Moscow with more sanctions as the Ukraine crisis deteriorates. "We will see what happens, but of course if such decisions are made, I want to note that our economic reaction and generally any other reaction will be unrestricted," the Russian prime minister said on Tuesday, calling on the government to “work out concrete decisions which would help our economy in those conditions.” Calls to disconnect Russian banks from the global interbank SWIFT system came amid the deterioration of relations between Russia and the West, and the introduction of sanctions in response to Moscow’s alleged role in the Ukraine conflict. Thus, last August the UK proposed to exclude Russia from the SWIFT system as a part of sanctions imposed on the country due to the situation in eastern Ukraine. However, SWIFT has said it does not intend to switch Russia off from the system, adding that a number of countries have pressured it to do so. It has insisted it is not joining the anti-Russian sanctions. In October, Belgium-based SWIFT stressed it has “no authority to make sanctions decisions.”
What Would Exclusion From Payment System SWIFT Mean For Russia? -- Discussions among European leaders about new sanctions on Moscow have again raised fears that the SWIFT international payments system might be cut off, a move that experts warn would wreak financial havoc on Russia. The Society for Worldwide Interbank Financial Telecommunication, or SWIFT, is a cornerstone of the world's financial architecture and integral to the functioning of Russia's stock exchanges and its Central Depositary, as well its banks and companies. In 2012, Western countries forced the Belgium-based payments system to cut ties with Iran, a move credited with bringing Tehran to the negotiating table over its nuclear program. The measures under discussion include disconnecting Russia from SWIFT, according to a report in Russian newspaper Kommersant on Monday citing unnamed sources at the U.S. State Department. Using the Belgium-based financial messaging service as retaliation against Russia for its role in Ukraine was floated last summer by Western officials and caused widespread alarm in Moscow. "It will lead to a serious deterioration of the international relationship between the East and the West," Kostin told an audience of investors, officials and journalists Friday, according to the Russian economic news agency Prime. He added that formal diplomatic relations between the United States and Russia could well be severed should Russia be disconnected from SWIFT.
Bank of Russia Cuts Interest Rates - WSJ: —Russia’s central bank unexpectedly cut its key interest rate by two percentage points on Friday, saying a sharp economic slowdown would soon ease inflationary pressures, prompting the ruble to fall. The ruble weakened sharply against the dollar in response to the move, with the dollar jumping to 72 against the Russian currency—the ruble’s lowest level since December. Economists, who had been expecting the central bank to hold rates steady amid surging inflation and continued tensions between Moscow and the West, were surprised by the move. Some said it raised questions about the central bank’s independence after its monetary-policy chief was replaced early this month in the wake of criticism of its handling of last year’s ruble crisis.
John Helmer: Russia’s and Greece’s Fraught New Friendship - Yves here. John Helmer points out that while Greece needs all the friends it can get right now, Russia has never been a great ally of Greece. Another big complicating factor is that Russia already has important commitments to Turkey. But the biggest complicating factor is that Greece's links to Russia are through its oligarchs, which is precisely the class that Syriza has committed to crush. For instance, Yanis Varoufakis in a pre-election interviews put cracking down on oligarchs as a top priority. Similarly, as we noted, that commitment is one of the few reforms that Syriza has proposed that predisposes the Troika towards the new government.
Europe’s addiction to Russian gas: How long before withdrawal symptoms set in? - At first glance, the link between the recent events in the Ukraine (the Maidan protests, the coup and the civil war) and the supply of Russian gas to Europe and the gas contract that Yulia Tymoshenko concluded in 2009 seems improbable. But any event whose workings are hidden from us is bound to seem improbable and inexplicable. The European Union’s Third Energy Package (TEP) also came into effect in 2009. The gist of this document is that it establishes uniform rules for the gas supply system within the EU. All gas purchases must take place on an “entry-exit” basis at the European border. In other words, it creates a sort of single virtual gas buyer able to dictate terms to the seller. The document sets other parameters, but they are all generally based on the idea of unbundling gas suppliers from the EU’s internal infrastructure and retail market, where prices are often more than three times the price of the “entry” price. The stated reason for TEP was the need to enhance competition and reduce costs at the expense of a free flow of gas within Europe. This statement didn’t fool anyone. It was a new instrument that targeted only Gazprom, which is tightly connected to the European system. In the event that Europe adopted unacceptable conditions, suppliers of liquefied natural gas (LNG) could at any time redirect their deliveries. In fact, that is what happened after TEP was adopted. The main flows of LNG left for the Asian markets. Gazprom, whose gas deposits are far from ports and have to be shipped by pipeline, could not pull off this trick. As a result of the adoption of TEP, European gas prices did not fall; in fact they went up. From 2009 to 2013, the price of gas in the EU rose by an average of 29% to 30%. At the same time, the average price of Russian gas fell from US$410 per thousand cubic metres in 2008 to US$385 in 2013. And the volume of gas increased.
Lies And Deception In Ukraine’s Energy Sector: The Ukrainian government has repeatedly claimed it is doing its best to improve the oil and gas investment climate, but official statements are the opposite of the reality, as Prime Minister Arseniy Yatsenyuk is leading the great deception. According to Prime Minister Yatseniuk, Ukraine has taken a number of important steps to reform the energy sector, and has even achieved success in the formidable fight against rampant corruption, as well as signed open and transparent contracts for purchase of the natural gas from EU member states. Now he claims Ukraine is looking forward to Western companies' investment in Ukraine's gas transportation system. "I would like to point out where we have succeeded: we have succeeded in overcoming corruption in the energy sector. Billions of dollars, which previously used to flow into the pockets of Ukrainian oligarchs, are now being brought out of the shadows. At present, Ukraine purchases gas under transparent and open contracts with European companies," Yatseniuk recently told a joint press conference with German Chancellor Angela Merkel in Berlin. Even the President has made misguided and naïve statements this past week in Davos, declaring that “…Ukraine will build new ways for receiving Norwegian gas and gas from Europe, and Ukraine will also produce shale gas."The stark reality is that these official statements are in no way reflected by government action, and the gas market players in Ukraine recognize the deception as does the energy industry as a whole. The real story is that while gas has been received from Norway in reverse flows, Ukraine’s current energy strategy, taxation and fiscal regime has forced Ukraine’s current producers of oil and gas to stop drilling new wells and curtail production.
Conscription of People, Cars, Businesses in Ukraine for Mindless Slaughter; Entire Villages Leave to Avoid Servitude; Hop on the Bus Gus - Forced military conscription (slavery is a better word) imposed on citizens of Ukraine has reached new heights recently. The government in Kiev now demands those forced into slavery to hand over their cars for military use. As one might expect, avoidance of needless military slaughter has also reached new heights. Before we get to those stories, I have a video to share. It is in Russian, but with English subtitles. I am told by reader Jacob Dreizin the translation is essentially correct, but a couple things were translated too literally. I do offer this warning. The video is graphic and it does contain a lot of harsh language. The video is about captured Ukrainian POWs on a fool's mission to retake the Donetsk airport. After about 12 minutes or so it gets gruesome, the beginning is not so bad. Warning aside, I recommend watching the video, entirely. Watch the scenes where locals confront the Ukrainian POWs. The video accurately portrays Ukrainians fighting Ukrainians, not Ukrainians fighting Russians.
Near-zero rates and QE look to be here to stay -- It has been a big week for monetary policy, led of course by the European Central Bank’s €1 trillion-plus quantitative easing (QE) programme but also here, with the two hawks on the Bank of England’s monetary policy committee having unexpectedly flown into the dovish nest. The only big central bank that seems to be on track to raise interest rates this year is the Federal Reserve, with the markets expecting a move from the summer onwards. Even that may be a movable feast, however. On Wednesday the Bank of Canada, admittedly managing monetary policy in an economy vulnerable to oil price falls, surprised markets by cutting its main interest rate from 1% to 0.75%. There are a few things you need to know about eurozone QE, announced on Thursday by the ECB president Mario Draghi. The headline announcement of €60bn (£45bn) a month of asset purchases from March until at least September next year was a bit bigger than the markets were expected. The total size of the programme announced is €1.08 trillion, but about a third of that will be in assets other than eurozone government bonds, mainly private assets such as covered bonds and asset-backed securities. Only 20% of the programme is what you might call unconstrained or pure QE, in which Europe collectively covers the losses if the assets bought fall below their purchase price. The rest will be undertaken by national central banks and any losses will be the responsibility of the taxpayers of the countries concerned. This was to meet German concerns that the citizens of Hamburg or Heidelberg should not be responsible for losses on Italian or Spanish bonds. Will it work? It goes without saying that the eurozone’s problems go deep, and that supply-side reforms. Including more flexible markets, are essential, as well as infrastructure investment and growth-friendly tax policies. It may be that no amount of QE can rescue a flawed system.
Draghi Is "Bouncing Economic Rubble With Trillion-Dollar Debt Missiles" -- Someday, maybe, these central banks will find that secret formula that unlocks the commanded utopia from its monetary prison, but I think it more like what led to the end of the first Gulf War, where continued air raids upon Iraqi positions amounted to destroying rubble. As Colin Powell put it, “we were bouncing rubble with billion-dollar missiles.” That seems to be a fitting, paraphrased description of the European state of monetarism, bouncing economic rubble with trillion-euro debt missiles.
Dutch Central Bank Head Says He Doesn’t Support ECB Bond Purchases - Dutch central bank president Klaas Knot said Sunday he didn’t support the European Central Bank’s new bond-buying program. Mr. Knot, who sits on the ECB’s Governing Council, said in an interview on Dutch television that he wasn’t convinced of the “necessity and effectiveness” of the program, known as quantative easing. “Even if you believe it worked [in the U.S.], you cannot project its alleged success onto the eurozone,” he said on the talk show “Buitenhof.” The ECB said Thursday it plans to buy more than EUR1 trillion $1.13 trillion) of public- and private-sector bonds by the fall of 2016, in a landmark attempt to combat ultralow inflation and economic stagnation in the eurozone. Mr. Knot and German central bank chief Jens Weidmann have been vocal critics of the program.
"QE Benefits Mostly The Wealthy" JPMorgan Admits, And Lists 8 Ways ECB's QE Will Hurt Everyone Else -- Over the past 48 hours, the world has been bombarded with a relentless array of soundbites, originating either at the ECB, or - inexplicably - out of Greece, the one place which has been explicitly isolated by Frankfurt, that the European Central Bank's QE will benefit everyone. Setting the record straight: it won't, and not just in our own words but those of JPM's Nikolaos Panigirtzoglou, who just said what has been painfully clear to all but the 99% ever since the start of QE, namely this: "The wealth effects that come with QE are not evenly distributing. The boost in equity and housing wealth is mostly benefiting their major owners, i.e. the wealthy." Thank you JPM. Now if only the central banks will also admit what we have been saying for 6 years, then there will be one less reason for us to continue existing.
The Lemmings of QE - Stephen S. Roach - – Predictably, the European Central Bank has joined the world’s other major monetary authorities in the greatest experiment in the history of central banking. By now, the pattern is all too familiar. First, central banks take the conventional policy rate down to the dreaded “zero bound.” Facing continued economic weakness, but having run out of conventional tools, they then embrace the unconventional approach of quantitative easing (QE). The theory behind this strategy is simple: Unable to cut the price of credit further, central banks shift their focus to expanding its quantity. The implicit argument is that this move from price to quantity adjustments is the functional equivalent of additional monetary-policy easing. Thus, even at the zero bound of nominal interest rates, it is argued, central banks still have weapons in their arsenal. But are those weapons up to the task? For the ECB and the Bank of Japan (BOJ), both of which are facing formidable downside risks to their economies and aggregate price levels, this is hardly an idle question. For the United States, where the ultimate consequences of QE remain to be seen, the answer is just as consequential. QE’s impact hinges on the “three Ts” of monetary policy: transmission (the channels by which monetary policy affects the real economy); traction (the responsiveness of economies to policy actions); and time consistency (the unwavering credibility of the authorities’ promise to reach specified targets like full employment and price stability). Notwithstanding financial markets’ celebration of QE, not to mention the US Federal Reserve’s hearty self-congratulation, an analysis based on the three Ts should give the ECB pause.
It Will Now Cost You 0.5% To Save Money In Denmark: Danish Central Bank Cuts Rates For Third Time In Two Weeks - When the Danish Central Bank cut rates precisely a week ago, going from NIRP to NIRPer, and pushing the deposit rate from -0.2% to -0.35%, the sense of desperation was already in the air: after all this was already the second rate cut by the Denmark's monetary authority in one week, all in the hope of preserving the peg to the DEK to the EUR. That sense of desperation just hit a fever pitch moments ago, when the Dutch central bank just went NIRPest, and cut rates across the board yet again, and made it even more costly to save money in the north European country, where the Deposit rate has just been cut from -0.35% to -0.5%!
In Denmark You Are Now Paid To Take Out A Mortgage -- With NIRP raging in the Eurozone and over €1.5 trillion in European government bonds trading with negative yields, many were wondering when any of this perverted bond generosity will spill over to other debtors, not just Europe's insolvent governments (who can only print negative interest debt because of the ECB's backstop that it will buy any piece of garbage for sale in the doomed monetary union). In fact just earlier today we, rhetorically, asked a logical - in as much as nothing is logical in the new normal - question: "Who will offer the first negative rate mortgage." Little did we know that just minutes after our tweet, we would learn that at least one place is already paying homeowners to take out a mortgage. That's right - the negative rate mortgage is now a reality.
Owners of Negative-Yield Sovereign Debt Say They’re No Fools - Mike Amey never thought he’d buy bonds from countries like Germany and Switzerland when losses were all but guaranteed. Then again, these are hardly normal times in the bond market. Europe faces a prolonged bout of deflation and signs abound that global growth is weakening as oil plummets. Some clients are more willing than ever to lose a little money in return for the security of government debt, said Amey, a London-based fund manager at Pacific Investment Management Co. Bond prices are now so high that yields on more than $4 trillion of the developed world’s sovereign debt have turned negative. That means investors effectively pay a dozen countries from Germany to France and Japan to borrow. “It’s not a good feeling,” said Amey, whose firm runs the world’s biggest bond fund and is one of the largest investors in nations with negative yields. Others include BlackRock Inc., Deutsche Asset & Wealth Management and Vanguard Group, data compiled by Bloomberg show. The seemingly insatiable demand for only the safest assets underscores the challenge the European Central Bank faces in convincing bond investors it has the wherewithal to jump-start the euro region after consumer prices fell for the first time in five years. Last week, ECB President Mario Draghi pledged to pump 1.1 trillion euros ($1.2 trillion) into the region’s economies by buying public and private debt.
Eurozone Consumers Expect Prices to Fall - The European Central Bank‘s battle to persuade households and consumers that inflation will pick up over coming months and years just got a little tougher. The ECB last week ushered in a new era by launching an aggressive bond-buying program that will flood the eurozone with more than €1 trillion in newly created money. Consumer prices started to fall from their year-earlier levels in December, and that will likely continue until midyear, if not later. What the ECB fears most of all is that consumers and businesses will grow accustomed to falling prices, and adjust their behavior accordingly. Many economists and central bankers believe that falling prices don’t by themselves constitute deflation. For that chronic condition to take root, consumers and businesses have to cut back on spending because they expect prices to fall further, the outcome being a decline in output and employment that pushes prices even lower. In announcing the launch of its program of quantitative easing, ECB President Mario Draghi made it clear that changing expectations was a key goal. “We would believe that the measures taken today will be effective, will raise inflation, medium-term inflation expectations, and basically will address the economic situation in the euro area,” Mr. Draghi said. “You have signaling effects on inflation expectations. This is a quite important channel.” So it’s vital for the ECB to quickly raise inflation expectations. But a monthly survey carried out by the European Commission as the ECB prepared and announced its decision to launch QE had some disheartening news for policy makers. For the first time since early 2010, consumers expect prices to fall over the coming 12 months. And they aren’t alone: whether they are manufacturers, service providers or retailers, businesses also expect their selling prices to decline over the coming year.
Is the Eurozone Spiraling Into Deflation? – The Short Answer - The eurozone’s ongoing battle to bring a period of falling consumer prices to a quick conclusion, and minimize the risk of a slide into a deflationary spiral, suffered a setback in January. So is the currency area about to enter a period of deflation, or will the European Central Bank’s recently announced program of quantitative easing turn the tide? How clear and present is the eurozone's deflation threat? Increasingly clear and present. Consumer prices fell in January at the joint fastest rate since records began in 1997, down 0.6% from their year-earlier levels. Worryingly, the decline has broadened out beyond energy, with prices of manufactured goods also lower, and prices for services rising at a slower pace. This trend will worry ECB policy makers, who want to prevent the fall in oil prices having “second-round effects” as other businesses cut their prices to gain market share and workers settle for lower pay rises. Falling prices, or very low inflation rates, do not deflation make. Economists aren’t worried so much about falling prices as about the threat that consumers and businesses will come to expect prices to continue to fall and will postpone their purchases, pushing prices down further.There is as yet little hard evidence of that kind of behavior in the eurozone. You might think about delaying the purchase of a new car, or other discretionary, big ticket items such as smart phones and smart televisions. But a survey carried out by the European Commission found households were more prepared to make major purchases in January than at any time over the last eight years.
Eurozone, Including Germany, in Deflation; Strange Times for Denmark, Deutschland and EU Eurostat released HICP Harmonized Index of Consumer Prices statistics today. In spite of promising that deflation would not hit again, here we are, and for the second month too. Euro area annual inflation is expected to be -0.6% in January 2015, down from -0.2% in December 2014 according to a flash estimate from Eurostat, the statistical office of the European Union. This negative rate for euro area annual inflation in January is driven by the fall in energy prices (-8.9%, compared with -6.3% in December). Prices are also expected to fall for food, alcohol & tobacco (-0.1%, compared with 0.0% in December) and non-energy industrial goods (-0.1%, compared with 0.0% in December). Only prices for services are expected to increase (1.0%, compared with 1.2% in December).The BBC reports Denmark, Deutschland and deflation: strange times for EU. New official figures from Germany show that prices have fallen, by 0.5%, over the previous 12 months.Meanwhile the Danish Central Bank has cut one of its main interest rates for the second time in a week.It is a rate paid to commercial banks for excess funds parked at the central bank. It was already below zero. Now it is even lower - minus 0.5%.It means banks have to pay to leave money at the central bank, above certain specified limits. Negative interest rates are another example of the strange financial world that has emerged in the aftermath of the financial crisis.
I Do Not Think That Number Means What You Think It Means - Krugman - Steve Rattner has a very puzzling piece in today’s Times. Leave aside the dismissal of the austerity debate — which has, if nothing else, been a dramatic illustration of the immense relevance of macroeconomic analysis — as “simplistic”; Dean Baker has that one covered. What really gets me is this chart: “Losing competitiveness”??? Does Rattner think that a rise in unit labor costs ipso facto means a loss of competitiveness? (By the way, the number for the euro area as a whole is 26 percent for the indicated period; for the US it’s 20 percent.) Is he confusing unit labor costs with relative unit labor costs, which aren’t at all the same thing? Look, all major advanced countries have positive inflation targets, generally 2 percent — whether that target is appropriate isn’t something we need to discuss here. Ordinarily we would expect unit labor costs — the labor cost of producing a fixed amount of output — to rise more or less at the overall rate of inflation. So ULC should rise over time, by 2 percent a year. Over a 14 year period, that means 32 percent. Here’s the picture, with that piece of information added in: What we see is that Italy is somewhat out of line — but the real standout is Germany, which has had much too little wage growth. And this in turn suggests that if we’re looking for the key to European problems, it lies in Germany’s beggar-they-neighbor relative wage deflation — which is indeed a point made by economists like Francesco Saraceno. One thing is for sure: this chart says nothing whatsoever about the role of “anti-business” policies. But hey, maybe I’m being simplistic.
EU reforms to break up big banks at risk - FT.com: Reforms to break up Europe’s big banks are on course to be weakened by pressure from France and Britain for maximum national leeway. The European Commission has faced a wall of opposition from some EU member states and the banking industry since it made proposals last year to force some banks to hive off risky trading activities. Resistance is coalescing around options to defang the regulation. Officials from five of the most sceptical countries — France, the UK, Germany, Sweden and the Netherlands — meet in Riga on Friday to discuss potential compromises. Advocates of structural reforms, including the European Central Bank, are alarmed by ideas to change the blueprint from an EU regulation to a directive, which offers member states more room to interpret the measures in national law. Neither the commission nor the ECB were invited to Friday’s talks arranged by Latvia, holder of the EU’s rotating presidency. Vitor Constâncio, an ECB executive director, has warned that a “patchwork of inconsistent national frameworks” would “increase financial fragmentation across the single market and carry a risk of regulatory arbitrage”, according to EU officials.
Greece elections: outcome may put country on collision course with European Union -- After five punishing years of austerity and recession, Greeks have begun casting their votes in a high-stakes election that could set their battered country on a collision course with the European Union. Final opinion polls on Friday showed Syriza, which has pledged to overturn austerity and renegotiate Greece’s debt mountain, with a lead of between four and seven percentage points over its main rival New Democracy, with one poll putting the radical leftist party 10 points clear. But while it seems clear Alexis Tsipras’s barnstorming alliance of Maoists, Marxists, Trotskyists, Socialists, Eurocommunists and Greens will comfortably see off the conservatives of the prime minister, Antonio Samaras, they are far from certain to win the 151 seats they need to govern alone.
Greece’s solidarity movement: ‘it’s a whole new model – and it’s working’ - Fotiou said a large part of the first stage of a Syriza’s government’s programme – ensuring no family is without water or electricity (in nine months of 2013, 240,000 households had their power cut because of unpaid bills); that no one can be made homeless; that the very lowest pensions are raised and that urgent steps are taken to relieve child poverty, now standing at 40% in Greece – was largely inspired by what the party had learned from its involvement in the solidarity movement. “We’ve gained so much from people’s innovation,” she said. “We’ve acquired a knowhow of poverty, actually. We know more about people’s real needs, about the distribution of affordable food, about how not to waste things like medicines. We’ve gained a huge amount of information about how to work in a country in a state of humanitarian crisis and economic collapse. Greece is poor; this is vital knowhow.” If the first instinct of many involved in the movement was simply to help, most also believe it has done much to politicise Greece’s crisis. In Egalio, west of Athens, Flora Toutountzi, a housekeeper, Antonis Mavronikolas, a packager, and Theofilos Moustakas, a primary school teacher, are part of a group that collects food donations from shoppers outside supermarkets and delivers basic survival packages – rice, sugar, long-life milk, dried beans – to 50 local families twice a month.
Greece’s Radical Leftist Syriza Party Poised to Win Election, Exit Polls Say - Syriza appeared set to win between 35.5% and 39.5% of the vote, trouncing the incumbent New Democracy party, which managed to secure just 23% to 27% of the vote, according to the exit polls whose results were issued immediately after voting booths closed. If Syriza is able to secure more than 150 seats on its own—which the exit polls show is possible—it won’t need coalition partners and will have a freer hand in implementing its platform—something that could lead to ruptures with Greece’s creditors. The polls also showed that voters backed a handful of smaller parties—ranging from the extreme-right Golden Dawn party to the centrist To Potami party—making it unclear whether Syriza would win an absolute majority in Greece’s 300-seat legislature. According to the polls, Syriza was projected to secure between 146 to 158 seats, depending on the final outcome.
Leftists Sweep to Power in Greece - WSJ: Greek voters were set to hand power to a radical leftist party in national elections on Sunday, a popular rebellion against the bitter economic medicine Greece has swallowed for five years and a rebuke of the fellow European countries that prescribed it. With nearly all votes counted, opposition party Syriza was on track to win about half the seats in Parliament. In the wee hours of the morning, it clinched a coalition deal with a small right-wing party also opposed to Europe’s economic policy to give the two a clear majority. “Today the Greek people have written history,” Syriza’s young leader and likely new prime minister, Alexis Tsipras, said in his victory speech late Sunday. “The Greek people have given a clear, indisputable mandate for Greece to leave behind austerity.”A Syriza victory marks an astonishing upset of Europe’s political order, which decades ago settled into an orthodox centrism while many in Syriza describe themselves as Marxists. It emboldens the challenges of other radical parties, from the right-wing National Front in France to the newly formed left-wing Podemos party in Spain, and it sets Greece on a collision course with Germany and its other eurozone rescuers.
Greeks Vote in Austerity Foes, a Major Shift - — Greece rejected the harsh economics of austerity on Sunday and sent a warning to the rest of Europe as the left-wing Syriza party won a decisive victory in national elections, positioning its tough-talking leader, Alexis Tsipras, to become the next prime minister.With 92 percent of the vote counted, Syriza had 36 percent, almost eight points more than the governing center-right New Democracy party of Prime Minister Antonis Samaras, who conceded defeat. The only uncertainty was whether Syriza would muster a parliamentary majority on its own or have to form a coalition.Appearing before a throng of supporters outside Athens University late Sunday night, Mr. Tsipras, 40, declared that the era of austerity was over and promised to revive the economy. He also said his government would not allow Greece’s creditors to strangle the country.“Greece will now move ahead with hope and reach out to Europe, and Europe is going to change,” he said. “The verdict is clear: We will bring an end to the vicious circle of austerity.” Syriza’s victory is a milestone for Europe at a time when continuing economic weakness has stirred an angry populist backlash from France to Spain to Italy, as more voters grow fed up with policies that demand sacrifice to meet the demands of creditors but that have not delivered more jobs and prosperity. Syriza is poised to become the first anti-austerity party to take power in a eurozone country and to shatter the two-party establishment that has dominated Greek politics for four decades.
ΣΥΡΙΖΑ Syriza: According to exit polls the leftist party Syriza clearly won the Greek elections This is important news for all Europeans especially Southern Europeans. The election is a repudiation of austerity. Commands from the European Commission (and the IMF and the European Central Bank) have been met with grumbling but obeyed. Beyond that, the European left has been apologetic for decades. The position seems to me to be that, yes we need to cut social welfare spending and deregulate the labor market. But the right of center parties want to do a bit too much. In fact, labor market deregulation (mostly making it less extremely difficult to fire people) has mostly been enacted by center left governments. An outspoken unapologetic left with massive support seems very new, although it was typical of ,at least, the first four post war decades. I don’t want to try to guess what will happen next. A new Syriza lead government will try to renegotiate Greek debt payments with official lenders, who have mostly taken the risk from foolish banks already. They will resist very strongly. Partly this is a matter of ordo-principle. Partly, they know Spain will be next (and what about Italy?). I am sure there are many people whose assent is needed who wouldn’t mind making an example of Greece. It is also too bad that there will have to be focus on debt renegotiation when, for the rest of the Eurobloc, the issue is stimulus and price level misalignment. The rest of the rest of Europe has to ask Germans to make the sacrifice of paying lower taxes, and, if they are very generous, accepting higher wages. High profile high tension negotiations with a Syriza government will make it even harder to communicate this to ordinary Germans (and it is currently impossible).
Syriza Projected to Win 150 Seats; Coalition Deal Already Agreed; Tsipras Announces "Indisputable Mandate to Leave Austerity.” - With vote counting nearly over, it appears Syriza captured exactly half of the 300 member Greek parliament.That is just one vote short of the majority it needs. However, it has already secured an alliance with Independent Greeks, a party that shares little common ground with Syriza except for its rejection of the austerity measure. The coalition would have at least 162 seats, and that's an allegedly comfortable governing majority in Greece’s 300-seat legislature. I do not rule out other alliances. But holding them all may prove difficult. Certainly this was not the alliance most expected. Can Syriza govern with a majority on some issues and another party on others? Or will it all blow up soon? For now, it's party time, albeit one vote short of an even larger party. Of course, there is always the chance of a party shift. It only takes one shift.
New Greek Finance Minister Vows to Destroy Greek Oligarchy | Democracy Now! (interview and transcript) Yanis Varoufakis is expected to be named as Greece’s new finance minister today. He is an economics professor who once described the EU-imposed austerity measures as "fiscal waterboarding." During an interview on Channel 4 in Britain, he vowed to destroy the Greek oligarchy.
- Yanis Varoufakis: "Freedom of speech in Greece has been jeopardized by this unholy alliance between bankrupt bankers, developers and media owners who become the voice of those who want to sponge and scrounge off everyone else’s productive efforts."
- Paul Mason: "And what will you do to the oligarchy concretely?"
- Varoufakis: "We are going to destroy the basis upon which they have built, for decade after decade, a system and network that viciously sucks of the energy and the economic power from everybody else in society."
Greece's New FinMin Explains "This Is What Happens When You Humiliate A Nation & Give It No Hope" - "This is not blackmail," explains new Greek Finance Minister Yanis Varoufakis, "we simply want to end this seemingly never-ending Greek Crisis." In what must be worryingly calm and simple to comprehend words for Brussels, Varoufakis tells CNBC's Michelle Caruso-Cabrera, "this is what happens when you humilate a nation and don't give it any hope." Carefully noting that membership in the Euro is not imperative, Varoufakis concludes "bankruptcy cannot be dealt with by borrowing more," asking rhetorically, "how can I look the German and Finnish taxpayer in the eye and tell them you know I can't really pay you the money I have already borrowed from you..." but lend me more so I can pay back the ECB?
Media Demonization of Syriza: Pretending that Neoliberalism is Popular and Mainstream -- Yves Smith -- We’re having two posts on the Greek elections tonight, since the media accounts are so slanted as to merit discussion. The notion that a democratically elected government would put broad social interest over continued, self-destructive sacrifices to financiers and their allies in European governments is so threatening that a large swathe of media outlets seem almost to take visceral offense at the idea. Editors and writers are thus serving as vocal enforcers of keeping the Overton Window locked in its present, far right position. As Christopher D. Rogers said in comments yesterday: What the “fuck” does the BBC coverage of the Greek election think it is doing and what bloody Orwellian-double speak western world am I living in? In its coverage of the momentous events presently taking place in Greece, our bloody wonderful, alleged impartial, BCC reporters are calling Syriza “the radical left Party”. You heard it here folks, Syriza, that 40 years ago would have been to the right of the then UK’s Labour Party, is now a “radical left” organisation, with all the undertones that go with the word “radical.” Having read quite a lot of Yanis Varoufakis’s output over the past 12 months, I’d hardly call Yanis a radical, nor for that matter would I call Mr. Tsipras radical. Syriza is not hot bed of radicalism, and yet the Uk media, much of the European media and obviously your US media are making out that Syriza are a threat not only to Europe, but no doubt the world – which I actually only hope is right, for at long last it seems people are awakening and coming out of the shadows to see the world for what it is and those legacy parties, be they left or right, for what they are. Corporate whores no less. Needless to say, the BBC is not alone in trying to depict Syriza as extremist:
Greek Deposit Outflows Soar In Run-Up To Syriza Victory - Despite all the fear-mongering by Nea Demokratia (ND), Syriza's victory over the incumbent is dramatically larger than expected (exit polls indicate a potential 12 point margin vs 7 point spreads in the run-up). However, as JPMorgan details, the fear-mongery was very evident in bank deposit runs as proxied outflows surge EUR8 billion last week - more than all of December and the rest of January combined...
What Syriza's Sweep Means for Greece and Europe - Mohamed A. El-Erian - The Coalition of the Radical Left, known as Syriza, placed first in the Greek elections today, with at least 36 percent of the vote, according to exit polls. The early parliamentary elections have given Syriza a significant and historic victory that surpasses the market consensus. This is the first time Syriza is in a position to form and lead a government. Its popularity reflects intensifying economic and social frustrations among Greek citizens, including the perception that their long sacrifice hasn't yielded any meaningful gains, let alone any hint of an end to what they see as years of austerity and deprivation. An alternative economic approach was the core of Syriza's electoral campaign. Its program, which rejects austerity and seeks debt reduction, was pursued with vigor by the party's leader, Alexis Tspiras, who frequently took swipes at Germany, including personal attacks on Chancellor Angela Merkel. He argued that the most influential power in the euro zone was too austerity-obsessed in its approach to Greece. This has led to concerns that Greece could exit the euro zone. A so-called Grexit would entail the return of a national currency to replace the euro, losing access to European Central Bank financing windows and, most probably, less financial support from the European Union and the International Monetary Fund. It would also raise doubts about some other countries in the region, leading to a repricing of individual and collective risk factors. An exit from the euro would require the Greek government to counter the immediate threat of significant disruptions, come up with a new medium-term economic vision, strengthen its domestic institutions and pursue a different relationship with European partners that would preserve the country’s access to free trade and certain financing arrangements.
Greece’s Crazy Leftists Have a Good Idea -- Bloomberg editorial - Amid the populist rhetoric that propelled the far-left Syriza party to victory in Greece's parliamentary elections, there's one idea that Germany in particular should take to heart: revive growth in the euro area by giving the hardest-hit countries a break on their debts. Syriza leader Alexis Tsipras, who was sworn in Monday as Greece's new prime minister, has long been calling for a "European debt conference" -- a summit meeting at which the region's leaders would reduce the debilitating obligations of Greece and other financially troubled euro-area governments. Unlike the rest of the party's program, this idea makes sense. Greece has already been granted some debt relief, but not enough to make its fiscal position sustainable. Tsipras is calling for a writedown of about one-third. There's plenty of historical precedent for relief on this scale. One case in particular ought to resonate with German officials, who are among the most steadfast opponents of debt relief. After World War 2, Germany's creditors recognized that full payment of the country's debts would make revival harder and could destabilize the whole of Europe. In 1953, they agreed to forgive about 50 percent of West Germany's debts, and made the rest contingent on economic performance. The creditor countries acknowledged at the time that the debt relief was in their own interests.
Zoning out -- IN 2012 Greece held two elections which might have led to its exit from the euro zone. In the event, that was avoided—a good thing since the costs of a “Grexit” would almost certainly have outweighed any gains, not only for Greece but for the entire currency area. Now yet another election, on January 25th, threatens Greece’s membership of the euro zone. What would Grexit entail this time? And does it make any more sense? The mechanics of Grexit would be straightforward. The change in currencies would be immediate as the government redenominated domestic assets and liabilities into drachma, most likely on a one-to-one basis with euros. The Greek central bank would be severed from the European Central Bank (ECB) in Frankfurt. Instead it would conduct Greek monetary policy, in drachma, through operations with banks whose domestic balance-sheets would now be in drachma, too. Though the starting-point might be parity between a euro and a drachma, the new currency would quickly depreciate. Estimates from the IMF in 2012 suggested that it would fall against the euro by 50%. Such a reduction could spur an eventual economic revival by making Greece more competitive. After Argentina severed its decade-long link with the dollar in 2002, it experienced several years of rapid growth, helped admittedly by a commodity-price boom that played to its strengths as an agricultural exporter. The hope would be that Greece could also exploit its improved competitiveness, especially by attracting more tourists.
Is Greece already seeing some fiscal collapse? - Kerin Hope from the FT reports: A reluctance to pay taxes was much criticised by Greece’s creditors as one reason why the country needed a big international bailout. Now many Greeks are again avoiding the taxman as they bet the radical left Syriza party will quickly loosen fiscal policy if it comes to power in Sunday’s general election.A finance ministry official confirmed on Friday that state revenues had collapsed this month. “It’s normal for the tax take to decline during an election campaign but this time it’s more noticeable,” the official said, avoiding any specific figures on the projected shortfall.However, two private sector economists forecast the shortfall could exceed €1.5bn, or more than 40 per cent of projected revenues for January. File under “In case you had not been paying attention…” And here is Antonio Fatás with a Grexit scenario. That is still not what most people expect, however.
Grexit: it is not the debt, it is the future - A follow up to my previous post now that we know that the Syriza party has won the election. What comes next will not be easy. And it is not because the policies proposed by Syriza are that radical or unreasonable and certainly they are not worse that what has been done in Greece since the crisis started. The real issue is that this is a wake up call for the Euro area (and possibly the European Union). A wake up call that without a consensus on what is the purpose and processes of a monetary union, this will be a failed project. The reality is that so far EMU has been built in an asymmetric way: the ECB was designed as a strong anti-inflation central bank with the Bundesbank in mind and that served a purpose (for everyone including Greece). The strict criteria to enter into EMU (low inflation, low budget deficits) were a great excuse for politicians in some countries to do policies that otherwise they could not have done internally. There was no doubt who was in charge and what was the ideology that prevail when it came to define policies. And that model worked well in times of economic growth when everyone, including Greece, enjoyed the benefits of stability and growth. But the crisis made everyone realized that the model was not perfect, that there was no consensus around economic policy and, more fundamentally, that for monetary policy to function properly we needed some amount of risk sharing, something that no one had been willing to discuss before.
Greece’s fragile primary budget surplus is not much of a bargaining chip - One reason cited [1] for why Syriza will be able to talk tough with the Troika, presuming it wins today, and can form a government, is that it has a healthy [circa 5%] primary budget surplus. That’s the difference between revenues and spending, once we ignore the cost of servicing debt. The hypothesised threat is that the new Greek government renounces the debt and has no more need to borrow from capital markets, taking more in taxes than it spends. However, this is not the whole story. Cut adrift from the Troika, the Greek government does not have the funds to stand behind its own banks. They would be left insolvent by a Greek default [economically, they are already, really]. A run on Greek banks, either prompted by default or the threat of it, could not be stemmed by a credible guarantee of deposits. The primary surplus would fast disappear as the contraction in money, credit and economic activity played out. It’s these events that would precipitate the Greeks ejecting themselves from the euro – there being no legal mechanism currently for the EZ to do that itself – as they scramble to print Drachmas to pay their ongoing liabilities like pensions, government salaries, and social security. And the prospect of self-ejection, done messily and slowly, since the Greeks have none of the requisite infrastructure to pull it off, will reinforce the likelihood of a bank run and capital flight, even if, as JP Koning rightly suggests, the Drachmasation may ultimately fail.
Saxo Bank: The Syriza Victory Is A Disaster For Europe - The Greek election result was worse than expected - the anti-austerity vote is massive, but it could be an empty gesture as Greece in reality has little choice: Comply with the Troika or leave the EUR. Saxo Bank's Steen Jakobsen doubts the latter will happen with the same vote as the Greeks are tired of austerity but not of being European. However, game theory dictates that some solution will be found which is sub-optimal for all parties, but the risk it will take longer than market have nerves for. There remains a consensus that “things will be ok...” but the early comments indicate the positioning is already starting...
How Much Success is Syriza Likely to Have in Ending Austerity? -- Yves Smith -- While the election results in Greece have sent shockwaves through European technocratic elites and have rattled investors, it is not clear how successful Syriza will be in getting big enough changes implemented in Eurozone policies and its own bailout terms to end the humanitarian crisis, rather than just create the sort of bounce off the bottom growth that analysts like to depict as progress. Indeed, once you walk though the likely bargaining positions of the various parties, there is little reason to be optimistic on Syriza’s behalf. Bear in mind that Syriza has yet to make any official statement as to what its negotiating position with the Troika will be. Both presumed prime minister Alex Tsiprias and one of his finance minister candidates, Yanis Varoufakis, articulated bolder positions a year ago, when they were further from power. In the runup to to the election, Syriza has tried to depict itself as an anti-austerity, yet pro Eurozone party. As Jamie Galbraith described it, via Mark Thoma: The Syriza program is a pro-European program. It is, and I think Europe and Europeans, people are committed to the European project, can consider it a great stroke of luck that there has arisen in Greece, and consequently, partly consequently and subsequently, in Spain, as well as in the present government of Italy, a pro-European set of parties, whose objective is change, constructive change, to make the European project viable. The nut of that problem, as we will see, is that while may be a very estimable-sounding position, it may not be as pragmatic as it appears. Greece likely has better odds of winning concessions if it is less reasonable, since the Germans and the even more implacable Fins are convinced that the periphery countries are immoral beggars who deserve to be ground into the dust if they cannot or will not pay their debts. Greece is unlikely to be able to shake the perception in the North that they have the upper hand and can force Greece to heel, giving at most only fairly minor concessions.
Greece must bow to austerity or go bust, says EU - Telegraph: EU will threaten Syriza with the collapse of Greek banks and the prospect of going bust unless Alexis Tspiras signs up to exisiting austerity measures. Eurozone finance ministers will on Monday threaten an end to negotiations on debt relief for Greece unless its new radical Left government promises to honour all existing austerity agreements. Eurozone officials are convinced that the EU holds all the trump cards in the coming clash with Greece's leader-in-waiting, Alexis Tsipras, including the nuclear option of letting Greek banks collapse. They believe Mr Tsipras knows his weakness. The hardline approach will be sugared with offers of flexibility on the detail of austerity measures, and a move to allow Greece more time to meet an end of February deadline for renewal of key EU loans that are keeping the country’s economy afloat. Jeroen Dijsselbloem, the Dutch finance minister who chairs meetings of the Eurogroup, will set out a strategy aimed at playing for time by drawing Syriza into months of talks in the expectation that Mr Tsipras will back down. “There’s certain wriggle room to negotiate, to talk about the form of the adjustment programme,” he told Germany’s Der Spiegel magazine at the weekend. “But just to ask for a credit without having to meet conditions - that won’t work.”
Draghi: Greece's tax burden is below EU average - Greece's tax burden is well below the European average even after rising in recent years, European Central Bank President Mario Draghi wrote in a letter to a Greek lawmaker released on Monday by the ECB. "The tax burden-to-GDP ratio in Greece (including actual social security contributions), at 34.2% in 2013, remains well below both the euro area and the EU-28 average despite some increases in recent years," Mr. Draghi wrote in the letter, dated Jan. 15, to European Parliament member Kostas Chrysogonos. The release of the letter came hours after Greece's far-left Syriza party was swept to victory in national elections on Sunday, riding a wave of public discontent in Greece over the austerity measures they have been forced to endure by their international creditors in recent years. Mr. Chrysogonos is a member of Syriza. In his letter, Mr. Draghi defended the role of the ECB, the European Commission and the International Monetary Fund, known collectively as the "troika" in overseeing Greece's bailout. "The advice provided by the Troika aims at achieving healthy public finances, financial stability, competitiveness and sound economic policies and thereby at creating the conditions for sustainable growth and job creation in the program countries," Mr. Draghi wrote.
The Greek Stand-By Arrangement - Paul Krugman - I went back to the original, May 2010 stand-by arrangement for Greece, to see what the troika was demanding and predicting at the beginning of the austerity push, and how it compares with what actually happened. I quite often encounter people who claim that Greece never really did austerity. I guess this is based on national stereotypes, or something, because the numbers are actually awesome. Here’s non-interest spending as projected in the original agreement versus actual spending since 2010. Because the troika kept increasing its demands, Greek spending has ended up far lower – austerity has been far more intense – than anything envisaged at the beginning. So how can Greece still be in debt trouble? The original agreement assumed a brief, fairly shallow recession followed by recovery – nothing like the reality of depression and deflation. Here’s nominal GDP as predicted versus actual outcome. Naturally, the collapse of GDP reduced revenue and raised the debt/GDP ratio. Oh, and unemployment was supposed to peak a bit under 15 percent, not hit 28. How did they get it so wrong? In the spring of 2010 both the ECB and the European Commission bought fully into expansionary austerity; slashing spending wasn’t going to hurt the Greek economy, because the confidence fairy would come to the rescue. The IMF never went all the way there, but it used an unrealistically low multiplier, which it arrived at by looking at historical examples of austerity while ignoring the difference in monetary conditions. The thing is, we now have essentially the same people who so totally misjudged the impacts of austerity lecturing the Greeks on the need to be realistic.
Ending Greece’s Nightmare, by Paul Krugman -- Alexis Tsipras, leader of the left-wing Syriza coalition, is about to become prime minister of Greece. He will be the first European leader elected on an explicit promise to challenge the austerity policies that have prevailed since 2010. And there will, of course, be many people warning him to abandon that promise, to behave “responsibly.” So how has that responsibility thing worked out so far? To understand the political earthquake in Greece, it helps to look at Greece’s May 2010 “standby arrangement” with the International Monetary Fund, under which the so-called troika — the I.M.F., the European Central Bank and the European Commission — extended loans to the country in return for a combination of austerity and reform. It’s a remarkable document, in the worst way. The troika, while pretending to be hardheaded and realistic, was peddling an economic fantasy. And the Greek people have been paying the price for those elite delusions.You see, the economic projections that accompanied the standby arrangement assumed that Greece could impose harsh austerity with little effect on growth and employment. ... What actually transpired was an economic and human nightmare. Far from ending in 2011, the Greek recession gathered momentum. ... What went wrong? I fairly often encounter assertions to the effect that Greece didn’t carry through on its promises, that it failed to deliver the promised spending cuts. Nothing could be further from the truth. In reality, Greece imposed savage cuts in public services, wages of government workers and social benefits. Yet Greek debt troubles are if anything worse than before the program started.
Greece: Think Flows, Not Stocks - Paul Krugman -- How should we think about the bargaining that may or may not now take place between the new Greek government and the troika? (No bargaining if the troika basically says no concessions.) Most discussion is framed in terms of what happens to the debt. But as both Daniel Davies and James Galbraith point out — with very different de facto value judgments, but never mind for now — at this point Greek debt, measured as a stock, is not a very meaningful number. After all, the great bulk of the debt is now officially held, the interest rate bears little relationship to market prices, and the interest payments come in part out of funds lent by the creditors. In a sense the debt is an accounting fiction; it’s whatever the governments trying to dictate terms to Greece decide to say it is. OK, I know it’s not quite that simple — debt as a number has political and psychological importance. But I think it helps clear things up to put all of that aside for a bit and focus on the aspect of the situation that isn’t a matter of definitions: Greece’s primary surplus, the difference between what it takes in via taxes and what it spends on things other than interest. This surplus — which is a flow, not a stock — represents the amount Greece is actually paying, in the form of real resources, to its creditors, as opposed to borrowing funds to pay interest. Greece has been running a primary surplus since 2013, and according to its agreements with the troika it’s supposed to run a surplus of 4.5 percent of GDP for many years to come. What would it mean to relax that target? It would not mean demanding that creditors throw good money after bad; everyone has already implicitly acknowledged that the debt will never be fully paid at market rates, but Greece is making a transfer to its creditors by running a primary surplus, and we’re just arguing now about how big that transfer will be.
Greek coalition braces for debt showdown as Germany rattles sabre - The new Greece of Alexis Tsipras will run out of money by early March. It will then face a series of escalating crunch points that will end in default and a return to the drachma unless it can reach a deal with EU creditors. Greece must repay €3.4bn to the International Monetary Fund in February and March. Tax revenues have collapsed as Greeks preempt what they hope will be a repeal of austerity taxes. “There is only €1.9bn left in the cash kitty, and the government has spending costs of $2.5bn coming up. Somebody needs to lend the country money soon,” said Megan Greene, from Manulife Asset Management. The Greek media reports that capital flight last week reached €10bn as it became the clear that the amalgam of Maoists, ex-Leninists and radical socialists known as Syriza would win the election. Barclays estimates the outflow at €20bn since early December, roughly 12pc of GDP. The European Central Bank is for now stepping into the breach. Liquidity support for Greek banks spiked to €54bn at the end of December, and is rising fast. If the ECB were to pull the plug, Greece would spiral into a systemic crisis immediately. Yet that could in theory happen as soon February 28 when the temporary extension on Greece’s bail-out package expires. The final drama will occur in July and August when Greece has to repay €7bn to the ECB. “It is absolutely certain that we can’t agree to any debt relief involving Greek bonds held by the ECB. That is legally impossible,” said Benoît Cœuré, an ECB board member.
Schaeuble says there is no question of a debt haircut for Greece (Reuters) - German Finance Minister Wolfgang Schaeuble once again ruled out a debt haircut for Greece on Monday after leftist leader Alexis Tsipras was sworn in as prime minister of a new hardline, anti-bailout government that wants to face down international lenders. "There's no question of a debt haircut," Schaeuble told ARD television. "Greece isn't overburdened by its debt servicing." Schaeuble said the euro zone wants to continue its bailout programme for Greece. "We can't imagine how Greece, without a continuation of this programme, can continue on a reasonable economic path. But the election was just yesterday and the government was formed with remarkable speed. Now we have to give the government the time to make its decision. We're ready to continue the programme but it's Greece's decision."
Greece will not default on bailout debts - PM Tsipras: New Greek PM Alexis Tsipras says his country will not default on its debts. Addressing his first cabinet meeting since Sunday's victory, Mr Tsipras said he would negotiate with creditors over the €240bn (£179bn; $270bn) bailout. "We won't get into a mutually destructive clash, but we will not continue a policy of subjection," said the left-wing Syriza party leader. The EU has warned his government to stick to its commitments. A default could force Greece out of the euro. "As the newly elected leader of the radical left party made his inaugural cabinet speech, Greek government bond yields rose to near record levels - reflecting investors' concerns about short-term risks of a debt restructuring over the coming months. The Greek stock market fell 6.4%. Greece has endured tough budget cuts in return for its 2010 bailout, negotiated with the so-called troika - the European Union, International Monetary Fund (IMF) and European Central Bank (ECB). The economy has shrunk drastically since the 2008 global financial crisis, and increasing unemployment has thrown many Greeks into poverty.
Beware of Greeks remitting cash overseas - FT.com: Shares in all four of the big Greek banks were down more than 10 per cent for a second day on Tuesday, following the election of anti-austerity party Syriza. The appointment of a self-declared Marxist as finance minister would normally be a good excuse for a sell-off, but Greek shares and bonds were being dumped anyway; investors know how to react to a Greek crisis, even if this time they think it will not spread beyond Greece. Yet, Yanis Varoufakis, the new finance minister, is an unusual Marxist who advocates “alliances with the devil (eg the IMF)” in order to save capitalism from itself. There is plenty of scope for Mr Varoufakis and his boss, Prime Minister Alexis Tsipras, to come to a deal with their official creditors, particularly Germany. The austerity demands are clearly excessive, demanding a budget surplus of close to 5 per cent before interest payments. But the focus of Mr Tsipras on cutting the size of the debt — and of German politicians on Greece repaying in full — is daft. Rather than the face value of a loan, it is the total cost of debt and its duration that matter, and also where compromise can be hidden in complexity. Rational discussions could easily be derailed by popular opinion pushing both German and Greek governments to extreme positions. Anti-austerity parties elsewhere in the periphery, particularly Spain, will surely demand equivalent relief, but smart spinning of the deal should avoid the need to repeat. After all, none are suffering anywhere near as much as Greece, where a quarter of the workforce is unemployed. The real danger is that the Greeks themselves lose confidence. There are tentative signs that money is again being sent abroad, as it was in mid-2012. Nikolaos Panigirtzoglou at JPMorgan points out that €350m was sent from Greece to Luxembourg money funds since the start of last week. Extrapolating to all cash flight, he estimates as much as a 10th of Greek deposits may have left already this year. If a Greek bank panic develops it will strengthen the German hand, and make negotiations that much harder.
Europe cannot agree to write off Greece’s debt - FT.com: Syriza have won the Greek election. But, perhaps just as startling, the “far left” party is making considerable headway in the struggle to win over elite opinion in the west. Many mainstream economists and policy makers are so alarmed by the state of the Greek economy that they have come to agree with Syriza’s argument that the only solution is to make a radical cut in Greece’s national debt, which stands at 175 per cent of gross domestic product. “Greece’s debt needs to be right-sized,” one senior anglophone policy maker told me in Davos. “And the Germans should remember they benefited from official debt relief in the 1950s.” Letters from Nobel Prize winners and several opinion pieces in this newspaper have made similar arguments. Unfortunately, an explicit Greek debt write-off would cause more problems in Europe than it solved. Three main negative effects could be expected. First, it would cause a political backlash in northern Europe, which would strengthen far-right and nationalist parties. Second, far-left and anti-capitalist parties would gain credibility in southern Europe and would press for similar debt writedowns, as well as much expanded social spending — something that would lead to a collapse in market confidence. Third, the breakdown in trust between members of the EU that would follow a Greek default — even a negotiated default — would make it much harder to keep the EU together. The focus on the unforgiving stance of Germany raises emotional issues about the second world war — but obscures the fact that almost all Greece’s European creditors take a similar view. It was very hard for politicians in countries such as Finland and the Netherlands to make the case for a bailout of Greece. Their sceptical citizens appeared to suspect that they might never be paid back. (Silly them!) If those fears are now vindicated, the nationalist parties that opposed the bailouts will benefit.
Greece debt repayment in full is 'unrealistic', says Syriza: It is unrealistic to expect Greece to repay its huge debt in full, the chief economics spokesman for the victorious Syriza party has told the BBC. "Nobody believes that the Greek debt is sustainable," Euclid Tsakalotos said. The far-left Syriza, which won Sunday's general election, wants to renegotiate Greece's €240bn (£179bn; $270bn) bailout by international lenders. EU leaders have warned the new Greek government that it must live up to its commitments to the creditors. Syriza leader Alexis Tsipras - who was sworn in as prime minister on Monday - is expected to unveil his new cabinet later on Tuesday. "I haven't met an economist in their heart of hearts that will tell you that Greece will pay back all of that debt. It can't be done," Mr Tsakalotos said. He said that EU leaders needed now to show that they were willing to work with Syriza. "It's going to be a very funny and a very dangerous Europe with very strong centrifugal political forces if they signal that after a democratic vote they're not interested in talking to a new government.
Greek Payback Math at 0% Interest - Greece has something like €315 billion of public debt. Forget about that. Instead focus on liabilities as presented in Revised Greek Default Scenario: Liabilities Shifted to German and French Taxpayers; Bluff of the Day Revisited. The above total is a "modest" €256 billion to be paid back over time.
- Assume 0% interest
- Assume a Current Account Surplus of 3% of GDP
- Assume Greek Debt-to-GDP is 176%
- Assume Greek Debt €312 billion
- Assume Greek GDP is €178 billion
Point 5 is derived from points 3 and 4. The numbers seem to vary a bit depending on the source, but they should be close enough for this exercise. Let's assume that Greece can run a 3% current account surplus for as long as it takes to pay back €256 billion. 3% of €178 billion is €5.35 billion. To pay back €256 billion it would take about 48 years. That assumes 0% interest and a 3% current account surplus every year for 48 years! Those calculations ignore rising GDP. But they also ignore a huge burden on Greek citizens for 48 years. Let's be honest: Greece is not going to run current account surpluses of 3% per year for perpetuity.
The Tyranny of Greece Over Germany - Paul Krugman - That’s the title of a classic book by Eliza Marian Butler arguing that German culture was warped by an obsession with ancient Greece, which has nothing at all to do with the current problems of macroeconomic policy. But the title came to mind when I read Simon Wren-Lewis’s meditation on two different hypotheses about the disastrous 2010 turn to austerity. One hypothesis, as he says, is that it was just bad luck: Greece blew up at the end of 2009, and false analogies with Greece soon dominated policy debate; you can call this Hellenization of discourse the tyranny of Greece, not so much over Germany, as over the OECD as a whole. The other hypothesis is that Greece was simply a useful tool for people who would have turned policy in the wrong direction anyway. If Greece hadn’t happened, they would have found other excuses. Consider, if you will, the fact that Nick Clegg just declared that recent events in Greece are an argument for austerity policies. I’m mostly with the second hypothesis, not just for the reasons Wren-Lewis mentions, but because of what I was hearing in the fall of 2009, pre-Greece: namely, that even within the Obama administration, and despite very low borrowing costs, many officials had managed to convince themselves and each other that the US fiscal position was fragile. Others were hearing the same thing. Greece certainly made their sell easier. But the determination to obsess over the deficit in the face of mass unemployment ran deep.
Thinking About the New Greek Crisis - Krugman -- Markets are panicking. It’s important to understand that this is not a verdict on the new Greek government, or at any rate only the new Greek government; it’s a judgment that the risk of no agreement, and a disorderly breakdown of the whole process, is high. I think it’s important to be as clear as we can about the stakes and the real interests here, lest players stumble into a disaster they could and should have avoided. So, some points about where things stand: We are not talking about whether Greece will pay its debt. As I tried to explain the other day, the headline Greek debt number is more or less meaningless. The question is how much Greece will transfer to its creditors by running primary surpluses — and yes, at this point that’s the question, there’s no possibility that the creditors will transfer more resources to Greece. If Greece were to adhere totally to the previous terms, over the next five years it would make resource transfers of about 20 percent of one year’s GDP. From the point of view of the creditors, that’s a trivial sum. From the point of the Greeks, however, it’s crucial; . If the creditors do play hardball, their leverage does not come from the ability to refuse new loans to the Greek government. With Greece running a primary surplus, all new loans — and then some — are going to pay principal and interest on old loans, with less than nothing going to the Greeks. There was modest de facto aid to Greece in 2010-2012, but no aid is currently flowing, nor will it. Instead, the power of the creditors over Greece comes via the ability to crash the Greek banking system, which is heavily dependent on the ability to borrow at need from the ECB. Cut off that support, and Greece suffers banking collapse. So yes, the creditors have a large club they can use on a recalcitrant Greece. But do they really want to do that? Within a European Union supposedly dedicated to democratic ideals? . Ideals aside, the consequences of playing hardball with Greece over its banks could very easily be immense. Up until now, the euro has proved very durable,largely thanks to the point Barry Eichengreen emphasized: any country that even hinted at the possibility of leaving would face the mother of all bank runs. But as I worried some time ago, this argument becomes moot if the banking system has already collapsed. Grexit — the often speculated about, never so far materializing Greek exit from the euro — becomes a very real possibility if European creditors try to exert leverage by taking away the safety net for Greek banks.
Greek debt and a default of statesmanship - FT.com: Sometimes the right thing to do is the wise thing. That is the case now for Greece. Done correctly, debt reduction would benefit Greece and the rest of the eurozone. It would create difficulties. But these would be smaller than those created by throwing Greece to the wolves. Unfortunately, reaching such an agreement may be impossible. That is why the belief that the eurozone crisis is over is mistaken. Nobody can be surprised by the victory of Greece’s leftwing Syriza party. In the midst of a “recovery”, unemployment is reported at 26 per cent of the labour force and youth unemployment at over 50 per cent. Gross domestic product is also 26 per cent below its pre-crisis peak. But GDP is a particularly inappropriate measure of the fall in economic welfare in this case. The current account balance was minus 15 per cent of GDP in the third quarter of 2008, but has been in surplus since the second half of 2013. So spending by Greeks on goods and services has in fact fallen by at least 40 per cent. Given this catastrophe, it is hardly surprising that the voters have rejected the previous government and the policies that, at the behest of the creditors, it — somewhat halfheartedly — pursued. As Alexis Tsipras, the new prime minister, has said, Europe is founded on the principle of democracy. The people of Greece have spoken. At the very least, the powers that be need to listen. Yet everything one hears suggests that demands for a new deal on debt and austerity will be rejected more or less out of hand. Fuelling that response is a large amount of self-righteous nonsense. Two moralistic propositions in particular get in the way of a reasonable reply to Greek demands. The first proposition is that the Greeks borrowed the money and so are duty bound to pay it back, how ever much it costs them. This was very much the attitude that sustained debtors’ prisons. The second proposition is that, since the crisis hit, the rest of the eurozone has been extraordinarily generous to Greece. This, too, is false. True, the loans supplied by the eurozone and the International Monetary Fund amount to the huge sum of €226.7bn (about 125 per cent of GDP), which is roughly two-thirds of total public debt of 175 per cent of GDP.
Germans Are In Shock As New Greek Leader Starts With A Bang - In his first act as prime minister on Monday, Alexis Tsipras visited the war memorial in Kaisariani where 200 Greek resistance fighters were slaughtered by the Nazis in 1944. The move did not go unnoticed in Berlin. Nor did Tsipras's decision hours later to receive the Russian ambassador before meeting any other foreign official. Then came the announcement that radical academic Yanis Varoufakis, who once likened German austerity policies to "fiscal waterboarding," would be taking over as Greek finance minister. A short while later, Tsipras delivered another blow, criticizing an EU statement that warned Moscow of new sanctions. The assumption in German Chancellor Angela Merkel's entourage before Sunday's Greek election was that Tsipras, the charismatic leader of the far-left Syriza party, would eke out a narrow victory, struggle to form a coalition, and if he managed to do so, shift quickly from confrontation to compromise mode. Instead, after cruising to victory and clinching a fast-track coalition deal with the right-wing Independent Greeks party, he has signalled in his first days in office that he has no intention of backing down, unsettling officials in Berlin, some of whom admit to shock at the 40-year-old's fiery start.
The New Greek Government Arrives In Its Residence: Finds No Power, No Wifi Password And No Toilet Soap -- Things in Greece are bad. So bad, that the outgoing government of Antonis Samaras decided to not only leave the new inhabitants of the official residence of the Greek prime minister, the Maximos Mansion, without power, and without the WiFi password, but they decided to "borrow" all the soap in the toilet as well. More from Spiegel, google translated: "We sit in the dark. We have no internet, no email, no way to communicate with each other", said an employee of the Office, who has worked for various government for years. "That's never happened before." It shows that Samaras' team have "no manners and no decency." Because of blackouts in the Maximos Mansion the official website of the Greek Prime Minister still shows the image and the resume of Samaras - even though since Monday, the left SYRIZA leader Alexis Tsipras is the head of government in Athens. It was the first time that a government handover has been so bitter, said the office staff to SPIEGEL ONLINE. "Everything was seamless and worked under Mr Samaras but he would not let Mr Tsipras benefit." Samaras had already demonstrated in recent days that he is a bad loser. He was absent, as Tsipras arrived after his swearing-in of the Maximos Mansion on Monday. This Samaras broke with tradition: It is common for an outgoing Prime Minister his successor in office sitting welcomes you and wishes him success for the government's work.
Greece's fight against "fiscal waterboarding" will halt economic recovery -- We are about to witness a historic showdown between the major euro area institutions and Greece. Greece's newly appointed finance minister Yanis Varoufakis, a staunch bailout critic, will lead the negotiations on debt haircuts. On the other side will be the creditors: the International Monetary Fund and the European Commission - with additional support from the ECB. Private bondholders may get dragged into the fight as well (although many of them are Greek banks who will do what the government tells them). A number of Eurozone politicians have already expressed skepticism about any debt forgiveness for Greece. But Varoufakis is likely to focus on the argument that Germany has to take a great deal of the blame for the situation in which Greece now finds itself - calling the imposed austerity measures "fiscal waterboarding". Here is a good quote from Strafor: Stratfor (via Forbes): Another version, hardly heard in the early days [of the Eurozone crisis] but far more credible today, is that the crisis is the result of Germany’s irresponsibility. Germany, the fourth-largest economy in the world, exports the equivalent of about 50 percent of its gross domestic product because German consumers cannot support its oversized industrial output. The result is that Germany survives on an export surge. For Germany, the European Union — with its free-trade zone, the euro and regulations in Brussels — is a means for maintaining exports. The loans German banks made to countries such as Greece after 2009 were designed to maintain demand for its exports. The Germans knew the debts could not be repaid, but they wanted to kick the can down the road and avoid dealing with the fact that their export addiction could not be maintained. The debate will also focus on the fact that Greece has done an amazing job in cutting its debt/GDP ratio - in spite of the falling GDP.
Greek PM Tsipras freezes privatisations, markets tumble (Reuters) - Leftist Greek Prime Minister Alexis Tsipras threw down an open challenge to international creditors on Wednesday by halting privatisation plans agreed under the country's bailout deal, prompting a third day of heavy losses on financial markets. A swift series of announcements signalled the newly installed government would stand by its anti-austerity pledges, setting it on a collision course with European partners, led by Germany, which has said it will not renegotiate the aid package needed to help Greece pay its huge debts. Tsipras, who was congratulated by U.S. President Barack Obama in a phone call for his decisive election victory on Sunday, told the first meeting of his cabinet members that they could not afford to disappoint voters battered by a plunge in living standards under austerity. true After announcing a halt to the privatisation of the port of Piraeus on Tuesday, for which China's Cosco Group and four others had been short-listed, the government indicated it would put the whole programme on hold. It said it would stop the sale of stakes in the Public Power Corporation of Greece, Greece's biggest utility, and refiner Hellenic Petroleum (HEPr.AT), and put other planned asset sales of motorways, airports and the power grid on ice. The government also plans to reinstate public sector employees judged to have been laid off unfairly, including a group of finance ministry cleaners whose case attracted publicity last year, and announced rises in pensions for retired people on low incomes.
Greek borrowing costs jump to highest since 2013 - -- Greek borrowing costs continued to rise on Thursday, with the yield on 10-year government bonds jumping to the highest level since July 2013. The yield on the 10-year paper rose 52 basis points to 11.039%, continuing the trend seen after radical far-left Syriza party won Greece's general election on Sunday. Ahead of the election, the 10-year yield was below 9%. The jitters in the Greek bond markets have come as the new government quickly delivered on promises to end austerity and unravel parts of its bailout agreement with international lenders. For example, the Alexis Tsipras administration has already frozen a plan to privatize for the country's biggest port and its leading utility firm, a key part of the bailout terms. Greek stocks have also been hit hard, although the Athex Composite index GD, +3.16% rebounded 2% on Thursday to 724.93.
Greece Shows the Limits of Austerity in the Eurozone. What Now? - Mario Seccareccia, professor of economics at the University of Ottawa, has been outspoken in his warnings that austerity policies have the potential to smash economies and spread untold human misery. He has challenged deficit hawks and emphasized the need for strong government investment in things like jobs, education, health care, and infrastructure if economies are to prosper. Here he talks about why what happened to Greece was entirely predictable, why the Greeks were right to reject austerity in the recent election, and what challenges the country faces in forging a sustainable path forward with the left-wing Syriza party at the helm.
Europe’s Greek Test, by Paul Krugman -- Recent events in Greece pose a fundamental challenge for Europe: Can it get past the myths and the moralizing, and deal with reality in a way that respects the Continent’s core values? If not, the whole European project — the attempt to build peace and democracy through shared prosperity — will suffer a terrible, perhaps mortal blow. ....to oversimplify things a bit, you can think of European policy as involving a bailout, not of Greece, but of creditor-country banks, with the Greek government simply acting as the middleman — and with the Greek public, which has seen a catastrophic fall in living standards, required to make further sacrifices so that it, too, can contribute funds to that bailout. One way to think about the demands of the newly elected Greek government is that it wants a reduction in the size of that contribution. ... But doesn’t Greece have an obligation to pay ... debts? That’s where the moralizing comes in. It’s true that Greece (or more precisely the center-right government that ruled the nation from 2004-9) voluntarily borrowed vast sums. It’s also true, however, that banks in Germany and elsewhere voluntarily lent Greece all that money. We would ordinarily expect both sides of that misjudgment to pay a price. But the private lenders have been largely bailed out... Meanwhile, Greece is expected to keep on paying. Now, nobody believes that Greece can fully repay. So why not recognize that reality and reduce the payments to a level that doesn’t impose endless suffering? Is the goal to make Greece an example for other borrowers? If so, how is that consistent with the values of what is supposed to be an association of sovereign, democratic nations?
Who is Still Exposed to Greece? - Since the start of the crisis, the structure of Greek debt has changed considerably (almost 80 percent of government financial liabilities are now accounted for by loans, against slightly less than 20 percent back in 2008). At the same time, the weight of public creditors has increased among the creditors of the government. Figure 1 shows a breakdown of the Greek general government financial liabilities across the main creditor sectors (with public creditor included in non-residents). At the end of 2013, debt due to official creditors amounted to 216 billion of loans (IMF/EU loans) and 38 billion of securities (under SMP). This means that, at the end of 2013, official creditors accounted for about 94 percent of the total loans due to non-residents and 89 percent of the total securities held by non residents.
Greece Will No Longer Deal with ‘Troika’, Yanis Varoufakis Says - Greece will no longer co-operate with the “troika” of international lenders that has overseen its four-year bailout programme, the country’s finance minister said. Yanis Varoufakis also said Greece would not accept an extension of its EU bailout, which expires at the end of February, and without which Greek banks could be shut off from European Central Bank funding. “This position enabled us to win the trust of the Greek people,” Mr Varoufakis said during a joint news conference with Jeroen Dijsselbloem, chairman of the eurogroup of eurozone finance ministers, who was visiting Athens for the first time since a leftwing government came to power this week. He also blasted the deeply unpopular bailout monitors from the European Commission, IMF and ECB, also known as “ the troika”, saying: “We are not going to co-operate with a rottenly constructed committee.” Jeroen Dijsselbloem, chairman of the eurogroup of eurozone finance ministers, warned the new government against taking unilateral steps or ignoring arrangements with lenders, saying “the problems of the Greek economy have not disappeared overnight with the elections.” Wolfgang Schäuble, German finance minister, warned Athens on Friday against trying to “blackmail” Germany with its financial demands. Mr Schäuble said Germany was ready to co-operate but only on the basis of current agreements. “We’re prepared for any discussions at any time but the basis can’t be changed,” he said. “Beyond that, it is hard to blackmail us.”
Dijsselbloem: “You just killed Troika” – Varoufakis “WOW!” (video, pics): The joint press conference was concluding, when Greek Finance Minister Yanis Varoufakis droped a last bombshell. “…and with this if you want – and according to European Parliament – flimsily-constructed committee we have no aim to cooperate. Thank you.” Varoufakis was referring to the famous Troika, the country’s official creditors consisting of the European Union, the International Monetary Fund and the European Central Bank.. After concluding with a “Thank you” Varoufakis gives the word to Eurogroup Chief Jeroen Dijsselbloem, who wants to hear the translation first. Then he takes off the ear phones, he stands up and sets to leave. An enforced-looking shaking of hands delays the departure of the Dutch FinMin. Dijsselbloem quickly whispers something to Varoufakis’ ear, he briefly replies back and the Eurogroup chief leaves the press conference hall as soon as it was possible.
Marine Le Pen Soars Into Lead in French Presidential Polls for 2017; Don't Worry, Nothing Can Possibly Go Wrong -- In spite of the Charlie Hebdo murders that raised the popularity of French president Francois Hollande and his staff, Les Echos reports than in the 2017 presidential election anti-euro candidate Marine Le Pen in the 1st Round Lead With Nearly 30% of the Vote. According to an IFOP 2017 presidential poll released Thursday, Marine Le Pen would come out clearly in the lead if the first round of presidential elections was held on Sunday. Le Pen would get 29 to 31% of the vote. No rival would exceed 23%. Nicolas Sarkozy, Manuel Valls, and Alain Juppé, each have around 23%. François Hollande would get 21%. Francois Bayrou would obtain 7 to 9%, Mélenchon 8%, Cécile Duflot and Nicolas Dupont-Aignan between 3 and 4% and the far left between 2 and 3%. Prime Minister Valls would do better than Francois Hollande, with 23% of the vote.
Carney attacks German austerity: The governor of the Bank of England, Mark Carney, has tonight made what can only be described as a thinly-disguised attack on the German government's refusal to spend and borrow more to promote growth throughout the eurozone. Germany is not once mentioned by name in his speech - entitled "Fortune favours the bold" - which he gave this evening on the fringes of the eurozone, in Dublin. But in saying that monetary union cannot work without fiscal union - or the ability and willingness of countries with stronger public finances to support those that are struggling to grow under the burden of big debts - he is in effect saying that Germany ought to do more to support the likes of Italy, Spain and France. This is how Mark Carney - who is also chairman of the main global policy making body for banking and finance regulators, the Financial Stability Board - put it: "For complete solutions to both current and potential future problems, the sharing of fiscal risks is required. It is no coincidence that effective currency unions tend to have centralised fiscal authorities whose spending is a sizeable share of GDP - averaging over a quarter of GDP for advanced countries outside the euro area". And he cites the US, Canada and even Germany as federal countries where a central government has the ability to transfer significant financial resources to constituent states, as-and-when those states run into severe difficulties - which is not possible in today's eurozone.
Mark Carney warns of liquidity storm as global currency system turns upside down - - The Governor of the Bank of England has warned markets to brace for possible trouble in 2015 as the US Federal Reserve tightens monetary policy and liquidity evaporates, fearing that the new financial order has yet to face its first real test. Mark Carney said diverging monetary policies in the US, Britain, Europe, and Japan may set off further currency turbulence and "test capital flows across the global economy, including to emerging markets." It is the latest sign that officials at Threadneedle Street are worried about the global fall-out from the rising dollar, which poses a mounting threat to companies in the developing world that have borrowed up to $9 trillion in US dollars. Mr Carney said regulators have cleaned up the banks and tried to prepare for the tectonic shift taking place in the international currency structure but major risks remain. "This will test the resilience of that new financial system. It has a potential feedback and we have to be aware of that," he told an elite group of central bankers at the World Economic Forum. "We are particularly concerned about an illusion of liquidity that has existed in a number of financial markets. I would say that illusion of liquidity is gradually being disabused," he said, adding that the so-called 'flash crash' in the US Treasury market last October was a wake-up call even if the "bouts of losses" have been small so far.
Pound slides after U.K. GDP misses forecasts - The pound dropped on Tuesday after data showed the U.K. economy grew less than expected in both the fourth quarter of 2014 and for the full year. Sterling traded at $1.5070, down from $1.5087 ahead of the release. The Office for National Statistics said the U.K.'s gross domestic product expanded by 0.5% in the fourth quarter, a slower growth rate than the 0.7% logged in the third quarter and weaker than the 0.6% expected by economists. For the full year, GDP grew 2.6%, less than the forecast of 2.8%. "We cannot deny the fact that the [U.K.] is surrounded by dark clouds of the struggling economies. Hence, you cannot blame that the U.K.'s growth is not shining as it was," said Naeem Aslam, chief market analyst at Ava Trade, in a note.


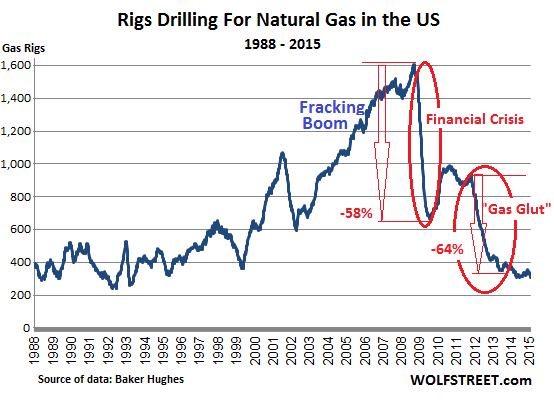