U.S. Fed balance sheet grows in latest week (Reuters) - The U.S. Federal Reserve's balance sheet grew in the latest week on larger holdings of U.S. Treasuries, Fed data released on Thursday showed. The Fed's balance sheet stood at $3.357 trillion on June 5, compared to $3.342 trillion on May 29. The Fed's holdings of Treasuries rose to $1.898 trillion as of Wednesday, June 5, from $1.884 trillion the previous week. The Fed's overnight direct loans to credit-worthy banks via its discount window averaged $8 million a day during the week versus $10 million a day the previous week. The Fed's ownership of mortgage bonds guaranteed by Fannie Mae, Freddie Mac and the Government National Mortgage Association (Ginnie Mae) stayed about flat at $1.165 trillion. The Fed's holdings of debt issued by Fannie Mae, Freddie Mac and the Federal Home Loan Bank system totaled $70.89 billion, the same as the previous week.
FRB: H.4.1 Release-- Factors Affecting Reserve Balances -- Thursday, June 06, 2013: Factors Affecting Reserve Balances of Depository Institutions and Condition Statement of Federal Reserve Banks
Fed Watch: On September - We are heading into a big data week, beginning with ISM and culminating with the employment report for May. As I believe the Fed is seriously looking at September to pull back on QE, I will be looking for data that pushes that timing off to December. The employment report is the most important release of course, not just for what nonfarm payrolls tell us about "stronger and sustainable," but also the unemployment rate. The latter is the specific concern of the threshold condition for reviewing the stance of interest rates, but it is also a concern for the pace of asset purchases. The faster we are moving toward 6.5%, the sooner policymakers will want to pull the plug on QE. Consider the path of unemployment: Unemployment is declining at a very steady pace, and at that pace will hit the 6.5% threshold in September of 2014. To be sure, past performance is no guarantee of future performance. We may see, for example, the long-awaiting return to rising labor force participation rates. But we could also see an acceleration in job growth, perhaps sufficient to more than offset any increase in labor force participation, and thus the unemployment rate falls faster than anticipated. A safe bet, however, is more of the same steady decline in rates that we have seen since 2010. The Fed, I suspect, wants to conclude asset purchases well before they hit the 6.5% threshold and have to make a decision about interest rates. That will take at least three months, but they would probably error on the side of caution and shoot for six months out. That suggests they would like to wind down quantitative easing by March of 2014. Assume further that they do not want to go cold turkey, but rather reduce the pace of purchases across multiple meetings, maybe slowly at first, but more quickly later. So you need about 6 months, or 4 meetings, to wind down asset purchases. That pretty much pushes you back to the September meeting of this year. To be sure, everything is data dependent. But my point is that the calendar is probably a driving force in timing the end of QE.
Fed’s Lockhart: Nearing Time to Trim Bond Purchases - The Federal Reserve is nearing the day where it can consider reducing the size of its bond-buying stimulus effort, but even when that happens, smaller-sized purchases are unlikely to be the major shift in policy some think them to be, a veteran U.S. central bank official said. In an interview Monday, Federal Reserve Bank of Atlanta President Dennis Lockhart weighed in on his outlook for what is currently an open-ended $85 billion-a-month program that buys Treasury and mortgage bonds. The effort aims to lower borrowing costs, driving up growth and lowering the unemployment rate. Over recent weeks, an improving economy has driven widespread speculation the Fed can at some point slow its purchases to reflect the economy’s improved prospects. A number of Fed officials have gravitated to just such a view, culminating in Chairman Ben Bernanke telling Congress that while the outlook remains uncertain, it is possible the Fed could slow the purchases at some point over coming months. “We are approaching a period in which an adjustment to the asset purchase policy can be considered,” Mr. Lockhart said in the interview. Referring to coming Fed policy meetings, he said of a potential slowing in the purchases: “Whether that’s June, August, September or later in the year, to me, isn’t really the issue,” even as he acknowledged, “It’s the issue for the markets.”
Fed’s Williams Open to Trimming Bond Purchases -The head of the Federal Reserve Bank of San Francisco Monday confirmed that he is open to cutting the central bank’s bond-buying program over coming months, as long as the economy continues to make good progress. “If the forecast goes as I hope and we see continuing good signs from the labor market [and] overall economic conditions [and] continued confidence in that forecast of substantial improvement, I could see, my own view is that as early as this summer [there could be] some adjustment, maybe modest adjustment downward, in our purchase program,” San Francisco Fed President John Williams told reporters on the sidelines of a conference here. The Federal Reserve is running a program to buy around $85 billion per month in Treasury and mortgage debt, with the aim of improving economic growth and lowering the unemployment rate. Mr. Williams said he still feels the program is “doing a great job of helping the economy to gain momentum” and he would want to see that continue “well into the second half of this year.” But if things go well, he could imagine ending the program by the end of the year, he added.
Fed Watch: More Tapering Talk -- Despite the soft ISM number this morning, two Federal Reserve policymakers reiterated their expectation that asset purchases will slow in the months ahead. First up is Atlanta Federal Reserve President Dennis Lockhart, who was on the speaking circuit today. Via the Wall Street Journal: “We are approaching a period in which an adjustment to the asset purchase policy can be considered,” Mr. Lockhart said in the interview. Referring to coming Fed policy meetings, he said of a potential slowing in the purchases: “Whether that’s June, August, September or later in the year, to me, isn’t really the issue,” even as he acknowledged, “It’s the issue for the markets.” Of course, June is probably out of the question: It would be too soon to pull back now, Mr. Lockhart said. “I don’t think that as of today we have a set of conditions that absolutely justify an adjustment,” he explained. While the official suggested the most likely direction would be to slow the buying from its current pace, he said he doesn’t have “a fixed sense” of how the Fed should slow down on the buying. Separately, San Francisco Federal Reserve President also reiterated his expectation that policy would be making a shift sooner or later. Again, via the Wall Street Journal: “If the forecast goes as I hope and we see continuing good signs from the labor market [and] overall economic conditions [and] continued confidence in that forecast of substantial improvement, I could see, my own view is that as early as this summer [there could be] some adjustment, maybe modest adjustment downward, in our purchase program,” San Francisco Fed President John Williams told reporters on the sidelines of a conference here.
The Semantics of Monetary Policy - Atlanta Fed's macroblog - Tim Duy has some questions for the head man at the Atlanta Fed:...Atlanta Federal Reserve President Dennis Lockhart...was on the speaking circuit today. Via the Wall Street Journal..."If the Fed does slow the pace of its bond buying, "this is not a decisive removal of accommodation. This is a calibration to the state of the economy and the outlook. It is not a big policy shift, and I would hope the markets understand that," Mr. Lockhart said."I know that the Fed does not want market participants to associate a slowing of asset purchases with tighter policy. I am not sure, however, that it will be easy to persuade Wall Street otherwise. After all, if the Fed wanted looser policy, they would increase the pace of asset purchases. If more is "looser," then why isn't less "tighter?" Alternatively, is "less accommodative" really different from "tighter"? Semantics? I don't think so, and perhaps this is instructive: In the April survey of primary dealers conducted by the New York Fed, the median response to question of when asset purchases will end was the first quarter of next year. At the same time, the median view on what the unemployment rate would be at that time was 7.1 percent. That view would not be out of line with what you might guess on the basis of the Summary of Economic Projections that the Federal Open Market Committee published following its March meeting. But, as we noted here following the April employment report, the facts on the ground seem to be shifting. We will, as you know, get an update on the employment situation on Friday, and perhaps today's ADP report (for what it's worth) wasn't encouraging.
El-Erian: Central Banks "Have Materially Damaged Their Standing" - The “branding” of modern central banking started in the United States in the early 1980’s under then-Federal Reserve Board Chairman Paul Volcker. Facing worrisomely high and debilitating inflation, Volcker declared war against it – and won. In delivering secular disinflation, he did more than change expectations and economic behavior. He also greatly enhanced the Fed’s standing among the general public, in financial markets, and in policy circles. Building on Volcker’s success, Western central banks have used their brand to help maintain low and stable inflation. In the last few years, however, the threat of inflation has not been an issue. Instead, Western central banks have had to confront market failures, fragmented financial systems, clogged monetary-policy transmission mechanisms, and sluggish growth in output and employment. Facing greater challenges in delivering desired outcomes, they have essentially pushed both policies and their brand power to the limit. They will have materially damaged their standing and, consequently, the future effectiveness of their policy stance.
Pimco's Gross Skewers Bernanke: You're Part of the Problem - Bond guru Bill Gross has taken straight aim at the Federal Reserve and its Chairman Ben Bernanke, charging that ultra-loose monetary policies are holding back the economic recovery. In his monthly letter to investors, Gross, who heads fixed-income giant Pimco and its $2 trillion in assets under management, uses unusually blunt language to convey his feelings about historically aggressive central bank easing measures. While he concedes that the Fed isn't getting help from Washington and its fiscal mess, he said the central bank's easing programs are only complicating matters. Gross compares the economy to a heart that uses the ability to earn return appreciably over the cost of investment—"carry," in market terms—as its lifeblood. Carry has been increasingly difficult to achieve in the current quantitative easing environment, he said."Perhaps, in addition to a fiscally confused Washington, it's your policies that may be now part of the problem rather than the solution," Gross said in comments directed at Bernanke. "Perhaps the beating heart is pumping anemic, even destructively leukemic blood through the system," he added. "Perhaps zero-bound interest rates and quantitative easing programs are becoming as much of the problem as the solution."
Fed Policies Exacerbate Credit Crunch to Small Businesses - The Fed believes that holding interest rates low fosters business growth, hiring, and bank lending? So why isn't that happening? I have discussed many reasons, but today I have another one from Steve H. Hanke, Professor of Applied Economics at The Johns Hopkins University who discusses The Federal Reserve vs. Small Business. Hanke notes that one of the consequences of low interest rates is that "banks with excess reserves are reluctant to part with them for virtually no yield in the interbank market." And why should they? Why take risk for nothing? Hanke Writes ....Without the security provided by a reliable interbank lending market, banks have been unwilling to scale up or even retain their forward loan commitments. This was verified in a recent article in Central Banking Journal by Stanford Economist Prof. Ronald McKinnon – appropriately titled “Fed ‘stimulus’ chokes indirect finance to SMEs.” The result, as Prof. McKinnon puts it, has been “constipation in domestic financial intermediation” – in other words, a credit crunch. When banks put the brakes on lending, it is small and medium enterprises that are the hardest hit. Whereas large corporate firms can raise funds directly from the market, SMEs are often primarily reliant on bank lending for working capital. The current drought in the interbank market, and associated credit crunch, has thus left many SMEs without a consistent source of funding.
The Fed, Inequality and Accounting Identities - Dean Baker - Annie Lowrey at the NYT continues a mini-debate about whether the Fed is promoting inequality with its quantitative easing program. The argument is that by pushing down interest rates it is contributing to the run-up in stock prices and housing prices. Since stock is hugely disproportionately held by the wealthy and homeowners are better off than the population as a whole, this policy is increasing inequality.This is undoubtedly true, although the extent of the impact can be debated. (High corporate profits are also a big factor behind the rise in stock prices. Also, they began their run-up at unusually depressed levels.) However, a little income accounting here would go along way in helping this discussion. The country has an output gap of around 6 percent of GDP. This is due to the plunge in residential construction following the collapse of the housing bubble and also the lost consumption that resulted from the loss of $8 trillion in housing equity. Standard measures of the housing wealth effect imply that a reduction of $400 billion to $560 billion in annual consumption. There are a limited number of channels to fill this lost demand and thereby make up the 9 million jobs deficit we now face. One route is large government deficits, either from increased spending or tax cuts. That is probably the quickest and surest way to make up the demand gap, but the Serious People insist that we can't run large deficits. Another obvious route, and probably the best long-term solution, is to get the dollar down. This will improve the international competitiveness of U.S. goods and bring the trade deficit closer to balance.
Ben Bernanke, Force of Nature - Paul Krugman - By any reasonable standard, the great failing of economic policy over the past 5 years — monetary and fiscal both — is that it has done too little. Output lies far below reasonable estimates of potential, meaning trillions of dollars of wasted resources; unemployment remains at levels that amount to personal, social, and possibly political catastrophe; inflation has been below target, and there are good reasons to believe that the targets are too low. Yet the most virulent criticism of policy makers has come from those insisting that they are doing too much — that deficits are a terrible threat (somehow unperceived by the bond market), that the actions of central banks are excessive, even insane. So Martin Wolf finds himself compelled to defend Ben Bernanke, not against charges that he has failed to exhibit the “Rooseveltian resolve” he himself once demanded of the Bank of Japan, but against hedge fund types who accuse him of somehow perverting financial markets.This makes me think that it might be time for a restatement of the case for unconventional Fed policy — not the case that it’s a panacea or even that it will necessarily work, but simply that it should be tried. Start with the very simplest view of how Fed policy affects the economy: the Fed sets short-term interest rates, and other things equal a lower rate leads to higher output; the “natural rate” of interest — as explained in this SF Fed paper — is the rate at which output equals potential, that is, at which there are neither inflationary nor deflationary pressures:
QE in Perspective - Quantitative Easing created money, but the Fed didn't give the money to households, businesses, or the government. They used the created money to buy US Treasuries and agency MBS (the largest, most liquid, and safest bonds available). When business investors sell securities to the Fed, they use the new money to replace the bonds they sold by purchasing other financial assets, such as corporate bonds. That's why QE never inflated the price of consumer goods and services, because those aren't substitutes for financial assets. Why isn't this widely understood by now? QE simultaneously did two things. First, by purchasing securities the Fed reduced the volume of financial assets owned by the private sector. Second, the cash paid by the Fed caused the private sector to buy more financial assets. The combined effect was that the price of financial assets went up, and the private sector was pushed into riskier financial assets. That caused interest rates on corporate and mortgage borrowing to fall. The value of stocks and houses increased, and the wealthy households that held those assets would feel even wealthier and would spend more. What is missing in this well known narrative is the scale. The Fed purchase $2 trillion! But households and businesses own $74 trillion in financial assets, plus real estate and other tangible assets (not shown). That's enough to change the price of assets, but that's not enough to make all asset prices dependent on the Fed.
Mr. Market’s Temper Tantrum Over Fed Tapering Talk - Yves Smith - Lordie, the market upset we’ve had over the past week plus over Bernanke using the T, as in “tapering” word, is escalating into a full-blown hissy fit. We now have the Wall Street Journal and other finance-oriented venues telling us how unbelievably important today’s job report is. Huh? One jobs report is just another in a long series of data points. So why has this one been assigned earth-shaking importance? Let’s look at what is going on in the economy:
- 1. PMI has slipped into negative territory
- 2. Refis (a boost to consumer ability to spend) are falling fast
- 3. Inflation expectations are falling
- 4. Inflation is falling
- 5. Unemployment is over the Fed’s target and we still have a ton of discouraged workers and underemployment
- 6. The sequester will only make 1-5 worse.
This reading is corroborated by reader responses to our latest query on local conditions. The bottom line from geographically wide ranging reports seemed to be that while certain areas were hot (and the biggest seems to be Washington, DC), the rest of the country is at best mixed, with a lot of erosion beneath the surface.
A Word About Skittish Markets - The Fed is acutely aware that they’re supporting stock and other asset prices right now and they’re even more acutely aware that markets are on tenterhooks as to when and how they’re going to turn. And since the last thing they want is to is disrupt the markets, they will continue to operate with unprecedented transparency and extremely gradual movements. Once it starts, the “unwind” will occur slowly and carefully. They won’t take away the punch bowl. They’ll start by pouring a bit less punch in, and when they’re ready to cut the juice, it will be with a straw, not a ladle. The Fed’s balance sheet is almost four times what it was before the crisis ($3.4 trillion now vs. under $900 billion in 2007). Interest rates must rise. The must rise as the economy improves, as lenders seek higher returns and hedge against inflation, and they must rise at the Fed as they (slowly…very slowly) unwind their bloated portfolio and break free of the zero lower bound on nominal rates. I’m not managing a zillion bucks in a hedge fund, so it’s easy for me to say, but it’s the stock market, not a romantic comedy. You gotta take the ups with the downs. The Fed undertook unusual measures to boost the markets and as the economy recovers, they must pull back. They can’t give us the precise date—they’ve already told us about their unemployment and inflation triggers (6.5% and 2.5%, respectively)—and I expect them to continue to provide extensive “forward guidance.”
Fed Watch: Falling Inflation Expectations - I had thought that open-ended quantitative easing tied to economic outcomes would resolve the problem of stabilizing expectations of future inflation, thus supporting a "stronger and sustainable" recovery. The initial gains in inflation expectations seemed to justify such optimism. But a funny thing happened on the way to the show - inflation expectations reversed course: I know the Fed said they could move up or down. But I think the idea of "up" would only come after a "down." And clearly, if inflation expectations are any guide, market participants are getting the message that "down" is what is coming. And they are not getting that from just the hawkish policymakers. The doves too have been getting in on the action. Moreover, I have to imagine that the recent market action in Tokyo has made some policymakers a little bit nervous about the limits to quantitative easing. My view is that asset purchases would be most effective if coupled with fiscal stimulus. Working only through financial markets may be simply too restrictive to yield broad-based economic improvement. It is almost as if the Fed is trying to force a fire hose of policy through a garden hose. Keep turning up the volume, and eventually that hose bursts. And that might be what we are seeing in Japan.Bottom Line: Inflation[sp] expectations are falling, and that by itself should complicate the Fed's expectation that they can start scaling back asset purchases at the end of the summer. But falling inflation expectations may complicate monetary policy more broadly by revealing the limits to quantitative easing. And Japan isn't helping.
New Survey Sees Weaker Inflation Expectations - As actual measures of inflation drift ever downward from the Federal Reserve’s 2% target, central bank officials have been pretty sanguine. Why? Even as inflation ebbs–the April overall personal consumption expenditures price index was up a mere 0.7%–most central bankers have pointed to what they see as relatively stable inflation expectations, saying this is evidence weak price pressures are likely temporary. The eternal problem with inflation expectations, though, is measurement. Officials can point to things like the PCE price index and say with some confidence that’s where inflation now rests. Many frequently try to divine expectations via pricing information for inflation-indexed government bonds. But as Atlanta Fed President Dennis Lockhart said in an interview this week: “we don’t have perfect measures” of price expectations.One way to get a handle on the issue is via surveys of economists. On that front, the Federal Reserve Bank of Philadelphia offered a new point of reference with its release Thursday of the June Livingston Survey.Participating economists cut by notable degree their outlook on inflation, although somewhat problematically, their forecasts projected where the consumer and producer price indexes will be. The CPI has been running higher than the Fed’s preferred PCE price index, and as a result, the survey highlights the challenge of a clear reading on expected prices.
We Just Had the Lowest Core Inflation in 50 Years. What Does This Mean for "Expectations" and Monetary Policy? - Last Friday, the BEA announced the lowest year-over-year rise in core inflation it has ever recorded. The year-over-year PCE core inflation, or inflation stripped of volatile energy and food prices, was 1.05 percent. As Doug Short notes, the previous all-time low was 1.06, and that is from March 1963. (The records go back to 1959.) Inflation is collapsing in 2013, both for observed values and future expectations. This is noteworthy because, as you may remember, the Federal Reserve took extraordinary actions at the end of last year to hit its inflation target. Let’s put up a chart from Doug Short: I had mentioned falling inflation in my Bernanke versus austerity column, but wanted a bit more core information before I flagged it. It’s now here. This is a major issue that isn’t being discussed. It gets to the heart of whether or not the Federal Reserve can manage the economy at the zero lower bound of interest rates through expectations, guidance, and purchases, which is a central issue now and for the future of economic policy.It’s also worth discussing because the idea that the Fed has a lot of room is expanding into new ranks via conservative reformers. Josh Barro, now at Business Insider, just argued that “market monetarism is the shining success of the conservative reform movement.” Crucially, it is being used by thinkers on the right to justify ignoring fiscal stimulus.
Misreading the tea leaves of the broad money supply - Some economists continue to misinterpret the recent movements in M2, one of the measures of the US broad money supply. People use this indicator to argue all sorts of things - from a slowdown in lending to the reason for low inflation and even as a harbinger of a major correction in equities. While such conclusions could certainly end up being correct, it is unlikely that the movements in M2 have anything to do with it. First of all, what exactly is M2? The chart below shows the components (one item not shown is the amount in travelers checks - too small to be displayed on this chart).The money supply is one of those measures that is not supposed to be impacted by asset rotation. For example if you use your cash to buy a car or a stock, someone else will have your cash - so the overall amount of cash in the system has not changed. If people move money from savings to checking, the aggregate once again should stay the same. In theory this factor would be impacted primarily by banks lending money. For example, Sarah deposits $100 at a bank. Frank borrows $90 from the same bank and deposits it there (maybe temporarily). Now deposits have increased from $100 to $190, which would show up in M2 (and the bank has increased its leverage ratio). But there are two components of this measure that cloud this logic: Certificates of Deposit (CDs) and Money Market Funds. If funds come out of these two categories and get deployed in say a short-term bond fund or a stock fund for that matter, M2 would decline. That is if Sarah swaps her CD for a mutual fund, (unwinds the CD or lets it mature and uses the proceeds to buy the fund), the cash balance does not change but the CD amount in the system declines. That will result in lower M2.
What We Have Here Is A Failure To Communicate - Paul Krugman -- Interest rates are rising! Head for the hills! OK, maybe not quite yet. Some perspective on recent moves: The 10-year bond rate, in perspective. Still, a rise in bond rates is not helpful just as there are signs the economy is gaining momentum despite the best efforts of politicians. So what is happening? Well, recall my little typology of rate rises: With stocks down and the dollar up, this looks like a market that has upgraded its estimate of the chances that the Fed will tighten too soon. And yes, I mean too soon, for sure. Look not at the unemployment rate, which to some extent reflects people dropping out of the labor force, and instead look at the employment-population ratio — focusing on prime-age workers to avoid demographic issues: Employment-population ratio, ages 25-54. Our labor market has barely begun to recover. Meanwhile, inflation is dropping well below target, even as a growing number of analysts believe that the target itself has been set too low. So unless Bernanke and company mean to signal their intention to tighten much too soon, and derail recovery, they had better start getting their message out better.
The Lady Gaga Fix: How the U.S. Is Rethinking GDP for the 21st Century - This week the government released yet another revision of first-quarter economic growth showing that the U.S. economy grew a tad less than initially reported ‑- 2.4 percent rather than 2.5 percent. This revision was hardly consequential, but over the summer the Bureau of Economic Analysis will unveil a new way to calculate the overall output of the United States. And that revision will be dramatic. Over the past few decades, gross domestic product (GDP) has become the prima inter pares of economic statistics. It is not only a measure of national economic output, it is a proxy for “the economy.” [...] The BEA is the government agency responsible for compiling U.S. GDP figures, and it is always looking for better ways to measure. Every few years it tweaks its methodology. This time the tweaks will be more than incidental. In fact, not only will they add several hundred billion dollars — statistically, at least — of annual output, but they will also begin an overdue transition of these numbers away from the 20th century, when they were invented, and into the 21st, where we now live. The change is relatively simple: The BEA will incorporate into GDP all the creative, innovative work that is the backbone of much of what the United States now produces. Research and development has long been recognized as a core economic asset, yet spending on it has not been included in national accounts. So, as the Wall Street Journal noted, a Lady Gaga concert and album are included in GDP, but the money spent writing the songs and recording the album are not. Factories buying new robots counted; Pfizer’s expenditures on inventing drugs were not.
Input Shocks, GDP, Multipliers and QE - So, on 12 December 2012, the Federal Reserve did what it does best these days. They cranked up their quantitative easing policy machine to do whatever they could to compensate for the poorly-considered fiscal policy propagating from 1600 Pennsylvania Avenue in Washington D.C. At that time, the Fed committed to boost its net purchases of U.S. Treasuries by $45 billion per month, on top of its monthly net purchases of $40 billion worth of Mortgage Backed Securities that had previously established on 13 September 2012 to fuel the growing fire within a U.S. housing sector that had recently gained traction. So what happens to GDP when the Fed is adding a net $340 billion per quarter to the U.S. economy? At the same time the U.S. government reduces its spending by a small amount from inflated levels as it really cranking up its taxes? The answer may be found through our tool below, where we've combined the indicated factors for the first quarter of 2013 along with the fiscal policy multipliers that have been determined for how each affects GDP in the U.S. to determine how each affected the nation's GDP in the first quarter of 2013. We'll have more discussion below the tool.
Fed's Beige Book: Economic activity "increased at a modest to moderate pace" -- Fed's Beige Book "Prepared at the Federal Reserve Bank of Minneapolis and based on information collected on or before May 24, 2013." Overall economic activity increased at a modest to moderate pace since the previous report across all Federal Reserve Districts except the Dallas District, which reported strong economic growth. The manufacturing sector expanded in most Districts since the previous Beige Book. Most Districts noted slight to moderate gains in consumer spending and a moderate increase in vehicle sales. Tourism showed signs of strength in several Districts. A wide variety of business services expanded, and transportation traffic increased for producer, consumer, and trade goods. Residential real estate and construction activity increased at a moderate to strong pace in all Districts. Commercial real estate and construction activity grew at a modest to moderate pace in most Districts. Overall bank lending increased since the previous report. Residential real estate and construction activity increased at a moderate to strong pace in all Districts. Several Districts reported that higher demand and low inventory of homes available for sale are resulting in multiple offers on properties. Almost all Districts reported higher home sale prices. The Kansas City District reported concerns that appraisals were not keeping pace with price increases. Residential construction increased across all of the reporting Districts. ... Commercial real estate and construction activity expanded at a modest to moderate pace in most Districts.
Fed’s Beige Book: District-by-District Summary The Federal Reserve’s latest “beige book” report Wednesday said overall economic activity increased at a “modest to moderate pace” in most of the nation. The Federal Reserve Bank of Dallas “reported strong economic growth” in its district, the Fed said. The following is a district-by-district summary of economic conditions for early April through May 24: National summary: Overall economic activity increased at a modest to moderate pace since the previous report across all Federal Reserve Districts except the Dallas District, which reported strong economic growth. The manufacturing sector expanded in most Districts since the previous Beige Book. Most Districts noted slight to moderate gains in consumer spending and a moderate increase in vehicle sales. Tourism showed signs of strength in several Districts. A wide variety of business services expanded, and transportation traffic increased for producer, consumer, and trade goods. Residential real estate and construction activity increased at a moderate to strong pace in all Districts. Commercial real estate and construction activity grew at a modest to moderate pace in most Districts. Overall bank lending increased since the previous report. Credit quality and deposits increased, while credit standards were largely unchanged. Agricultural conditions remained mixed across Districts, as weather patterns varied. Overall activity in the energy sector was flat, and mining was down. Hiring increased at a measured pace in several Districts, with some contacts noting difficulty finding qualified workers. Wage pressures remained contained overall, although several Districts reported a modest or moderate rise for selected occupations. Districts reported level prices to mild price increases; some manufacturers raised prices and some increases for input prices were noted.
Economic Storm Clouds Ahead - Robert Reich - I can understand the jubilation in the narrow sense that we’ve been down so long everything looks up. Plus, professional economists tend to cheerlead because they believe that if consumers and businesses think the future will be great, they’ll buy and invest more – leading to a self-fulfilling prophesy. But prophesies can’t be self-fulfilling if they’re based on wishful thinking. The reality is we’re still in the doldrums, and the most recent data gives cause for serious worry. Almost all the forward movement in the economy is now coming from consumers — whose spending is 70 percent of economic activity. But wages are still going nowhere, which means consumer spending will slow because consumers just don’t have the money to spend. On Thursday the Commerce Department reported that consumer spending rose 3.4 percent in the first quarter of this year. But the personal savings rate dropped to 2.3 percent — from 5.3 percent in the last quarter of 2012. That’s the lowest level of savings since before the Great Recession. You don’t have to be an economic forecaster, or an astrologer, to see this can’t go on.
Fiscal Headwinds: Is the Other Shoe About to Drop? - SF Fed - The current recovery has been disappointingly weak compared with past U.S. economic recoveries. Researchers and policymakers have pointed to a number of potential causes for this unusual weakness, including contractionary fiscal policy. For example, Federal Reserve Vice Chair Janet Yellen (2013) argues that three tailwinds that typically help drive strong recoveries—investment in housing, consumer confidence, and discretionary fiscal policy—have been absent or turned into headwinds this time. Changes in fiscal policy have been substantial over the past two years, including passage of the Budget Control Act of 2011, which led to sequestration spending cuts. In addition, temporary payroll tax cuts expired and income tax rates for higher-income taxpayers rose following passage of the American Taxpayer Relief Act of 2012. Two important questions are how much has federal fiscal policy been a drag on growth in the recovery to date and to what extent will it affect growth over the next few years? Moreover, is this fiscal drag unusual or part of the normal pattern in which government spending tends to fall and tax collections tend to rise as economic activity gains momentum? In this Economic Letter, we examine these questions by estimating what fiscal policy would be if it followed historical patterns in the relationship between fiscal policy and the business cycle. We then compare this historically based estimate with actual fiscal policy during the recession and recovery to date. We also look at government projections of fiscal policy over the next three years to see how these compare with estimates based on the historical norm. Finally, we discuss what these trends in federal fiscal policy imply for economic growth.
Government to Hold Back Growth for Years - Shifting government finances are likely to take an even bigger bite out of growth over the next few years than many now expect, economists at the San Francisco Fed warned Monday. In a research note, Brian Lucking and Daniel Wilson write fiscal policy headwinds will subtract one percentage point from growth over the next three years beyond the normal fiscal drag that usually comes during times of recovery. If not for the current and likely future stance of fiscal policy, the economy would be growing at a faster rate, which would allow for more robust job growth and, presumably, a more normal stance of monetary policy for the Federal Reserve. “Federal fiscal policy has been a modest headwind to economic growth so far during the recovery,” the economists wrote. But due to a more rapid than expected contraction in the budget deficits, due largely to rising tax revenue, “federal budget trends will weigh on growth much more severely over the next three years.” For some time now, a wide range of public and private economists have observed that the economy would be growing more quickly if not for cutbacks in government spending and hiring, at a time where taxes have also been increased. Federal Reserve officials largely gravitate to the view that while deficits must be trimmed, they should be done so over a longer horizon than many now want. Slower deficit reduction would give the private sector more time to get in position to carry the full momentum of economy activity.
American Austerity -- The chart above (borrowed from Jim Pethokoukis) shows the rather staggering amount of austerity the US economy has been trying to choke down this year, mostly coming from the fiscal cliff deal and the sequester. A couple months ago, I was worried this would tip the country back into recession, but so far growth seems to be holding up quite well. What gives? First, it’s still a bit early. The sequester is only just beginning to bite, and consumers may yet cut back. We’ll have a better picture of this in a couple quarters. Second, the market monetarist crowd argues that free monetary policy means austerity has no effect on the economy (the “monetary offset”), but I’m not convinced. The counterfactual is that growth would have been stronger, and that’s difficult to disprove. Growth is still weak and the labor market is still horrible. And as Steve Roth points out, it’s hard to know what we’d be giving the Fed credit for, since they haven’t changed any policies or statements, except to state baldly that “fiscal policy is restraining economic growth.” So, on balance, I’d say austerity is still a bad idea for the United States. There’s especially no reason to keep squeezing lower-income Americans, who have been taking it on the chin for 40 years, with increased payroll taxes. Doubly so when US borrowing rates are at historic lows.
Politics Can’t Handle the Truth About Austerity - It boils down to two points. One, fiscal stimulus is essential when conventional monetary policy is powerless. Two, fiscal stimulus may be impossible even when it’s essential. Most economists agree that changes in interest rates are usually a better way to regulate demand than discretionary changes in taxes and public spending. But interest rates can’t fall to less than zero. When that limit is reached -- as it was in this recession -- fiscal policy must carry a bigger load. In economies with a lot of slack, fiscal multipliers (the change in output that follows from any change in the fiscal balance) are more powerful than usual. This recession, because of its unusual depth, has supplied new evidence to back up this rule, and the U.K.’s attempt to refute the logic with “expansionary austerity” is widely seen as a failure despite some recent tentative signs of recovery. Moreover, unconventional monetary policy, the other alternative to changes in short-term interest rates, can’t yet be called a success. Only when the Federal Reserve and other central banks end their vast asset-purchase programs will it be possible to render a verdict on quantitative easing as a partial substitute for fiscal stimulus. So far, it looks as though it has helped. Let’s see how the exit goes before we declare it a triumph.
We must not accept this economic 'new normal', by Bernie Sanders- The front pages of American newspapers are filled with stories about how the US economy is recovering. ... But in the midst of this slow recovery, we must not accept a "new normal". We must not be content with an economic reality in which the middle class of this country continues to disappear, poverty is near an all-time high and the gap between the very rich and everyone else grows wider and wider. ... The American people get the economic realities. According to a Gallup poll, nearly six out of 10 believe that money and wealth should be more evenly distributed among a larger percentage of the people in the US, while only a third of Americans think the current distribution is fair. A record-breaking 52% of the American people believe that the federal "government should redistribute wealth by heavy taxes on the rich". . We need a major jobs program which puts millions back to work rebuilding our crumbling infrastructure. We need to tackle the planetary crisis of global warming by creating jobs transforming our energy system away from fossil fuels and into energy efficiency and sustainable energy.We need to end the scandal of one of four corporations paying nothing in federal taxes while we balance the budget on the backs of the elderly, the children, the sick and the poor.
Growth, Debt and Past versus Future Windows - Recently, we have seen a number of explorations of the timing of growth around episodes of high debt as a way to discern the likely direction of causality in that relationship. This is important, because we do observe that there is a negative correlation between contemporaneous debt and growth. For instance, this is true when using the corrected data from Reinhart and Rogoff, and equal weighting of country-year observations. Although there is no evidence of tipping points, a negative relationship remains. In a blog post in April, I showed that the timing of this negative relationship went against an interpretation where high debt caused low growth. I showed that relationship between contemporaneous debt with future growth is much weaker than that with past growth—which is suggestive of reverse causality. I used a 3-year window for this exercise. In other words, if we label current year as “0” I took the average growth rates in years 1,2 and 3. In a more recent column at Quartz, Kimball and Wang’s follow-up analysis showed the relationship using a window between years 5-10. In a working paper I that I wrote based on my blog post—but posted online after Kimball and Wang’s column—I followed the recent literature in taking a 5-year forward average growth rate, i.e., average growth taken over years 1-5. The general tenor of these findings is that the further into the future that the window stretches, the more attenuated the debt-growth relationship seems to be. However, the same does not appear to be true when considering windows stretching backwards in time: current debt is indeed strongly associated with past growth.
Sussing Out Whether Debt Affects Future Growth - We are very pleased with the response to our May 29, 2013 Quartz column, “After crunching Reinhart and Rogoff’s data, we concluded that high debt does not slow growth.” Miles gives links to some of the online reactions in his (more accurately titled) companion blog post the next day, “After Crunching Reinhart and Rogoff’s Data, We Found No Evidence That High Debt Slows Growth.” The one reaction that called for another full post was Arindrajit Dube’s post “Dube on Growth, Debt and Past Versus Future Windows.” Arindrajit suggests in that post that in his working paper “A Note on Debt, Growth and Causality,” he had actually explored the variations that the two of us focus on, but we want to argue here that we did one important thing that Arindrajit did not try in his working paper: controlling for ten years worth of data on past growth, as we did in our Quartz column. In this post, we argue that controlling for ten years worth of data on past growth is the key to getting positive slopes for the partial correlation between debt and future growth. We were surprised to find that controlling for ten years of past GDP growth makes the partial correlation between debt and near future growth in future years 0 to 5 positive (as well as the further future growth in future years 5 to 10).The graph at the top shows our main message. Since this is a long post, let us give the bottom line here and return to it below: The two of us could not find even a shred of evidence in the Reinhart and Rogoff data for a negative effect of government debt on growth for either growth either in the short run (the next five years) or in the long run (as indicated by growth from five to ten years later).
Deficit Deal Even Less Likely - Shrinking near-term federal deficits, slowing health-care cost increases and partisan gridlock have all but wiped out the likelihood for a deal this year to reduce long-term U.S. deficits, perhaps delaying a compromise until after the 2014 midterm elections, White House officials and congressional lawmakers said. The prospects for such a "grand bargain" this year have been unclear for some time, but parties to the discussions said in recent days the chances appear to have further diminished due to signs the government's fiscal health is improving. That has removed the pressure needed to force compromises."The intensity that has been there is not present today," Sen. Bob Corker (R., Tenn.) said in an interview. "I sense it in Congress and around the country—almost a fiscal fatigue that has set in." Rep. Chris Van Hollen (D., Md.), the top Democrat on the House Budget Committee, said that reaching a grand bargain would be, in poker terms, as difficult as "drawing to an inside straight." "The best opportunity is between now and October," he said, and "even the chance of that is diminishing as the days go by." In their public statements, Obama administration officials say a grand bargain is still a possibility. "The president remains committed to working to see if there's a caucus of common sense willing to reach a bipartisan compromise,"
White House threatens to veto spending plans unless broader budget deal reached: The Obama administration on Monday threatened to veto any spending bills for the coming fiscal year unless Republicans and Democrats reach agreement on a broader budget plan that “supports our recovery and enables sufficient investments” in White House priorities. The White House budget office issued the blanket veto threat late Monday in response to two spending bills headed to the floor of the House this week. One would fund veterans affairs and military construction, the other would fund the Department of Homeland Security. Both were drafted in accordance with a budget blueprint drafted by House Budget Committee Chairman Paul Ryan (R-Wisc.), which calls for the automatic spending cuts known as the sequester to remain in place through the coming fiscal year. However, the Ryan budget would shift the burden of those cuts away from veterans and national defense programs, and force domestic agencies to shoulder the entire burden. Democrats oppose that approach, and have called for the much of the sequester to be cancelled and replaced with higher taxes and other savings. But Republicans have refused to open formal negotiations to address that broader question, and the House instead has proceeded to draft 2014 spending bills as if its own budget framework were in force.
Boehner protests Obama veto threats on budget - White House veto threats against legislation that implements spending cuts in the austere GOP budget plan are "reckless" and would lead to a government shutdown, House Speaker John Boehner said Thursday. Boehner, R-Ohio, said the veto warnings mean Obama is threatening to shut down the government unless he wins tax increases and higher spending. The White House said Monday that Obama will veto any legislation implementing the GOP's budget, which endorses spending levels forced by across-the-board spending cuts known as sequestration and shifts about $30 billion from nondefense programs to the Pentagon. "No one wants to make more progress on deficits than I do. I've been working at it for years now. I know how hard it is," Boehner said. "That's why the idea of shutting down the government if we can't find a deal is so irresponsible."
Charts of the Day: Time to Hit the Fiscal Reset - You've seen versions of these charts before, but Michael Linden of CAP has now updated them. They send a pretty clear message: Over the past two years, the federal deficit has been slashed by about $2.5 trillion, mostly via spending cuts. As a result, our medium-term deficit picture has brightened considerably. And now? It's time to stop. The economy is still fragile, austerity has failed utterly in Europe, and we don't need any more of it here. For now, at least, a deficit of around 3 percent of GDP is, if anything, too low. It's time to hit the reset button. The full report is here.
Now is the time to be an infrastructure hawk, not a deficit hawk - Ezra Klein - There’s a far better case right now for being an infrastructure hawk than a deficit hawk. Deficit hawks tend to have two worries. The first is a practical concern about interest rates. Too much government borrowing can, in a healthy economy, begin to “crowd out” private borrowing. That means interest rates rise and the economy slows.The second is a moral concern about forcing our children to pay the bill for the things we bought. This is how Mitt Romney talked about debt during the campaign. “It’s not moral for my generation to keep spending massively more than we take in, knowing those burdens are going to be passed on to the next generation, and they’re going to be paying the interest and the principal all their lives,” he said. These are real, worthwhile concerns. But in this economy, both make a stronger case for investing in infrastructure than paying down debt.Former Treasury Secretary Larry Summers put it with unusual clarity at a Wall Street Journal breakfast on Tuesday. “We need to recognize that burdening future generations is a crucial issue,” he said. “But just as you burden future generations when you accumulate debt, you also burden future generations when you defer maintenance.”
Welfare for the Wealthy - NYT - The critically important Farm Bill [1] is impenetrably arcane, yet as it worms its way through Congress, Americans who care about justice, health or the environment can parse enough of it to become outraged. The legislation costs around $100 billion annually, determining policies on matters that are strikingly diverse. Because it affects foreign trade and aid, agricultural and nutritional research, and much more, it has global implications. The Farm Bill finances food stamps (officially SNAP, or Supplemental Nutrition Assistance Program) and the subsidies that allow industrial ag and monoculture — the “spray and pray” style of farming — to maintain their grip on the food “system.” The bill is ostensibly revisited, refashioned and renewed every five years, but this round, scheduled to be re-enacted last year, has been in discussion since 2010, and a final bill is not in sight. Based on the current course of Congress it seems there will be an extension this fall, as there was in 2012. Extensions allow funding changes for individual “titles,” as programs are sometimes called; last year’s extensions didn’t do much damage, but this year’s threaten the well-being of tens of millions of Americans.
The Unbearable Lightness of Being Right - Paul Krugman --- Ezra Klein and Evan Soltas had a rather uncharacteristically dyspeptic post this morning lamenting the failure of essentially anyone in DC to change policy proposals despite all the information that has come in undermining whatever intellectual basis those proposals might once have had. There’s a fair bit of obligatory both-sides-do-it false equivalence in their post; but that aside, they’re basically right. Except actually it’s worse than that. The austerity consensus that took over Washington (and Brussels, and London, and Frankfurt, and …) never actually had many facts behind it to begin with . It flourished through sheer incestuous amplification: the in-crowd reassuring each other that they were right, with journalists — as Ezra himself pointed out — simply adding to the problem: For reasons I’ve never quite understood, the rules of reportorial neutrality don’t apply when it comes to the deficit. On this one issue, reporters are permitted to openly cheer a particular set of highly controversial policy solutions. At Tuesday’s Playbook breakfast, for instance, Mike Allen, as a straightforward and fair a reporter as you’ll find, asked Simpson and Bowles whether they believed Obama would do “the right thing” on entitlements — with “the right thing” clearly meaning “cut entitlements.”
CBO | The Distribution of Major Tax Expenditures in the Individual Income Tax System: A number of exclusions, deductions, preferential rates, and credits in the federal tax system cause revenues to be much lower than they would be otherwise for any given structure of tax rates. Some of those provisions—in both the individual and corporate income tax systems—are termed “tax expenditures” because they resemble federal spending by providing financial assistance to specific activities, entities, or groups of people. Tax expenditures, like traditional forms of federal spending, contribute to the federal budget deficit; influence how people work, save, and invest; and affect the distribution of income. This report examines how 10 of the largest tax expenditures in the individual income tax system in 2013 are distributed among households with different amounts of income. Those expenditures are grouped into four categories:
- Exclusions from taxable income—
- Employer-sponsored health insurance,
- Net pension contributions and earnings,
- Capital gains on assets transferred at death, and
- A portion of Social Security and Railroad Retirement benefits;
- Itemized deductions—
- Certain taxes paid to state and local governments,
- Mortgage interest payments, and
- Charitable contributions;
- Preferential tax rates on capital gains and dividends; and
- Tax credits—
- The earned income tax credit, and
- The child tax credit.
The Challenge of Cutting Deductions to Lower Tax Rates - Two interesting new papers from the Congressional Research Service highlight a major challenge faced by any tax reform that reduces itemized deductions to help pay for lower tax rates—lots of middle-income people would lose at least some benefits from scaling back those deductions. It isn’t a new lesson, but it is one that bears repeating. For instance, a March 21 CRS paper shows that in 2010 about 40 percent of all deductions were claimed by households making between $20,000 and $100,000, with 28 percent going to those making between $50,000 and $100,000. Nearly half of tax filers making between $50,000 and $100,000 claimed deductions for mortgage interest and charitable giving, and more than half deducted state and local taxes.Those three deductions alone represent more than two-thirds of all itemized deductions. Thus, it is hard to imagine any base-broadening, rate-cutting reform plan that doesn’t include some cuts in those preferences. And taking that step threatens to make a lot of middle-income taxpayers very unhappy. As Bruce Bartlett (who tipped me off to the CRS papers in his New York Times blog this morning) notes, this may explain why so few tax reform plans ever identify a single tax preference they would target. Of course, higher income people disproportionately benefit from many deductions. For instance, the Tax Policy Center estimates that households making $500,000 or more represent less than 1 percent of all taxpayers. Yet, CRS estimates they claim about 15 percent of all deductions.But middle-income taxpayers may be more interested in what they’d lose, not in their hit relative to the wealthy.
The tax break state - Everyone always talks about the welfare state. But to understand who really wields power in Washington and what they actually want, you need to understand the tax break state. Luckily, the CBO released a major report this week breaking down tax expenditures (which is the boring, but more precise, term for tax breaks). Wonkblog’s Dylan Matthews already went through the major charts of the report (with other, slower Web sites catching up later). But to get a sense of the size and importance of these things, consider this: The top 10 tax expenditures total about $900 billion a year. Over half of them go to the top 20 percent of households. About a third go to the top 1 percent. The easiest way to understand the tax break state is to think of it in three clusters: (1) tax credits that boost the earnings of those in the bottom half of the income distribution, (2) tax deductions and exclusions that boost the middle class and upper-middle class, and (3) the exclusion of capital gains and dividends from income taxation, which goes to the top 1 percent.
Who Gets the Biggest Tax Breaks? Big Picture
Who Gets Tax Breaks? Tax Expenditures and Credits by Income Group - The CBO is out with a big new report on who gets what out of tax expenditures, the deduction, credits, and exclusions that have grown to cost the federal government hundreds of billions of dollars a year. Here’s the headline: the 10 major expenditures examined in the report cost the government $900 billion this year and will cost almost $12 trillion over the decade to come. That’s more than Medicare, defense or Social Security. So who’s getting all this money? The affluent, for the most part. Nearly half of the budgetary cost of the expenditures went to people in the top income quintile, which, for a family of four, means families making over $162,800 a year pre-tax: As a share of individuals’ income, the level of benefit doesn’t differ that much by class. In fact, the very poorest and the very richest each do better than those in the middle: It’s also worth noting that the kind of expenditures matters a lot in terms of who benefits. Refundable credits like the Earned Income Tax Credit or the Child Tax Credit are a huge deal for the bottom quintile, but they’re basically worthless for the top one percent: On the other hand, itemized deductions for state and local taxes, charitable contributions, and mortgage interest primarily benefit the rich*: Same goes, unsurprisingly, for the lower rates on capital gains and dividend income: Exclusions, or types of income that are just excluded from taxation (including, in many cases, payroll taxation) entirely, are a more mixed bag. The biggest exclusion, that for employer-provided health insurance, gives the most benefit to the bottom quintile, but the bottom 90 percent all together get about the same out of it. But the very rich don’t get much at all. On the other hand, other exclusions, such that for pension contributions and earnings, tend to benefit the wealthy more:
Tax Breaks Favor The Income Rich - Jon Perr at Crooks and Liars does a nice review on defining who benefits the most from tax breaks: CBO Study Shows Tax Breaks Favor the Rich “Every year, tax expenditures–Uncle Sam’s myriad credits, exclusion, loopholes and breaks–cost the U.S. Treasury over $1 trillion a year. To put that in perspective, that figure is greater than the cost of Medicare, Social Security and national defense. Much larger than this year’s projected budget deficit of $642 billion, tax expenditures equal roughly 30 percent of federal spending. It’s no wonder why Republicans are so fond of calling for closing loopholes while lowering rates to produce “revenue-neutral” tax reform. Jon goes on to add: But a new study of the top 10 tax expenditures also show why GOP leaders including Mitt Romney, Paul Ryan, and House Ways and Means Committee Chairman Dave Camp refuse to name a single loophole they would close to achieve it. As the new Congressional Budget Office (CBO) analysis shows, half the value of those $900 billion in tax breaks goes to the top quintile of American income earners. Nevertheless, their elimination would devastate lower and middle income households.
Thought Experiment: Why Do We Bother Paying Personal Taxes? - Since Mr. Krugman tells us all this spending and debt issuance/guarantees are not only good and necessary but in the long run, painless, why are we bothering with personal income taxes? The US government will collect approximately $2.0bn this year in Personal Income and Payroll taxes. But why? Why are we even bothering with this when today’s leading economists and politicians are telling us that debts/deficits don’t matter and running up astronomical debts is a long-term painless process? It’s practically patriotic. So why shouldn’t we just add our tax burden to the list of items the Fed should be monetizing? Seriously. Why not relieve the burden on every tax paying citizen in the United States (about 53% of us according to Mitt Romney)? You want an economic recovery? Reduce my taxes to zero and see how fast I go out and start spending some of that extra income.
IRS To No Longer “Waste” Money on Training - There is an aspect of the latest IRS scandal that I find absurd: IRS spokeswoman Michelle Eldridge said Sunday that spending on large agency conferences with 50 or more participants fell from $37.6 million in the 2010 budget year to $4.9 million in 2012. I have no idea whether 220 conferences costing $50 million over 3 years is too much or too little as far as a budget to reasonably train the IRS staff to enforce a very complicated tax code. OK, there may have been a few excesses here and there but most tax directors will tell you that the IRS desperately needs to increase the abilities of their staff. And yet the politicians and even Ms. Eldridge are arguing that slashing the training budget is a sign of good management. Penny wise – pound foolish.
Rep. McDermott wonders why tea party groups applied for taxpayer-funded subsidies - Rep. Jim McDermott (D-WA) on Tuesday questioned why tea party groups were seeking to be subsidized by the government. At a House hearing on IRS misconduct, McDermott acknowledged the federal tax agency had inappropriately used political criteria to locate nonprofit applications that needed extra review. “But as I listen to this discussion, I’d like to remind everyone what we are talking about here,” he continued. “None of your organizations were kept from organizing or silenced. We are talking about whether or not the American taxpayers would subsidize your work. We are talking about a tax break.”
Ending Corporate Tax Avoidance: Just the Debate I Asked For! - You may recall a post from the other day calling for a robust discussion of alternatives to our current system for “taxing”—that’s right, it belongs in quotes—multinationals. Well, here’s an excellent example of such a discussion from the NYT’s Room for Debate column. The fundamental problem is the ability under our current tax code of multinationals to hide or shelter their income, to book their earnings in places with low or no taxes at all, and then to just leave them there, at least on paper, forever (“deferral”). Therefore, the solutions thus tend to range along a continuum from either giving up on trying to close the shelters and finding other ways to tax foreign earnings, to making the current system work through international cooperation, to ending deferral. The corporations themselves tend to want a territorial system, which pretty much locks in what we have today, as my CBPP colleague Chye-Ching Huang points out. Corporate lobbyists have another idea: a 0 percent or very low U.S. tax rate on their foreign profits. They give this a sophisticated name — a “territorial” tax regime. It would get rid of the incentive for multinationals to keep profits offshore, but it would increase their incentive to shift profits and investments overseas in the first place. Avi-Yonah, suggests that going territorial may seem ideal given the way globalization has muddied corporations’ national identities, but:…as the Apple case shows, such a territorial system invites multinationals to shift their profits to tax havens. Avoiding that outcome without over- or under-taxation requires a degree of coordination among countries that is difficult to achieve.
Why capital gains should be taxed as income - Last week’s Munk debate featured one of those strange-bedfellow moments, when Paul Krugman agreed with Art Laffer that the tax rate on capital gains should be the same as the tax rate on income. (In fact, Laffer went one step further than that, saying that even unrealized capital gains should be taxed at the same rate.) Normalizing the capital-gains tax rate so that it’s the same as the income-tax rate is an easy way to bring a lot of money into the public fisc — some $161 billion per year, according to the CBO. So why aren’t we doing it? Evan Soltas does his best to answer that question with his “Defense of the Capital-Gains Loophole”. Here’s the meat of his argument: Most tax breaks create distortions. The tax break for capital gains does the opposite: It reduces a distortion. Investment is really deferred consumption. Taxing consumption tomorrow at a higher rate than consumption today — which is what a tax on investment income does — encourages people to shift consumption forward in time, and that’s inefficient. This doesn’t make a lot of sense. Firstly, investment really isn’t deferred consumption. The amount of money invested, in the world, is going up over the long term, not down — which means that once you look past the natural tidal movements of money in and out of various investment vehicles, it’s reasonable to say that money, once it gets invested, stays invested. . That’s the inefficient thing: money that could be cycling through the economy at high velocity is instead tied up in investment vehicles, and might not be spent for decades, if at all.
Obama’s Trade Nominee Stashes Cash in Offshore Tax Haven - Michael Froman is President Obama's nominee to be the new U.S. Trade Representative, the government's top international trade agreement negotiator. Also, Michael Froman has cash stashed in the Cayman Islands and takes advantage of tax loopholes Obama has publicly railed against. Hmm. The NYT reports on the results of Froman's financial disclosure forms, handed over to the Senate committee handling his nomination process. Well now, let's see here, we need a squeaky clean representative of America's financial policies, everything seems to be in order here... oh, well, one thing:According to a 2011 financial document, Mr. Froman held $490,845 in Citigroup’s CVCIGP II U.S. Employee L.P. fund, based in Grand Cayman’s Ugland House [pictured], a modest, white-washed building that has been widely cited as a symbol of tax avoidance since it is home to nearly 19,000 business entities seeking favorable tax treatment. Yeah...and the other thing, while you're down there: Mr. Froman’s 2009 financial disclosure forms showed holdings in three different Citigroup accounts that maximize profits through “carried interest,” a tax loophole that allows private equity and hedge fund managers to claim compensation as capital gains, thus paying a lower tax rate than if that pay is taxed as income.
Is the Fed Squeezing the Shadow Banking System? - Some observers believe the Fed's large scale asset purchases (LSAPs) are actually a drag on the economy. They note that the Fed's purchases of treasuries is reducing the supply of safe assets, the assets that effectively function as money for the shadow banking system. They do this by serving as the collateral that facilitates exchange among institutional investors. Critics, therefore, contend that LSAPs are more likely to be deflationary than inflationary. A recent piece by Andy Kessler in the WSJ typifies this view: So what's the problem? Well, it turns out, there's a huge collateral shortage. Global bank-reserve requirements have changed, meaning more safe, highly liquid securities like Treasurys are demanded instead of, say, Greek or Cypriot debt. And lately, Treasurys have been getting harder to find. Why? Because of the very quantitative easing that was supposedly stimulating the economy. The $1.8 trillion of Treasury bonds sitting out of reach on the books of the Fed is starving the repo market of safe collateral. With rehypothecation multipliers, this means that the economy may be shy some $5 trillion in credit...
Dodd-Frank isn't close to implemented - One of the reasons the impending D.C. Circuit confirmation battles are so important is that the court has played, and will continue to play, a big role in Dodd-Frank implementation. The court has jurisdiction over a wide variety of regulatory agency decisions, and as Haley Sweetland Edwards at the Washington Monthly has explained, it’s already used that power to weaken trading restrictions that Dodd-Frank authorized. That, and other hurdles that regulators have had to jump through, have added up to a bill that’s far behind where it should be implementation-wise. Taegan Goddard points to a remarkable series of charts by Frank Pompa and Denny Gainer at USA Today illustrating just how far behind Dodd-Frank is. Only 153 (38.4 percent) of the 398 required rules in the bill have been finalized. That’s despite the fact that 70.1 percent were supposed to be finalized by this past Monday
Mystery of the missing Fed regulator - It’s one of those touchy subjects that Federal Reserve officials don’t really want to talk about, thank you very much. For nearly three years now, no one has been tapped to serve as the U.S. central bank’s Vice Chairman for Supervision. According to the landmark 2010 Dodd-Frank bill, which created the position to show that the Fed means business as it cracks down on Wall Street, President Obama was to appoint a Vice Chair to spearhead bank oversight and to regularly answer to Congress as Chairman Ben Bernanke’s right hand man. For all intents and purposes, Fed Governor Daniel Tarullo does that job and has done it for quite some time. He’s the central bank’s regulation czar, articulating new proposals such as the recent clampdown on foreign bank operations, and he keeps banks on edge every time he takes to the podium.. But he has not been named Vice Chair, leaving us to simply assume he won’t be. A Fed spokesman pointed to what might be Bernanke’s latest public comment on the issue, back in February, 2011, when he told the Senate Banking Committee that the Administration “has not yet nominated anyone, so we’re still nowhere in that respect.” Tarullo, Bernanke added at the time, “is taking the lead on the supervisory and relevant rule-writing issues.” The White House declined to comment.
SIFIs: AIG, Prudential, and GE Capital are systemically important financial institutions.: AIG, Prudential Financial, and GE Capital aren't "banks" in a traditional sense. But the Financial Stability Oversight Council has made a preliminary determination that they should be considered "systemically important financial institutions" in the sense of the Dodd-Frank bill and thus subject to heightened financial scrutiny. This is, I think, an underrated aspect of Dodd-Frank vis-a-vis some other financial regulatory approaches that seem appealingly simple. The idea here is that even though these institutions aren't banks, a catastrophic failure of any one of them would pose severe risks to the banking system. AIG is the clear precedent here. Banks were counting on AIG being able to make good on its insurance contracts in order to keep their own balance sheets solvent. But AIG screwed up and mispriced its own insurance contracts. So had AIG failed, it would have been unable to pay banks everything they were owed. And had banks been unable to collect, they would have failed as well. So the federal government ended up needing to shoulder AIG's financial obligations. The idea is that an institution in that role should be regulated in advance in light of its heightened importance to the overall financial system. An approach that focused exclusively on bank size or bank leverage could end up ignoring the possibility of offloading bank risk to non-bank institutions, which would be particularly unfortunate since that exact thing already happened in the case of AIG.
Better Late Than Never on Deeming Nonbanks Too Big to Fail - New systemic-risk tags are better late than never. The American International Group, GE Capital and Prudential Financial are among the first nonbank firms to be deemed systemically important financial institutions by the Financial Stability Oversight Council. These are no-brainers for the moniker. The trouble is, five years on, watchdogs are still bogged down in the last crisis rather than looking out for the next one. All three financial giants on Monday said they had been flagged for the stiffer oversight bestowed on systemically important institutions, but A.I.G. and GE Capital seem especially deserving. Uncle Sam had to swoop in to help both during the financial crisis, with A.I.G. receiving a $182 billion lifeline and GE Capital a federal guarantee for its new debt. It’s taken a long time, however, to reach this point. Regulators need to be careful that they justify the label for systemically important financial institutions, which can force companies to spend a lot more on compliance. But former Treasury Secretary Timothy F. Geithner identified A.I.G. and GE Capital three years ago as the type of nonbanks deserving special regulatory attention. In the interim, the two companies have largely fixed their weaknesses, diminishing the danger they once posed to the financial system.
Multinationals’ Support for Big Banks Not Persuasive - Simon Johnson - Large multinational nonfinancial companies waded into the debate over too-big-to-fail financial institutions this week, coming down strongly on the side of very large global banks. Specifically, the Business Roundtable, a group representing big nonfinancial companies, sent a letter to the leadership of the House Financial Services Committee and the House Ways and Means Committee arguing in favor of including financial services in any potential new trade agreement with Europe (known as the Transatlantic Trade and Investment Partnership). The rationale is that “the negotiations will provide an opportunity to address market access barriers that keep U.S. businesses from enjoying full opportunities in Europe.” And the letter comes from the International Engagement Committee and the Corporate Governance Committee of the Business Roundtable, a distinguished group of executives. It will carry weight. There are three reasons to worry a great deal about the thinking behind this intervention: the motivation, the facts and the implications for our ability to limit systemic risks.
Wall Street Sees Trade Deals as Opportunity to Further Gut Dodd-Frank - Despite Wall Street kicking the crap out of reformers in Congress and in the regulatory bodies, they want more. The banksters demand to have what they have had historically – complete domination. Therefore, they are looking for other avenues to eviscerate what little is left of financial reform and seemed to have found another one in trade deals. U.S. bankers and insurers are trying to use trade deals, which can trump existing legislation, to weaken parts of the Dodd-Frank Act designed to prevent a repeat of the 2008 financial crisis. While the companies say they are seeking agreements that preserve strong regulations and encourage economic growth, their effort is drawing fire from groups who argue that Wall Street wants to make the trade negotiations a new front in its three-year campaign to stop or alter the law. Yet another reason not to do the bailouts without conditions.
Fed’s Plosser Calls for Too-Big-to-Fail Banks to Hold More Capital - A U.S. central bank official repeated Thursday his dissatisfaction with current efforts to reduce the risk of too-big-to-fail banks, and said he instead wants these mega financial firms to hold higher levels of capital as a way of protecting the economy. More capital, as well as more straightforward rules in determining the right level of capital, would do a lot to strengthen the basic functioning of the financial system, Federal Reserve Bank of Philadelphia President Charles Plosser said in a speech. Mr. Plosser is not a voting member of the monetary-policy-setting Federal Open Market Committee. He didn’t make any forward looking comments on the economy or central bank policy in his prepared remarks. Mr. Plosser’s disapproval of the massive Dodd-Frank financial regulatory overhaul legislation has been one of his regular themes. His speech Thursday before the Boston College Carroll School of Management largely repeated comments he has made in recent addresses. Much as Mr. Plosser prefers simple rules to guide monetary policy, he would like something similar to be applied to banking regulation. Mr. Plosser is not alone in being unhappy with the complexity of bank regulation, but it is not clear that after the hard-fought battle to pass Dodd-Frank, there is any appetite for a major revision or replacement for the law.
Dan Kervick: Do Banks Create Money from Thin Air? from naked capitalism Yves here. This post by Kervick is LONG, but that’s because he unpacks the “creation” of money in a step-by-step manner. Your patience will be rewarded. It is sometimes said that commercial banks in our modern monetary system create money “from thin air”. While there is truth in this metaphorical claim, the metaphor can also be seriously misleading, and leads some to attribute powers to commercial banks that are actually retained by the government alone under our system. It is worth trying to get clear about all this.
Goldman Says They Don’t Benefit From A Too Big To Fail Funding Advantage - Goldman Sachs wants you to believe that Too Big To Fail banks do not actually enjoy a funding advantage. The Wall Street firm recently put out a paper with the mild title of "Measuring the TBTF effect on bond pricing." It argues that the commonly-held view that TBTF banks can borrow cheaply because bond investors expect the government will support them used to be a little bit correct. Then it became very correct during the financial crisis. But now is totally incorrect. The study argues that that six banks with more than $500 billion in assets paid interest rates on their bonds that were an average six basis-points lower than smaller banks from 1999 to mid-2007. When the financial crisis struck, the funding advantage grew far wider. But beginning in 2011, the funding difference reversed, with the biggest banks now paying an average of 10 basis points more than smaller banks. "This undermines the notion that government support drives a TBTF funding advantage," the report says. Well, not exactly. CNBC.com The Goldman researchers are practicing a bit of sleight-of-hand here. The argument about TBTF funding has never been predicated on the absolute funding levels of banks or the funding of big banks relative to small banks. Rather, it's that the expectation of government support lowers the cost of funds relative to what they would be otherwise. To put it more simply, the TBTF funding argument is that Goldman, with implicit government support, pays less to issue bonds than Goldman without support would.
Bill Black: How Elite Economic Hucksters Drive America’s Biggest Fraud Epidemics - This article is part of an ongoing AlterNet series, "The Age of Fraud." What do you get when you throw together economic fraudsters, plutocrats and opportunistic criminals? A financial crisis, that’s what. If you look back over the massive frauds that have swept the country in recent decades, from the savings and loan crisis of the 1980s to the 2007-'08 financial crash, this deadly combination always appears. A dangerous cycle begins when prominent economists pander to plutocrats and bought politicians, who reward them with top posts, where they promote the perverse economic policies that cause fraud epidemics. Crises develop, and millions of people are ripped off. Those who fight for truth are ignored or ruined. The criminals get wealthier, bolder and more politically powerful, and go on to hatch even more devastating cons. The three most recent financial crises in U.S. history were driven by a special type of fraud called “control fraud” — cases where the officers who control what look like legitimate entities use them as “weapons” to commit crimes. Each time, Alan Greenspan, former chairman of the Federal Reserve, played a catastrophic role. First, his policies created the fraud-friendly (criminogenic) environment that produces epidemics of control fraud, then he failed to identify those epidemics and incipient crises, and finally, he failed to counter them.
One of Wall Street’s Riskiest Bets Returns - Investors are once again clamoring for a risky investment blamed for helping unleash the financial crisis: the synthetic CDO. In a sign of how hard Wall Street is trying to satisfy voracious demand for higher returns amid rock-bottom interest rates, J.P. Morgan Chase and Morgan Stanley bankers in London are moving to assemble so-called synthetic collateralized debt obligations. CDOs give investors a chance to bet on the creditworthiness of a basket of companies. Basic CDOs pool bonds and offer investors a slice of the pool. Synthetic CDOs pool, instead of the bonds themselves, insurance-like derivative contracts on the bonds. Like their crisis-era predecessors, the new CDOs would be sliced up into different levels of risk and returns. Investors who want a chance at the highest returns would have to buy the riskiest slice. While spreading risk in some ways, synthetic CDOs also can multiply the financial damage if companies fall behind on their debt payments. During the financial crisis, CDOs pegged to soured mortgage loans caused losses to careen around the world. Their catastrophic impact was denounced by many lawmakers and investors, and the market for all kinds of highly engineered financial instruments evaporated
Quelle Surprise! US and UK to File Criminal Charges Against Small Fry for Barclay’s Libor Abuses - Yves Smith - Now before anyone gets excited about the specter of bankers doing a perp walk, the early word in a Wall Street Journal story on criminal charges being readied against former Barclays bankers says that the prosecutions will target “midlevel traders.” This exercise thus continues the established pattern of small fry serving as human shields for managers and executives. As anyone in finance knows, just going after the little guys, while better than nothing, is hardly adequate. Senior executives get paid on the profits (or more accurately, the apparent profits) of the activities in their purview. And as we’ve also discussed (long form in ECONNED, but also often here on this blog) risk management and other control functions are too often politically weak by design. Even if the staff in those areas are making an honest effort at doing their job, their real function is often to serve as a fig leaf for management (“look, we had all the box checking stuff required by the law in place. It’s not our fault if some rogue employees were savvy enough to game our systems”). And on top of that, the incentives for the staffers in these units is frequently to curry favor with the producers.
Why Didn't the SEC Catch Madoff? It Might Have Been Policy Not To - Taibbi - More and more embarrassing stories of keep leaking out of the SEC, which is beginning to look somehow worse than corrupt – it's hard to find the right language exactly, but "aggressively clueless" comes pretty close to summing up the atmosphere that seems to be ruling the country's top financial gendarmes. The most recent contribution to the broadening canvas of dysfunction and incompetence surrounding the SEC is a whistleblower complaint filed by 56-year-old Kathleen Furey, a senior lawyer who worked in the New York Regional Office (NYRO), the agency outpost with direct jurisdiction over Wall Street. Furey's complaint is full of startling revelations about the SEC, but the most amazing of them is that Furey and the other 20-odd lawyers who worked in her unit at the NYRO were actually barred by a superior from bringing cases under two of the four main securities laws governing Wall Street, the Investment Advisors Act of 1940 and the Investment Company Act of 1940. According to Furey, her group at the SEC's New York office, from a period stretching for over half a decade through December, 2008, did not as a matter of policy pursue cases against investment managers like Bernie Madoff. Furey says she was told flatly by her boss, Assistant Regional Director George Stepaniuk, that "We do not do IM cases."Some background is necessary to explain the significance of this tale.
Why is insider trading on the rise? -The scope of something so clandestine is inherently difficult to pin down, but the number of insider-trading referrals to the S.E.C. from FINRA, the financial industry’s self-regulatory body, keeps going up. The S.E.C.’s enforcement actions have been on the rise as well, and the past three years saw more of them than any other three-year period in its history. Andrew Ceresney, the co-director of enforcement at the S.E.C., told me, “We’ve gotten better at detecting illegal activity, and at using technology that allows us to draw connections and see patterns.” But this isn’t just a case of vigilant policing giving the impression of a rise in crime; a number of studies of market-moving events have documented a boom in “suspicious activity” (that is, more trading than usual) around those events. The consequences of being caught have never been higher—Raj Rajaratnam, the founder of the hedge fund Galleon Group, was sent to prison for eleven years—but hard-pressed fund managers continue to be tempted. Competition in the investing world is fierce: there are now nearly eight thousand hedge funds, and on average they have underperformed the stock market for nine of the past ten years. Whatever your supposed market-beating strategy is, someone else is probably duplicating it, and everyone is desperate to find an informational edge. There was a time when big investors could come by that edge quasi-legally, as companies leaked information to select investors and analysts. But in 2000 the S.E.C. passed a rule called Regulation F.D., which required companies to disclose material information publicly or not at all.
How and whether to fight insider trading -- Jim Surowiecki has an excellent column on insider trading this week. He claims — without hyperlinks it’s hard to judge this, but I do trust him — that the increase in insider-trading prosecutions isn’t just a reflection of increased prosecutorial zeal, but actually reflects a real uptick in insider trading itself. Surowiecki sees three main reasons why this might be happening. The first is Reg FD, which made it unambiguously illegal to tip well-connected traders with inside information. The second is Sarbanes-Oxley, and the general “proliferation of consultants” which has both increased the number of places from which inside information can leak, and which has increased the amount of deniability that any leaker enjoys. Finally, there’s the fact that companies “have a much better real-time sense of how they are doing”, these days, which increases the amount of time that information has to remain secret before it is made public in quarterly earnings reports. Surowiecki has a potential solution to these problems: In a world where companies increasingly know about their business in real time, it makes no sense that public reporting mostly follows the old quarterly schedule. Companies sit on vital information until reporting day, at which point the market goes crazy. Because investors are kept in the dark, the value of inside information is artificially inflated… More consistent, if not real-time, data about revenue, new orders, and major investments would help investors make more informed decisions and, into the bargain, would diminish the value of insider information.
Fed’s Kocherlakota Sees Greater Concern About Risk in Markets - Federal Reserve Bank of Minneapolis President Narayana Kocherlakota said he sees changes in asset markets since 2007 including greater concern about risk that may reverse “only slowly.” Borrowing constraints have tightened and the supply of what are considered safe assets has declined, Kocherlakota said today in slides prepared for a speech in Istanbul. U.S. central bankers are trying to understand shifts in financial markets and the economy following a housing crash that led to the worst recession since the 1930s. The Fed has kept interest rates near zero since December 2008 and has expanded its balance sheet to more than $3.3 trillion to support the recovery. The supply of what are considered risk-free assets has shrunk because sovereign debt has become riskier and U.S. property values are lower, the Fed district bank chief said. More research is needed on how nominal wages respond to an excess amount of labor, said Kocherlakota, who doesn’t vote on the Federal Open Market Committee this year. The slides released today don’t include a discussion on the outlook for monetary policy or the economy.
Some Markets Showing Addiction to Cheap Money, Fed’s George Warns - The Federal Reserve‘s highest-profile dissident policymaker warned Tuesday some markets are showing signs of an unwelcome addiction to the central bank’s cheap money, and repeated her call to pull back on monetary policy stimulus. Federal Reserve Bank of Kansas City President Esther George has long opposed the very aggressive stimulus her institution has been providing the economy, fearing the massive liquidity may do more harm than good. She said in a speech evidence is mounting that some of the unintended consequences of Fed policy are starting to build. “Several sectors in the economy are becoming increasingly dependent on near-zero short-term interest rates and quantitative-easing policies,” and for many, unprecedented actions taken by the Fed are simply coming to be seen as normal, Ms. George said. More broadly, “a number of global economies have come to depend on central banks to provide unprecedented amounts of money to engineer growth and influence asset values, fearing otherwise that deflation would take hold,” she said. The official is a voting member of the monetary-policy-setting Federal Open Market Committee. Ms. George has long wanted the Fed to end its bond-buying campaign, fearing these purchases will create new bubbles and fuel future inflation.
Fed’s $5.7 Trillion Gift Imperiled on Yield Rise: Credit Markets - The most relentless surge in borrowing costs for U.S. corporate debt in four years is threatening to derail this year’s record pace of sales as concern deepens the Federal Reserve will curtail unprecedented stimulus. While the Fed has enabled companies to borrow $5.74 trillion in the bond market since the end of 2008 by suppressing benchmark interest rates at close to zero percent, debt investors are becoming more discriminating as policy makers consider tapering their monthly bond purchases. That may blunt the record pace of sales, which reached $757.3 billion this year, after an unprecedented $1.48 trillion of issuance in 2012, according to data compiled by Bloomberg. Paring Inventories Concern that interest rates will rise further has sparked a sell-off in longer-dated corporate debt, leaving $146 billion of investment-grade bonds in the U.S. with maturities greater than 10 years trading below par, Bloomberg bond index data show. The discount notes have swelled from less than $30 billion at the beginning of May.
Junk Bond Funds See Record $4.6 Billion of Outflows - Lipper - Bond funds saw waves of outflows in the week ended Wednesday, with funds dedicated to low-grade, or "junk," debt seeing record withdrawals, according to fund tracker Lipper. As much as $4.63 billion was pulled from mutual funds and exchange-traded funds dedicated to junk bonds, the data provider said late Thursday, compared with $875 million in outflows the prior week. That reading contributed to what was the second largest weekly outflow on record for taxable bond funds overall, at $9.1 billion. One third of the money, or $1.4 billion, came out of ETFs, a record that surpassed the previous weekly record outflow of $1.1 billion set in February. Investors are yanking money out of bond funds in anticipation of the Federal Reserve winding down its monetary easing policies as the economy appears to gain steam. A pullback in that stimulus should cause interest rates to rise from their rock-bottom levels, hurting the price of fixed-rate bonds. Bond prices fall as yields rise.
Quant hedge funds hit by US bonds sell-off - FT.com: Some of the world’s biggest quant hedge funds have suffered steep losses in the past two weeks following the sell-off in global bond markets. So-called “CTAs”, which use computer models to automatically spot and ride market trends, were caught out as investors anticipated an end to the Federal Reserve’s measures to stimulate the US economy, triggering a global rout in fixed income investments. Bond yields have risen sharply from some of their lowest levels in decades in the past fortnight, leaving funds with large holdings badly hit. Many quant funds have been major buyers of bonds over the past few years as their algorithms have followed yields lower. “Since mid-May it has been a perfect storm of some of the biggest trends in markets reversing all at once,” said a senior manager at one large quant fund. “It has been particularly brutal.”
Vital Signs Chart: Companies Holding Record Cash Pile - American companies are keeping a record cash pile. U.S. nonfinancial corporations held $1.78 trillion in cash and other liquid assets in the first quarter of the year, up $46 billion from the end of 2012, the Federal Reserve said on Thursday. But as a share of total corporate assets, cash holdings were little changed at 5.6%, down from a recent high of 6.3% in late 2009.
S&P Sees U.S. Corporate Debt Maturities Peaking in 2017 - Standard & Poor's Ratings Services predicts scheduled maturities of U.S. corporate debt will peak in 2017 as companies have taken advantage of record-low yields and strong demand for debt issuance over the past year to extend their maturity schedule by refinancing debt. The credit-ratings company said it expects $3 trillion of U.S. corporate debt to mature between April 2013 and the end of 2017. S&P expects scheduled debt maturities to peak at $782.5 billion in 2017. The company said last year's refinancing report forecast U.S. corporate maturities to peak at $699.6 billion in 2014. S&P said speculative-grade bond and leveraged loan issuance averaged $652 billion in 2011 and 2012, and issuers used about 50% of those proceeds for refinancing.
‘Virtual’ Currencies Draw State Scrutiny - State banking regulators are scrutinizing companies that let people buy and sell virtual currencies such as bitcoin, and some are looking at requiring costly licenses, according to people familiar with the efforts. It is the latest sign that the freewheeling world of virtual currencies is about to get less free. Just this week, prosecutors claimed to have exposed a $6 billion money-laundering ring that allegedly relied on them.Virtual" currencies can be used just like dollars among people who agree to accept them. One big difference is that they aren't backed by a government. Instead, bitcoin enthusiasts say, the currency derives its value from its limited supply and the support of the people using it. In the past three months, the Treasury Department, prosecutors and now state regulators have taken aim at virtual-currency exchanges, telling them they must follow traditional rules aimed at thwarting money-laundering. The lightly regulated currencies have caught the attention of people who allegedly use some of them to mask profits from illegal activities. Companies using virtual currencies said they welcome the regulatory push because it helps legitimize the practice and build trust with users and investors. But new rules could also make the systems more cumbersome, taking away some advantages, currency experts say.
BIS lays out “simple” plan for how to handle bank failures (Reuters) - Central bank forum the Bank for International Settlements laid out a blueprint on Sunday for how to recapitalize a major lender in the event of a failure, seeking to avoid the sort of chaotic ad hoc rescues seen since 2008's financial crash. Authorities have been grappling since the collapse of U.S. investment bank Lehman Brothers five years ago with the question of how banks regarded as systemically important - or too big to fail (TBTF) - can be recapitalized without causing panic and without needing taxpayer cash. The BIS paper released on Sunday said its plan would allow banks to be recapitalized quickly and easily and would allow authorities to give an unequivocal guarantee that insured depositors would not lose savings. "(It) proposes a simple recapitalization mechanism that is consistent with the rights of creditors and enables recapitalization of a TBTF bank over a weekend without the use of taxpayers' money," the paper said. Under the template laid out by BIS, which is termed a creditor-funded recapitalization mechanism, the bank would undergo a forced recapitalization by its creditors when it reaches the point of failure. The ownership of a bank would be transferred to a newly created temporary holding company over a weekend. The bank is then immediately recapitalized by writing off the claims of creditors. The authors suggested the blueprint
Data Link Helps Shed Light on Banks and Public Equity - NY Fed - In this post, we offer comparisons between banks with and without publicly traded equity. Our post uses the link produced by the New York Fed containing regulatory identification numbers (RSSD ID) from the National Information Center (NIC) to the permanent company number (PERMCO) used by the Center for Research in Security Prices (CRSP). The list available via the data link allows researchers to match regulatory information on U.S. bank holding companies (BHCs) with equity market information, including security prices. The link can be used to assist academic papers that conduct event studies on banks (recent papers using these data include Baker and Wurgler [2013] and Ettredge et al. [2013]).
Regulatory failure du jour, overdraft-fee edition - This is a chart of US banks’ overdraft revenue over the past 13 years. It was growing steadily until the Dodd-Frank Act passed in 2010, at which point it dropped for a couple of years, but now it’s back on its upward path, and it’s projected to hit a new all-time high by 2016. (The source is Moebs, here and here.) This chart is not what I expected to see when I wrote an NYT op-ed last year, talking about the way in which the new rules governing overdrafts were resulting in banks charging monthly fees for checking accounts instead. . No longer, I said, could big banks count on a steady source of income from relatively poor Americans paying $30 in charges for a $4 cup of coffee. But if you look at this chart, the drop-off in overdraft income was relatively modest. Overdraft fees fell from $37.1 billion in 2009 to $31.6 billion in 2011 — which was still higher than they had been in 2006, or any year previously. This, it seems to me, is a clear failure of behavioral economics — or, to put it another way, shows the degree to which a determined corporation can circumvent rules designed to prevent fee-gouging. Under the new regulations, banks could no longer automatically sign account-holders up for these huge overdraft fees; instead, those account holders had to opt in. But a study last year from the Pew Charitable trusts — which came out a couple of months after my op-ed — found that “more than half of those hit with overdraft fees did not believe they had opted in to the policies”.
Unofficial Problem Bank list declines to 761 Institutions - This is an unofficial list of Problem Banks compiled only from public sources. Here is the unofficial problem bank list for May 31, 2013. Changes and comments from surferdude808: As expected, the FDIC released quarterly industry results for the first quarter on Wednesday and its enforcement action activity through April 2013 on Friday. Also, the FDIC closed a bank today. These actions contributed to many changes to the Unofficial Problem Bank List. In all, there were eight removals and two additions, which leave the list with 761 institutions with assets of $277.3 billion. A year ago, the list held 927 institutions with assets of $355.7 billion. After the changes this week, assets declined by $6.5 billion. However, $4.9 billion of the decline came from asset shrinkage during the first quarter. For the month of May, the list declined by 14 institutions and assets by $8.0 billion. The month included five additions, four failures, four unassisted mergers, and 11 action terminations. Since March 2012, the 11 action terminations match the lowest total posted in October 2012. Along with industry quarterly results, the FDIC released the Official Problem Bank count of 612 institutions with assets of $213.3 billion. We anticipated the difference between the two lists to come in at 150 institutions, which was close to the actual difference of 149. The difference peaked at 185 in the second quarter of 2012.
Why GE and Citi Settled with FHFA - Time is money, especially with lawyers. Some quick calculations explain why General Electric and Citigroup were the first among 18 bond underwriters to extricate themselves from the protracted litigation involving the sale of residential mortgage bonds to Fannie Mae and Freddie Mac. For GE and Citi, the potential liability wasn't that large. GE sold the government-sponsored enterprises $550 million in triple-A-rated private label securitizations, which are expected to be repaid in full. Citi sold $3.5 billion in triple-A bonds, of which only $1.5 billion are currently sub-investment-grade. Losses on those bonds, based off Moody's estimates, should be below $300 million. Any legal damages would be a fraction of actual losses. By way of contrast, Bank of America, combined with Merrill Lynch and Countrywide, sold the GSEs more than $40 billion in bonds. All of the 18 complaints against the bond underwriters, which seem like carbon copies of complaints filed by MassMutual, Allstate, the Federal Deposit Insurance Corp. and others, allege that each and every Securities and Exchange Commission filing made the same false representations: The average loan-to-value in the mortgage pool was materially understated, and the rate of owner occupancy was materially overstated. It's hard to come away from reading those complaints and not get the strong impression that the banks' due diligence was a joke.
Feds crack down on foreclosure auction scams - At the height of the financial crisis, bargain hunters would gather each week on county courthouse steps to bid on foreclosed properties throughout Northern and Central California. The inventory lists were long, especially in hard-hit areas such as Sacramento and Stockton. But the auctions were generally short affairs — often because real estate speculators were illegally fixing the bidding process. In the past three years, federal prosecutors have charged 54 people and two companies in three states for bid-rigging during courthouse auctions of foreclosed properties. Most cases originated in California, the state with the highest foreclosure rate during the financial crisis. Nearly identical rings were also broken up in Raleigh, N.C., and Mobile, Ala. Working in concert, the would-be buyers would appoint just one person to bid on each property on the auction block, thus securing the "winning" bid. Minutes after the official proceeding was over, they would then conduct an auction among themselves, often on the same courthouse steps. That's when a property's true price would emerge. The conspirators would then divvy up the difference paid at the official auction and the private one. Federal prosecutors say such schemes have operated for decades, once earning a few thousand dollars per property. But the explosion of foreclosures amid the country's financial meltdown a few years ago upped illicit gains to millions of dollars. The scammers took money that otherwise would have gone to banks selling the foreclosed properties or beleaguered homeowners who should have been compensated.
Attorney general sues HSBC over foreclosures– Thousands of New Yorkers have likely been denied a better chance to get their homes out from under foreclosure by HSBC Bank USA and its Depew mortgage operations facility, Attorney General Eric Schneiderman is charging in a new lawsuit. The legal action, to be filed today in State Supreme Court in Erie County and to be unveiled by the attorney general in a morning news conference in Buffalo, accuses the banking giant of illegally ignoring a state law designed to get homeowners and banks into settlement talks to resolve foreclosure cases. “Put simply,’’ according to the lawsuit obtained Monday by The Buffalo News, HSBC’s “illegal business practices make it more likely that homeowners will unnecessarily lose their homes.” The attorney general’s Buffalo field office found more than 200 cases just in Erie County in which the bank ignored a state law to move delinquent mortgage holders into settlement talks to avoid foreclosure. In nine cases, HSBC filed required paperwork more than 900 days late. At issue is a state law that requires lenders to file a “request for judicial intervention” when they sue a homeowner and to notify a county clerk of the legal action. That intervention filing then is supposed to jump-start a settlement conference – within 60 days – to try to resolve the homeowner’s financial issue before moving to final foreclosure.
Judges blame banks for foreclosure slowdowns, but some see good in delay - Tampa - Half a decade since the housing bust, many foreclosures are showing their age. A quarter of cases now in Hillsborough court are at least 3 years old. So who's keeping Florida's more than 350,000 pending foreclosures in court? Judges largely blame the banks. State court data show banks regularly delay cases so long that judges drop them for lack of action. That's right: The same industry facing billions of dollars in punishment for hastily whizzing foreclosures through court a few years ago now isn't moving fast enough, court leaders say. "Foreclosures should be one of the simplest forms of civil litigation … but the lenders are sometimes their own worst enemies," "For whatever reason — a business decision, moratorium issues or they're just overloaded — they don't seem willing to push the cases they've filed," he said. Banks defend their foreclosure practices by blaming overloaded courts for the slog.
Undisclosed stress test shows FHA could lose $115 billion - The WSJ reported today (Tuesday, June 4) that the FHA had conducted a previously undisclosed stress test which found FHA losses could hit $115 billion under Federal Reserve bank stress test. FHA chose to not disclose the test’s results or even note that it had been performed. One FHA email stated “we just do not want that analysis to be in the actuarial review report” and continued “in Congressional hearings, it is quite possible that we will be required to present this information on-the-record, but that will be well after the actuarial review is released and the initial media coverage takes place.” The existence of the undisclosed test came about as the result of an investigation by the House Oversight and Government Reform Committee. I have written extensively about the FHA’s weak financial condition and that it has a net worth of negative $27 billion under private generally accepted accounting principles. The FHA insures over $1.1 trillion in mortgage loans — an amount larger than the assets of all but the top four bank holding companies in the US. The Fed test is a regulatory tool used “to ensure that financial institutions have robust capital planning processes and adequate capital.” The stress scenario is not a forecast, but a hypothetical environment two years in duration designed to assess the bank’s strength and resilience to an adverse economic environment. Its application to the FHA would be critical in helping gauge the level of exposure faced by taxpayers — the ultimate backstop behind the FHA. Consider the benefits of applying such a test to Fannie and Freddie (GSEs) in the run up to their entering conservatorship in 2008. For that matter, the Federal Housing Finance Agency should immediately consider putting the GSEs through the paces of the Fed stress test.
Senators Draft Plan to Abolish Fannie Mae, Shrink Backstop - A bipartisan group of U.S. senators is putting the final touches on a bill that would liquidate Fannie Mae and Freddie Mac (FMCC) and replace them with a government reinsurer of mortgage securities behind private capital. The legislation, written by Tennessee Republican Bob Corker and Virginia Democrat Mark Warner with input from other senators, is likely to be the first detailed blueprint reflecting a growing consensus in Washington that the U.S. role in mortgage finance should be limited to assuming risk only in catastrophic circumstances. It also reflects the prevailing view among lawmakers that the two government-sponsored enterprises should cease to exist, according to a discussion draft obtained by Bloomberg News. As a serious bipartisan effort written by members of the Senate Banking Committee, the measure could restart the long-stalled debate over the future of the mortgage-finance system. Still, it represents only a first step in what is likely to be a long legislative process, and it’s unclear how much support the authors will get from their colleagues. “We expect the bill to change over time, as that is what happens when legislation is debated,” “We continue to believe that GSE reform may not cross the finish line until after the next president is inaugurated” in 2017.
LPS' April Mortgage Monitor: Judicial States' Foreclosure Sales Rate Highest Since 2010; Loans Still Delinquent Nearly Three Years Before Sale - PR Newswire - The Sacramento Bee: The April Mortgage Monitor report released by Lender Processing Services (NYSE: LPS) found that the rate of foreclosure sales (i.e., completion of the foreclosure process) in judicial foreclosure states hit its highest point since 2010. However, the length of time that process is taking -- as well as the disparity in foreclosure timelines between judicial and non-judicial states -- continues to grow. Still, as LPS Applied Analytics Senior Vice President Herb Blecher explained, the steady return to a relative degree of normality in the foreclosure sale rate has helped to bring down foreclosure inventories at the national level. "The foreclosure sale rate in judicial states rose nearly 17 percent from March to April," Blecher said. "This is the highest that rate has been since the moratoria and process reviews in the fall of 2010 led to a near-complete halt in the process in both judicial and non-judicial states. Non-judicial rates were relatively quick to bounce back, but judicial states experienced a much slower, though steady, increase. This has helped drive an overall decline in foreclosure inventory at the national level, which is now at 3.2 percent -- its lowest point in four years. As reported in LPS' First Look release, other key results from LPS' latest Mortgage Monitor report include:
- Total U.S. loan delinquency rate: 6.21%
- Month-over-month change in delinquency rate: -5.81%
- Total U.S. foreclosure pre-sale inventory rate: 3.17%
- Month-over-month change in foreclosure pre-sale inventory rate: -5.83%
- States with highest percentage of non-current* loans: FL, NJ, MS, NV, NY
- States with the lowest percentage of non-current* loans: MT, WY, AK, SD, ND
To view the Mortgage Monitor Snapshot, LPS' new video version of the Mortgage Monitor, visit http://www.lpsvcs.com/LPSCorporateInformation/MultimediaLibrary/Pages/Video-Library.aspx?ListName=Video&ItemName=MMApril1-3_1.wmv
Friday: Jobs, Jobs, Jobs - First, LPS released their Mortgage Monitor report for April today. According to LPS, 6.21% of mortgages were delinquent in April, down from 6.59% in March LPS reports that 3.17% of mortgages were in the foreclosure process, down from 4.20% in April 2012. This gives a total of 9.38% delinquent or in foreclosure. It breaks down as:
• 1,717,000 properties that are 30 or more days, and less than 90 days past due, but not in foreclosure.
• 1,394,000 properties that are 90 or more days delinquent, but not in foreclosure.
• 1,588,000 loans in foreclosure process.
For a total of 4,699,000 loans delinquent or in foreclosure in April. This is down from 5,617,000 in April 2012. The first graph from LPS shows percent of mortgage delinquent and in-foreclosure by month. The percent of delinquent loans is still high (normal is in the 4% to 5% range), but the percent of delinquent loans is falling quickly. The second graph shows the percent of loans in foreclosure in judicial and non-judicial foreclosure states. From LPS: [T]he disparity in foreclosure timelines between judicial and non-judicial states -- continues to grow.“The foreclosure sale rate in judicial states rose nearly 17 percent from March to April,” Blecher said. “This is the highest that rate has been since the moratoria and process reviews in the fall of 2010 led to a near-complete halt in the process in both judicial and non-judicial states. Non-judicial rates were relatively quick to bounce back, but judicial states experienced a much slower, though steady, increase. This has helped drive an overall decline in foreclosure inventory at the national level, which is now at 3.2 percent -- its lowest point in four years.
Fannie Mae, Freddie Mac: Mortgage Serious Delinquency rates declined in April, Lowest since early 2009 - Fannie Mae reported that the Single-Family Serious Delinquency rate declined in April to 2.93% from 3.02% in March. The serious delinquency rate is down from 3.63% in April 2012, and this is the lowest level since January 2009. The Fannie Mae serious delinquency rate peaked in February 2010 at 5.59%.Freddie Mac reported that the Single-Family serious delinquency rate declined in April to 2.91% from 3.03% in March. Freddie's rate is down from 3.51% in April 2012, and this is the lowest level since June 2009. Freddie's serious delinquency rate peaked in February 2010 at 4.20%. Note: These are mortgage loans that are "three monthly payments or more past due or in foreclosure".
The Stealth Problem of Predatory Mortgage Modifications - Yves Smith - If you look from 50,000 feet, there are two sides to the debate over mortgage modifications. On the one hand, a surprisingly large group, which includes beleaguered homeowners, mortgage investors and town and municipal governments, all favor mortgage modifications, particularly principal modifications. Their argument is simple. If you are dealing with a big enough loan, it’s always better for a bank to take half a loaf rather than none when a borrower gets in trouble. That’s why, historically, banks would quietly cut a deal with a stressed homeowner who still had a viable level of income and was committed to keeping his house. Against them have been arrayed a peculiar band of moralists who argue that people who can’t pay their obligations should suffer, no matter how high the cost of this cut your nose to spite your face attitude is in terms of damage to home prices in the community and lost tax revenues. And in keeping with that, the press has taken up the “strategic default” meme, which perversely tries to depict lenders as victims of calculating borrowers. The interested group that seldom makes its wishes known in public, of course, is the one that benefits most from this perverse status quo of “fewer mods than there ought to be” which is mortgage servicers. They aren’t set up to do mortgage modifications while they have set up streamlined processes for foreclosure. And they also get paid additional fees when borrowers are delinquent and enter foreclosure (many aren’t legitimate; as we heard from whistleblowers at Bank of America, foreclosure abuses and fee padding were endemic).
Report: Shadow Inventory Looms Large for GSEs, HUD - Shadow inventory held by the GSEs and HUD “vastly” outnumbers REO properties the groups maintain, according to a joint report from the Office of Inspector General for the Federal Housing Finance Agency and HUD. The report further warned HUD and the GSEs must pay close attention to shadow inventory, which threatens to increase their supply of REOs. For the report, shadow inventory was defined as properties 90-days or more past due but not yet in foreclosure According to the report, as of September 2012, HUD held about 37,445 REOs in its inventory, while Fannie Mae and Freddie Mac had about 158,138 REOs, leading to a combined total of 195,583. Meanwhile, the GSEs held 966,649 properties in their shadow inventory, while HUD was found to have 741,384 homes still in the shadows, for a total of 1.7 million properties. For the GSEs, the ratio of shadow inventory to REO inventory was about 6-to-1, while shadow inventory for HUD was 19.9 times greater than REO inventory. Given the massive number of homes still hiding in the shadows, the OIG says the number of REO inventories held by the GSEs could increase significantly as the seriously delinquent properties become foreclosed on. “Even a fraction of the shadow inventory falling into foreclosure could considerably swell HUD and GSE inventories of REO properties,” the report stated. The OIG also found the number of mortgages past due by a year or more actually increased, rising from 558,761 at the end of 2011 to 655,782 by the end of September 2012.
REO Could Become A Serious Problem For HUD/GSEs: As the housing crisis unrolled the Department of Housing and Urban Development (HUD) and the two government sponsored enterprises (GSEs) Freddie Mae and Fannie Mae came into possession of more and more properties thorugh foreclosure. As of September 30, 2012, HUD held 37,445 foreclosed properties (REO) while the GSEs held 158,138. In addition, the "shadow inventory"-residential loans at least 90 days delinquent-totaled 1,708,033 properties, roughly 8.7 times the size of the HUD and GSE REO inventories combined. Even a fraction of the shadow inventory falling into foreclosure could considerably swell HUD and GSE inventories of REO properties Because of the volume of this current and potential REO the Offices of Inspector General (OIG) for both HUD and the Federal Housing Finance Agency (FHFA) (conservator of the GSEs) recently produced a report on how HUD and the GSEs are managing and disposing of it. HUD and the GSEs have created infrastructures to manage and sell their REO and, while these differ among the entities, all involve the use of extensive networks of contractors to perform management tasks to: secure properties to avoid theft, vandalism, and unauthorized use;maintain and repair properties as needed;price properties appropriately through broker price opinions or appraisals and satisfactory promotional efforts; and sell properties to homeowners or investors within a reasonable period.
Vital Signs Chart: Mortgage Rates Moving Up - Mortgage rates have shot up over the past few weeks. The rate on a 30-year fixed mortgage stands at 3.81%, the highest level since May 2012 and up from 3.35% just a month ago. Home-loan rates remain well below the 6% level seen five years ago, but they have been rising sharply amid fears that the Federal Reserve will curtail its buying of mortgage securities to keep rates low.
MBA: Mortgage Refinance Applications decline sharply as Mortgage Rates Increase above 4% - From the MBA: Mortgage Applications Decrease as Rates Jump in Latest MBA Weekly Survey: The Refinance Index decreased 15 percent from the previous week and is at its lowest level since the end of November 2011. The seasonally adjusted Purchase Index decreased 2 percent from one week earlier...The average contract interest rate for 30-year fixed-rate mortgages with conforming loan balances ($417,500 or less) increased to 4.07 percent, the highest rate since April 2012, from 3.90 percent, with points decreasing to 0.35 from 0.39 (including the origination fee) for 80 percent loan-to-value ratio (LTV) loans. This was the largest single-week increase in this rate since the week ending July 1, 2011. The first graph shows the refinance index. With 30 year mortgage rates moving above 4%, refinance activity has fallen sharply. This index is down almost 40% over the last four weeks, and this is the lowest level since November 2011. The second graph shows the MBA mortgage purchase index. The 4-week average of the purchase index has generally been trending up over the last year, and the 4-week average of the purchase index is up about 10% from a year ago
The refi boom is over - It was only a matter of time before the mortgage refinancing wave receded.As we noted last October, the limited pool of eligible borrowers meant that refinancing activity was already limited in how much it could increase.And now that mortgage rates have climbed, it is falling, and is likely to continue falling: That’s a chart from RBC, and it projects that refinancing volume won’t recover from its recent decline even if rates stay about the same.The refi boom was a helpful, if modest, economic boost and an especially welcome source of revenues for the banks. But it’s what happens with mortgage purchase applications that is a better sign of housing market health, and those have a more idiosyncratic relationship with mortgage rates (chart via Capital Economics):
Fed ‘tapering’ fears push up US mortgage rates - FT.com: The average rate on a US mortgage has soared above 4 per cent for the first time in more than a year, reflecting recent turmoil in the bond market and threatening to undermine the Federal Reserve’s efforts to stoke the US recovery. The rise has outstripped even the sharp jump in rates on US Treasury debt, which took many traders by surprise in May. Economists said the upswing in homeowner borrowing costs is one of the first significant impacts of concern in the financial markets that the Fed will taper its purchases of Treasuries and mortgage-backed securities, measures which have been holding mortgage rates at historic lows. The daily average rate on a new 30-year mortgage, as calculated by Bankrate.com, stands at 4.1, having been as low as 3.4 per cent at the beginning of May. The change could affect the US economy in two ways: by making new loans less affordable, it could damp the recent recovery in house prices; and it could reduce the number of Americans refinancing into cheaper mortgages, eliminating savings that have boosted consumer spending.
The Housing Bubble Goes Mainstream - While it isn't news to regular readers, the fact that one of the key pillars of the "housing recovery" (the other three being foreign oligarchs parking cash in the US courtesy of an Anti Money Laundering regulation-exempt NAR, foreclosure stuffing and, of course, the Fed's $40 billion in monthly MBS purchases) have been the very biggest Wall Street firms (many of whom had to be bailed out the last time the housing bubble burst) who have also become the biggest institutional landlords "using other people's very cheap money" to buy up tens of thousands of properties, appears to still be lost on the larger population. Intuitively this is to be expected: in a world in which the restoration of confidence that a New Normal, in which everything is centrally-planned, is somehow comparable to life as it used to be before Bernanke, is critical to Ben's (and the administration's) reflationary succession planning. As such perpetuating the myth of a housing recovery has been absolutely essential. Which is why we were surprised to see an article in the very much mainstream, and pro-administration policies NYT, exposing just this facet of the new housing bubble, reflated by those with access to cheap credit, and which has seen the vast majority of the population completely locked out.
More measures of the housing non-bubble - Last Friday I debunked a Zero Hedge post that claimed that median house prices as a multiple of disposable personal income were at new highs. In this post I'll look at a few more measures. To begin with, almost all of the opinion claiming that there is a new housing bubble are relying on new home prices. Conversely, almost all the posts taking the contrary position are relying on the Case Shiller house price index. There's no doubt that the median price for a new home has shot up in the last year, as shown in this graph:But the above graph isn't adjusted for inflation, or income, or affordability. Beyond that, new homes represent less than 10% of the overall market. With 90%+ of the market a lot closer to its recent lows than prior highs, I see little reason to worry that we are in a new bubble. Let's look at a second measure of affordability, house prices as a multiple of average hourly wages. In the graph below, Case Shiller is in red and median new single family home prices are in blue: While new home prices as a multiple of average wages are a little closer to their maximum than minimum values, the broader market shown by the Case Shiller index is still very inexpensive, equivalent of only 2002 values. Next, in response to my article on Friday, I was pointed to the site Political Calculations, which claims that we are in a new bubble as measured by new home prices as a multiple of median household income. It looked to me like they were making the same mistake as Zero Hedge, but a commenter said I was wrong. To use the best data, I turned to Doug Short, who does have access to Sentier's monthly median household income data (which is the data source for Political Calculations as well). I asked Doug to do a nominal to nominal ratio, and here is what he got: The foregoing means that modifications are always preferable and servicers need to be pressed harder to do more, right? Not necessarily. Never underestimate the ability of banks to game a system.
Behind the Rise in House Prices, Wall Street Buyers - Large investment firms have spent billions of dollars over the last year buying homes in some of the nation’s most depressed markets. The influx has been so great, and the resulting price gains so big, that ordinary buyers are feeling squeezed out. Some are already wondering if prices will slump anew if the big money stops flowing. “The growth is being propelled by institutional money,” said Suzanne Mistretta, an analyst at Fitch Ratings. “The question is how much the change in prices really reflects market demand, rather than one-off market shifts that may not be around in a couple years.” Wall Street played a central role in the last housing boom by supplying easy — and, in retrospect, risky — mortgage financing. Now, investment companies like the Blackstone Group have swooped in, buying thousands of houses in the same areas where the financial crisis hit hardest. Blackstone, which helped define a period of Wall Street hyperwealth, has bought some 26,000 homes in nine states. Colony Capital, a Los Angeles-based investment firm, is spending $250 million each month and already owns 10,000 properties. With little fanfare, these and other financial companies have become significant landlords on Main Street. Most of the firms are renting out the homes, with the possibility of unloading them at a profit when prices rise far enough.
Can Cash-Rich Investors Keep Snapping Up Homes?: Michael Marchillo, a plumber, has been trying and failing for months to buy a bigger home for his family here in Sin City. He was pre-qualified by a bank for a $130,000 mortgage, which a year ago would have landed a typical three-bedroom home in the area. No more. Now, the 36-year-old says, it's hard to compete with "greedy investors" who come to the table flush with cash for quick deals. Marchillo is on to something. The once-beleaguered Las Vegas housing market has been on fire since investment firms led by Blackstone Group LP, Colony Capital and American Homes 4 Rent began buying homes here some eight months ago, backed by $8 billion in investor cash to spend nationally. These big investors and a handful of others have bought at least 55,000 single-family homes across the U.S. in the past year. In the Vegas area alone, they have accounted for at least 10 percent of the homes sold since January 2012, according to a Reuters analysis of housing transactions. That added firepower helps explain why home prices in this metropolitan area of 2 million people are up 30 percent over a year ago, far more than the national average of 10 percent. Permits for new home construction are up 50 percent, twice the national average.
Mortgage Rate Increases Starting to Bite -- Yves Smith - Bloomberg reports that that staple of mortgage funding, the 30 year fixed rate mortgage, has seen its interest rate increase from 3.48% a month ago to 4.16% as of yesterday. By contrast, the highest rate the 30 year mortgage reached in the previous year as of mid-March had been 3.85%. One analyst, Mark Hanson, sees evidence that the dropoff in refinancings has been impressive: After 5 years of interest rates being forced incrementally lower each year — and everybody that qualifies refinancing over and over again allowing the banks to originate and earn several points off of each gov’t loan churn — the jig is up for a while at least…..three large private mortgage bankers I follow closely for trends in mortgage finance ALL had mass layoffs last Friday and yesterday to the tune of 25% to 50% of their operations staff (intake, processing, underwriting, document drawing, funding, post-closing). This obviously means that my reports of refi apps being down 65% to 90% in the past 3 weeks are far more accurate than the lagging MBA index, which is likely on its way to print multi-year lows in the next month. Now refis provided some stimulus, since lower mortgage payments means more money to spend. But the effect is likely not as great as you might think. The big winners are the banks and the other fee extractors. As MBS Guy explains via-e-mail: The refi market is, in reality, a vampire business. It’s a way for lenders, brokers, lawyers and other hangers-on to extract substantial fees, over and over, from borrowers, while giving a modest benefit in return. I have no doubt that the stimulus effect of lower rates was substantially less than many people expected because of all of the refi fees extracted along the way. And those fired workers? Almost all would be low level clerical staff, and in many cases temps/contractors, working in a high pressure, low discretion, production driven environment. So those job losses in and of themselves is a hardship for those workers, but not a biggie economy-wide.
Will higher mortgage rates kill the housing market? Maybe not! - [R]ising mortgage rates, if they’re rising for good reasons, could actually be net positives for the housing market if they result from more people having jobs and being confident in their prospects. This gets at one of the realities of the housing market and interest rates: It doesn’t just matter whether mortgage rates are rising, but why they’re rising. Stronger economic growth makes homebuying more attractive, as people are more confident in their jobs and incomes (Goldman estimates that a 1 percentage point in real GDP growth translates to 1.8 percentage points in annual home price appreciation). Higher inflation can make homebuying more desirable, as you are buying a large asset whose value should rise with inflation while taking on a debt that has a fixed interest rate (Goldman estimates that a 1 percentage point increase in inflation translates to an 0.9 percent rise in home prices). That being the case, as long as home prices remain below the level where affordability is out of reach, and so long as mortgage rates are rising because the economy is on the mend, the housing market should be able to withstand the blow.
Higher Mortgage Rates Won’t Kill Housing Recovery - Mortgage rates are back above 4% for the first time in a year, but the rate rise probably isn’t going to be enough to take the wind out of the sails of the housing market rebound. The Mortgage Bankers Association reported on Wednesday that rates jumped to 4.07% last week for the 30-year fixed-rate loan, up from 3.9% in the previous week. At the beginning of May, rates stood at 3.59%, according to the same MBA survey. Mortgage rates tend to track yields on 10-year Treasury notes, which have jumped as anxious investors sell off Treasury securities amid signs that the Federal Reserve may begin to slow down the bond-buying program it launched last year. Bond yields rise as prices fall. By midday Wednesday, yields on the 10-year Treasury were 2.09%, down from a high of 2.24% last week but up from a low of 1.62 at the beginning of May. What does it all mean for the housing market? Already, refinancing activity has fallen like a rock. Mortgage lenders had more business than they could handle last year thanks to major refinance demand. Mortgage originations hit a five-year high as rates dropped to their lowest levels on record and as the government revamped a major initiative to refinance loans backed by Fannie Mae and Freddie Mac even if borrowers owe more than their homes are worth.
Home Loan Rates Near 4% Send Buyers Scurrying: Mortgages - The average rate for a 30-year fixed mortgage has risen for each of the past five weeks and is at the highest level in more than a year, according to government mortgage-buyer Freddie Mac. While that’s already put a dent in the refinancing boom that has powered bank earnings this year, for buyers like Braunstein, the message is clear: buy quickly. “Refinancing depends only on mortgage rates and therefore is very sensitive to changes in rates,” said Jed Kolko, chief economist at San Francisco-based Trulia Inc., an online property listing service. When it comes to buying, “some people might want to hurry up and make a purchase, but with inventory so tight they might not be able to move that fast.” Rates for a 30-year home loan rose to 3.91 percent in the week ended today, from 3.81 percent,Freddie Mac said in a statement. That’s up from 3.35 percent at the start of May as the Federal Reserve signaled to bond investors it may scale back the stimulus that had driven borrowing costs to record lows, amid signs of continuing improvement in housing and the U.S. economy. The 15-year rate has increased to 3.03 percent from 2.56 percent at the start of last month. Bankrate Inc., an interest-rate aggregator, said today that the benchmark 30-year fixed mortgage rate has climbed to 4.1 percent, according to its weekly national survey.
What Changes in the Mortgage Deduction Would Mean for Home Prices - Tax preferences for housing are under fire, with mounting evidence that these preferences are inefficient, unequal, and too expensive to warrant a place in the tax code. Critics of proposed changes in the tax treatment of home ownership argue that these reforms would slash home prices at the very time they are showing signs of recovery. But in a new paper, I find that changes to the deductions for mortgage interest and property tax payments might not reduce prices much at all, and some reforms might even boost prices. President Obama’s 28 percent limit on selected tax expenditures; eliminating deductions for mortgage interest and property taxes; and limiting the tax savings from the mortgage interest deduction to 20 percent while providing a flat credit for closing costs. The president’s 28 percent limit on itemized deductions would barely move housing prices at all, causing them to fall just 0.3 percent. The higher top tax rates put in place in 2013, which drive up the value of deductions for housing for high-income taxpayers, are estimated to increase home prices by an even smaller margin. By contrast, completely eliminating the mortgage interest and property tax deduction—a drastic change that probably would only happen if accompanied by a new tax preference for housing—would cause housing prices to fall by an average of 11.8 percent in the 23 cities studied. Estimated price declines would range from 10.3 percent in Seattle to 13.8 percent in Milwaukee.
Existing Home Inventory is up 15.2% year-to-date on June 4th - Weekly Update: One of key questions for 2013 is Will Housing inventory bottom this year?. Since this is a very important question, I'm tracking inventory weekly in 2013. There is a clear seasonal pattern for inventory, with the low point for inventory in late December or early January, and then peaking in mid-to-late summer. The Realtor (NAR) data is monthly and released with a lag (the most recent data was for April). However Ben at Housing Tracker (Department of Numbers) has provided me some weekly inventory data for the last several years. This is displayed on the graph below as a percentage change from the first week of the year (to normalize the data). In 2010 (blue), inventory increased more than the normal seasonal pattern, and finished the year up 7%. However in 2011 and 2012, there was only a small increase in inventory early in the year, followed by a sharp decline for the rest of the year.
CoreLogic: House Prices up 12.1% Year-over-year in April - Notes: The CoreLogic HPI is a three month weighted average and is not seasonally adjusted (NSA). From CoreLogic: CoreLogic Report Shows Home Prices Rise by 12.1 Percent Year Over Year in April Home prices nationwide, including distressed sales, increased 12.1 percent on a year-over-year basis in April 2013 compared to April 2012. This change represents the biggest year-over-year increase since February 2006 and the 14th consecutive monthly increase in home prices nationally. On a month-over-month basis, including distressed sales, home prices increased by 3.2 percent in April 2013 compared to March 2013. Excluding distressed sales, home prices increased on a year-over-year basis by 11.9 percent in April 2013 compared to April 2012. On a month-over-month basis, excluding distressed sales, home prices increased 3 percent in April 2013 compared to March 2013. Distressed sales include short sales and real estate owned (REO) transactions.The CoreLogic Pending HPI indicates that May 2013 home prices, including distressed sales, are expected to rise by 12.5 percent on a year-over-year basis from May 2012 and rise by 2.7 percent on a month-over-month basis from April 2013. Excluding distressed sales, May 2013 home prices are poised to rise 13.2 percent year over year from May 2012 and by 3.1 percent month over month from April 2013. This graph shows the national CoreLogic HPI data since 1976. January 2000 = 100. The index was up 3.2% in April, and is up 12.1% over the last year. This index is not seasonally adjusted, and this is usually the strongest time of the year for price increases. The index is off 22% from the peak - and is up 15.9% from the post-bubble low set in February 2012. The second graph is from CoreLogic. The year-over-year comparison has been positive for fourteen consecutive months suggesting house prices bottomed early in 2012 on a national basis (the bump in 2010 was related to the tax credit)
CoreLogic: April home prices posted the largest annual gain in more than seven years - CoreLogic reported today that its repeat-sales Home Price Index (HPI), based on sale prices for the same homes over time, posted a 12.1% year-over-year gain in April (including distressed sales). That was the largest annual increase in home prices since February 2006 – more than seven years ago (see blue line in chart). April was the fourteenth consecutive month that national home prices increased year-over-year, and the third straight month of a double-digit year-over-year percent increase in home prices. The last time there were 14 back-to-back monthly increases in year-over-year home prices was in 2005-2006, and the last time there were three consecutive monthly double-digit annual price gains was in the first three months of 2006. Excluding distressed sales, national home prices increased annually by 11.9% in April (see red line), the largest annual home price appreciation by this measure since February 2006. At the state level, 48 states posted double-digit gains in April home prices (including distressed sales), with the five largest annual price gains in Nevada (24.6%), California (19.4%), Arizona (17.3%), Hawaii (17.0%), and Oregon (15.5%). The only two states that posted annual declines in April home prices were Mississippi (-1.7%) and Alabama (-1.6%). Excluding distressed sales, all 50 states registered year-over-year home price gains in April for the second consecutive month. Anand Nallathambi, president and CEO of Corelogic, commented that “We expect this trend to continue, bolstered by tight supplies and pent-up buyer demand.”
How Big Institutional Money Distorts Housing Prices - The airwaves are full of stories of economic recovery. One trumpeted recently has been the rapid recovery in housing, at least as measured in prices. The problem is, a good portion of the rebound in house prices in many markets has less to do with renewed optimism, new jobs, and rising wages, and more to do with big money investors fueled by the ultra-cheap money policies of the Fed. It seems entirely wrong that the Fed bailed out big banks and made money excessively cheap for institutions, and that this is being used to price ordinary people out of the housing market. Said another way, the Fed prints fake money out of thin air, and some companies use that same money to buy real things like houses and then rent them out to real people trying to live real lives. At the same time, we are also beginning to see the very same hedge funds that have re-inflated these prices slink out of the market now that the party is kicking into higher gear – all while new buyers are increasingly having to abandon prudence to buy into markets where the fundamentals simply aren't there to merit it. Didn't we just learn a few short years ago how this all ends?
The REAL Reason Housing Prices Have Skyrocketed -- Preface: In Part 1, we showed that mortgage applications are down, and it is really institutional investors driving the housing boom. Part 2 explains why. Housing prices have boomed because: (1) Lenders are artificially keeping vacant houses off of the market and (2) The Obama administration has thrown all sorts of artificial incentives at institutional investors to pump up prices Naked Capitalism reported last August:Two trends are apparent. One is that banks are delaying foreclosures, or not foreclosing at all despite long-term delinquencies. The other is that private equity firms – flush with cash thanks to Tim Geithner’s religious devotion to trickle-down economics and the resulting cascade of corporate welfare – have been bidding up and holding foreclosed houses off the market. Holding back inventory means that the houses that are put on offer sell faster and at higher prices. That creates an incentive to delay foreclosures or not foreclose at all even when a home is delinquent. Indeed – in the real world - 12.6 million houses are vacant … 1.5 million more home than are underwater. In other words, without artificial scarcity created by banks, there would be more available houses than there are underwater homeowners having problems paying their mortgage. There would – in a word – be a glut.
Trulia: Asking House Prices increased in May - Press Release: Trulia Reports Asking Prices up 16.3 Percent Year-over-year in the Least Affordable Housing Markets In May, asking prices continued to increase steadily across the country, rising in 98 of the largest 100 metros. Nationally, prices are up 9.5 percent year-over-year (Y-o-Y). Seasonally adjusted, prices increased 4.0 percent quarter-over-quarter and 1.1 percent month-over-month.Eight out of the 10 least affordable markets, with seven in California, are all showing double digit asking price increases making home affordability even tougher for would-be buyers. Orange County, Oakland, and San Jose all had price increases of more than 20 percent, making these already expensive markets even less affordable. Prices are up 16.3 percent, on average, in these 10 least affordable housing markets. Nationally, rents are up 2.3 percent Y-o-Y, rising slower than asking prices in 23 of the 25 largest rental markets. Out of the 10 least affordable rental markets, five show increases below the national average, with California markets moving especially slow – San Francisco rents up 0.2 percent, Los Angeles 1.8 percent and Oakland 1.3 percent. Among these least affordable rental markets, Miami and Boston had the largest rent increases.On rents, this is similar to the quarterly Reis report on apartments. It appears that rent increases are slowing.
Zillow: Case-Shiller House Price Index expected to show over 12% year-over-year increase in April The Case-Shiller house price indexes for April will be released Tuesday, June 25th. Zillow has started forecasting Case-Shiller a month early - and I like to check the Zillow forecasts since they have been pretty close. Note: Zillow makes a strong argument that the Case-Shiller index is currently overstating national house price appreciation. Zillow: April Case-Shiller Composite To Show Annual Appreciation Above 12% Buckle up, folks. If you thought the Case-Shiller numbers ... for March were eye-popping, just wait until next month. Our updated forecast indicates that the April 20-City Composite Case-Shiller Home Price Index (non-seasonally adjusted [NSA]) will rise 12.1 percent on a year-over-year basis, while the 10-City Composite Home Price Index (NSA) will increase 11.4 percent from year-ago levels. The seasonally adjusted (SA) month-over-month change from March to April will be 1.7 percent for both the 20-City Composite and the 10-City Composite Home Price Indices (SA). As we’ve described , the Case-Shiller indices are giving an inflated sense of national home value appreciation because they are biased toward the large, coastal metros currently seeing such enormous home value gains, and because they include foreclosure resales. The inclusion of foreclosure resales disproportionately boosts the index when these properties sell again for much higher prices — not just because of market improvements, but also because the sales are no longer distressed. In contrast, the ZHVI does not include foreclosure resales and shows home values for April 2013 up 5.2 percent from year-ago levels. We expect home value appreciation to continue to moderate in 2013, rising only 4 percent between April 2013 and April 2014. Further details on our forecast of home values can be found here, and more on Zillow’s full April 2013 report can be found here. The following table shows the Zillow forecast for the April Case-Shiller index.
Lawler: Single Family Homes Built/Sold in 2012: “Back to Bigger,” But on Very Low Volumes - Census released its estimates for the characteristics of single-family homes completed and sold in 2012. CR Note: from the release: Of the 483,000 single-family homes completed in 2012:
• 432,000 had air-conditioning.
• 63,000 had two or fewer bedrooms and 198,000 had four bedrooms or more.
• 34,000 had one and one-half bathrooms or less, whereas 145,000 homes had three or more bathrooms.
• 142,000 had a full or partial basement, while 78,000 had a crawl space, and 263,000 had a slab or other type of foundation.
• 266,000 had two or more stories.
• 278,000 had a warm-air furnace and 183,000 had a heat pump as the primary heating system.
• 285,000 heating systems were powered by gas and 189,000 were powered by electricity.
The average single-family house completed was 2,505 square feet. From Lawler: Here is a chart showing the % of SF homes completed with square feet of floor area of 3,000 or more.
The Return of McMansions? -Construction of new homes dropped off a cliff during the housing bust. But where there has been building of single-family homes in recent years, the homes have been getting bigger. On Monday the Census Bureau released new data on the characteristics of homes built in 2012. Here’s a look at building over the last 40 years, to give you a sense of how sharp the decline in residential construction really was: For a few years now, though, the size of the typical home built has been growing. For single-family homes, median size rose to 2,306 square feet in 2012, the highest median square-footage for single-family homes since the government began keeping track in 1973.And the number of bedrooms has gone up, too. In 2012, 41 percent of the new homes built had at least four bedrooms, the highest share on record. The median newly built house still had three bedrooms, though. The share of new single-family homes with at least three bathrooms also reached a new high of 30 percent. I should note that the same trends don’t hold true for newly completed multifamily housing units. Units built for sale are getting bigger, but the median size of units being built for rent — which represent the vast majority of all multifamily construction — ticked downward from 2011 to 2012.
The dark side of homeownership - Owning your home, long a pillar of the American dream, could actually be bad for the economy. In a new paper, economists Andrew Oswald, of the University of Warwick, and David Blanchflower, at Dartmouth, found that rates of high homeownership lead to higher rates of unemployment in both the United States and Europe. Not only do high rates of homeownership keep people from moving to areas with good jobs, it also turns out that they tend to stunt job creation where the people live. What’s more, because suburbanites are unlikely to have a jobs in the same place that they live, they often spend a lot more time in traffic than they need to – time that could surely be used more productively. This is not a new idea for Oswald and Blanchflower. They’ve been working on this area of research for the better part of two decades, although this is the first time they’ve had the hard data to show how the labor market in the US is affected when homeownership rates increase. Even though individual homeowners aren’t necessarily more likely to be unemployed than their renter counterparts, a doubling of the homeownership rate leads to more than doubling of the unemployment rate, the researchers find.
Does High Home-Ownership Impair the Labor Market? - We explore the hypothesis that high home-ownership damages the labor market. Our results are relevant to, and may be worrying for, a range of policy-makers and researchers. We find that rises in the home- ownership rate in a U.S. state are a precursor to eventual sharp rises in unemployment in that state. The elasticity exceeds unity: a doubling of the rate of home-ownership in a U.S. state is followed in the long-run by more than a doubling of the later unemployment rate. What mechanism might explain this? We show that rises in home-ownership lead to three problems: (i) lower levels of labor mobility, (ii) greater commuting times, and (iii) fewer new businesses. Our argument is not that owners themselves are disproportionately unemployed. The evidence suggests, instead, that the housing market can produce negative ‘externalities’ upon the labor market. The time lags are long. That gradualness may explain why these important patterns are so little-known.
Public Construction Hits 7-Year Low - Government spending on construction fell in April to its lowest level since 2006, the latest evidence that federal cutbacks are taking a toll on building even at the local level. Public construction spending declined 1.3% in April, a month after the $85 billion in across-the-board federal spending cuts, known as the sequester, began. More than 90% of all public building is done by state and local governments, but federal funds often back those projects. As agencies in Washington curtail their budgets, fewer dollars will flow to states and municipalities to fund construction of roads, schools and sewers.The sequester hits local government that are already grappling with tight budgets. The housing crisis depressed home values, causing property taxes that fill many state and local coffers to fall.
Vital Signs Chart: Government Construction - Government spending on construction is tumbling. Public construction spending dropped 1.2% in April to its lowest level since 2006, extending a 5.7% drop since October. The $85 billion in across-the-board federal spending cuts known as the sequester are taking a toll on building at a time when many local governments are still struggling with tight budgets and a tepid economy.
Fed's Q1 Flow of Funds: Household Mortgage Debt down $1.3 Trillion from Peak, Record Household Net Worth - The Federal Reserve released the Q1 2013 Flow of Funds report today: Flow of Funds. According to the Fed, household net worth increased in Q1 compared to Q4 2012, and is at a new record. Net worth peaked at $67.4 trillion in Q3 2007, and then net worth fell to $51.4 trillion in Q1 2009 (a loss of $16 trillion). Household net worth was at $70.3 trillion in Q1 3013 (up $18.3 trillion from the trough). The Fed estimated that the value of household real estate increased to $18.5 trillion in Q1 2013. The value of household real estate is still $4.2 trillion below the peak in early 2006.This is the Households and Nonprofit net worth as a percent of GDP. Although household net worth is at a record high, this is still below the peaks in 2000 (stock bubble) and 2006 (housing bubble). This includes real estate and financial assets (stocks, bonds, pension reserves, deposits, etc) net of liabilities (mostly mortgages). Note that this does NOT include public debt obligations. This ratio was relatively stable (or increasing gradually) for almost 50 years, and then we saw the stock market and housing bubbles. The ratio has been trending up and increased again in Q1 with both stock and real estate prices increasing. This graph shows homeowner percent equity since 1952. In Q1 2013, household percent equity (of household real estate) was at 49.2% - up from Q4, and the highest since Q4 2007. This was because of both an increase in house prices in Q1 (the Fed uses CoreLogic) and a reduction in mortgage debt.
U.S. Households’ Finances Regain Lost Ground - Buoyed by a healthier housing sector and a soaring stock market, American households continue to regain ground lost during the financial crisis and the severe recession that followed. Without adjusting for inflation, the net worth of American households is now higher than before the recession struck five and a half years ago, the Federal Reserve said on Thursday. Household net worth jumped by just over $3 trillion, or 4.5 percent, to $70.3 trillion in the first quarter of 2013, surpassing the $68.1 trillion reached in 2007. After adjustment for inflation, total net worth still stands below the peak reached in mid-2007, said Dean Maki, chief United States economist at Barclays. The encouraging report from the Fed comes amid other signs that Americans are feeling slightly better about the economy. In a New York Times/CBS News poll conducted May 31 to June 4, 39 percent of respondents said that the recent condition of the economy was very or fairly good, the highest share saying this not only since President Obama took office but also since the recession officially began in December 2007.
US Household Net Worth Hits Record: Rises By $33.3 Billion On Each Day In The First Quarter - Earlier today the Fed released its quarterly Flow of Funds report for the first quarter of 2013, widely used to calculate the level of US household net worth. For those whose wealth is primarily in the form of various financial assets (about 1% of the population) it was a good, quarter, actually the best ever: following a $2.1 trillion increase in financial assets, coupled with a $0.8 trillion rise in tangible assets (including real estate), total household net worth rose from $67.3 trillion to $70.3 trillion, which is the new record high number, surpassing the $68.1 trillion record in Q3 2007. What is curious is that back in 2007, tangible assets amounted to $29 trillion compared to $26 trillion now, which means the bulk of asset creation has come thanks to the Fed reflating its final bubble and leading to all time highs in all assets that are directly correlated with the size of the Fed's balance sheet.
Household Net Worth: The "Real" Story - Let's take a long-term view of household net worth from the latest Flow of Funds report. A quick glance at the complete data series shows a distinct bubble in net worth that peaked in Q4 2007 with a trough in Q1 2009, the same quarter the stock market bottomed. The latest Fed balance sheet shows a total net worth that is 35.2% above the 2009 trough at a new all-time high 3.4% above the 2007 peak. The nominal Q4 net worth is up 4.5% from the previous quarter and up 9.6% year over year.But there are problems with this analysis. Over the six decades of this data series, total net worth has grown about 7219%. A linear vertical scale on the chart above is misleading because it fails to provide an accurate visual illustration of growth over time. It also gives an exaggerated dimension to the bubble that began in 2002. But there is another more serious problem, one that has to do with the data itself rather than the method of display. Over the same time frame that net worth grew six-thousand-plus percent, the value of the 1950 dollar shrank to about nine cents. The Federal Reserve gives us the nominal value of total net worth, which is significantly skewed by money illusion. Here is my own log scale chart adjusted for inflation using the Consumer Price Index.Here is the same chart with an exponential regression through the data. The regression helps us see the twin wealth bubbles peaking in Q1 2000 and Q1 2006, the Tech and Real Estate bubbles. The trough in real household net worth was in Q1 2009. From that quarter to the latest data point, net worth has been trending at about the same growth rate as the overall regression, but we are currently 7.5% below the regression. Let's now zoom in for a closer look at the period since 2000. I've added some callouts to highlight where we are currently with regard to the all-time peak and 2009 trough.
Report: Personal Bankruptcy Filings decline 11% year-over-year in May -- From the American Bankruptcy Institute: May Bankruptcy Filings Decrease 12 Percent from Previous Year, Business Filings Decrease 25 PercentTotal bankruptcy filings in the United States decreased 12 percent in May over last year, according to data provided by Epiq Systems, Inc. Bankruptcy filings totaled 96,430 in May 2013, down from the May 2012 total of 109,538. Consumer filings declined 11 percent to 92,413 from the May 2012 consumer filing total of 104,197. Total commercial filings in May 2013 decreased to 4,017, representing a 25 percent decline from the 5,341 business filings recorded in May 2012. "Sustained low interest rates, tighter lending standards and decreased consumer spending are assisting consumers and companies to shore up their balance sheets,” Personal bankruptcy filings peaked in 2010 at 1.54 million (highest since the bankruptcy law change in 2005). Filings declined to 1.22 million last year, and will probably be just over 1 million this year - the lowest level since 2008. Note: Even in good economic years, there are around 800 thousand personal bankruptcy filings.
Consumer Credit in U.S. Climbed in April on Non-Revolving Loans - Bloomberg: Consumer borrowing in the U.S. accelerated in April as Americans took out more education and automobile loans. The $11.1 billion increase in credit followed a revised $8.37 billion increase the previous month that was more than initially reported, Federal Reserve figures showed today in Washington. The median forecast in a Bloomberg survey called for a $12.9 billion gain in April.Higher stock and property values are putting households in a position to take advantage of low interest rates for bigger purchases, such as cars. Credit-card use also rose as Americans contended with higher payroll taxes and limited income growth. “A lot of what is driving consumer credit right now is non-revolving credit,” Tom Simons, an economist for Jefferies LLC in New York, said before the report. Simons is the second-best forecast of consumer credit over the past two years, according to data compiled by Bloomberg. “The unemployment rate is going to have to fall and earnings are going to have to go up before people are comfortable spending more than they make.” A Labor Department report earlier today showed wage gains aren’t picking up. Average hourly earnings were little changed at $23.89 in May after $23.88 in the prior month. They were up 2 percent in 12 months ended in May, the same as in April.
US consumers increased borrowing by $11.1 billion in April, led by student and auto loans : Americans borrowed more in April to attend college and buy cars and were a little less cautious with their credit cards than the previous month.The Federal Reserve says consumer borrowing rose $11.1 billion in April from March to a seasonally adjusted $2.82 trillion. That's the 20th straight monthly gain and another record level. Nearly all of the gain came from a category that includes auto and student loans, which increased $10.4 billion. A measure of credit card use rose $682 million. While that's only a modest gain, it follows a decline of $906 million for the category in March.Steady gains in borrowing could help boost consumer spending, which accounts for 70 percent of economic activity.
94% Of April Consumer Credit Goes To Student And Car Loans - Remember when, many years ago, the inflection thesis was that once a pick up in consumer lending is seen for discretionary purchases (i.e., revolving credit) that would be the sign that normality is coming back. Explaining why some may have forgotten this is that for the past 4 years it never actually happened for two simple reasons: i) consumers are still very unsure about the centrally-planned economy and thus still deleveraging (and defaulting) on their existing debt obligations, and what little savings they have are the preferred source of purchasing power, and ii) banks still have to open up the lending spigots which they won't as they have better returns investing in the stock market rather than taking on NPL risk in exchange for a record low NIM. However, while revolving credit is still dead, non-revolving credit - funded by a very generous Uncle Sam - and whose proceeds go to car purchases and to pay tuition (and all associated other goods and services) has never been stronger. Sure enough in the latest month of data, April, the Fed just disclosed that of the $11.1 billion in crease in total consumer credit, only 6% was in revolving credit. The balance, or $10.4 billion, was non-revolving, and thus was used to pay for that new Chevy Impala and/or "Keynesian Shamanomics 101 for Dummies." And of course, all was funded by the US government.
Real Consumer Spending and Personal Income Increase 0.1% for April 2013 - The April personal income and outlays report shows personal income has no change from last month, mainly due to less inflation. Disposable income decreased -0.1%, but adjusted for inflation, shows a monthly increase of 0.1%. Consumer spending decreased -0.2%, but when adjusted for inflation grew by 0.1% for the month, which is meager. The below graph shows the monthly percentage change of personal income going back to 1990.Consumer spending is another term for personal consumption expenditures or PCE. Real personal consumption expenditures are hugely important to economic growth as consumer spending is about 71% of GDP. Real means adjusted for inflation. Graphed below are the monthly changes for real personal income (bright red), real disposable income (maroon) and real consumer spending (blue). Below are the real dollar amounts for real personal income (bright red), real disposable income (maroon) and real consumer spending (blue). Notice by levels how much lower real disposable income is now. Consumer spending encompasses things like housing, health care, food and gas in addition to cars and smartphones. In other words, most of PCE is most about paying for basic living necessities. Graphed below is the overall real PCE monthly percentage change, which hasn't been this low since October 2012.
Uh-Oh: We Already Started Spending Like It’s 2005 - In the early 1990s, the average American’s debt load was 83% of his income, but by 2007 that number reached a staggering 130%. Americans compensated for stagnant wage growth by “using their homes as ATMs,” as the catch phrase has it, taking out more and more mortgage-backed debt with the belief that home prices would always continue to rise. And a reckless banking system was only too happy to oblige. The Great Recession was supposed to have changed all of that. In the wake of the financial crisis we read story after story of chastened Americans socking away more money in their retirement accounts, paying down debt, and saving for their children’s educations. The national savings rate, which had averaged just 2.84% between 2000 and 2007, climbed above 6% in 2008.But it would seem that this post-recession parsimony has ended. One of the main reasons why tax increases and sequestration-related spending cuts haven’t slowed consumer spending or GDP growth is because Americans have given up on the whole savings thing once again. According to William Emmons, an economist at the St. Louis Federal Reserve, “the rise in consumer spending is somewhat worrying because it’s a product of the savings rate falling back to 2.5%.”In other words, much of the good news we’ve seen out of the economy in recent months has been due to Americans saving less, and that’s simply not something we can sustain indefinitely.
Americans Are Short on Financial Know How - Some household balance sheets have mended during the recovery but that may be thanks less to fiscal stewardship than the improving economy. In fact, Americans’ grasp of concepts such as investment risk and inflation has weakened since the recovery began in mid-2009. Research released last week shows that on a five-question test (Take the test here), respondents did worse in 2012 than in 2009. The average number of correct answers fell to 2.9 in 2012 from 3.0 on the test in 2009. The test, along with a wide-ranging survey of financial capability of more than 25,000 American adults, was conducted during the fall and funded by the Financial Industry Regulatory Authority Investor Education Foundation. “People are finding it a little easier to make ends meet,” Finra Chief Executive Richard Ketchum said in presenting the 2012 National Financial Capability Study results last week in Washington. Patterns of spending and saving changed little between the two studies: 41% of respondents still say they spend less than their income, 19% spend more than it and 36% spend roughly what they earn.In the most recent study, 40% of respondents said they had no trouble covering their monthly expenses, a slight improvement from 36% in 2009.
Wealth defined with real people in mind - Via the Washington Post comes this idea of economic incentive: But research by noted economists Karl Case, John Quigley and Robert Shiller found the households were more powerful affected by declines in wealth than increases. An unexpected 1 percent drop in housing prices caused a permanent 0.1 percent decrease in spending, that study found. But a similar 1 percent rise in housing prices boosted consumer spending by only 0.03 percent. “Rising wealth is gratifying, but the loss of wealth is terrifying,” said Mark Zandi, chief economist at Moodys.com. “Households spend somewhat more freely as their nest eggs grow, but they slash their spending when their nest eggs shrink.” William Emmons, chief economist for at the St. Louis Fed’s new Center for Household Financial Stability, said that many of the most vulnerable households began to treat credit as another form of income during the boom. After the bust, they were forced to dramatically rethink their finances, resulting in more cautious spending. Emmons said many families have not experienced any recovery — or are even still losing wealth. Young Americans, those with few skills or are unemployed may not have been able to rebuild any wealth. He noted that though the number of foreclosures has dropped significantly, it is still more than double the pre-crisis amount.
RBC June Consumer Outlook Index Jumps to Near 6-Year High - Consumers’ confidence levels about the economy and labor markets have returned to prerecession heights, according to data released Thursday. The Royal Bank of Canada said its U.S. consumer outlook index rose to 51.8 in early June from 50.2 in May. The June reading is the highest since October 2007. The RBC current conditions index rebounded to 42.4 after it fell to 40.8 in May from 42.5 in April. The expectations index increased for the third consecutive month, jumping to 60.7 this month, the highest reading since September 2008, just before the financial markets collapsed. Consumers hold the best view of the labor markets since December 2007. The June jobs index rose to 58.9 in June from 57.4 in May.
Roach: The American Consumer Is Not Okay - The spin-doctors are hard at work talking up America’s subpar economic recovery. All eyes are on households. Thanks to falling unemployment, rising home values, and record stock prices, an emerging consensus of forecasters, market participants, and policymakers has now concluded that the American consumer is finally back. Don’t believe it. First, consider the facts: Over the 21 quarters since the beginning of 2008, real (inflation-adjusted) personal consumption has risen at an average annual rate of just 0.9%. That is by far the most protracted period of weakness in real US consumer demand since the end of World War II – and a massive slowdown from the pre-crisis pace of 3.6% annual real consumption growth from 1996 to 2007. With household consumption accounting for about 70% of the US economy, that 2.7-percentage-point gap between pre-crisis and post-crisis trends has been enough to knock 1.9 percentage points off the post-crisis trend in real GDP growth. Look no further for the cause of unacceptably high US unemployment. To appreciate fully the unique character of this consumer-demand shortfall, trends over the past 21 quarters need to be broken down into two distinct sub-periods. First, there was a 2.2% annualized decline from the first quarter of 2008 through the second quarter of 2009. This was crisis-driven carnage, highlighted by a 4.5% annualized collapse in the final two quarters of 2008. Second, this six-quarter plunge was followed, from mid-2009 through early 2013, by 15 quarters of annualized consumption growth averaging just 2% – an upturn that pales in comparison with what would have been expected based on past consumer-spending cycles.
Price-gouging cable companies are our latter-day robber barons - Last year, about 1% of American households cut off their internet service. That's not as surprising as experts may suggest. The internet – which promised to connect all Americans with everything from educational opportunities to Facebook status updates – has become, unfortunately, a luxury even for the middle class. Cable companies that have functioned as oligopolies have made it that way. Naturally, more Americans would cut off internet service considering how absurdly expensive it has become to pay to stay connected. The median income for a household in the United States is just over $50,000, which has to support a family with basics like food, mortgage or rent, a car and gas. Inflation has steadily driven up the price of food and gas, which has meant that American wages have actually dropped since the recession. School costs, healthcare and other costs mean many families depend on credit cards on occasion. That doesn't leave a lot of room for splashy purchases. Yet, strangely, internet access – which is a necessity in homes where children get their homework online and parents may telecommute – has become the splashiest purchase of all. In many big cities, internet access can easily become a budgetary sinkhole for families. Think of $100 a month for cable and internet, another $50 a month for a smartphone, $40 a month for an iPad or a similar device; if you travel, add $70 a month for some kind of wireless hotspot like Verizon's Mi-Fi.
Beef Prices Hitting Record High for Summer - Beef prices are hitting record highs just as the summer grilling season begins. Steak averages $4.81 a pound at the store and ground beef $3.51 -- historically high numbers, according to economists. The spike is caused in part by high feed costs because of several droughts that have led to the smallest number of cattle in the U.S. herd since 1952. Prices hit their highest point just before the Memorial Day weekend. The average wholesale price for beef was $2.06 Thursday, up from $1.94 a year earlier, says Gary Morrison, a market analyst with Urner Barry, which publishes market news on agricultural commodities in Bayville, N.J. Retailers ordered a lot of beef leading up to Memorial Day, the traditional start of the summer grilling season. Now they find themselves needing to restock the meat case with prices skyrocketing. "They're either going to have to raise their prices or squeeze their margins, two things they don't want to do," Morrison says.
Drilling Down into Core Inflation: Goods versus Services - NY Fed - Among the measures of core inflation used to monitor the inflation outlook, the series excluding food and energy prices is probably the best known and most closely followed by policymakers and the public. While the conventional “ex food and energy” measure is a composite of the price changes of a large number of different products and services, almost all models developed to explain and forecast its behavior do not distinguish between the goods and services categories. Is the distinction important? Here, we highlight the different behavior and determinants of goods inflation and services inflation and suggest, based on preliminary analysis, that we can improve the forecast accuracy of this conventional core inflation measure by combining separate inflation forecasts of the two categories.
Weekly Gasoline Update: Unchanged - It's time again for my weekly gasoline update based on data from the Energy Information Administration (EIA). Rounded to the penny, the average for both Regular and Premium were unchanged. Since their interim high in late February, Regular is down 14 cents and Premium 17 cents. According to GasBuddy.com, four states are averaging above $4.00 per gallon, down from five last week. Four states are in the 3.90-4.00 range, down from six last week.
Brent, Cushing and $3.50 per gallon Gasoline - Oil prices have been declining. West Texas Intermediate (WTI) crude oil (quoted in terms of delivery in Cushing, Oklahoma) has fallen to $91.97 per barrel according to Bloomberg. Prices for Brent crude has fallen to $100.39 per barrel. However national gasoline prices have only declined to $3.64 per gallon according to gasbuddy.com (graph at bottom).For the last few years there have been some capacity issues at Cushing (see Jim Hamilton's post Prices of gasoline and crude oil for a discussion of the issues).The first graph shows the divergence between Brent and Cushing starting in 2011. As Hamilton noted: [A]n increase in production in Canada and the central U.S. combined with a decrease in U.S. consumption has led to a surplus of oil in the central U.S. This overwhelmed existing infrastructure for cheap transportation of crude from Cushing to the coast, causing a big spread to develop between the prices of WTI and Brent. Recently the spread has been closing. At one point Brent was selling for about 25% more than WTI (even though they are comparable quality). Now the difference is under to 10%. (note: $100.39 per barrel for Brent, and $91.97 per barrel for WTI is about 9% difference). The second graph compares Cushing (WTI) crude oil prices (left axis) with U.S. gasoline prices (right axis). Gasoline tracked WTI crude oil pretty well (with some noise), until 2011. Then - with the capacity issues at Cushing - gasoline prices have been much higher than the previous relationship just based on WTI.
Voluntary or Involuntary?: That is the question analysts are pondering regarding the post-recession increase in the ratio of private inventories to gross domestic product (GDP). The ratio measures the value of inventories held by businesses, from manufacturers to retailers, to facilitate trade and economic activity. Over the last forty years, the ratio has steadily declined. There are a number of causes for this secular trend. First, was the skyrocketing of interest rates during the 1970s. Higher interest rates raise the opportunity cost for businesses of holding inventories, whether financed (through loans) or paid for in cash. Double digit interest rates significantly eroded gross margins (the difference between an item's sales price and the cost to the business of buying or making the good). Self-preservation induced firms to slash inventory levels in order to survive. The steadily declining cost of information technology was the second driving force. Cheaper (and smaller) computers allowed businesses to begin to monitor (in almost real time) the flow of items from the shipping dock, to the factory floor, to the warehouse and onto the end customer. Finally, the emergence and diffusion of lean manufacturing techniques and just-in-time inventory control created a new global standard for businesses - not just in goods producing industries but in the distribution chain (wholesaling and retailing) as well. The result: the quantity or value of inventories needed to support or accommodate one dollar of economic activity has declined precipitously since the 1970s.
U.S. Light Vehicle Sales increased to 15.3 million annual rate in May - Based on an estimate from AutoData Corp, light vehicle sales were at a 15.31 million SAAR in May. That is up 10% from May 2012, and up 3% from the sales rate last month. This was slightly above the consensus forecast of 15.2 million SAAR (seasonally adjusted annual rate). This graph shows the historical light vehicle sales from the BEA (blue) and an estimate for May (red, light vehicle sales of 15.31 million SAAR from AutoData).This was the near the post-recession high for auto sales. After three consecutive years of double digit auto sales growth, the growth rate will probably slow in 2013 - but this will still be another positive year for the auto industry even if sales move mostly sideways for the rest of 2013. The second graph shows light vehicle sales since the BEA started keeping data in 1967.
U.S. Auto Sales Roar Back in May, Led by Pickups -- Full-size pickups once again dominated U.S. auto sales in May, as small businesses — increasingly confident in the economy — raced to replace the aging pickups they held on to during the recession. Car buyers, too, were lured by low interest rates and Memorial Day sales. Overall, U.S. consumers bought 1.4 million vehicles in May, up 8 percent from the same month a year ago, according to Autodata Corp. The results suggest the auto industry will remain a bright spot in an economy that’s been slowed by weak manufacturing. And the boost from the industry will help sustain the economy’s steady job growth. Most automakers topped analysts’ expectations last month, with Nissan reporting its highest May sales ever after cutting prices on seven popular models. Chrysler, Ford, Honda and Toyota also reported increases. Only Volkswagen’s sales were down from last May. Automakers sold 173,972 full-size pickups in May, the highest total since a year-end rush last December, according to Ward’s AutoInfoBank. Sales of Ford’s F-Series pickup, which is the country’s best-selling vehicle, rose 31 percent to a six-year high of 71,604. General Motors and Chrysler also posted full-size truck sales gains of more than 20 percent.
Factory Orders in U.S. Increased Less Than Forecast in April - Bloomberg: Orders placed with U.S. factories rose less than forecast in April as demand for non-durable goods dropped, probably reflecting lower fuel costs. The 1 percent increase in bookings followed a revised 4.7 percent decline the prior month, the Commerce Department reported today in Washington. The median forecast of 61 economists in a Bloomberg survey predicted orders would climb by 1.5 percent. Demand for durable goods, those meant to last at least three years, rose 3.5 percent, while that for non-durables decreased 1 percent. The increase in orders for durables probably means companies are looking beyond the slowdown in economic growth this quarter as housing rebounds and consumer confidence improves. At the same time, government cutbacks are restraining total demand and employment, which means the rebound will be slow to develop.
U.S. Factory Orders Rise 1% In April: The nation's factories got a boost from higher demand for aircraft in April, but new signs emerged that the manufacturing sector entered the spring on weaker footing. Orders for manufactured goods, covering everything from farm machinery to carbonated sodas, rose $4.9 billion, or 1.0% , to $474 billion from March, the Commerce Department said Wednesday. That reversed a 4.7% decline in orders in March. But the rise was tepid--economists had projected a 1.5% increase--and largely reflected higher demand in the highly volatile transportation sector. Aircraft maker Boeing Co. increased orders during the month and likely boosted the overall figure. Outside of transportation, new orders for factory goods fell 0.1%, after falling 2.8% in March. Among the biggest slumps was demand for computers, which dropped more than 9%. The report offers evidence that factories are suffering amid weak demand from customers overseas, as Europe grapples with recession and parts of Asia slump. A separate report this week showed that the manufacturing sector activity unexpectedly contracted in May, posting its worst month since the recession ended four years ago. Factories cut back production and saw new orders fall, according to the purchasing managers' index by the Institute for Supply Management. And a government report this week showed exports grew at a tepid pace in April, due largely to continued trouble in Europe, where demand for consumer and businesses goods has fallen as much of the continent grapples with recession.
MarkIt PMI shows "only a modest rate of growth" in May - From MarkIt: Markit U.S. Manufacturing PMI™ – final data The final Markit U.S. Manufacturing Purchasing Managers’ Index™ (PMI™)1 signalled a further improvement in manufacturing business conditions in May. However, at 52.3, up slightly from a six-month low of 52.1 in April and higher than the earlier flash estimate of 51.9, the PMI was consistent with only a modest rate of growth. ...Firms linked the increase in production to higher new order requirements. Incoming new work rose modestly in May, with the rate of increase stronger than the six-month low recorded in April and faster than signalled by the earlier flash estimate....Manufacturing employment in the U.S. rose further in May. Nonetheless, the rate of job creation was only modest and the weakest since last November.
ISM Manufacturing index declines in May to 49.0, Lowest since June 2009 - The ISM manufacturing index indicated contraction in May. The PMI was at 49.0% in May, down from 50.7% in April. The employment index was at 50.1%, down from 50.2%, and the new orders index was at 48.8%, down from 52.3% in April. From the Institute for Supply Management: May 2013 Manufacturing ISM Report On Business® Economic activity in the manufacturing sector contracted in May for the first time since November 2012, and the overall economy grew for the 48th consecutive month, say the nation's supply executives in the latest Manufacturing ISM Report On Business®.. "The PMI™ registered 49 percent, a decrease of 1.7 percentage points from April's reading of 50.7 percent, indicating contraction in manufacturing for the first time since November 2012 and only the second time since July 2009. This month's PMI™ reading is at its lowest level since June 2009, when it registered 45.8 percent. The New Orders Index decreased in May by 3.5 percentage points to 48.8 percent, and the Production Index decreased by 4.9 percentage points to 48.6 percent. The Employment Index registered 50.1 percent, a slight decrease of 0.1 percentage point compared to April's reading of 50.2 percent. The Prices Index registered 49.5 percent, decreasing 0.5 percentage point from April, indicating that overall raw materials prices decreased from last month. Here is a long term graph of the ISM manufacturing index.This was below expectations of 51.0% and suggests manufacturing contracted in May for the first time since November 2012
Manufacturing Contracts - PMI 49% for May 2013 - The May ISM Manufacturing Survey shows PMI crumbled by -1.7 percentage points to 49.0%. Manufacturing has moved into contraction. Manufacturing also contracted in November 2012 and previous to that, July 2009. Both new orders and production contracted indicating bad news for the U.S. manufacturing sector and the index details are even more ominous. Comments from manufacturing survey responders implied general weak economic demand. Weak demand was from less Government spending, domestic weak demand and both Europe and China's downturn were mentioned as a cause for the contraction. New Orders contracted, a -3.5 percentage point increase to 48.8%. That's bad news in terms of future growth. New Orders last 49.7% contraction was in December 2012. A New Orders Index above 52.3 percent, over time, is generally consistent with an increase in the Census Bureau's series on manufacturing orders. ISM gives an ordered list of manufacturing groups who show growth to decline in new orders: The Census reported manufactured April durable goods new orders growth was 3.3%, where factory orders, or all of manufacturing data, will be out later this month, but note the one month lag from the ISM survey. The ISM claims the Census and their survey are consistent with each other. Below is a graph of manufacturing new orders percent change from one year ago (blue, scale on right), against ISM's manufacturing new orders index (maroon, scale on left) to the last release data available for the Census manufacturing statistics. Here we do see a consistent pattern between the two.
Slow Start, by Tim Duy: (4 graphs) ISM data came in on the soft side this morning, with a sub-50 reading: I would be a little cautious about saying that "manufacturing is contracting" based on a diffusion index. That said, the headline number suggests overall weakness. What is the source of that weakness? I think once again the external sector is a drag. While new orders were down slightly:exports orders were down sharply: But note that import orders held their ground: Import orders should be a reflection of domestic demand. The steady reading in those suggests that manufacturing weakness in the headline numbers stems from external sources which has not yet filtered broadly into the domestic economy. That, at least, is the optimistic view. Also more optimistic was the 52.3 manufacturing number from the competing Markit report. But optimism aside, put this morning's ISM report under the "delay tapering" column.
ISM Manufacturing Index Contracts, Worst Level Since June 2009 - Today the Institute for Supply Management published its May Manufacturing Report. The latest headline PMI at 49.0 percent is the first month of contraction following five months of modest expansion and only the fourth month of contraction since the end of the Great Recession. In fact that one month of contraction last November at 49.9 was the direct result of Superstorm Sandy. Today's number is the lowest since June 2009. The Briefing.com consensus was for 50.7 percent. Here is the key analysis from the report: Manufacturing contracted in May as the PMI™ registered 49 percent, a decrease of 1.7 percentage points when compared to April's reading of 50.7 percent. This month's reading reflects the second month of contraction in the manufacturing sector since July 2009, when the index registered 49.9 percent. It is also the lowest reading for the PMI™ since June 2009, when the index registered 45.8 percent. A reading above 50 percent indicates that the manufacturing economy is generally expanding; below 50 percent indicates that it is generally contracting. A PMI™ in excess of 42.2 percent, over a period of time, generally indicates an expansion of the overall economy. Therefore, the May PMI™ indicates growth for the 48th consecutive month in the overall economy, and indicates contraction in the manufacturing sector for the first time since November 2012. Holcomb stated, "The past relationship between the PMI™ and the overall economy indicates that the average PMI™ for January through May (51.7 percent) corresponds to a 3 percent increase in real gross domestic product (GDP) on an annualized basis. In addition, if the PMI™ for May (49 percent) is annualized, it corresponds to a 2.1 percent increase in real GDP annually." Here is the table of PMI components. I've highighted the ones that are contracting. Note that employment is still above 50 for this diffusion index but was slowing in May.
Surprise Factory Downturn Holds Back U.S. Growth - Manufacturing in the U.S. unexpectedly shrank in May at the fastest pace in four years, showing slowdowns in business and government spending are holding back the world’s largest economy. The Institute for Supply Management’s factory index fell to 49, the lowest reading since June 2009, from the prior month’s 50.7, the Tempe, Arizona-based group’s report showed today. Fifty is the dividing line between growth and contraction. The median forecast of 81 economists surveyed by Bloomberg was 51. Across-the-board federal budget cuts and overseas markets that are struggling to rebound will probably continue to curb manufacturing, which accounts for about 12 percent of the economy. At the same time, demand for automobiles, gains in residential construction and lean inventories may spark a pickup in orders and production in the second half of the year. “Manufacturing is really stymied by slow corporate spending and government spending cutbacks,”
U.S. Manufacturing Contracts in May, Reviving Fed Chair Bernanke’s Deflation Worries - The Institute for Supply Management’s (ISM) manufacturing index contracted in May to a reading of 49, the lowest level since it registered a reading of 45.8 percent in June 2009. A reading below 50 means the manufacturing sector is contracting. The data, called the PMI or Purchasing Managers’ Index, is based on a survey of more than 300 purchasing and supply executives from around the country who respond anonymously to a monthly questionnaire. With the exception of a four-year interruption during World War II, ISM has published the data monthly since 1931. Both the index and a number of its individual components showed broad-based weakness in May. ISM’s new order index registered 48.8 percent in May, a decrease of 3.5 percentage points when compared to the April reading of 52.3 percent. The Backlog of Orders Index registered 48 percent, a 5 percent drop from the 53 percent reported in April. The New Export Orders Index registered 51 percent in May, which is 3 percentage points lower than the 54 percent reported in April. None of this data is consistent with a raging U.S. stock market that is regularly setting new highs while a large swath of the global economy contracts. The data also removes the likelihood that the big worry last week – that the Federal Reserve might begin to taper back its monthly $85 billion purchases in the bond market – is a decidedly premature worry.
Huge Miss in May ISM; Manufacturing Now in Contraction; What the Numbers Mean - US Manufacturing as measured by the May 2013 Manufacturing ISM Report On Business® is treading water barely above contraction. Economic activity in the manufacturing sector contracted in May for the first time since November 2012, and the overall economy grew for the 48th consecutive month, say the nation's supply executives in the latest Manufacturing ISM Report On Business®.Last month I stated "Manufacturing employment has grown for 43 months. I expect that trend to break next month. Production was up but inventories were way lower. The drop in inventories, in conjunction with a big slowdown in employment, is likely a leading indicator of future production. The positive surprise that does not fit into the above assessment is that new orders grew at a faster rate. Next month may be telling. I expect the new order divergence to resolve to the downside as the global economy and the US economy are both slowing." The consensus estimate was for slower growth, but here we are. Manufacturing is in contraction and the economy continues to weaken. Given the plunge in new orders and backlog of orders, jobs and the overall economy will likely weaken as well. Expect that trend of 48 months of economic growth to break next month.
The ISM report: US manufacturing slowest since 2009 - Today's ISM report confirmed what was already visible in the Markit PMI figures (see discussion) - the "spring slowdown" in US manufacturing is here. The table below shows the breakdown of the month-over-month changes - orders and production seem to be the main drivers. Weakness in Backlog of Orders does not bode well for the sector going forward.The ISM manufacturing indicator is now at the lowest level since 2009: Bond prices rose as a result, with the expectation that the US growth is not nearly as robust as some have thought. Of course bond investors are still in a selling mood, and we are likely to see yields drift higher.
Huge Manufacturing ISM Miss And Lowest Print Since June 2009 Sends Markets Soaring - So much for the Chicago PMI 8 Sigma renaissance. Moments ago the Manufacturing ISM came out and confirmed that all those "other" diffusion indices were correct, except for the "data" out of Chicago (yes, shocking). Printing at a contractionary 49.0, this was a drop from 50.7, well below expectations of 51.0 (and far below the cartoonish Joe Lavorgna's revised 53.0 forecast). More importantly, this was the worst ISM headline print since June 2009, the first sub-50 print since November 2012, while the New Orders of 48.8, was the worst since July 2012. Both Production and Backlogs tumbled by -4.9 and -5.0 to 48.6, and 48.0 respectively. In brief, of the 11 series tracked by the ISM, only 3 posted a reading over 50 in May. This compares to just 2 out of 11 that were below 50 in April. Oh well, so much for this recovery. But the good news for the market is that today is really bad news is really good news day, and stocks have soared as according to the vacuum tubes, the result means no taper. The farce must go on.
Are Consumers, Businesses Expecting Lower Prices? - One sentence within the 10-page Institute for Supply Management‘s manufacturing report may strike fear in the hearts of Federal Reserve officials: “Customers are anticipating resin price decreases and holding back orders,” according to a respondent in the plastic and rubber products.The Fed has kept borrowing dirt cheap to pump up demand and get businesses hiring again. But that goal can be short-circuited if buyers sit on the sidelines, expecting prices to decline. That was a big reason why housing demand took so long to turn around, and it’s a reason why the Fed dislikes deflation so much. This waiting game on prices may explain in part why the ISM’s new orders index fell so sharply in May, to 48.8 from 52.3. May’s index was the weakest since July 2012 and helped to drag down the top-line ISM index to a contractionary 49.0. “Weak global activity has tended to depress commodity prices, and the expectation of lower prices appears to be influencing customer orders,” economists at HSBC noted, citing the plastics comment. Regional Fed surveys also show weak pricing power among other manufacturers, which suggests other consumers are holding off on ordering. And the lack of demand may be slowing hiring. The Philadelphia Fed said in May that 10% of area firms reported lowering the prices for their own manufactured goods, compared with 7% saying they were increasing prices. May was the fifth consecutive month when more Philly firms were cutting prices rather than increasing them. In a series of special questions asked in May, the New York Fed found the pressure to cut prices will continue over the coming year.
Non-Manufacturing ISM Comes In Line, Factory Orders Miss: Inventory To Sales Highest Since October 2009 - Despite market bull hopes for a collapse in the non-manufacturing ISM and a repeat of the sub-50 Manufacturing ISM fiasco, moments ago the Institute for Supply Management released the June Non-manufacturing ISM which printed at 53.7, just above expectations of a 53.5 print, and above last month's disappointing 53.1. The New Orders index rose from 54.5 to 56.0 and the Business Activity also rising from 55.0 to 56.5, offset by a drop in inventories from 56.0 to 51.5, a collapse in Imports from 58.5 to 49.5 and, troublingly, an ADP validating decling in the employment index from 52.0 to just above contraction at 50.1. Perhaps the most informative respondent comment was the following: "Healthcare reform and sequestration are having a strong negative impact on business." (Health Care & Social Assistance). Oh well, a mixed report that is neither overly bullish or bearish, so those hoping for bad news will have to look at the Factory Orders release which posted its second miss in a row, printing at 1.0% on expectations of a 1.5% rise
ISM Non-Manufacturing Index indicates slightly faster expansion in May - The May ISM Non-manufacturing index was at 53.7%, up from 53.1% in April. The employment index decreased in May to 50.1%, down from 52.0% in April. Note: Above 50 indicates expansion, below 50 contraction. From the Institute for Supply Management: May 2013 Non-Manufacturing ISM Report On Business® . "The NMI™ registered 53.7 percent in May, 0.6 percentage point higher than the 53.1 percent registered in April. This indicates continued growth at a slightly faster rate in the non-manufacturing sector. The Non-Manufacturing Business Activity Index registered 56.5 percent, which is 1.5 percentage points higher than the 55 percent reported in April, reflecting growth for the 46th consecutive month. The New Orders Index increased by 1.5 percentage points to 56 percent, and the Employment Index decreased 1.9 percentage points to 50.1 percent, indicating growth in employment for the 10th consecutive month. The Prices Index decreased 0.1 percentage point to 51.1 percent, indicating prices increased at a slower rate in May when compared to April. According to the NMI™, 13 non-manufacturing industries reported growth in May. This graph shows the ISM non-manufacturing index (started in January 2008) and the ISM non-manufacturing employment diffusion index. This was at the consensus forecast of 53.8% and indicates slightly faster expansion in May than in April
ISM Non-Manufacturing Business Report: Slightly Faster Growth in May - Today the Institute for Supply Management published its latest Non-Manufacturing Report. The headline NMI Composite Index is at 53.7 percent, signaling slightly faster growth than last month's 53.1 percent. The Briefing.com and Investing.com forecasts were both for 53.5 percent. Here is the report summary: The NMI™ registered 53.7 percent in May, 0.6 percentage point higher than the 53.1 percent registered in April. This indicates continued growth at a slightly faster rate in the non-manufacturing sector. The Non-Manufacturing Business Activity Index registered 56.5 percent, which is 1.5 percentage points higher than the 55 percent reported in April, reflecting growth for the 46th consecutive month. The New Orders Index increased by 1.5 percentage points to 56 percent, and the Employment Index decreased 1.9 percentage points to 50.1 percent, indicating growth in employment for the 10th consecutive month. The Prices Index decreased 0.1 percentage point to 51.1 percent, indicating prices increased at a slower rate in May when compared to April. According to the NMI™, 13 non-manufacturing industries reported growth in May. The majority of respondents' comments are optimistic about business conditions. However, there is a degree of uncertainty about the long-term outlook. I have been reluctant to focus on this collection of diffusion indexes. For one thing, there is relatively little history for ISM's Non-Manufacturing data, especially for the headline Composite Index, which dates from 2008. The chart below shows Non-Manufacturing Composite. We have only a single recession to gauge is behavior as a business cycle indicator.
Vital Signs Chart: Slowing Services Hiring - Hiring is slowing in America’s service sector. An index of employment in nonmanufacturing industries, which account for most U.S. jobs, fell to 50.1 in May from 52 in April; readings over 50 indicate expansion. Service-sector job growth has eased for four months in a row. However, a broader measure of service-sector activity rose in May, suggesting continued economic improvement.
More Signals of Slumping Manufacturing - Trouble in the manufacturing sector has been mounting for months, and several signals this week indicated the pain could continue into the summer. The latest data Wednesday showed that the manufacturing sector entered the spring on weaker footing even before the Institute for Supply Management’s factory-sector gauge, released Monday, indicated contraction last month. Apart from the volatile transportation sector, new orders for factory goods fell 0.1% in April, after falling 2.8% in March, the Commerce Department said Wednesday. Among the biggest slumps was demand for computers, which dropped more than 9%. Overall orders for manufactured goods, which cover everything from farm machinery to carbonated sodas, rose $4.9 billion during the month, or 1.0%, to $474 billion from March. That reversed a 4.7% decline in orders in March. April’s gains largely reflected higher demand in transportation; aircraft maker Boeing Co., for instance, increased orders during the month and likely boosted the overall figure. The report offers evidence that factories are suffering amid weak demand from customers overseas, as Europe grapples with recession and parts of Asia slump, as well as weak demand in the U.S.
Prosecute the patent trolls! - Here’s an idea: take the resources that the SEC is currently using to prosecute insider trading, and give them instead to the FTC, so that they can be used to aggressively prosecute patent trolls instead. The cost would be the same (by definition), and the benefit would surely be much greater, as today’s wonderful report from the White House underscores. Patent trolls are known by various names — one is “non-practicing entities”, or NPEs. Another term is “Patent Assertion Entities”, or PAEs. But whatever they’re called, the most important research into the costs of trolls is this paper from researchers at Boston University: We find that NPE lawsuits are associated with half a trillion dollars of lost wealth to defendants from 1990 through 2010. During the last four years the lost wealth has averaged over $80 billion per year. Patent trolls are surely contributing to the decline in new-company formation:Fewer Americans are choosing that path. In 1982, new companies—those in business less than five years—made up roughly half of all U.S. businesses, according to census data. By 2011, they accounted for just over a third. Over the same period, the share of the labor force working at new companies fell to 11% from more than 20%... Go to any technology conference these days, and you’re likely to find VCs who say that there are entire sectors they refuse to invest in, just because the waters are so troll-infested. Google and Apple might be able to do interesting things in wearable computing, for instance, but a single lawsuit could easily wipe out a startup in the same space — even if it was entirely frivolous.
Counterparties: Obama’s off-message patent police - As if on cue, the US International Trade Commission (ITC) has stepped into the larger debate on patents. Yesterday, the very day that President Obama announced plans to tackle the growing ranks of patent trolls, the ITC ruled against Apple in its protracted patent dispute with Samsung. The result, which could be vetoed by President Obama or overturned on appeal, is that Apple will be barred from bringing certain older products sold by AT&T into the country. These include: iPhone 4, iPhone 3GS, iPad 3G and iPad 2 3G. The timing was appropriate: one of the Obama administration’s seven legislative recommendations on patent reform was to make it harder for the ITC to issue bans on imports because of patent issues. The ITC has been a popular destination for high-profile patent cases in the last few years. That’s because, Timothy Lee writes, it is more “patent-friendly than district courts”. Florian Mueller calls the decision a “major surprise” and suggests the ITC is betraying its “original mission to protect domestic industry against unfair imports.” Lee has more background on the ITC’s expanded role in the consumer electronic sector:
Analysis: Overseas Slowdown Weighing on U.S. Factories -- The Wall Street Journal’s Hank Weisbecker talks to Doug Roberts, chief investment strategist at Channel Capital Research, about the findings of the latest ISM manufacturing report.
Trade Deficit in U.S. Widened From Three-Year Low - The trade deficit in the U.S. widened in April from a more than three year low, reflecting a rebound in imports of consumer goods and business equipment that eases concern about the degree of slowing in economic growth. The gap grew by 8.5 percent to $40.3 billion from a $37.1 billion in March shortfall that was smaller than previously estimated, Commerce Department figures showed today in Washington. The median forecast in a Bloomberg survey of 68 economists called for the deficit to grow to $41.1 billion. Imports climbed by 2.4 percent, twice the gain in exports. American demand for foreign-made mobile phones, automobiles and computers accelerated, pointing to gains in household and business spending that will help the world’s largest economy weather government cutbacks. Record U.S. exports of autos and parts and consumer goods also indicate global growth is stabilizing. “The details of this report offer an encouraging take on both U.S. and global economic activity at the start of the Quarter,”
Trade Deficit increased in April to $40.3 Billion - The Department of Commerce reported: [T]otal April exports of $187.4 billion and imports of $227.7 billion resulted in a goods and services deficit of $40.3 billion, up from $37.1 billion in March, revised. April exports were $2.2 billion more than March exports of $185.2 billion. April imports were $5.4 billion more than March imports of $222.3 billion.. The trade deficit was lower than the consensus forecast of $41.2 billion. The first graph shows the monthly U.S. exports and imports in dollars through April 2013.Both exports and imports increased in April. Imports rebounded from the decline in March that was partially due to the timing of the Chinese New Year.Exports are 13% above the pre-recession peak and up 2% compared to April 2012; imports are 2% below the pre-recession peak, and down 1% compared to April 2012 (mostly moving sideways).The second graph shows the U.S. trade deficit, with and without petroleum, through April. The blue line is the total deficit, and the black line is the petroleum deficit, and the red line is the trade deficit ex-petroleum products. Most of the recent improvement in the trade deficit is related to petroleum. Oil averaged $97.82 in April, up from $96.95 per barrel in March, but down from $109.69 in April 2012. Oil import prices should decline in May. The trade deficit with the euro area was $10.0 billion in April, up from $7.8 billion in April 2012. The trade deficit with China decreased to $24.1 billion in April, down from $24.5 billion in April 2012. Most of the trade deficit is related to China
The US trade deficit - a mixed picture - Although the US trade deficit widened in April, the number ended up being better than expected. Furthermore, the March trade deficit was revised lower than originally reported. While this result is certainly a positive for the US economy, longer-term trade dynamics paint a different picture. The good news is that the US net imports of oil are declining, as the nation's production ramps up (see discussion). The bad news is that the longer term trend in non-petroleum merchandise trade shows an increasingly larger deficit. Americans have not lost their taste for foreign made cars, phones, etc. USA Today: - Imports grew ... 2.4% to $227.7 billion. Sales of foreign cars increased to $25.5 billion. Americans also bought more consumer goods, led by big gain in foreign-made cell phones. It means that in the future, should fuel production in the US stumble for some reason, trade deficit will spike.
US April Trade Deficit Rises But Less Than Expected - Following April's surprising drop in crude imports which led to a multi-year low in the March trade balance (revised to -$37.1 billion), the just released April data showed an 8.5% jump in the deficit to $40.3 billion, if modestly better than the expected $41.1 billion. This was driven by a $2.2 billion increase in exports to $185.2 billion offset by a more than double sequential jump in imports by $5.4 billion, to $222.3 billion. More than all of the change was driven by a $3.2 billion increase in the goods deficit, offset by a $0.1 billion surplus in services.The Census Bureau also revised the entire historical data series, the result of which was a drop in the March deficit from $38.8 billion to $37.1 billion. In April 233,215K barrels of oil were imported, well above the 215,734K in March, and the highest since January. Furthermore, since the Q1 cumulative trade deficit has been revised from $126.9 billion to $123.7 billion, expect higher Q1 GDP revisions, offset by even more tapering of Q2 GDP tracking forecasts. And since the data is hardly as horrible as yesterday's ISM, we don't think it will be enough on its own to guarantee the 21 out of 21 Tuesday track record, so we eagerly look forward to today's POMO as the catalyst that seals the deal.
U.S. Cutting Back on Foreign-Oil Habit - April trade data offered fresh evidence that the U.S. is starting to kick its foreign oil habit. Reuters The value of imported petroleum, on a seasonally adjusted basis, fell to its lowest level in two-and-half years, according to a Commerce Department report Tuesday. In terms of unadjusted volume, it was the weakest April for crude oil imports since 1995. Increasing domestic production of oil is the main driver of declining imports. “Domestic demand for crude oil has been relatively stable…but we’ve seen a dramatic increase in U.S. production the last couple of years, from oil shale plays in North Dakota, Texas and elsewhere,” said Doug MacIntyre, senior analyst for U.S. Energy Information Administration. The downward import trend could have wide-ranging effects. Increased supply could change policy makers’ calculus as they approach unrest in Syria, saber-rattling in Iran and other potential Middle East hot spots. It also could push down gasoline prices in certain areas of the U.S. that rely on domestic crude oil. The shale boom is a key driver of jobs in some parts of the country. Employment in the oil and gas extraction sector has expanded nearly three times as fast as total non-farm payrolls. Lower oil imports also helps keep the trade deficit in check by partially offsetting increased consumer demand for foreign goods. The overall trade deficit expanded in April to $40.3 billion, as growth in total imports outpaced export gains.
Analysis: Dull Growth in Exports and Imports - The Wall Street Journal's Dan Loney speaks with Bob Mellman, chief economist at J.P. Morgan Chase, about this morning’s international trade report.
Vital Signs Chart: Slowing Export Growth - Export growth is slipping as a softening global economy weighs on demand for American goods and services. U.S. exports were up 1.7% in April compared with the same month a year ago. But that trails the 5.3% rate seen last December and rates of more than 10% in 2011. With foreign sales flagging, U.S. firms are relying more heavily on domestic consumers for business.
AAR: Rail Traffic increased in May - From the Association of American Railroads (AAR): AAR Reports Increased Rail Traffic for May, and Week Ending June 1 The Association of American Railroads (AAR) today reported that total U.S. rail traffic increased for the month of May 2013 as well as for the week ending June 1, 2013. May 2013 saw the first year-over-year monthly total carload increase in 16 months, and the 42nd straight monthly increase in intermodal traffic. Intermodal traffic in May totaled 1,214,116 containers and trailers, up 3 percent (35,790 units) compared with May 2012. The weekly average of 242,823 units for May was the highest weekly intermodal average for any May in history. Carloads originated in May totaled 1,401,584, up 0.7 percent (9,551 carloads) compared with the same month last year. This graph from the Rail Time Indicators report shows U.S. average weekly rail carloads (NSA). Green is 2013. Total U.S. rail carloads rose 0.7% (9,551 carloads) in May 2013 over May 2012 to 1,401,584 carloads, their first year-over-year monthly increase in 16 months. U.S. rail carloads averaged 280,317 per week in May 2013, up from 277,181 in April 2013 and 278,407 in May 2012 ...The second graph is for intermodal traffic (using intermodal or shipping containers): Intermodal traffic is on track for a record year in 2013.
WSJ Bemoans Rise in Rationality, Um, Decline in Entrepreneurial Risk-Taking - Yves Smith - It’s hard to know where to begin with a story up at the Wall Street Journal, Risk-Averse Culture Infects U.S. Workers, Entrepreneurs. The headline alone raises the question of whether the Journal knows anything about real entrepreneurship, as opposed to fantasy version noisily promoted by management gurus and other folks in the fee-extraction business. While any class as large as “entrepreneurs” or small business founders is going to have a great deal of variability within it, studies have repeatedly found that business founders aren’t gamblers or risk seekers. They typically think hard about the downside of launching a venture and take steps to limit it, such as syndicating risks (like getting suppliers to supply financing or materials, as Steve Jobs did by taking his first purchase order for Apple and persuading vendors to give him parts against it). And the “infects” in the headline suggests that the former wild-man thrill-seeking new business types have been afflicted with a mad cow disease variant that eats away at the parts of their brain that produces animal spirits. No, it’s even worse than that: America has gone “soft on risk”. Flaccid dick alert! Bring out the entrepreneurial Viagra!
How to Fix the Post Office: Keep the ‘Last Mile,’ Outsource the Rest - A proposal to create a “hybrid” United States Postal Service would keep postal workers on their routes while allowing private companies to compete for mail collection, transportation, and processing. Now all it needs is a divided Congress and a reluctant postmaster general to sign off on it. A new study released today by a non-partisan Washington think tank recommends a radical departure for the struggling United States Postal Service: a public-private partnership that would open up much of the service’s back-end logistics to outside competition. This public-private hybrid proposal centers around private companies competing to accept, transport, and process much of America’s first-class mail. The USPS’s mail carriers would keep their “letterbox monopoly” on existing delivery routes, and the Postal Service would determine a national average for delivery costs that it would charge those private carriers.
Import Competition and the Great US Employment Sag of the 2000s - That is the new paper (pdf) by Acemoglu, Autor, Dorn, and Hanson, and here is the abstract: Even before the Great Recession, U.S. employment growth was unimpressive. Between 2000 and 2007, the economy gave back the considerable jump in employment rates it had achieved during the 1990s, with major contractions in manufacturing employment being a prime contributor to the slump. The U.S. employment “sag” of the 2000s is widely recognized but poorly understood. In this paper, we explore an under-appreciated force contributing to sluggish U.S. employment growth: the swift rise of import competition from China. We find that the increase in U.S. imports from China, which accelerated after 2000, was a major force behind recent reductions in U.S. manufacturing employment and that through input-output linkages with the rest of the economy this negative trade shock has helped suppress overall U.S. job growth.
Why the right is wrong about jobs - — Everyone from the right to the left agrees that job growth is far too weak. But what they can’t agree on is what’s causing this jobless emergency, or what to do about it. On the left, commentators generally point to cyclical problems in the economy, particularly the slow growth in spending (what economists refer to as aggregate demand). Their argument is that businesses aren’t hiring more workers because the demand for their goods or services isn’t growing fast enough to force them to hire more workers. It’s a Keynesian view, and it largely fits the facts, as I argued in my columns of May 17 and of May 31.. The classic way to get more demand in the economy is to lower interest rates to encourage more borrowing and more spending. But the Federal Reserve has already cut interest rates as much as it can, and it’s doing a lot of unorthodox things like buying bonds to achieve the same result: Create more spending. The Fed is doing what it can, but it’s not enough to ignite the virtuous cycle of increased spending, income and jobs that those 20 million unemployed Americans need. Is there another way to boost demand? Sure, when there are lots of idle resources (labor, unused productive capacity and capital), the government can increase demand by spending more on its own account, or by giving the people some extra money (tax cuts or food stamps, for example) to spend as they wish. Unfortunately, the government hasn’t been doing that. After a burst of stimulus in 2009 and 2010, federal, state and local governments have been doing less, not more. This drives commentators on the left crazy.
The Crumbling Coliseum That is America - The horrifying collapse of the I-5 bridge in Seattle in May, one in an ongoing series I’m afraid, is a grim reminder of the true state of our condition…we are dying. There is a difference between pessimism and realism. Badly deteriorating infrastructure is a reality and predicting the future is easy. I’m not a pessimist because I see in this very real situation an opportunity of not a lifetime, but a nation-time. These disasters-in-waiting should be addressed immediately, and if we did what we must demand of our leaders, we would solve our economic crisis and leave the next generation on a solid footing for their futures and the generations to come. My fear is that we will not seize upon this magnificent opportunity. Here lie the jobs that have gone away. Here lies the economic boost that this country needs to fire up production. Think of all the component parts that would have to be manufactured. Everything from bridge supports to electronics would be required. In order to manufacture and construct stuff, you need raw materials. Loggers and miners go back to work. Jobs would be created in transportation because you have to get both the raw material and the completed parts to their respective sites. Wholesale trade would boom and consumers would go back to spending. Every sector would grow jobs overnight.
Weekly Initial Unemployment Claims decline to 346,000 - The DOL reports: In the week ending June 1, the advance figure for seasonally adjusted initial claims was 346,000, a decrease of 11,000 from the previous week's revised figure of 357,000. The 4-week moving average was 352,500, an increase of 4,500 from the previous week's revised average of 348,000. The previous week was revised up from 354,000. The following graph shows the 4-week moving average of weekly claims since January 2000. The dashed line on the graph is the current 4-week average. The four-week average of weekly unemployment claims increased to 352,500. Claims close to the 345,000 consensus forecast
A Modest Drop In Last Week's Unemployment Filings - Jobless claims fell for the week through June 1, slipping 11,000 to a seasonally adjusted 346,000. That leaves the number of claims close to middling relative to the range for the last several months. Although the new filings have been moving sideways lately, it’s still encouraging that this series isn’t moving higher in the wake of wobbly data in other economic news. One potentially worrisome sign is what appears to be a higher risk of stagnation for this series. New claims are again treading water, fluctuating around the 350,000 level. That’s roughly 50,000 more relative to the troughs reached in recent decades. Perhaps more progress is coming, but for now it’s clear that the decline in weekly jobless claims has come to a halt.
Survey: U.S. Private Employers Add 135K Jobs in May 0 A private survey shows U.S. businesses added just 135,000 jobs in May, the second straight month of weak gains. Payroll provider ADP said Wednesday that May’s gain was above April’s revised total of 113,000. But it’s much lower than the gains ADP reported over the winter, which averaged more than 200,000 a month from November through February. Mark Zandi, chief economist at Moody’s Analytics, blamed the slowdown on higher taxes and steep government spending cuts enacted this year. The ADP survey is derived from payroll data and tracks private employment. It has diverged at times from the government’s more comprehensive monthly jobs report, which will be released Friday. In April, the government said private employers added 176,000 jobs, much higher than the ADP’s estimate. Economists say the gap between the ADP’s survey and the government figures has narrowed since Moody’s Analytics began compiling the numbers eight months ago. Still, it has differed from the Labor Department’s report by about 40,000 a month since then. “
ADP: Private Employment increased 135,000 in May -- From ADP: Private sector employment increased by 135,000 jobs from April to May, according to the May ADP National Employment Report®, which is produced by ADP® ... in collaboration with Moody’s Analytics. The report, which is derived from ADP’s actual payroll data, measures the change in total nonfarm private employment each month on a seasonally-adjusted basis. April’s job gains were revised downward to 113,000 from 119,000....Mark Zandi, chief economist of Moody’s Analytics, said, "The job market continues to expand, but growth has slowed since the beginning of the year. The slowdown is evident across all industries and all but the largest companies. Manufacturers are reducing payrolls. The softer job market this spring is largely due to significant fiscal drag from tax increases and government spending cuts."This was below the consensus forecast for 171,000 private sector jobs added in the ADP report. Note: The BLS reports on Friday, and the consensus is for an increase of 167,000 payroll jobs in May, on a seasonally adjusted (SA) basis.
ADP: Slow Growth In Payrolls Persists In May - The pace of growth in private-sector payrolls picked up a bit last month, according to today’s ADP Employment Report. The modest improvement is enough to assume that May’s full economic profile, once all the numbers are published, will reflect more of what we’ve seen lately: a sluggish but still positive rate of expansion. But expecting something better continues to require a level of confidence that’s not supported in the numbers. Private sector employment added 135,000 jobs on a net basis in May, ADP reports. That’s up a bit from the company's April estimate of a 113,000 gain, and so the change in direction is encouraging. In turn, the slightly better monthly comparison lends support for thinking that Friday’s official payrolls report from the Labor Department will also deliver a decent if unspectacular round of data. "The job market continues to expand, but growth has slowed since the beginning of the year," says Mark Zandi, chief economist of Moody’s Analytics, in the accompanying ADP press release "The slowdown is evident across all industries and all but the largest companies. Manufacturers are reducing payrolls. The softer job market this spring is largely due to significant fiscal drag from tax increases and government spending cuts."
ADP Employment Report Shows 135,000 Jobs for May 2013 - ADP's proprietary private payrolls jobs report shows a gain of 135,000 private sector jobs for May 2013. ADP revised April's job figures down by 6,000 to a measly 113 thousand jobs. Overall, May shows another month of more weak job figures. This report does not include government, or public jobs. All of the jobs gains were in the service sector where services added 138,000 private sector jobs. The goods sector lost -3,000 jobs Professional/business services jobs grew by 42,000 and was the largest growth services sector. Trade/transportation/utilities showed strong growth again with 31,000 jobs. Financial activities payrolls increased by 7,000. Construction work added 5,000 jobs. Manufacturing lost -6,000 jobs. Graphed below are the month job gains or losses for the five areas ADP covers, manufacturing (maroon), construction (blue), professional & business (red), trade, transportation & utilities (green) and financial services (orange). ADP is reporting a general slow down in hiring. They blame increased taxes and the budget cuts as the cause. ADP reports payrolls by business size, unlike the official BLS report. Small business, 1 to 49 employees, added 74,000 jobs with establishments having less than 20 employees adding 44,000 of those jobs. Below is the graph of ADP private sector job creation breakdown of large businesses (bright red), median business (blue) and small business (maroon), by the above three levels. For large business jobs, the scale is on the right of the graph. Medium and Small businesses' scale is on the left
Job creation vs. employer size - some observations - ADP data on private payrolls has an interesting story to tell about job creation in the US. It is particularly helpful to understand job creation in terms of business size. ADP breaks down businesses into small: 1-49 employees, medium: 50-499 employees, and large: 500 and greater. Using the number of employees to define company size is not ideal. However, as a payroll processing company, ADP only has access to employee count as opposed to any type of revenue data (which is much harder to come by for smaller firms.) Here are some observations related to growth in payrolls:
1. Since the beginning of 2005, ADP estimates that the US economy has generated a net of 2.6 million private sector jobs.
2. During that period roughly 2.3 million were created by small businesses, 1.3 million by medium businesses, while large businesses lost 1 million jobs.
3. Even though small and medium-sized business payrolls peaked in 2008, large businesses started shrinking their workforce in 2006 - prior to the recession. That makes large business payrolls more of a leading indicator.
4. Small business payrolls lag the other two categories both to the downside and to the upside - smaller firms are slower to lay people off and slower to hire (these jobs are therefore more "sticky").
5. Medium sized businesses experienced the largest and the sharpest loss of jobs (from peak) during the recession. That's in part due to the fact that mid-market firms also saw the fastest payroll growth during 2006-2007 period (the "bubble jobs"). A good number of these firms were housing-related (construction firms, real estate brokers, mortgage brokers, small banks, etc.). That, at least in part, explains the sharp rise as well as the decline in middle market jobs.
6. Small business payrolls never fell below their 2005 level and are now near pre-crisis peak.
U.S. Payroll to Population and Unemployment Worsen in May – Gallup - The U.S. Payroll to Population employment rate (P2P), as measured by Gallup, worsened in May, dropping to 43.9%, from 44.5% in April. P2P is also down from May 2012, when it was 44.4% Year-over-year comparisons are helpful in determining the degree to which monthly changes are the result of growth in permanent full-time positions rather than temporary seasonal hiring. The decline in P2P versus 2012 indicates that fewer people worked full-time for an employer this May compared with a year ago. The 43.9% found this May is similar to the 43.7% recorded in 2011 and 44.0% in 2010. Gallup's P2P metric is an estimate of the percentage of the U.S. adult population aged 18 and older who are employed full time by an employer for at least 30 hours per week. P2P is not seasonally adjusted.Gallup's unadjusted unemployment rate for the U.S. workforce was 7.9% for the month of May, a half-point increase over April, and statistically unchanged from May 2012 (8.0%). Gallup's seasonally adjusted U.S. unemployment rate for May was 8.2%, up from 7.8% in April. Gallup calculates its seasonally adjusted employment rate by applying the adjustment factor the U.S. government used for the same month in the previous year.
Less People Working Now Than A Year Ago; Gallup Warns Recent Job Gains Not Sustained In May - As the world waits breathless for some Goldilocks print in tomorrow's non-farm payroll data, Gallup's most recent survey of employment trends does not paint a pretty picture for the real economy. Though, by the 'adjustment bureau' and their Arima-X goal-seeking, nothing is ever clear, not only is the payroll-to-population (the number of people working) worse than a year ago but the unemployment rate is also rising with under-employment - at 18.0% - near 15 month highs. If the NFP print plays out in line with this, the estimate of 165k will be woefully over-optimistic, leaving the question of whether bad-is-good, or have we crossed the Rubicon of belief in moar is better. Via Gallup: The U.S. Payroll to Population employment rate (P2P), as measured by Gallup, worsened in May, dropping to 43.9%, from 44.5% in April. P2P is also down from May 2012, when it was 44.4% The decline in P2P versus 2012 indicates that fewer people worked full-time for an employer this May compared with a year ago.
U.S. Employers Add 175,000 jobs, Unemployment Rate up to 7.6%. - U.S. employers added 175,000 jobs in May, steady hiring but below the more robust pace that took place during the fall and winter. The Labor Department says the unemployment rate rose to 7.6 percent from 7.5 percent in April. The increase occurred because more people began looking for work, a good sign. The government said the economy added 12,000 fewer jobs in April and March. Employers have added an average of 155,000 jobs in past three months, below the average of 237,000 created from November through February. The modest gains likely mean the Federal Reserve will continue its bond purchases. The Fed has said it will maintain its pace of bond purchases until the job market improves substantially. The purchases have helped drive down interest rates and boost stock prices.
U.S. Added 175,000 Jobs in May - Jobless Rate Rises to 7.6% - American employers added 175,000 jobs in May, almost exactly the average monthly job growth over the last year, the Labor Department reported Friday, while the unemployment rate ticked up to 7.6 percent from 7.5 percent in April. Economists were relieved that the numbers weren’t worse, given a string of other disappointing data in recent weeks, but noted that recent job trends are nowhere close to bringing the country back to full employment. At the current pace of job growth, it would take nearly five years to get the economy back to the low unemployment rate it enjoyed when the recession officially began in December 2007. On the bright side, the unemployment rate rose for a good reason: more people joined the labor force, perhaps indicating that Americans who have been sitting on the sidelines feel that they finally have a chance at finding a job. Still, the labor force participation rate remains low by historical standards. In a New York Times/CBS News poll conducted May 31 to June 4, nearly half of respondents – 46 percent — rated the job market in their area as very or fairly good, with a third saying that they think their local job markets will improve over the next year. The same poll found that 39 percent of respondents said that the condition of the economy was very or fairly good, the highest share saying this since President Obama took office and even since the recession began.
May Employment Report: 175,000 Jobs, 7.6% Unemployment Rate - From the BLS: Total nonfarm payroll employment increased by 175,000 in May, and the unemployment rate was essentially unchanged at 7.6 percent, the U.S. Bureau of Labor Statistics reported today. ... The change in total nonfarm payroll employment for March was revised from +138,000 to +142,000, and the change for April was revised from +165,000 to +149,000. With these revisions, employment gains in March and April combined were 12,000 less than previously reported. The headline number was slightly above expectations of 167,000 payroll jobs added. Employment for March and April combined was revised slightly lower. This graph is ex-Census meaning the impact of the decennial Census temporary hires and layoffs is removed to show the underlying payroll changes. The second graph shows the unemployment rate. The unemployment rate increased to 7.6% in May from 7.5% in April. The unemployment rate is from the household report and the household report showed a sharp increase in employment, and that meant a lower unemployment rate. The third graph shows the employment population ratio and the participation rate.The Labor Force Participation Rate was increased to 63.4% in May (blue line) from 63.3% in April. This is the percentage of the working age population in the labor force. The Employment-Population ratio was unchanged at 58.6% in May (black line). I'll post the 25 to 54 age group employment-population ratio graph later. The fourth graph shows the job losses from the start of the employment recession, in percentage terms, compared to previous post WWII recessions.
175K New Jobs Added, But Unemployment Rate Ticks Up to 7.6% Here is the lead paragraph from the Employment Situation Summary released this morning by the Bureau of Labor Statistics, with the bracketed text added by me: Total nonfarm payroll employment increased by 175,000 in May, and the unemployment rate was essentially unchanged at 7.6 percent, the U.S. Bureau of Labor Statistics reported today [an increase from 7.5 percent last month]. Employment rose in professional and business services, food services and drinking places, and retail trade. Today's nonfarm number was higher than the briefing.com consensus, which was for 159K new nonfarm jobs, and the unemployment rate is higher than the forecast that it would remain unchanged at 7.5 percent. The nonfarm jobs number for the previous month was revised downward to from 165K to 149K. The slight uptick in the the unemployment rate was slight indeed. Two two decimal places it rose from 7.51% to 7.56%, and that rise can be attributed to a 0.12% increase in the labor force participation rate (driven by a 420K increase labor force participants). The unemployment peak for the current cycle was 10.0% in October 2009. The chart here shows the pattern of unemployment, recessions and both the nominal and real (inflation-adjusted) price of the S&P Composite since 1948.
Jobs +175,000; Unemployment Rate 7.6%; Is the Obamacare Effect Played Out? - The establishment survey showed a gain of 175,000 a reasonably good but not spectacular print. The bright spot was involuntary part-time employment only rose by 26,000 so most of the jobs were (for a change) full-time jobs. The civilian labor force rose by 420,000 for a change, enough to raise the unemployment rate 0.1 percentage points to 7.6%. The Participation Rate rose 0.1 to 63.4%, just off the low of 63.3% dating back to 1979. Given there was not a huge jump in part-time employment this month, the bulk of the Obamacare effect of employers reducing hours from 32 to 25 (and hiring hundreds of thousands of new employees to make up the hours) may have mostly played out. May BLS Jobs Statistics at a Glance:
- Payrolls +175,000 - Establishment Survey
- US Employment +319,000 - Household Survey
- US Unemployment +101,000 - Household Survey
- Involuntary Part-Time Work +26,000 - Household Survey
- Voluntary Part-Time Work -12,000 - Household Survey
- Baseline Unemployment Rate +0.1 - Household Survey
- U-6 unemployment -0.1 to 13.8% - Household Survey
- The Civilian Labor Force +420,000 - Household Survey
- Not in Labor Force -231,000 - Household Survey
- Participation Rate +0.1 at 63.4 - Household Survey
The May Jobs Report: Steady, But Nothing To Write Home About - Going into May’s jobs report, there were a wide variety of expectations regarding where the economy as a whole actually was, and what that meant for the jobs market. Several economic indicators seemed to suggest that we may have faced a slowdown in May, and the fact that May was also the second full month that the Federal Budget sequester was in effect led many to expect that we’d start seeing a slowdown in hiring in May. Wednesday’s released of the ADP jobs report, which sometimes correlates with the Labor Department’s numbers and sometimes doesn’t, suggested that the labor market was healthier in May than many analysts fear. As it turns out, the BLS report that was released today showed that the jobs market remains steady and healthy, but still nowhere near where it ought to be: Total nonfarm payroll employment increased by 175,000 in May, and the unemployment rate was essentially unchanged at 7.6 percent, the U.S. Bureau of Labor Statistics reported today. Employment rose in professional and business services, food services and drinking places, and retail trade. Both the number of unemployed persons, at 11.8 million, and the unemployment rate, at 7.6 percent, were essentially unchanged in May. (See table A-1.)Among the major worker groups, the unemployment rates for adult men (7.2 percent), adult women (6.5 percent), teenagers (24.5 percent), whites (6.7 percent), blacks (13.5 percent), and Hispanics (9.1 percent) showed little or no change in May. The jobless rate for Asians was 4.3 percent (not seasonally adjusted), little changed from a year earlier. (See tables A-1, A-2, and A-3.) The civilian labor force rose by 420,000 to 155.7 million in May; however, the labor force participation rate was little changed at 63.4 percent. Over the year, the labor force participation rate has declined by 0.4 percentage point. The employment-population ratio was unchanged in May at 58.6 percent and has shown little movement, on net, over the past year. (See table A-1.)
May employment: a mixed report that isn't nearly good enough - May's employment report can best be described as a tepidly good report, that mainly took back losses we saw in several categories last month. You probably already know the headlines, +175,000 jobs added, and the unemployment rate ticked up .1 to 7.6%. Government subtracted -3000 from the 178,000 private jobs number. The broader U6 unemployment rate ticked down -.1 to 13.8% (putting us back at March's level). As always for me, after the headline the next thing I want to do is look at the more leading numbers in the report which tell us about where the economy is likely to be a few months from now. This was generally good, but mainly in that April's bad numbers were reversed, putting us back a March levels:
- temporary jobs - a leading indicator for jobs overall - increased by 25,600.
- manufacturing jobs declined -8,000. This is the third month in a row of manufacturing job losses, and is a red flag
- the number of people unemployed for 5 weeks or less - a better leading indicator than initial jobless claims - rose 232,000. This places it back in the caution zone nearly 300,000 off its lows.
- the average manufacturing workweek rose +0.1 hour from 40.8 hours to 40.7 hours. This is one of the 10 components of the LEI and will affect that number positively.
- construction jobs gained 7000.
Unemployment Rate a Static 7.6% for May 2013 - The BLS employment report shows the official unemployment rate ticked up 0.1 percentage point to 7.6% and the current population survey unemployment figures are a static pool of going nowhere fast statistics. More people were employed, yet the number of people stuck in part-time jobs barely budged from last month and the number of unemployed also increased. The labor participation rate increased 0.1 percentage points from the May 1979 record low. U-6, a broader measure of unemployment, ticked down -0.1 percentage point to 13.8%. Overall the CPS statistics look like an oscillating wave of stuck in neutral. This article overviews and graphs the statistics from the Current Population Survey of the employment report. The labor participation rate is 63.4%, mentioned above. The labor participation rate is at artificial lows, where people needing a job are not being counted. The labor participation rate only increased a 10th of a percentage point which means that those who dropped out of the labor force are mostly staying out of the labor force. For those claiming the low labor participation rate is just people retired, we proved that false by analyzing labor participation rates by age. The number of employed people now numbers 143,898,000, a 319,000 monthly increase. We describe here why you shouldn't use the CPS figures on a month to month basis to determine actual job growth. These are people employed, not actual jobs. In terms of labor flows, the employed has increased 576,000 since January 2013. From a year ago the employed have risen 1.596 million, but bear in mind the noninstitutional population has also increased by 2.397 million during the same time period. The statistics from the CPS do generally vary widely from month to month. Below is a graph of the Current Population Survey employed.
175K May Non-Farm Payrolls Small Beat, April Revised Down; Unemployment Rate Of 7.6% Higher Than Expected - Those hoping for a decisive jump or plunge in the NFP number will be disappointed with the May NFP printing at 175K, on expectations of 165K, even as the April number was revised from 165K to 149K, and a net March-April revised change of -12K. The Unemployment rate was 7.6% higher than the expected 7.5%, driven by a tiny increase in the Labor Force Participation rate from 63.3% to 63.4%. The number of unemployed workers increased from 11659K to 11760K, the highest since February. Ironically, the U-6 unemployment rate for May declined from 13.9% to 13.8%, matching the lowest number of 2013. But once again it is the quality component of the jobs that was weak with Average Hourly Earnings missing expectations of a 0.2% increase (up from 0.2% last month), instead staying flat to the April number. The manufacturing renaissance continues to be delayed courtesy of a -8,000 drop in Mfg jobs in May. Finally birth-death added 205K jobs to the unadjusted number.
US Labor Market Shows Moderate Gains in May -- The US labor market continued its gradual improvement in May. The economy added 175,000 new payroll jobs, somewhat more than in March and April, as shown in the following chart. Payroll job growth was strongest in service sectors, with retail trade, professional and business services, and leisure and hospitality all showing strong growth. Construction added 7,000 jobs but those were offset by a decrease in manufacturing jobs, so that there was no net job growth in the goods-producing sectors. The addition of 13,000 local government jobs helped to offset continued job cuts at the federal and state levels. The household survey, which includes self-employed persons and farm workers, showed an increase of 319,000 jobs. Some 420,000 new workers entered or re-entered the labor force, bringing the employment-population ratio up slightly. Since the labor force increased by more than the number of employed workers, the number of unemployed also increased. The unemployment rate, which is the ratio of unemployed workers to the labor force, rose fractionally from 7.513 percent to 7.553 percent. That will be enough for news headlines, which usually show the unemployment rate rounded to the nearest tenth of a percent, to report an increase from 7.5 to 7.6 percent. The BLS also provides a broader measure of labor-market stress, U-6, which includes involuntary part-time workers and discouraged workers as well as the officially unemployed. As the next chart shows, a decrease in the number of discouraged workers and involuntary part-time workers brought that indicator down to 13.8 percent of the labor force, equal to its lowest point for the expansion.
Same Old, Same Old: Modest Growth For The Labor Market - If May is a tipping point that leads to nasty things for the business cycle, it’s not obvious in today’s payrolls report from the Labor Department. Although quite a lot of ink has been spilled in recent weeks about weak numbers from certain sectors in the economy, it appears to be business as usual with jobs creation. Slow growth, in short, continues to persist. The private sector added a net 178,000 new jobs last month, or roughly in line with expectations. That’s still modest by historical standards, but at least it’s a slight improvement over the past two reports. The headline number that everyone focuses on, which includes government jobs, was only a touch lower, with total payrolls rising by 175,000. Although analysts move heaven and earth for analyzing payrolls, the plain truth is that the broad trend has remained essentially unchanged through last month. Private payrolls advanced by 1.95% in the year through May, which is more or less what we’ve seen for months. The pace of late has been modestly slower compared with the first half of 2012, but you’d be hard pressed to make the case that rate of increase is deteriorating in any meaningful way.
Jobs Day: First Impressions–High Stakes Musical Chairs - Payrolls were up 175,000 last month as the unemployment rate ticked up to 7.6%, according to this morning’s employment report from the Bureau of Labor Statistics. The payroll number was slightly ahead of expectations (analysts were expecting about 165,000), and the tick-up in unemployment appears to be due to people entering the job market looking for work. The entry of over 400,000 into the labor market led the closely watched labor force participation rate to tick up slightly as well, from 63.3% to 63.4%. I expect the historically low LFPR to start rising as most working-age people can only sit out the slowly improving job market for so long. This will, however, put upward pressure on the jobless rate as more job seekers compete for slots. What we have here is a high stakes game of musical chairs, as payrolls grow at a steady, if not-that-impressive, clip, essentially adding chairs to the game. Meanwhile, more players are coming off the sidelines looking for places to sit. Last month, there were more new players than seats. In future months, we’ll keep a close eye on how that balances out. The music, of course, is employer demand and while it hasn’t been the blues of late—employers are adding consistently adding jobs, averaging 194,000 per month over the past six months—neither has it been particularly up-tempo. The Federal Reserve continues to try turn up the volume, as Ben and Janet take extended solos on unconventional instruments. But Congress is pushing back the other way, allowing fiscal headwinds like the sequester to slow the rate at which chairs are added to the circle.
The Jobs Report Covering May 2013: About As Good As It Is Going To Get And Still Too Insufficient By Far - May is usually a strong month for job creation. So while seasonally adjusted job creation is reported at 175,000, it actually increased by 885,000. This puts the January-June job creation period in line with and slightly better than the last 3 years. The problem is that this is still a very slow growth rate insufficient to deal with the enormous ongoing shortfall in jobs. And the quality of jobs being created remains crap. May is also traditionally a good month for employment. Again because of the different surveys, jobs do not equal employment. Actual employment grew by 708,000. However, unemployment also grew by 288,000. This combination reflects an influx of job seekers from those defined as outside the labor force. The official unemployment rate inched up to 7.6%, but it has little relation to reality. In terms of the trend, real unemployment is at 12.5% and real disemployment now is at 17.3%, only slightly improved from a year ago. In May, the potential labor force as defined by the Civilian Non-Institutional Population over 16 (NIP) increased 188,000 from 245.175 million to 245.363 million. Multiplying this by the seasonally adjusted employment ratio for May (58.6%) gives a rough estimate of the number of jobs needed to keep up with population growth: .586(180,000) = 110,000.Seasonally adjusted (trend line), the labor force increased 420,000 from 155.238 million to 155.658 million. Unadjusted (actual), the labor force grew 995,000 from 154.739 million to 155.734 million.The labor force participation rate (the ratio of the current labor force to the potential labor force) increased one-tenth of a percent seasonally adjusted to 63.4% while unadjusted it increased 0.4% to 63.5%. Since 2008, the participation rate has been in overall decline.Seasonally adjusted, employment rose 319,000 from 143.579 million to 143.898 million. Unadjusted (actual), employment grew 708,000 from 143.724 million to 144.432 million. Unadjusted, we expect to see seasonal employment increase January-June. So far this year, employment has increased 2.818 million as compared to 2.783 million last year, a difference of only 35,000 or essentially the same.
Good News! The Unemployment Rate Rose - The U.S. unemployment rate rose to 7.6% in May, but behind the increase was some good news evidenced by a fall in a broader measure of unemployment to 13.8% from 13.9% a month earlier. The increase in the main unemployment rate was driven by positive factors. Sometimes the unemployment rate declines because more Americans are no longer looking for work. This month the rate increased because the opposite trend was occurring. For the second month in a row, the labor force increased, as more people were seeking jobs. That could be a sign of confidence in the state of the labor market. The unemployment rate is calculated based on the number of unemployed — people who are without jobs, who are available to work and who have actively sought work in the prior four weeks. The “actively looking for work” definition is fairly broad, including people who contacted an employer, employment agency, job center or friends; sent out resumes or filled out applications; or answered or placed ads, among other things. The unemployment rate is calculated by dividing the number of unemployed by the total number of people in the labor force. Underlying the increase in the jobless rate were more positive numbers. The number of people who say they have a job increased by 319,000. Meanwhile, even though there were 101,000 more people unemployed, the total work force rose by a much larger 420,000. That offers another signal that discouraged workers may be returning to the labor force.
Data Analysis: Highlights from the May Jobs Report -Here are some highlights from the Labor Department’s snapshot of the U.S. labor market in May.
- FED WATCH: The May payroll gain of 175,000 jobs likely keeps the Federal Reserve on its current path as it contemplates pulling back on its stimulus program at a policy meeting later this year. The gain was an improvement from April, which was revised downward slightly Friday, suggesting that the economy is not losing steam. But the increase nearly matches the avearage monthly gain over the past year. That shows the labor market is not gaining tremendous momentum. Last month’s improvement was concentrated in the service sector, and the Fed is looking for gains across more of the economy.
- JOBLESS RATE: The unemployment rate increased slightly to 7.6% in May. The figure is down from 8.2% a year ago, but well above the 6.5% threshold the Fed has set to raise its benchmark interest rate.
- BIG GAIN: The largest improvement came in the business and professional services category, which added 57,000 jobs last month. That category has added more than 50,000 jobs for four consecutive months.
- BIG LOSS: Manufacturing jobs declined by 8,000 last month, the third straight month of decreases.
The 'Manufacturing Renaissance' Has Stopped Creating New Jobs - Manufacturing output continues to rise. But the jobs are still missing. Today's non-farm payroll report from the BLS shows the U.S. manufacturing sector lost 8,000 jobs in May, the fourth-straight monthly decline. Here's the chart from BLS since 2010, which shows we've now plateaued for about a year at the 12-million payroll level:
Manufacturing Still Looks O.K. - Manufacturing jobs fell in May for the third-consecutive month, the Labor Department reports. But the numbers are small — 8,000 in May and a total of 21,000 for the three months. Such small changes — there are nearly 12 million manufacturing jobs in the economy — are well within the margin of error of the survey. The growth in manufacturing since the bottom of the cycle may be stalling, but it has not reversed. On an annual basis, the Labor Department says that there are 41,000 more manufacturing jobs than there were a year ago. May is the 32nd consecutive month in which manufacturing employment was up on a year-over-year basis. The last time there was a streak that long, Jimmy Carter was the president, and it lasted for 46 months, through November 1979. Another cautiously positive sign on employment is that the Institute for Supply Management survey of manufacturers continues to indicate that more companies are increasing employment than are reducing it. The May I.S.M. numbers provided a jolt last week because the overall index came in at 49, indicating that a plurality of companies said business dipped in May. But that same survey showed employment rising — as it has done for 44 consecutive months, ever since October 2009. The Labor Department figures hit bottom a few months later. The I.S.M. survey, which goes back to 1948, has never shown employment expanding for so many consecutive months. The longest string before now was 36 months, ending in December 1966.
Austerity hampered job growth - The U.S. economy added a respectable 175,000 jobs in May, slightly above the average of 172,000 per month over the past year. This good news overall was driven by private-sector employment gains, as federal and state governments continued to work against recovery by shedding workers. Sharp cuts in government spending implemented March 1 as part of the sequester are slowing the recovery. The federal government shed another 14,000 workers in May, for a total of 45,000 jobs cut over the past three months. The federal work force now is smaller than at any time since February 2008. Economists estimate that the combined effect of the payroll tax increase (800,000 fewer jobs in 2013) and sequestration (750,000 fewer jobs from March–December 2013) means that the U.S. economy will create 142,000 fewer jobs each month for the rest of this year compared to what it would have created without the cuts and tax increase. Most of these jobs will be lost in the second and third quarters of 2013. In some ways, the economy looks better: The Dow Jones Industrial average is up by 2,580 points (21%) over the past year (as of yesterday), home prices are up in all 20 cities tracked by the Case-Shiller home price index, and the economy has added jobs every month for the past 32 months. But this growth has not been sufficient to pull down the still-historically high number of unemployed Americans. As a result, the share of Americans with a job remains lower than during the early 2000s, early 1990s, and early 1980s recessions. As of May 2013, there are almost 12 million people who would have jobs today if our current employment rate matched its peak from December 2006 — 58.6% — before the start of the Great Recession.
Government Continues to Eliminate Jobs - Federal government jobs are declining at an increasing pace, the latest evidence that across-the-board spending cuts are a drag on the labor market. National government jobs have now shrunk for eight consecutive months. The loss after the sequester was put in place in March is the largest three-month decline since temporary Census worker departed in 2010. In May, the federal payroll shrank by 14,000, including 9,400 non-postal workers. The U.S. Postal Service is cutting back, but it isn’t subject to the sequester. The non-postal work force has declined by average of 8,200 per month since March, compared with an average monthly decrease of about 2,000 last year. The decline is likely to continue as more government workers leave their jobs and aren’t replaced. “The ripple effect of the sequester is going to extend throughout the summer,” “It’s clear that any near-term improvement in the labor market sits squarely on the shoulders of the private sector.” However, there was one bright spot for the public payrolls. Municipalities added 13,000 workers in May, the fourth gain in five months.
The Sequester Starts to Show - The monthly jobs report is starting to show the effects of the $85 billion in across-the-board budget cuts that the government needs to carry out before the end of the fiscal year in September. That’s not much in a $16 trillion economy, of course. But economists still expect it to slow growth and reduce employment in the coming months and years. And it is. Federal employment had been on a downward trend since the start of 2011, with the government shedding about 3,000 or 4,000 positions a month through February. Then sequestration hit on March 1. And in the last three months, the federal work force has shrunk by about 45,000 positions, including 14,000 in May alone. In part, that is because federal offices have gone on hiring freezes and taken other steps to wrench down their spending. Tens of thousands of federal workers are also seeing their hours cut through mandatory furloughs and bans on overtime. But that data is not really showing up in the jobs report, which includes data on hours for private sector employees, but not public sector ones. Still, expect those furloughs to take a significant bite out of income and consumer spending. Come July, for instance, the Pentagon is going to start to furlough 680,000 civilian workers – out of about 800,000 total – for up to 11 days each. State and local governments have finally stopped shedding workers, offsetting some of the impact from the federal government. For each of the last three months, local governments have added employees, if only a handful of them. State governments seem to have stopped shrinking their payrolls too.
Much Ado About … Well, Maybe Not Much - The monthly jobs report is widely viewed as the most important economic statistic, and lots of people — myself included — rush out instant analysis. We should remember that the numbers we jump all over are likely to turn out to have been very different from the final figures. The first report of March numbers showed a gain of just 88,000 jobs. There was concern. Then the first report for April showed a gain of 165,000. The economy rallied, we concluded. The current estimates for those months are gains of 142,000 in March and 149,000 in April. The figures are virtually identical. The employment situation is important. But what you see today about May employment may turn out to be nowhere near the final number.
Real Hourly Wages and Hours Worked: Signs of Encouragement - Here is a look at two key numbers in the June monthly employment report for May Average Hourly Earnings and Average Weekly Hours. The government has been tracking the data for Production and Nonsupervisory Employees for decades. But coverage of Total Private Employees only dates from March 2006. Let's look at the broader series, which goes back far enough to show the trend since before the Great Recession. I want to look closely at a five-snapshot sequence. First, here is a chart of the Average Hourly Earnings. I've included a linear regression through the data to highlight the trend. Hourly earnings increased at a faster pace through 2008, but the pace slowed from early 2009 onward.But the hourly earnings above are nominal (not adjusted for inflation). Let's look at the same data adjusted for inflation using the Consumer Price Index. Since the government series above is seasonally adjusted, I've used the seasonally adjusted CPI, and I've chained the series to the dollar value of the latest month of hourly wages so that the numbers reflect the purchasing power in today's dollars. As we see, the difference is amazing. The decline in real wages at the onset of the recession accords with our expectations. But why the rise in the middle of the recession when the Financial Crisis began unfolding in earnest? Let's add another data series to the mix: Average Hours per Week. About eight months into the recession, hours per week began to fall. The number bottomed a few months before the recession ended and then began increasing a few months after it ended.For a better understanding of the relationship between hourly earnings and the average work week, let's overlay the two. We see a striking inverse correlation during the Financial Crisis. And by the Fall of 2010, the two began to reverse their directions.
Where The (Low-Paying) Jobs Were Are - The time has come to look at the quality component of the 175K jobs added in May, so without further ado, let's drill down at where the growth was. Without much surprise, we find that as in months past, the bulk of the growth continues to be concentrated in the lowest wage jobs: Leisure and Hospitality added the most jobs in May, 43K; Retail Trade jobs rose by 28K; Education and health added another 26K; Temp jobs: the lowest of all paying jobs added another 26K. In summary - of the 175K jobs, 122K was to low wage occupations.
Number Of Older Workers (55 And Over) Rises To New Record High - In the latest installment of another long-running series, we look at the age bracket distribution of those who are lucky enough to get new jobs each month, versus those who aren't. It should come as no surprise that once more the majority of new jobs created in the month of May went to the oldest age-group cohort, those 55 and older, which saw an increase of 203,000 jobs in May, more than every other age group bracket. The result: with an all time high 31,488,000 workers aged 55-69, Americans are far more busy working in their older years than retiring (or gambling in the rigger stock market casino).
Real Unemployment Rate: 11.3% - There are job numbers, and then there are job numbers which make sense in the context of a US population that keeps rising. By now the trick of lowering the unemployment rate courtesy of a "collapsing" labor force participation rate is known by all. As we showed earlier, the LFP, despite posting a tiny 0.1% uptick in May, was still at 30 year lows. Another way of seeing the above is the following chart which shows the annual change in the total civilian non-institutional population side by side with the change in the labor force. That plunge since 2009? That must be all demographics, and nothing to do with the collapse in the economy... This is just as stark when compared to the overall US population which rose by 188K jobs, meaning that the employment to population rate was flat at 58.6%, and has now been largely unchanged for the past five years. What is laughable is that for all talk of demographic issues, the big drop started with the Great Financial Crisis, and has barely bottomed. This is even more laughable when one considers that it is the older workers, or those who supposedly should be retiring if one buys the propaganda narrative, who have seen the bulk of job gains in the past 5 years.
Counterparties: America’s consistently dissatisfying jobs market - The Labor Department announced today that the US economy added 175,000 thousand jobs in May. (Unemployment ticked up a notch to 7.6%.) Matthew O’Brien writes that this is basically the same thing that’s been happening for the past two and a half years. “There were 175,000 new jobs a month in 2011, 183,000 in 2012, and 189,000 so far in 2013.” Kevin Roose thinks “there’s something to be said for this kind of quiet, steady progress”.For all its consistency, the labor market has been subpar. The percentage of Americans participating in the workforce has fallen steadily over the last four years. The government continues to cut jobs, putting increasing importance on private sector job growth. (Annie Lowrey has the details of how government cuts are becoming much deeper thanks to sequestration.) The scariest US jobs chart is still terrifying.At the current rate of job creation, employment, on an absolute level, won’t reach pre-crisis levels until late 2014, a full 8 years since the recession began. The Chicago Fed estimates that the economy needs to create 80,000 jobs per month to have a chance at making a dent in unemployment. Multiples of that may actually be needed to bring down unemployment, as more Americans return to the workforce. The Chicago Fed also projects that a return to full employment (where the unemployed are workers between jobs but still in the workforce) could take another five years, a timetable that, Matthew Klein writes, “puts the US on track for a lost decade”. Wall Street is rooting for things to get ever so slightly worse, hoping to stave off any decrease in the Fed’s bond buying programs. Fed-whisperer Jon Hilsenrath reports that if the economy continues to grow at its current pace, the Fed will slow bond purchasing later this year. Ryan Avent concludes that the Fed is perfectly happy for the US outlook to be consistently gloomy with rays of hope: 178,000 jobs per month seems to be the Fed’s good-enough-rate… It is hard to see the logic in that; there are few things more damaging to an economy than a prolonged period of high unemployment. But there is no sign that policymakers are interested in any other path.
I see the future - On May 1st, I wrote a blog post pointing out that at a rate of 175,000 jobs per month we won’t get back to the December 2007 unemployment rate until 2020. Apparently, I was looking into a depressing but very accurate crystal ball, since 175,000 jobs is exactly how many jobs we ended up getting in May. It’s still true that at 175,000 jobs per month, we won’t close the jobs gap before the end of this decade. To close the jobs gap by 2016, the year of the next presidential election, we have to add more than 300,000 jobs every month.
Employment Report Comments and more Graphs - Total nonfarm employment is up 2.115 million over the 12 months, and up 946 thousand so far in 2013 (a 2.27 million annual pace). Private employment is up 2.173 million over the last year, and up 972 thousand so far in 2013 (a 2.33 million annual pace).Of course public payrolls are continuing to shrink (four years of declining public payrolls now). Public employment is down 58 thousand over the last year, and down 26 thousand so far in 2013 (a 62 thousand annual pace). Construction employment is up 189 thousand over the last year, and up 93 thousand so far in 2013 (a 223 thousand annual pace). A few more graphs ...Since the participation rate declined recently due to cyclical (recession) and demographic (aging population) reasons, an important graph is the employment-population ratio for the key working age group: 25 to 54 years old. In the earlier period the employment-population ratio for this group was trending up as women joined the labor force. The ratio has been mostly moving sideways since the early '90s, with ups and downs related to the business cycle. This ratio should probably move close to 80% as the economy recovers. The ratio increased to 76.0% in May, the highest since April 2009. The participation rate for this group also increased in May to 81.3%. This graph shows the job losses from the start of the employment recession, in percentage terms - this time aligned at maximum job losses. In May, the number of persons employed part time for economic reasons (sometimes referred to as involuntary part-time workers) was unchanged at 7.9 million. These individuals were working part time because their hours had been cut back or because they were unable to find a full-time job. The number of part time workers decreased slightly in May to 7.904 million. These workers are included in the alternate measure of labor underutilization (U-6) that decreased slightly to 13.8% in May. This matches the lowest level for U-6 since December 2008. Unemployed over 26 Weeks This graph shows the number of workers unemployed for 27 weeks or more. According to the BLS, there are 4.357 million workers who have been unemployed for more than 26 weeks and still want a job. This was slightly from from 4.353 million in April. This is trending down, but is still very high. Long term unemployment remains one of the key labor problems in the US.
Bulk of U.S. Payroll Gain in Jobs Paying Less-Than-Average Wages - Occupations paying below-average wages accounted for more than half of last month’s U.S. payroll increase, a dynamic that may restrain consumer spending and the economic recovery. Retailers, the hospitality industry and temporary-help agencies accounted for 96,300, or 55 percent, of 175,000 jobs added in May, figures from the Labor Department showed today in Washington.“It’s not just jobs, it’s the kinds of jobs we’re creating,” said Diane Swonk, chief economist at Chicago-based Mesirow Financial Inc. “We need to see more broad-based and even growth in the economy to see better jobs return. We’re still relying too much on the part-time and contingent workforce.” The composition of the employment gain caused hourly earnings for all employees to stagnate at $23.89 on average last month, up a cent from April. They rose 2 percent over the past 12 months, compared with year-to-year increases averaging 3.5 percent in the 10 months leading up to the recession that began in December 2007.
Long-Term Jobless: Still a Bleak Picture - Long-term unemployment remains a very dark shadow in the May jobs report: 4.4 million workers have been out of a job for more than six months. In essence, the job market has normalized for the short-term unemployed. But the longer you have been out of a job, the bleaker the picture gets. The number of people who report being out of work for less than five weeks has returned to almost the same level as in 2007. But the number of people unemployed 5 to 14 weeks is about 25 percent higher. For those out of a job 15 to 26 weeks, it is 78 percent higher. And the number of long-term jobless, those unemployed for more than 27 weeks, is a whopping 257 percent higher. The long-term unemployed are struggling mightily to get rehired, as confirmed by recent research by Rand Ghayad and William Dickens of the Federal Reserve Bank of Boston. Some economists have theorized that the unusually long spells of unemployment we have seen in the wake of the recession are caused by a “mismatch”: The long-term jobless were in obsolete professions, with obsolete skills, and that is why they are not getting new gigs. But Mr. Ghayad and Mr. Dickens argue that is not the case. The long-term jobless seem to be having trouble finding work across industries, for instance. Discrimination does seem to be a major factor, though: Employers simply do not want to hire the long-term jobless, as my colleague Catherine Rampell has reported and further research by Mr. Ghayad has shown.
Employment in U.S. Lags Where It Was in 2007 - NYT - The American economy may be the world’s biggest, but when it comes to job creation since the recession hit at the end of 2007, it is far from a leader. Indeed, contrary to the widespread view that the United States is an island of relative prosperity in a global sea of economic torpor, employment in several other nations has bounced back more quickly, according to a new analysis by the Bureau of Labor Statistics. The government reported Friday that the nation added 175,000 jobs in May, continuing a 32-month run of job gains. The unemployment rate moved up slightly to 7.6 percent, from 7.5 percent in April. But overall employment in the United States remained 2.1 percent below where it was at the end of 2007, according to the statistics bureau. By comparison, over the same period, between December 2007 and March 2013, the number of jobs was up 8.1 percent in Australia; Germany, the biggest economy in the troubled euro zone, has managed a 5.8 percent gain in employment.
Unemployment Around the World - As the economist Justin Wolfers pointed out on Twitter this morning, the United States is trailing many other advanced economies when it comes to reducing unemployment levels. Today’s numbers won’t change that story. It continues a long-term trend in which, although the United States economy is performing relatively well when measured by economic output, it is struggling to translate that growth into new jobs.
The Hiring Forecasts of Small Firms - Atlanta Fed's macroblog - The U.S. Bureau of Labor Statistics (BLS) announced today that the U.S. labor market added 175,000 payroll jobs in May, continuing a trend of steady but disappointingly slow employment growth. The employment recovery has been even slower among small firms. Will it pick up in the coming 12 months? Results from the Atlanta Fed's latest survey of small businesses in the Southeast suggest that employment growth among small firms will continue but not necessarily at a faster pace. Since the recession began, changes in employment have been asymmetric across firm size. In contrast to large firms, employment at small and medium sized businesses began decreasing earlier, declined more, and, by last March, was a little further from its prerecession level. As of the first quarter of 2012, employment at firms with fewer than 500 employees was 5 percent below prerecession levels, compared to just 2 percent for firms with more than 500 employees. So why is employment at small firms not recovering as quickly as employment at large firms? While the Business Employment Dynamics data series from the BLS only go through first-quarter 2012 (chart 1), we can use our semi-annual survey of small business in the Southeast to find out a little more about the experiences of small firms through first-quarter 2013 as well look at their forecasts through the first quarter of 2014.
The Hidden Jobless Disaster - The market tanked Wednesday on bad preliminary job news. Even the Federal Reserve focuses on the unemployment rate, announcing on a number of occasions that a rate of 6.5% will indicate when it is time to start raising interest rates and winding down the Fed's easy-money policies. Yet the unemployment rate is not the best guide to the strength of the labor market, particularly during this recession and recovery. Instead, the Fed and the rest of us should be watching the employment rate. There are two reasons. First, the better measure of a strong labor market is the proportion of the population that is working, not the proportion that isn't. In 2006, 63.4% of the working-age population was employed. That percentage declined to a low of 58.2% in July 2011 and now stands at 58.6%. By this measure, the labor market's health has barely changed over the past three years. Second, the headline unemployment rate, what the Bureau of Labor Statistics calls "U3," uses as its numerator the number of individuals who are actively seeking work but do not have jobs. There is another highly relevant measure that captures what is going on in the economy. "U6" counts those marginally attached to the workforce—including the unemployed who dropped out of the labor market and are not actively seeking work because they are discouraged, as well as those working part time because they cannot find full-time work.
How Many Jobs Does It Take to Bring Down Unemployment? - The recent pace of U.S. job growth tends to be described as “tepid,” “lackluster” or “disappointing.” But according to two economists from the Federal Reserve Bank of Chicago, it’s plenty good enough to bring down the unemployment rate.In a new paper , Chicago Fed economists Dan Aaronson and Scott Brave try to estimate how many jobs the economy needs to add each month to keep the unemployment rate steady, after taking into account population growth and other factors.Their answer: 80,000 jobs. That’s far below the 150,000 to 200,000 jobs required in the 1980s and 1990s, and significantly below the 100,000 to 150,000 figure often cited by economists today. Messrs. Aaronson and Brave argue those higher figures fail to take into account underlying changes to the U.S. labor force, notably slowing population growth and a long-term decline in the share of the population that’s working.What’s behind the shrinking labor force is subject to much debate, but the Chicago economists expect the decline to continue. They estimate that by 2016, it will take just 35,000 new jobs per month to keep the unemployment rate steady. That’s based on some admittedly uncertain assumptions about immigration, labor-force participation and other trends; the authors estimate the true figure could be anywhere from zero to 120,000 jobs, with somewhere between 20,000 and 50,000 jobs per month as the most likely range.
Hourly Compensation Crashes Most Ever, Labor Costs Drops By Most In 4 Years, Manufacturing Compensation Plummets By 7% - So much for the thesis of declining labor slack and rising labor leverage. Moments ago the BLS reported its Q1 labor costs which poured cold water over all recent hypotheses that the US worker's plight is improving. It isn't: productivity increased by 0.5% in Q1 in ling with expectations of 0.6% (on what is not exactly clear - everyone on their iPhones?) but it was labor costs which plunged -4.3% on expectations of a +0.5% increase driven by a 3.8% collapse in hourly compensation that was the stunner. This was the biggest labor cost drop in four years and the biggest collapse in hourly compensation in well, ever and confirms our observations from the last NFP report that quantity gains in jobs continue to be offset by quality declines in actual worker pay. As a reminder we were scratching our heads following the soaring Q4 labor cost and declining productivity data which made no sense in the general context of deteriorating labor conditions. Following this print, it all falls back into place and confirms the Q4 data was nothing but an outlier. Also,this may be the end of the core thesis behind David Rosenberg's recently developed reflationary argument.
First Quarter Hourly Compensation Plunges 3.8%, Most on Record; Manufacturing Hourly Compensation Plunges 6.9%; What's Going On? - Inquiring minds are digging into the stunningly bad Quarter-Over-Quarter decline in wages and real wages across all sectors as noted in the Revised First Quarter BLS Productivity and Costs report. Year-Over-Year numbers are still positive but the revised quarterly numbers shown above are an unmitigated disaster.The BLS notes "Unit labor costs in nonfarm businesses fell 4.3 percent in the first quarter of 2013, the combined effect of a 3.8 percent decrease in hourly compensation and the 0.5 percent increase in productivity. The decline in hourly compensation is the largest in the series, which begins in 1947."It's quite easy to explain why this is happening, and it was all too predictable as well. Obamacare and inane Fed policies are in play as noted yesterday in Fed Policies and Obama Programs Exacerbate Credit Crunch to Small Businesses. The Fed believes that holding interest rates low fosters business growth, hiring, and bank lending?So why isn't that happening? .... by holding interest rates low, the Fed encourages not hiring, but rather corporate investment in software and hardware solutions that enable companies to get rid of workers.Why hire someone at increasing minimum wages, and increasing costs of medical care, when you can borrow money for next to nothing and invest in solutions that require fewer workers?
U.S. worker productivity increases as hourly compensation drops - American workers increased their productivity in the first quarter as hourly compensation fell. The Bureau of Labor Statistics reported a productivity increase of 0.5% at an annual rate during the first quarter of 2013. The increase reflects a 2.1% increase in output and a 1.6% increase in hours worked. Compared with the first quarter of 2012, productivity was up 0.9%. That compares with an average annual gain of 2.3% in the 11 years that ended in 2011, according to Bloomberg News. Meanwhile hourly compensation fell 3.8% in the first quarter. That decline was the largest in the series, kept since 1947. Patrick Newport, an economist with IHS Global Insight, said the drop in compensation was not worrisome but the weak productivity was. “Hourly compensation jumped in the fourth quarter of 2012, in part because of bonuses granted earlier than planned (to avoid higher anticipated tax rates),” he wrote in an email analysis. “The first quarter drop was payback for the previous quarter’s windfall. “ A Los Angeles Times series earlier this year explored how employers are using technology that creates a harsher work environment. According to the series, employers now: “read emails and monitor keystrokes, measure which employees spend the most time on social networking websites and track their movements inside and outside the office. They can see who works fastest and who talks the most on the phone. They can monitor how much time people spend talking to coworkers — and how much time they spend in the bathroom.”
Weak Productivity Growth, the Secret to Job Growth - Dean Baker - Some of us (well at least me) are surprised that an economy growing at a rate of 2.0 percent or less can create around 1.8 million jobs a year. That doesn't seem to fit. We had been seeing productivity growth of close to 2.5 percent. At that rate the economy could grow 2.0 percent a year with no additional labor. So what is going on? Well, we aren't seeing productivity growth of 2.5 percent a year any more. In fact, in the last two years productivity growth has grown at less than a 1.0 percent annual rate. This is a sharp departure from the pattern in past upturns where we have seen strong productivity growth in the first years of the recovery. This is the secret to job growth in this recovery. The question is whether the slowdown in productivity growth is permanent or just a response to a weak economy. The latter story would be that workers are taking low paying and low productivity jobs because there is nothing else available. Remarkably, we have a whole group of policy types running around worried that we won't have any jobs because robots will displace everyone. This is occurring at a time where the data is showing the exact opposite with the recent stretch of slow productivity growth.
Fed’s Raskin Bemoans Quality of New Jobs - A trip to a job fair exposed another concern about the weak recovery to Federal Reserve governor Sarah Bloom Raskin — those who do find employment often must accept low paying positions. After finding mostly security, restaurant and life guard positions at a job fair held at community college near her home, Ms. Raskin said Tuesday that she investigated the type of jobs that have been gained since the economy emerged from recession. She found half of all those hired received low pay jobs, but two-thirds of the jobs lost in the recession were middle income jobs like factory and construction workers. Ms. Raskin said she is concerned about “the quality of jobs available,” while speaking on a panel at a conference on joblessness hosted by the Roosevelt Institute, a self-described progressive policy organization. “I didn’t think life guard was a job that required an advanced degree,” she said. The low quality of jobs added in the recovery explains why wages have mostly stagnated even while unemployment has declined in recent years. Ms. Raskin said the phenomenon suggests there is a disconnect between education and the skills employers need.
This Is the Way Blue-Collar America Ends - As the global headquarters of Rockwell Automation, the Allen-Bradley building provides office space for 3,100 employees who range from product development engineers to sales and marketing teams and corporate executives. They're in the manufacturing business, but it's not quite the same business that once made Milwaukee prosperous. Rockwell Automation sold over $6 billion worth of industrial control products last year, more than half of those outside the United States and over one-fifth to emerging markets. Some 61 percent of its 22,000 employees are based outside the U.S. While 58 percent of last year's sales were in manufactured devices, 42 percent were in computer hardware, software and communications components. Take a close look at Rockwell Automation, and you'll understand why the modern manufacturing industry manages to be both a tremendous economic driver and a tough business in which to get a job. It's becoming standard for many manufacturing companies to require employees to have college degrees--and some jobs require a PhD. Factory-floor openings are scarce and often require specific credentials. A company like Rockwell Automation creates wealth and jobs all over the world, which is great for the world--and for shareholders-- but not always so great for Milwaukee. The city's number one economic problem is a lack of middle-income jobs, and no industry has yet emerged to replace the jobs the traditional manufacturing sector used to provide.
Breadwinner Wives and Nervous Husbands - GIRLS are generally outperforming boys in high school, and then proceeding in greater numbers to attend and graduate from college. And as women take the helm as chief executives of more major corporations, including Hewlett-Packard, I.B.M. and PepsiCo, there are hints that the glass ceiling may be at least cracking, if not breaking. Such developments should encourage aspiring young women to believe that social norms are changing, and that barriers to success are dropping. But a new study reveals that women’s gains on the economic front may be contributing to a decline in the formation and stability of marriages. One reason for this decline may be that women with greater earning power have greater economic security that allows them to leave bad marriages. Yet another possibility is that many men seem to be clinging to a social norm from the “Mad Men” days: that the husband should be the primary earner in a family. There is an obvious disconnect here. Those men who spent their teenage years goofing off and their college years drinking beer shouldn’t be surprised that women who consistently received higher grades and continued further in school might now be earning more money as well. But the evidence suggests that while men tend to applaud their spouses when they help to bring home the bacon, husbands aren’t always as enthusiastic when women start bringing home the filet mignon. And it’s especially troubling that these old-fashioned social norms about gender identity appear to be adversely affecting family formation and stability.
Which States Have Biggest Gender Wage Gaps? - Women who want the best shot at equal earnings with men would do well to head to the nation’s capital and stay away from Wyoming. New analysis released Wednesday by the National Women’s Law Center found that the wage gap between men and women is narrowest in the District of Columbia and widest in Wyoming. The study, issued days before the 50-year anniversary of the Equal Pay Act, also found that the pay gap tends to shrink in states with minimum wages above the federally mandated $7.25 an hour — and widen in states with a $7.25 minimum wage. Past NWLC studies indicate that on average, women in the U.S. earn about 77 cents for every dollar a man does, creating a wage gap of 23 cents. The most recent research, based on 2011 data, found that in the District of Columbia, women earn 90.4 cents, narrowing the gap to just under 10 cents. In Wyoming, women earn 66.6 cents for each dollar a man does, bringing the wage gap to 33.4 cents.
A Legal Right to Paid Vacation? - From an American perspective, a legal right to paid vacation sounds like a peculiar and impractical hypothetical. For other high-income countries in the world, it's the law. Rebecca Ray, Milla Sanes, and John Schmitt lay out the facts in "No-Vacation Nation Revisited," written for the Center for Economic and Policy Research. The dark-blue columns show the statutory minimum number of paid vacation days. The light-blue lines show national paid holidays. The zero at the far-right-side for either one is the United States.Here is table showing the numbers behind the figure. Ray, Sanes, and Schmitt sum it up this way: "The United States is the only advanced economy in the world that does not guarantee its workers paid vacation. European countries establish legal rights to at least 20 days of paid vacation per year, with legal requirements of 25 and even 30 or more days in some countries. Australia and New Zealand both require employers to grant at least 20 vacation days per year; Canada and Japan mandate at least 10 paid days off. The gap between paid time off in the United States and the rest of the world is even larger if we include legally mandated paid holidays, where the United States offers none, but most of the rest of the world's rich countries offer at least six paid holidays per year."
How Did Work-Life Balance in the U.S. Get So Awful? - If we're so rich, why are we working so hard that we don't even have time to cherish the fruits of our productivity? There are some simple reasons why the U.S. places far below Scandinavia and other European countries among work-life metrics. We work longer hours to make all that money. So we have less down time. Also, we don't have national laws, like mandatory paternal leave, that alleviate the burden on working moms. The surprising fact is that American leisure time has actually been increasing for most families for decades, and American men work less today, and have more down time, than ever recorded. Even if you consider that to be bad news (and many do), less work should improve just about any definition of work-life balance. Still, the most important reason why we rank barely above Mexico is the increase in single mothers who, in the U.S., face an extraordinary burden relative to their overseas counterparts.
The High Cost Of Unemployment - The high unemployment that we have today in Europe, the United States, and elsewhere is a tragedy, not just because of the aggregate output loss that it entails, but also because of the personal and emotional cost to the unemployed of not being a part of working society. Austerity, according to some of its promoters, is supposed to improve morale. British Prime Minister David Cameron, an austerity advocate, says he believes that his program reduces “welfare dependency,” restores “rigor,” and encourages the “the doers, the creators, the life-affirmers.” Likewise, Rep. Paul Ryan says that his program is part of a plan to promote “creativity and entrepreneurial spirit.” But finding something satisfying to do with our time seems inevitably to entail doing some sort of work: “meaningful leisure” wears thin after a while. People seem to want to work more than three hours a day, even if it is assembly-line work. And the opportunity to work should be a basic freedom. Unemployment is a product of capitalism: People who are no longer needed are simply made redundant. On the traditional family farm, there was no unemployment. Austerity exposes the modern economy’s lack of interpersonal connectedness and the morale costs that this implies.
Unemployment, lack of education lead to higher US mortality rate - The report, Explaining the Widening Education Gap in Mortality Among U.S. White Women, found that the odds of dying at a given age are drastically higher for uneducated white women than they are for educated white women. In the period between 2002 and 2006, uneducated women had a 66 percent higher chance of death. This figure is a sharp increase from the period from 1997 to 2001 when the rate was 37 percent. In 2006, the official unemployment rate for women stood at 4.4 percent. Seven years later and five years after the financial crash, the official unemployment rate now stands at 6.7 percent. Real unemployment and underemployment are significantly higher. This divergence is even more severe for white women who do not have a high school diploma. Another recent report in the journal Health Affairs estimates that members of this group suffered a five year loss in life expectancy between 1990 and 2008. According to the study, joblessness has a significantly higher impact on mortality rates than other factors, even when controlling for obesity, alcohol consumption, poverty, and income. In fact, joblessness is as much an indicator of the difference in mortality rates as smoking cigarettes.
E-verify is supposed to stop undocumented employment. It could also harm legal workers.: Almost everyone expects mandatory electronic employment verification to be part of any immigration reform law that reaches President Obama’s desk. The idea is simple: Citizens and legal immigrants should be able to work, undocumented immigrants shouldn’t. The difficulty is separating one from the other. And the answer Congress has come up with is a system called E-Verify.But critics say the system could create headaches for hundreds of thousands of Americans who do have authorization to work in the United States. Under the current rules, if E-Verify says you’re not authorized to work, you have eight days to visit the appropriate government agency and begin an appeal. If you’re not able to go in time, or you can’t convince the agency that a mistake was made, your employer is supposed to fire you. But figuring out how many workers have been wrongly rejected by the system is tricky. A study using 2009 data found that 0.3 percent of applicants suffered initial rejections that were subsequently corrected, allowing the employee to work. But another 2.3 percent of workers got rejections that were never reversed.
How much should we be fearing “resets”? - It is a common observation that nominal wages are sticky but let’s not forget that real wages are often sticky too (and in fact nominal stickiness tends to matter much more when accompanied by real stickiness, but that is a point for another day.) That means many labor market changes will be slow to manifest themselves in the real world. Furthermore you often will see them first for new jobs, for the young, and for new labor market entrants (usually but not always the young). To cite one example, commentators are debating whether Obamacare will induce employers to “shed” insurance coverage, given that the workers can be picked up by the subsidized exchanges (and the fines, where applicable, are relatively low). Probably we won’t know the size of this effect until we have had a fairly full set of job “turnovers” in labor markets, as many employers will be reluctant to upset previous explicit or implicit deals. Circa 2013, I fear many of the pending reset deals in labor markets. Insiders are often treated quite well, but the next generation of outsiders may never reattain such privileged positions. The average doesn’t change very rapidly, because most of the employed still are insiders. Still, we can see that the reset may be a doozy. After all, labor’s share as a percentage of gdp has been falling in many of the advanced economies around the world.
Inequality update - Income inequality started widening about 1970, expanded quickly in the 1980s and 1990s (when colleagues and I wrote Inequality by Design), and grew much more slowly since.[1] Media and academic interest in the topic seems to have taken off about 25 years after the big jump. The number of stories in the New York Times that mentioned inequality rose from about 90 a year in the 1990s to 840 a year in the 2000s and to about 2,700 a year since the start of 2010. About 250 economics articles a year touched on inequality in the 1990s – much fewer than in sociology, by the way – 850 in the 2000s and over 3,500 per year in the 2010s.[2] Better late than never. What are some of things we are learning from this 30-fold increase in media attention and 14-fold growth in economic research? What follows is not a systematic overview – that would be a Herculean task and there are many books that attempt it – but an introduction to several studies that drifted across my (virtual) desktop recently. Some give us the long view, some a view of how the Great Recession accentuated inequality.
The Fed and Inequality - Is the Federal Reserve a driving force behind the post-recession growth in inequality? It’s a provocative idea, voiced by writers including Neil Irwin and Robert Frank. It is certainly true that inequality, in terms of both income and wealth, has widened since the recession. A study by the lauded economist Emmanuel Saez of the University of California, Berkeley, found that the top 1 percent of earners have accounted for all of the income gains in the first two full years of the recovery. Their incomes have climbed about 11.2 percent. The incomes of the 99 percent have declined by about 0.4 percent. Those patterns repeat when looking at measures of wealth, meaning the value of a family’s assets, like its house and savings account, minus the value of its debts, like mortgages and credit card balances. A recent report from the Pew Research Center found that the wealth of the richest 7 percent of households climbed about 28 percent from 2009 to 2011. For the remaining 93 percent, average wealth dropped about 4 percent.
Monetary policy and US inequality, again - Although they work for an institution that has neither the mandate nor the ideal weaponry to fight inequality, Fed officials have spent a lot of time thinking and talking about it lately. As they should. But not everyone will agree on the reasons why they should, or on the Fed’s appropriate response — the subjects of this post. Last week, Pew reported that the rebound in net worth has been unevenly distributed in the economic recovery: the wealth of the richest 7 per cent of households climbed by 28 per cent on average, while the rest of the population lost 4 per cent of its wealth.And the annual report from the St Louis Fed found that 62 per cent of the wealth recovery through the end of last year has been the result of rising stock markets — and stock ownership is concentrated among richer households. Economix has a very good summary, and we also recommend last year’s paper by Edward Wolff, in which you’ll find this chart (click to enlarge): “In 2010 the richest one percent of households held about half of all outstanding stock, financial securities, trust equity, and business equity, and 36 percent of non-home real estate,” Wolff wrote.
New Report Shows How Walmart Forces Its Employees to Live on the Dole - Walmart's wages and benefits are so low that many of its employees are forced to turn to the government for aid, costing taxpayers between $900,000 and $1.75 million per store, according to a report released last week by congressional Democrats. Walmart's history of suppressing local wages and busting fledgling union efforts is common knowledge. But the Democrats' new report used data from Wisconsin's Medicaid program to quantify Walmart's cost to taxpayers. The report cites a confluence of trends that have forced more workers to rely on safety-net programs: the depressed bargaining power of labor in a still struggling economy; a 97 year low in union enrollment; and the fact that the middle-wage jobs lost during the recession have been replaced by low-wage jobs. The problem of minimum-wage work isn't confined to Walmart. But as the country's largest low-wage employer, with about 1.4 million employees in the US—roughly 10 percent of the American retail workforce—Walmart's policies are a driving force in keeping wages low. Using data from Wisconsin, which has the most complete and recent state-level Medicaid data available, the Democrats' report finds that 3,216 of Wisconsin’s 29,457 Walmart workers are enrolled in the state's Medicaid program. That figure that balloons to 9,207 when Walmart employees' children and adult dependents are taken into account.
One Walmart's Low Wages Could Cost Taxpayers $900,000 Per Year, House Dems Find -Walmart wages are so low that many of its workers rely on food stamps and other government aid programs to fulfill their basic needs, a reality that could cost taxpayers as much as $900,000 at just one Walmart Supercenter in Wisconsin, according to a study released by Congressional Democrats on Thursday.Though the study assumes that most workers who qualify for the public assistance programs do take advantage of them, it injects a potent data point into a national debate about the minimum wage at a time when many Walmart and fast food workers are mounting strikes in pursuit of higher wages. The study uses Medicaid data released in Wisconsin to piece together the annual cost to taxpayers for providing a host of social safety net programs, including food stamps and publicly subsidized health care, to workers at one Supercenter in the state. According to the report, Walmart had more workers enrolled in the state’s public health care program in the last quarter of last year than any other employer, with 3,216 people enrolled. When the dependents of those workers were factored in, the number of enrollees came to 9,207. "When low wages leave Walmart workers unable to afford the necessities of life, taxpayers pick up the tab," the report says.
Walmart workers speak out: 'I do not earn enough. I cannot survive like this' - The company is facing pressure at home after a series of strikes and protests over pay and conditions. Walmart's sourcing from factories with poor safety records is also under fire. Lobby group Making Change at Walmart raised over $9,000 on the crowdsourcing site Indiegogo to bring to the meeting Kalpona Akter, a former child textile laborer from Bangladesh. She is being accompanied by Sumi Abedin, a survivor of the deadly fire that killed at least 112 garment workers at the Tazreen Fashion factory on the outskirts of Dhaka last year. Akter will call on Walmart to sign a legally binding agreement to improve working conditions in her country's textile factories that many of the company's rivals have signed following a building collapse in April that left over 1,127 dead. Striking workers from union-supported group Our Walmart are also protesting against pay and conditions outside the event. They will be joined by workers from Walmart's warehouse supply chain, which has been hit by allegations of poor conditions, wage theft, retaliation against workers who complain and a series of strikes.
Unintended consequences: Did welfare reform kill some participants? - The Personal Responsibility and Work Opportunity Reconciliation Act of 1996 (PRWORA, also known as ‘Welfare Reform’) changed US welfare by limiting how long clients could receive it and introducing a work requirement. How well has welfare reform worked for recipients? Peter Muennig, Zohn Rosen and Elizabeth Ty Wilde report on the long term effects of a randomized controlled trial of welfare reform in Florida. From 1994 to 1999, Florida randomly selected a group of welfare recipients into either the Family Transition Program (FTP), a program that included many features of the later PRWORA, or the then-standard Aid for Families with Dependent Children welfare program (AFDC). Muennig and his colleagues looked at Social Security Records for 3,224 participants in the experiment to establish whether participants had died in the 18 years following the randomization. What they found was that participants in the experimental group had a 16 percent higher mortality rate than members of the control group (hazard ratio: 1.16; 95% confidence interval: 1.14, 1.19; p < 0.01). This amounts to nine months of life expectancy lost between the ages of thirty and seventy for people in FTP.
States want drug tests for welfare recipients, a terrible idea - Many forms of public assistance have not kept pace with the rising poverty during the great recession. This quiet human failure has proved particularly acute with Temporary Assistance to Needy Families (TANF) — our nation’s cash assistance system for poor single mothers and their children. Here in Illinois, for example, the number of TANF-recipient families dropped by 84 percent between 1997 and 2011. Our state TANF rolls remain stuck at 30,000 families per month, markedly below what they were in 2006 before the great recession struck. Of course, the trend is national. As I’ve noted here before, the percentage of low-income children receiving cash assistance has plummeted. Despite what you might hear on the radio, folding federal disability programs into the mix doesn’t change this reality. TANF benefits are quite low. That’s most obvious in the deep-red states. Mississippi’s maximum monthly cash benefit for a family of three is $170. Illinois’ $432 maximum monthly benefit is better, but only marginally. According to the Center on Budget and Policy Priorities, the combined value of TANF and food stamps allows Illinois families to reach 60 percent of the federal poverty line. Given such realities, legislators across the country should be exploring how to address serious unmet needs among millions of families in a tough economy. Instead, in many state capitals, precisely the opposite conversation is going on.
A Shredded Safety Net - In 1996, the year that Congress passed and Bill Clinton signed welfare reform, fulfilling his campaign pledge to “end welfare as we know it,” there were 14.5 million poor children in the United States; 8.5 million children were in families that received cash assistance from Aid to Families with Dependent Children (AFDC), or welfare. Following welfare reform, the number of families receiving assistance declined dramatically. Buoyed by the strong economy and the expansion of other key work supports, the number of single mothers in the workforce increased and child poverty declined. However, starting in the early 2000s, progress stalled and poverty rates began to climb again. Ten years after welfare reform, in 2006, just before the recession, there were still 12.8 million poor children in the U.S., and just 3.4 million children were in families that received cash assistance in an average month from Temporary Assistance for Needy Families (TANF), the program that replaced AFDC. Stringent income limits continued to disqualify many families, but millions more, with incomes low enough to qualify, did not receive cash assistance. The Government Accountability Office estimates that 87 percent of the decline in caseloads from 1995 to 2005 was caused by eligible families failing to receive help, not by decreased need. Five years later, in 2011, as a result of the worst recession in generations, the number of poor children in the U.S. had climbed to 16.1 million, but still just 3.4 million children were in families receiving cash assistance under TANF. The number of families receiving help grew in some states, but never as much as need rose. Other states shortened time limits on benefit receipt despite continued high unemployment and need. If caseloads were low because families had no need for help, we would have reason to celebrate. But this is not the case. In too many states, TANF is simply failing in its mission of protecting children from hardships caused by deep poverty.
Congress' Farm Bill Readies to Kick Poor Off Food Assistance - If the House GOP gets its way, the new Farm Bill passing through Congress will prove the perfect opportunity to make some of the nation's most poor and vulnerable even less secure. At stake, funding for the Supplemental Nutrition Assistance Program (called SNAP), which provides access to staple foods for millions of families living beneath or skirting the poverty line. And as Paul Krugman describes in his Friday column, readers who understand what is happening in the bill should not just be shocked or cynical about the Republican's latest attempt to "shrink" then "effectively kill" a key social program, they "should be very, very angry." Krugman writes: That bill would push about two million people off the program. You should bear in mind, by the way, that one effect of the sequester has been to pose a serious threat to a different but related program that provides nutritional aid to millions of pregnant mothers, infants, and children. Ensuring that the next generation grows up nutritionally deprived — now that’s what I call forward thinking. And why must food stamps be cut? We can’t afford it, say politicians like Representative Stephen Fincher, a Republican of Tennessee, who backed his position with biblical quotations — and who also, it turns out, has personally received millions in farm subsidies over the years.
Number of the Week: 140% Increase in Food Stamp Use Since 1990 - 140%: The increase in the food-stamp rolls since 1990. More people than ever before are receiving benefits from the Supplemental Nutrition Assistance Program, also known as food stamps, but the rate of increase has slowed substantially since the height of the recession. The number of people collecting food stamps has more than doubled since 1990, even as the population has only increased by about 25%. Part of that was by design. Ever since welfare reform was passed in 1996, Washington has been making it easier for people to collect food stamps. The idea was to get help to those in need before they became destitute. The numbers first began to swell during the 2001 recession. By 2007 the share of the population receiving assistance for food had climbed over 9% from under 8% in 1990. But the figures really started to jump off the charts during the most recent downturn. In March, the most recent month for which data are available, more than 15%, or some 1 in 7 people, in the U.S. were on food stamps. In some states the numbers are even higher. (See full interactive map) Mississippi is the state with the largest share of its population relying on food stamps — 22% — though Washington, DC was a bit higher overall at 23%. One in five residents in Oregon, New Mexico, Louisiana, Tennessee, Georgia and Kentucky also are food-stamp recipients. Wyoming has the smallest share of its population on food stamps — 7%.
Officials Can't Prove Holding 12,400 People in Solitary Makes Federal Prisons Safer - The U.S. Bureau of Prisons currently holds more than 12,400 individuals in 23-hour-a-day lockdown, making it the largest practitioner of solitary and other forms of isolated confinement in the nation, and most likely the world. Yet the BOP does not know whether its use of "segregated housing" has any impact on prison safety, how it affects the prisoners who endure it, or how much it all costs American taxpayers. This according to a comprehensive new report from the Government Accountability Office. The GAO documents a dramatic rise in the use of isolated confinement in federal prisons over the past five years. Yet the "BOP has not assessed the impact of segregated housing on institutional safety or the impacts of long-term segregation on inmates," the report states.
Baby boomers are killing themselves at an alarming rate, raising question: Why? - It has long held true that elderly people have higher suicide rates than the overall population. But numbers released in May by the Centers for Disease Control and Prevention show a dramatic spike in suicides among middle-aged people, with the highest increases among men in their 50s, whose rate went up by nearly 50 percent to 30 per 100,000; and women in their early 60s, whose rate rose by nearly 60 percent (though it is still relatively low compared with men, at 7 in 100,000). The highest rates were among white and Native American and Alaskan men. In recent years, deaths by suicide has surpassed deaths by motor vehicle crashes. As youths, boomers had higher suicide rates than earlier generations; the confluence of that with the fact that they are now beginning to grow old, when the risk traditionally goes up, has experts worried. The findings suggest that more suicide research and prevention should “address the needs of middle-aged persons,” a CDC statement said. There are no large-scale studies yet fleshing out the reasons behind the increase in boomer suicides. Part of it is likely tied to the recent economic downturn — financial recessions are in general associated with an uptick in suicides. But the trend started a decade before the 2008 recession, and psychologists and academics say it likely stems from a complex matrix of issues particular to a generation that vowed not to trust anyone older than 30 and who rocked out to lyrics such as, “I hope I die before I get old.”
Rural US shrinks as young flee for the cities - FT.com: The population of rural and small-town America contracted over the past two years for the first time on record as young people left to search out work in the cities and birth rates fell, according to official data. An analysis of US Census Bureau data by the Department of Agriculture found that although population growth in America’s rural heartland has risen and fallen for decades with changes in the US economy, the pace of decline accelerated in the years 2010-2012. And for the first time, the so-called “natural increase” in population – total births minus deaths – was insufficient to offset the loss from those migrating away. The net loss of population represents a natural increase of 135,000 offset by a larger loss from out-migration of 179,000, a drop of 0.9 per cent. Moreover, so-called exurban areas, which have grown rapidly for decades as cities sprawled, also declined in population for the first time during the 2010-12 period. The rate of decline was marginal, but considerable in the context of the years 2004-06 when exurbs added roughly 500,000 to their population. The few rural areas experiencing population growth include those regions where new energy sources have been uncovered such as North Dakota, which is now in the midst of a new oil boom. The population shift is concentrated most heavily in the mid-western states that form America’s bread basket as well as in parts of the old industrial north east. It may have profound implications for the economic outlook as well as for the political character of those parts of the country.
Moody's joins Fitch in downgrading Ill. credit — A second major rating agency is downgrading Illinois' credit worthiness. Moody's Investors Service lowered the state's $27 billion in outstanding bonded indebtedness Thursday to A3 from A2. The new rating's three levels above junk status. Illinois has the worst credit rating among states. Fitch Ratings downgraded Illinois' credit Monday. Both firms blame lawmakers' lack of action on a $97 billion pension shortfall. The Legislature adjourned its spring session without adopting a plan to make up the difference over 30 years, but the governor's calling lawmakers back to Springfield for a special session. A downgrade costs the state millions more to borrow money when it sells future bonds.
Denying a Head Start in Washington State | Sequester Watch – Bill Moyers - To get a sense of just how foolish and shortsighted the $85 billion across-the-board sequester cuts are you don’t have to look any further than Head Start. The federal government’s only pre-K program, Head Start provides comprehensive, high-quality early education and support services to children and their families living in poverty. “The results speak for themselves,” said Joel Ryan, executive director of the Washington State Association of Head Start & ECEAP (WSA). “The research shows that kids who go through Head Start are more likely to be ready for kindergarten, less likely to need special education services and more likely to graduate from high school.” All of that adds up to saving money over the long haul. But even before the sequester Head Start was reaching less than half of eligible children in the United States — and only 38 percent in Washington. Now, even fewer children will benefit from the program.
Financial Emergency declared in Hamtramck -- Governor Rick Snyder has declared a financial emergency in Hamtramck, in what could be the first step toward the appointment of an emergency manager. City officials asked the state for the review of their finances, which found Hamtramck with an over three-million dollar general-fund deficit and 1.6-million dollars in delayed contributions to the pension fund. Under the new emergency manager law, an emergency manager could be appointed, the city could go into a consent agreement with the state or declare Chapter 9 bankruptcy.
Detroit to offer creditors pennies on the dollar - Detroit's attempt to avoid bankruptcy will hit a critical stage next week as emergency manager Kevyn Orr brings together dozens of creditors to present a stark offer: less than 10 cents on the dollar for the loans, bonds, retiree obligations and other debts that have been strangling the city for years. Orr is expected to meet late next week — his office wouldn't say exactly when, but the location likely will be near Metro Airport — with as many as 150 representatives of the city's major creditors, from big national banks that hold the city's bonds and insurers who guarantee them, to unions and pensioners who rely on the city for retirement income and health care. They probably will not be satisfied with the offers Orr will present in a roughly 200-page document outlining the city's assets and liabilities. The report will make the case for what Detroit reasonably can pay its creditors. People close to the proceedings told the Free Press the offer will be for less than 10 cents for every dollar the city owes. Orr's office refused to confirm that figure.
Deciphering Detropia: The Power of Degrowth, the Destructiveness of Neoliberalism - Detropia[i],[ii] stirs anxiety and disorientation among its viewers[iii] through poignant visuals[iv] of the desolate and denuded cityscape blended with the accounts of Detroiters. But what are we to learn from this surfacing of collective dread? In my view Detroit’s demise and its fate are comprehensible only in terms of processes at play that currently are considered marginal, heretical or preposterous in mainstream culture. For simplicity, I refer to 1) thermodynamically induced socioeconomic degrowth[v] occurring while 2) governments recklessly and wantonly destroy the natural environment and exploit and threaten their citizens, in vain efforts to preserve a class-based neoliberal political/economic order where upward wealth distribution[vi] is the procrustean organizing principle. While I find Detropia mostly mired in the waning yet dangerous neoliberal worldview, its artistic integrity nonetheless delivers an emotional jolt[vii] that can open up viewers to recognize the depredations of neoliberalism at the physical limits to economic growth. In my summary I will discuss another documentary, Detroit, je t’aime, which presently is being made and can be considered an ecologically and (the beginnings of a) viable cultural response to the questions raised by Detropia.
Chicago Closes 50 Public Schools, Spends $100 Million in Taxpayer Funds on Private College Stadium: Despite months of protests and civil disobedience, Chicago's board of education voted Wednesday, May 22 to close 50 Chicago public schools, the largest such wave of closings in U.S. history. The schools are almost all exclusively located in black and Latino low-income neighborhoods in Chicago's South and West Side. The months-long efforts of parents, teachers, and students to convince the board to rethink the closures, and even prevent the vote from taking place, ultimately failed.In a piece posted to The Washington Post's Answer Sheet blog, Leslie T. Fenwick, dean of the Howard University School of Education writes that such policies are "really about exporting the urban poor, reclaiming inner city land, and using schools to recalculate urban land value. This kind of school reform is not about children, it's about the business elite gaining access to the nearly $600 billion that supports the nation's public schools. It's about money." But critics note that Chicago is simultaneously transferring hundreds of millions in tax dollars meant for public education to the private sector, including $100 million for De Paul University, a private institution, to build a new sports stadium.
Chicago Teachers Union fears hundreds of jobs lost with school closings - As Chicago Public Schools prepares to issue budgets for individual schools to principals, the Chicago Teachers Union is predicting that hundreds of its members could be laid off because of the district's ongoing budget woes. CPS last week failed to persuade state legislators to extend a pension holiday that has allowed the district to contribute less than required payments since 2010. The district now faces an additional $412 million in pension payments in the coming year and that, along with the plan to close 49 elementary schools and a new per-pupil-based budgeting system, has led to fears of major layoffs. CPS officials say they are analyzing the impact of paying a total of $612 million in pension payments in the budget year that begins July 1. The district said it is looking at additional reductions in central office, administrative and operations spending to deal with that, in addition to possibly moving its central office from 125 S. Clark St. in the Loop to less expensive quarters.
How a College Education Can Close the Income Gap - If we equalize opportunity, we are told, giving everyone a decent chance of success, outcomes will improve and any remaining inequality will be justified by differences in merit. There will be no need to use income redistribution – higher taxes on the wealthy and more transfers to those at the lower end of the income distribution – to make up for inequities in opportunity.Of course, even if we set aside the fact that unequal outcomes are driven in part by factors such as differences in economic and political power, market failures that advantage some people over others, and the legacy of past inequities, that is, even if we assume that inequality is solely due to differences in individual merit, equalizing opportunity is impossible. When outcomes are unequal, the children of the wealthy will always have advantages and opportunities that are not available to lower income households. But that doesn’t mean we can’t do better. So how well have we been doing at improving educational opportunity for low-income students (a topic of great personal interest)? Are we really making progress? Unfortunately, educational opportunity is getting worse, not better. It is becoming more difficult for qualified low-income students to attend a four year college. As a recent report “Undermining Pell” from the non-partisan New America Foundation notes, the net cost of going to a four year college, that is, tuition “after all grant aid has been exhausted,” has been rising.
The Premium From a College Degree - The unemployment rate ticked up to 7.6 percent while employers added about 175,000 new jobs in May, new Labor Department data showed this morning. But the economy feels very different depending on your level of educational attainment. For workers over the age of 25 who have a bachelor’s degree, the unemployment rate is 3.8 percent. For workers without a high school diploma, it is 11.1 percent. Still, in recent years, the burden of student-loan debt has raised questions about whether college is really worth it – particularly if a given person goes to college, takes on significant amounts of debt, but does not get diploma. New research from the Hamilton Project, a research group based at the Brookings Institution, says that on average, the answer is still yes. The so-called college wage premium – economists’ fancy way of saying how much more workers with a college degree are paid than other workers without one – has widened over the last three decades. Degree-holders earn more than 80 percent more than their peers with just a high school diploma, up from about 40 percent more as of the late 1970s. But millions of students attend college without graduating, and the workplace does not reward them nearly as richly. Their unemployment rate is 6.5 percent. And while they tend to earn more than workers with just a high school diploma, they make less than workers with a full degree. (For a nuanced take on this issue, read my colleague Jason DeParle’s long-form article from December.)
Working your way through college doesn’t add up for today’s students - If you check into a hotel in a college town late at night, chances are the desk clerk will be a student holding down at least one job — including a regular overnight shift — and trying to work through college while catnapping between classes. Working one's way through a public university in four years with a minimum-wage summer job and part-time campus work study — with little to no family assistance or need-based financial aid — is an outdated ideal of previous generations. It's virtually impossible today, if you do the math, and consider that tuition at four-year UW campuses has steadily risen above the rate of inflation since 1987, while state support has lagged below inflation since 1980. The diverging curves reflect a national trend of a dramatic shift in who covers the majority of cost for a college education: students and their families, instead of taxpayers. Students today are paying a much higher share of the cost than students 40 years ago, when a family could have sent three kids to UW-Madison for what it costs to send one kid today, adjusted for inflation. In 1978, a UW-Madison student paying his or her own way, without any help, had to earn $2,362. It could be done at minimum wage by working full-time through the summer and about 10 hours a week through the academic year, or a total 891 hours.
Mortgaged Diplomas - Current and prospective college students are receiving real-world instruction in the dismal political economy of public finance. Unless Congress can overcome its partisan differences, interest rates on federally guaranteed Stafford loans, an important means of paying for college, will double to 6.8 percent in July. With the Bank on Students Loan Fairness Act, Senator Elizabeth Warren, Democrat of Massachusetts, proposes to reduce this interest rate to the same level that large banks pay for loans from the Federal Reserve Bank — 0.75 percent — for at least one year, during which longer-term remedies could be explored. The bill, one of many aimed at addressing the scheduled interest-rate increase, seems unlikely to win passage. But it highlights the double standard that puts the interests of banks and other businesses well ahead of those of students and ordinary people when it comes to debt relief. As Robert Kuttner explains (both in The New York Review of Books and in his new book “Debtors’ Prison”), bailouts and bankruptcy proceedings both provide a means for businesses to get out from under bad debt. The obligations of a college loan, by contrast, “follow a borrower to the grave.” The rolling thunder of accumulating student debt sounds a lot like the perfect storm of mortgage liabilities that threatened major financial institutions and precipitated the Great Recession in 2007.
“Per qualche dollaro in più” or For A Few Dollars More . . . - Having helped quite a few younger people rearrange student loans from the private sector to Direct Loans or consolidate loans to achieve lower interest rates or payments; I just find this market-place-staging by some politicians offensive. July 1st the rates are expected to double (3+% to 6+%) for subsidized and unsubsidized Stafford loans and probably Perkins loans which all typically go to students who can least afford the “few extra dollars” as suggested by this newly minted Congressman from Indiana who appears to not be able to tie a decent knot in his tie. Student debt is on the upswing and appears to be the next bubble in which to contend. The rising deficit as suggested by Congressman Luke Messer is not increasing but is in a steady rate of decline and the economy is mediocre with slow job growth slow but is still far better than 1,2 or 3 years ago although it could use a shot of stimulus again. What is also insidious about this foray of increasing interest rates for those who can least afford it is there is “almost” no-way-out of it once students sign up for a loan. Those who have defaulted on ninja-style mortgages or did not pay hospital bills might understand the relentless pressure brought to bear; however, student loans have the official distinction of being cast in stone by Congress once a student signs his name. With only death, disability, or a lack of income over 20-or-so years being reasons for discharge can a person escape a student loan. We would not tolerate such for a mortgage or healthcare; but yet, we have locked our youth into such an arrangement. Read or listen in to a few comments Indiana Congressman Luke Messer makes:
$1T Debt Crushes Business Dreams of U.S. Students -- Dr. Steve Sherick wants to build the emergency-care business he started two years ago that now employs seven doctors and two part-time administrators. The $300,000 in student loans he and his wife carry makes that prospect difficult, he said. Former students hobbled by a collective $1 trillion in education loans can be hindered in expanding or forming small businesses and creating jobs for themselves and others. While self-employment among those 65 years old and over increased 24 percent in 2010 from 2005, it fell 19 percent among individuals 25 and under in the same period, according to the Small Business Administration. “The burden of student debt probably places pretty big constraints on your viable options after graduation,” said Dane Stangler, director of research and policy at Kansas City-based Kauffman Foundation, which focuses on supporting entrepreneurship. “With more student debt and stricter bank lending, it really hinders the ability of students to take risks, start a company.”
Dave Dayen on Student Loans as Medieval Indentures -- Yves Smith -- Dave Dayen’s latest article at Salon makes a critical point about student debt, that is it fundamentally misleading to call it a loan: The roughly two-thirds of U.S. students who take out loans to finance their college education can end up in a situation most resembling the historical concept of indenture. In medieval times, peasants would sign deeds to work land, which would then get cut in a jagged line (looking like teeth, or “dentures”). Each party would get half, and rejoining them would prove the authenticity of the contract. Colonial indentures would trade years of labor for the opportunity of transportation to the New World. The indentured could not alter the terms of the contract, no matter their circumstances. One way or another, the debt would get paid. Student debt slavery is in many respects worse than indentured servitude. Indentured servitude in America occurred most often when men with no or little in the way of savings pledged their labor to pay for the cost of passage. The term varied, depending on the vigorousness of the worker and his skills, with the time of bondage typically three to seven years. By contrast, as Dayen stresses, one of the horrors of student debt peonage is how crushing and inescapable the debt becomes for those who have trouble finding lucrative enough work to pay it off. You can’t discharge it in bankruptcy, unless you can prove “undue hardship” which is a very high bar. You can’t refinance it. The Feds can even garnish your Social Security.
The Fed Balance Sheet: What is Uncle Sam's Largest Asset? - Pop Quiz! Without recourse to your text, your notes or a Google search, what line item is the largest asset on Uncle Sam's balance sheet? The correct answer, as of the latest Flow of Funds report is ... Student Loans. The rapid growth in student debt has been an ongoing topic in the financial press. One stunning chart that continues to haunt me illustrates the rapid growth in federal loans to students since the onset of the great recession. Here is a chart based on data from the Flow of Funds Table L.105, which shows the Federal Government's assets and liabilities.As I point out on the chart, the two callouts are for Q4 2007, the quarter in which the Great Recession began (December 2007) the most recent quarter on record, Q1 2013. The loan balance has risen and astonishing 503 percent over that timeframe, most of which dates from after the recession. This chart only includes federal loans to students. Private loans make up an even larger amount. See this recent Bloomberg article highlighting the larger problem: But back to our quiz. Student loans may be a liability on the consumer balance sheet, but they constitute an asset for Uncle Sam. Just how big? Over 39 percent of the total federal assets, about 5 times the 7.9 percent for the Total Mortgages outstanding and over 3.5 times the size of Taxes Receivable.
Fix bankrupt student loan proposals - Interest rates on student loans will double on July 1 unless Congress acts. Since the phrase “congressional action” has become an oxymoron, this will quickly degenerate into an unnecessary crisis, requiring parents and students to threaten their legislators to get any relief. Why is action even a question? There is a universal consensus — left, right and center — that it is vital to our nation to educate the next generation. If we want to compete as a high-wage, high-skill country, our children will need the best in college or advanced technical training. And all agree that gaining that higher education is a necessary, if not sufficient, requirement for entering the middle class. So just as we pay for public education for kindergarten through 12th grade, we should ensure that advanced training or a public college education is available for all who earn it. None of this is even vaguely controversial. Yet, despite this consensus, we are pricing college out of the reach of more and more families. State support for public universities has lagged. Increasingly, the costs have been privatized, with the bill sent to students and families.
Student Loan Debt Is a Beast. Here Are Elizabeth Warren's, President Obama's, and the GOP's Plans to Fix It. - If you're one of the 37 million Americans with student loan debt, you're in for a real treat come July 1. That's when interest rates on federal student loans are set to rise to 6.8 percent—double the current rate of 3.4 percent. That deadline has lawmakers scrambling for a fix. There are a bunch of proposals out there, including Massachusetts Sen. Elizabeth Warren's call for students to be allowed to pay the low, low rate that big banks pay for short-term borrowing; a plan President Barack Obama laid out in his budget in April; and the GOP plan that just passed the House—a plan Obama hates. Whatever lawmakers and the president ultimately decide matters a lot. Over the past 25 years, the cost of going to college has spiked 440 percent. Since 2004, student loan debt in this country has tripled, and now stands close to $1 trillion. Check it out:
Why Isn’t Elizabeth Warren Attacking the Student Debt Problem Head On? - Yves Smith It’s hard not to notice the difference between Senator Elizabeth Warren’s posture on big banks and student debt. She came hard and fast out of the gate in her initial Senate appearances, making deft use of the highly constrained and artificial hearing format to get the issue of still untamed too big to fail banks back in the national focus. It’s thus puzzling to see her pull her punches on another pressing issue for middle class families, that of student debt. As readers no doubt know, she launched a bill that elicited favorable commentary in what passes for the left-leaning media for its catchy high concept, that of letting students borrow at the same rate as big banks. But in fact, her first bill is a narrow, technocratic fix to a particular problem that had been ignored, that interest rates on most student loans were set to jump sharply. Now there’s nothing wrong with short-term patches as long as you set them in a bigger context. And Warren could have clearly used her bill as a way put the spotlight on the student loan debt slavery the same way she has with unreformed and unaccountable banks. But if you look at her speech introducing her bill, you don’t hear an iota of questioning the underlying, destructive system of having students borrow large amounts of money to pay for college and grad school that has led to wildly escalating higher education costs with no noticeable improvement in the actual product. Worse, the colleges themselves have become loan-pushers, selling the less and less true with every passing day line that this is an investment that will pay off. For too many young people, higher education has become every bit as big a liability as 2007 subprime mortgage.
Chicago Public Schools new pension headache -- After Illinois lawmakers rejected a plan for Chicago Public Schools to delay pension payments, the District’s budget problems may have gone from bad to worse. Three years ago, the Illinois state legislature gave Chicago Public Schools what critics called a ‘pension holiday,’ where the district could reduce payments owed to its retirement system. That’s set to expire at the end of June, meaning Chicago’s schools will have to make room for an extra $400 million in its budget to pay for teachers’ pensions. CPS could have avoided writing that check by getting Illinois lawmakers to give them a longer timetable that would gradually increase pension payments over the next several years. This fiscal year, Chicago Public Schools is paying about $200 million toward its pensions. If Springfield takes no action, that number would jump to $600 million next year for pensions. The school system’s budget is a little more than $5 billion.
Friday Movie Night - Retirement Impending Disaster (PBS video series) Retirement is something most of us don't like to think about. It is not due to aging and fear of death. Instead, most of us are just scraping by, if that, and our retirement funds do not exist. Out of sight, out of mind is a way to deal with the deathly fear of having absolutely no money to take care of ourselves with in old age. Frontline explores the impending tsunami of economic disaster in their documentary, The Retirement Gamble. Frontline also investigates how retirement is a huge business, but it is at the expense of workers and their security today.
Is Social Security running out of money? - On Friday, the trustees for the Social Security and Medicare trust funds released their annual reports. A typical summary in the press is this one from the Los Angeles Times: The trustees overseeing the finances of Social Security and Medicare issued their latest report on Friday, declaring that a) the Social Security Trust Fund is expected to run out of money in 2035, the same estimate as last year; b) Medicare's hospital trust fund is expected to run out of money in 2026, a two-year improvement over last year's estimate; and c) the Disability Insurance Trust Fund is expected to run out of money in 2016, just as projected last year. Here's why I don't believe that's the correct way to think about these numbers. The Social Security trust fund ended 2012 with $2.6 trillion in assets. Under current law, the trustees anticipate this account to be drawn down gradually and become negative after 2035, an event that is sometimes referred to as "running out of money." But the $2.6 T in current assets consist of nothing more than a big I.O.U. from the U.S. Treasury to the Social Security trust fund. Where are the assets that the U.S. Treasury is holding that would enable it to make these payments? They don't exist. Taxes will have to be raised, other programs cut, or the Treasury will have to borrow more from the public in order to deliver the funds that Social Security is assuming it's going to be receiving from the Treasury between now and 2035. Where did the $2.6 T balance come from? It represents the accumulated amount by which Social Security taxes generated more money for the government than have been spent on beneficiaries up to this point. But that surplus from Social Security didn't go to acquire any real asset that could be used at this point to pay beneficiaries. The money has already all been spent on other programs. If the Treasury is going to pay this $2.6 T to Social Security, the funds have to come from tax increases, spending cuts, or more borrowing.
The Geezers Are All Right, by Paul Krugman - Last month the Congressional Budget Office released its much-anticipated projections for debt and deficits, and there were cries of lamentation from the deficit scolds who have had so much influence on our policy discourse. The problem, you see, was that the budget office numbers looked, well, O.K... But if you’ve built your career around proclamations of imminent fiscal doom, this definitely wasn’t the report you wanted to see. Still... Doesn’t the rising tide of retirees mean that Social Security and Medicare are doomed unless we radically change those programs now now now? Maybe not. To be fair, the ratio of Americans over 65 to those of working age will rise inexorably over the decades ahead, and this will translate into rising spending on Social Security and Medicare as a share of national income. But the numbers aren’t nearly as overwhelming as you might have imagined,... the data suggest that we can, if we choose, maintain social insurance as we know it with only modest adjustments. ... So what are we looking at here? The latest projections show the combined cost of Social Security and Medicare rising by a bit more than 3 percent of G.D.P. between now and 2035, and that number could easily come down with more effort on the health care front. But haven’t all the great and the good been telling us that Social Security and Medicare ... are unsustainable, that they must be totally revamped — and made much less generous? Why yes, they have; they’ve also been telling us that we must slash spending right away or we’ll face a Greek-style fiscal crisis. They were wrong about that, and they’re wrong about the longer run, too.
A Guide to the 2013 Social Security Trustees Report - The Social Security and Medicare trustees released our annual reports last Friday, May 31. These reports set forth the state of program finances as required under the Social Security Act. There are six trustees; four of them (the Secretaries of Treasury, HHS and Labor as well as the Social Security Commissioner) serve by virtue of their government offices. The other two, of which am I one, are members of the public nominated by the President and confirmed by the US Senate. I have adopted the custom of publishing a short summary of each report just after it is released. This year’s Social Security report summary will roughly follow the format of last year’s, condensing the report’s fuller information into a few critical points. Social Security faces a large and increasingly immediate financing shortfall necessitating prompt legislative corrections. Social Security holds two trust funds. Its Old-Age and Survivors (OASI) Trust Fund finances what we generally think of as retirement benefits (as well as benefits for so-called non-working spouses, widowed spouses and surviving children); the Disability Insurance (DI) Trust Fund finances disability benefit payments. Although it has become common practice to reference Social Security’s finances as a combined whole, under law benefits in each portion of the program can only be paid from its respective trust fund. Each trust fund must maintain a positive balance of reserves to avoid an interruption in benefit payments.
Is higher immigration a $4.6 trillion opportunity for Social Security? -- The Heritage Foundation was rightly criticized for expressing the long-term costs of so-called immigration “amnesty” in inflation-adjusted terms rather than as a present value, which accounts for the time value of money. A present value would have cut Heritage’s $6.3 trillion figure roughly in half.The same trick is used in an editorial in yesterday’s Wall Street Journal, which claims that higher immigration would boost Social Security’s finances by $4.6 trillion. In fact, the writers call higher immigration a “$4.6 trillion opportunity.” Let’s do the math. Social Security has a 75-year deficit of 2.72% of payroll, meaning that raising the 12.4% payroll tax rate by 2.72 percentage points would keep the program solvent over 75 years. The latest Trustees Report states that “Increasing average annual net immigration by 100,000 persons improves the long-range actuarial balance by about 0.07 percent of taxable payroll.” Since the Gang of Eight plan envisions steady-state immigration of around 150,000, multiply 0.07% by 1.5 and you have 0.105%. This means that the Gang of Eight plan would fix roughly 3.9% of the Social Security shortfall. Since Social Security’s 75-year shortfall in dollar terms is about $9.6 trillion, that means immigration reform would save about $375 billion in present value. So no, immigration isn’t a $4.6 trillion opportunity for Social Security. It’s not even one-tenth that amount.
Should states jump on the Medicaid expansion bandwagon? - Carter C. Price and Christine Eibner have a new study in Health Affairs suggesting a definite “yes,” and I have seen this piece endorsed numerous times in the blogosphere and on Twitter. I do understand that part of their argument is a normative one, given the desire to expand insurance coverage for the currently uninsured. But they and their endorsers also seem to be making a state-level financial prudence argument, as if there were no possible reason for a state not to expand participation behind sheer ideological stubbornness. On that matter I don’t think they have pondered the problem deeply enough and they fail an intellectual Turing test.Let’s start with a simple observation, namely that a Republican may win the next Presidential election. There is also quite a good chance that such a victory would be accompanied by a Republican Senate (and House), given the distribution of vulnerable seats. That means a very real chance that the federal government will scale back its commitment to Medicaid expansion, for better or worse. States don’t want to be left holding the bag, and governors know it is hard to take back benefits once granted.
Health Care Thoughts: Carrot and Stick - The Obama administration has issued regulations allowing employers to use both incentives and penalties in wellness programs. There is some controversy here, such as: employer plans setting and enforcing blood pressure and cholesterol standard: punishing smokers (less controversial perhaps) – is this punishing addicts? there are many age and racial determinants in health, and civil rights advocates worry about back door age and race discrimination There are limits and requirements on employers and the incentives/penalties. Employer cannot enforce penalties without offering wellness programs and services (smoking cessation tied to a smokers penalty). Nothing in the rules negates any ADA standards.
Affordable Care Act Could Be Good for Entrepreneurship - The Affordable Care Act is expected to produce a sharp increase in entrepreneurship next year, according to a new report from the Robert Wood Johnson Foundation, the Urban Institute and Georgetown University’s Health Policy Institute. The number of self-employed people is expected to rise by 1.5 million — a relative increase of more than 11 percent — as a direct result of the health care overhaul. One major barrier to entrepreneurship in the United States — beside the usual risks involved with starting a company — is that it has been difficult to get health insurance on the individual market. Those who do end up founding or joining a start-up are often able to do so because they have a spouse with employer-sponsored insurance, or because they are keeping a day job with a bigger company. Economists have looked at whether this insurance-related job lock is deterring self-employment and the formation of new businesses, and the data suggest it is. A Journal of Health Economics paper, for example, found that business ownership rates jumped sharply from just under age 65 to just over age 65, when people become newly eligible for Medicare. Using Current Population Survey data, the same paper also found that wage and salary workers are more likely to start businesses from one year to the next if they have a spouse with employer-based insurance. A working paper from the Upjohn Institute looked at a change in the law in New Jersey that expanded access to individual health insurance. It found that the law seemed to increase self-employment, particularly among “unmarried, older, and observably less-healthy individuals.”
The Uninsured After Implementation Of The Affordable Care Act: A Demographic And Geographic Analysis - The Affordable Care Act (ACA) proposed expanding health insurance coverage by: 1) requiring states to offer Medicaid to people with incomes up to 138 percent (133 percent plus a 5 percent income disregard) of the federal poverty level (FPL), with most of this expansion funded federally; and 2) offering subsidies to help those with incomes up to 400 percent FPL purchase private insurance through newly created insurance exchanges. The Congressional Budget Office (CBO) estimated in March 2012 that the ACA would newly insure 30-33 million people, leaving 26-27 million uninsured in 2016. In June 2012, however, the Supreme Court ruled that states may opt-out of Medicaid expansion. Since then, the governors of 14 states have announced their intention to opt-out, 6 are undecided, 3 are leaning against, and 2 toward the expansion. Opt-outs will likely leave several million more uninsured, but little is known about who is likely to remain uninsured under the ACA.To estimate the number and characteristics of US residents who will remain uninsured in 2016, we analyzed data from the Census Bureau’s 2012 Current Population Survey, a nationally representative survey of the non-institutionalized US population.
ObamaCare’s Relentless Creation of Second-Class Citizens - One of the things I hate most about ObamaCare is the vicious and relentless way that it creates first- and second-class citizens. ObamaCare does this by construction, of course: ObamaCare’s central concept of eligibility — the outright denial that health care is a human right, but is instead just another pigfest of rental extraction — necessarily implies that those who are “eligible” and those who are not eligible are granted different levels of access to care. Here, however, I want to focus on three whimsical and arbitrary distinctions that ObamaCare draws between the worthy and the unworthy, the saved and the drowned, the lucky winners and the losers. To begin, if you’re from Libby, MT, you’re a first-class citizen. If you’re from anywhere else, you’re a loser. I’m so sorry. Dr. Philip Caper in the Bangor Daily News: After his own constituents in Libby, Mont., became uninsurable by private insurance due to industrial pollution with carcinogens and were unable to get the courts to hold the polluters responsible, [Senator Max] Baucus came to the rescue. He simply tucked a little provision into the massive health reform bill making affected Montanans eligible for — you guessed it — Medicare. No health insurance exchanges for these hardworking folks. Nothing but the best for Libby. By taking the simple, direct and most efficient route to expanding health-care coverage, Mr. Baucus did the right thing by his constituents. But Baucus made sure that everybody else had to settle for Obamacare.
ACA’s success depends on young people buying insurance. Or does it? - The success of the healthcare law “depends on reaching everyone who is uninsured, but particularly young people who may feel like they don’t need insurance,” said Larry Levitt, a senior vice president at the Kaiser Family Foundation. That’s from an Anna Gorman piece in the LA Times. I think we need to dig a little deeper into what we mean by statements like “the success of the healthcare law depends on young people signing up.” What do we mean by “success”? Here are some possibilities. Success means …
- Maximizing coverage
- Minimizing average premium
- Reducing uncompensated care
- Providing a set of choices that is relatively stable over time
These are all different goals. The first, maximizing coverage, implies an ambition to get young people, indeed all people, to sign up. That is the goal of some reform advocates, but they don’t always state it or say why it is a good thing in and of itself (if it is). The second, minimizing average premium, would happen if only the healthiest person signed up and nobody else. Nobody really has this as a goal. What some may have in mind that is similar is keeping premiums low for older people who really need coverage by pulling in younger, healthier people into the risk pool. This is a cross-subsidy goal, and is the focus of much debate.
How the next battle over Obamacare could be the ugliest yet - -- In what may be the epic battle of the summer, the White House and Republicans are assembling their armies and sharpening their bayonets for a political fight over the selling of Obamacare. On one side is the Obama administration, which is preparing to carry out the president's landmark health care reform law. It sees success directly linked to his legacy. On the other side are House Republicans, conservative groups, GOP governors and tea party affiliates. They are reading the latest polls and are determined to make the repeal or severe crippling of the Affordable Care Act their top priority before the 2014 midterms.The next phase of the fight for the White House, according to administration officials, is a series of initiatives aimed at using social media, websites, on-the-ground efforts and targeting Spanish speakers and young people in particular to convince as many uninsured as possible to buy insurance when it becomes available on October 1. Meanwhile, Republicans are continuing to whittle away at the law's impact and are hoping that Obamacare's failure could become a rallying cry.
Obamacare To Double Cost Of Insurance For Average Californian - Last week, the state of California claimed that its version of Obamacare’s health insurance exchange would actually reduce premiums. But, as Forbes reports, the data that the executive director of California's 'exchange' released tells a different story: Obamacare, in fact, will increase individual-market premiums in California by as much as 146 percent. The exuberance that Peter Lee exclaimed over the 'savings' is a misleading comparison. He was comparing apples - the plans that Californians buy today for themselves in a robust individual market-and oranges - the highly regulated plans that small employers purchase for their workers as a group. If you're a 25 year old male non-smoker, buying insurance for yourself, the cheapest plan on Obamacare’s exchanges is the catastrophic plan, which costs an average of $184 a month; but in 2013, on eHealthInsurance.com, Forbes explains, the median cost of the five cheapest plans was only $92. In other words, for the typical 25-year-old male non-smoking Californian, Obamacare will drive premiums up by between 100 and 123 percent
We Are Not Having A Serious Discussion... - Paul Krugman - Ezra Klein offers a nice illustration of this point today, in his takedown of Avik Roy on Obamacare in California. Klein tries really hard to keep his temper even; too hard, I think, because I wonder how many readers will stay with him all the way through. But to cut to the chase, Roy claims that Obamacare will cause soaring insurance rates, using a comparison that is completely fraudulent — and I say fraudulent, not wrong, because he is indeed enough of a policy wonk here to know that he is pulling a fast one. So here’s the comparison Roy uses: he points out that the insurance premiums that will apparently be charged on the California exchange will be higher than the lowest rates being offered by some insurers in California right now. As Klein says, this isn’t just comparing apples and oranges; it’s comparing apples with oranges you can’t even buy. Right now, California has a basically unregulated individual market, in which insurers are free to reject whoever they choose, and charge whatever rates they choose. This means that a few young, healthy people with no record of prior medical problems can get cheap plans; these are, of course, precisely the people who need insurance least, and these plans are cheap not just because they’re only available to the very healthy but because they don’t provide much insurance. If you’re not healthy or wealthy enough to get by with this kind of insurance, too bad. So looking at these rates tells you nothing at all about the success of a program that offers insurance to everyone, regardless of medical history, and sets fairly high minimum standards for the quality of that insurance.
Forbes Fight - Avik Roy wrote an extremely misleading article on Obamacare in California. It seems that Roy is the latest R-team player to be sacked.Basically Roy compared Obamacare exchange rates (without subsidies) to the teaser rate from a web site which has received many extremely unamusing negative reviews for baiting and switching. R. Unger totally demolishes Roy in an in house Forbes fight. Good thing that they can e-mail in stories as meeting at the Forbes building would be very awkward.. Ezra Klein brings the Klein courtesies which matter so much (plus a funny photo). Pity he’s such a good journalist as the man was born to be a diplomat. Paul Krugman brings the shrill All via Brad DeLong who admits he was beginning to wonder if Krugman is more than optimally shrill (don’t feel bad Brad, I’m sure Krugman has had the same doubts about you).
Colonoscopies Explain Why U.S. Leads the World in Health Expenditures - : Deirdre Yapalater’s recent colonoscopy at a surgical center near her home here on Long Island went smoothly: she was whisked from pre-op to an operating room where a gastroenterologist, assisted by an anesthesiologist and a nurse, performed the routine cancer screening procedure in less than an hour. The test, which found nothing worrisome, racked up what is likely her most expensive medical bill of the year: $6,385. That is fairly typical: in Keene, N.H., Matt Meyer’s colonoscopy was billed at $7,563.56. Maggie Christ of Chappaqua, N.Y., received $9,142.84 in bills for the procedure. In Durham, N.C., the charges for Curtiss Devereux came to $19,438, which included a polyp removal. While their insurers negotiated down the price, the final tab for each test was more than $3,500. Although her insurer covered the procedure and she paid nothing, her health care costs still bite: Her premium payments jumped 10 percent last year, and rising co-payments and deductibles are straining the finances of her middle-class family, In many other developed countries, a basic colonoscopy costs just a few hundred dollars and certainly well under $1,000. That chasm in price helps explain why the United States is far and away the world leader in medical spending, even though numerous studies have concluded that Americans do not get better care.
Health Care Costs: Don't Blame the Free Market - Dean Baker - The NYT has a very interesting piece documenting how much more people in the United States pay for a wide variety of medical procedures and drugs. While the article provides much useful information, it badly errors in telling readers that the cost problems stem from a free market.In fact, one of the main reasons that the United States pays so much for health care, including the items listed in this article, is precisely because it does not have a free market in large sectors of the health care industry. Of course it severely restricts the admission of immigrant doctors into the country, driving up the pay of physicians to two or three times what they would receive in other wealthy countries. Perhaps more importantly, it grants patent monopolies to drugs and medical devices. These monopolies allow pharmaceutical companies and manufacturers of medical devices to charge prices that are many thousand percent above their free market price. Not only does this raise the cost for these items it also perversely is likely to lead to unnecessary procedures, like the proliferation of colonoscopies that are a main theme of the piece. Since colonoscopies provide large profits (which would not be the case in a free market), there is a strong incentive to push their use on patients in circumstances where they may not be needed. This is a more general problem in U.S. medicine. Because drug companies can sell drugs for hundreds or even thousands of dollars per prescription, when they can be profitably sold for $5-$10, they have an enormous incentive to mislead the public about the safety and effectiveness of their drugs.
The Culprit Behind High U.S. Health Care Prices - Elizabeth Rosenthal’s eye-opening article about health care costs in The New York Times on Sunday was a reminder of how much more Americans pay for given procedures than citizens in health systems abroad. What was probably more surprising to most readers was the huge price differentials for identical procedures — not only across the United States, but even within American cities, where prices for a given procedure can vary tenfold. These price differentials, it should be noted, have never been shown to be related either to the cost of producing health care procedures or to their quality. The question, not addressed in the article, is who bears the blame for this chaotic, private-sector price system. The only fair answer is: American employers. Who else could it be? I have been critical of employment-based health insurance in this country for more than two decades. In the early 1990s, for example, at the annual gathering of the Business Council, I bluntly told the top chief executives assembled there, “If you want to find the culprit behind the health care cost explosion in the U.S., go to the bathroom and look in the mirror.” After years of further study, I stand by that remark. I can imagine that some would look instead to the usual suspects – Medicare, Medicaid and possibly even the Tricare program for the military – but that would be a stretch. The argument would be that the public programs shift costs to the private sector, causing the chaos there. Few economists buy that theory.
States’ Hospital Data for Sale Puts Privacy in Jeopardy - Hospitals in the U.S. pledge to keep a patient’s health background confidential. Yet states from Washington to New York are putting privacy at risk by selling records that can be used to link a person’s identity to medical conditions using public information. The potential for a patient’s hospital record to be made public by anyone buying data compiled by states adds to ways privacy is vulnerable in an age of digitized health record keeping and increasingly sophisticated hacking. Laws governing medical-information sharing were intended to protect the privacy of patients like Boylston. People can lose out on jobs, pay more for insurance, fare poorly in custody battles and suffer personal embarrassment. The trouble is that state public-health agencies received an exemption from the federal law, formally the Health Insurance Portability and Accountability Act, or HIPAA, enacted in 1996. The privacy rules took effect in 2003, though they apply only to health-care providers, insurers, billing and claims processors and their contractors.
Do Psychiatrists Create the Very Mental Problems They Claim to Treat? - The Diagnostic and Statistical Manual of Mental Disorders determines which mental disorders are worthy of insurance reimbursement, legal standing, and serious discussion in American life. That its diagnoses are not more scientific is, according to several prominent critics, a scandal. In a major blow to the APA’s dominance over mental-health diagnoses, Thomas R. Insel, director of the National Institute of Mental Health, recently declared that his organization would no longer rely on the DSM as a guide to funding research. “The weakness is its lack of validity,” he wrote. “Unlike our definitions of ischemic heart disease, lymphoma, or AIDS, the DSM diagnoses are based on a consensus about clusters of clinical symptoms, not any objective laboratory measure. In the rest of medicine, this would be equivalent to creating diagnostic systems based on the nature of chest pain or the quality of fever.” As an alternative, Insel called for the creation of a new, rival classification system based on genetics, brain imaging, and cognitive science.
Vinegar cancer test saves lives, India study finds — A simple vinegar test slashed cervical cancer death rates by one-third in a remarkable study of 150,000 women in the slums of India, where the disease is the top cancer killer of women. Doctors reported the results Sunday at a cancer conference in Chicago. Experts called the outcome "amazing" and said this quick, cheap test could save tens of thousands of lives each year in developing countries by spotting early signs of cancer, allowing treatment before it's too late. Usha Devi, one of the women in the study, says it saved her life. "Many women refused to get screened. Some of them died of cancer later," Devi said. "Now I feel everyone should get tested. I got my life back because of these tests." Pap smears and tests for HPV, a virus that causes most cervical cancers, have slashed cases and deaths in the United States. But poor countries can't afford those screening tools. This study tried a test that costs very little and can be done by local people with just two weeks of training and no fancy lab equipment. They swab the cervix with diluted vinegar, which can make abnormal cells briefly change color.
Eroom's Law. In the Pipeline:: There's another "Troubles of Drug Discovery" piece in Nature Reviews Drug Discovery, but it's a good one. It introduces the concept of "Eroom's Law", and if you haven't had your coffee yet (don't drink it, myself, actually), that's "Moore's Law" spelled backwards. It refers, as you'd fear, to processes that are getting steadily slower and more difficult with time. You know, like getting drugs to market seems to be. Eroom's Law indicates that powerful forces have outweighed scientific, technical and managerial improvements over the past 60 years, and/or that some of the improvements have been less 'improving' than commonly thought. The more positive anyone is about the past several decades of progress, the more negative they should be about the strength of countervailing forces. If someone is optimistic about the prospects for R&D today, they presumably believe the countervailing forces — whatever they are — are starting to abate, or that there has been a sudden and unprecedented acceleration in scientific, technological or managerial progress that will soon become visible in new drug approvals.Here's the ugly trend (dollars are inflation-adjusted:
How Commodities Hoarding Distorts Food Prices - Not only do financial firms speculate directly in physical markets, they also speculate indirectly by financing other commodity hoarders, like major multinational food trading companies. A 2012 Oxfam report by Murphy, Burch and Clapp isolates the “ABCDs”—ADM, Bunge, Cargill and Louis Dreyfus—as the world’s largest food trading companies, controlling over 70% of the world grain market. In some cases, these firms speculate on food prices by selectively warehousing crops. The Oxfam report notes: “In many cases, it is almost impossible to know for sure the size of the commodity stocks these firms hold – much of that information is a tightly held secret. Since the elimination of most public stock-holding programmes in the big exporter countries, including the USA and the EU (a gradual process that started in the 1980s), the ABCD firms have themselves begun to hold more physical stocks. The existence and control of these physical stocks can have an important impact on grain prices…” In fact, there are lots of recent examples of the ABCDs being investigated for hoarding. In 2011, Hugo Chavez of Venezuela ordered public officials to “hunt speculators”, and Cargill was specifically singled out for hoarding food oil. Other sources report that “Many [trading companies] amass speculative positions worth billions in raw goods, or hoard commodities in warehouses and super-tankers during periods of tight supply.”
Experts unearth concerns over ‘peak soil’ Al Jazeera - Soil is becoming endangered, and this reality needs to be part of our collective awareness in order to feed nine billion people by 2050, say experts meeting in Reykjavík. And a big part of reversing soil decline is the use of carbon, the same element that is helping to overheat the planet. "Keeping and putting carbon in its rightful place," needs to be the mantra for humanity if we want to continue to eat, drink and combat global warming, concluded 200 researchers from more than 30 countries. "There is no life without soil," said Anne Glover, chief scientific adviser to the European Commission. "While soil is invisible to most people it provides an estimated $1.5tn to $13tn dollars in ecosystem services annually,"
EPA: The United States needs $384 billion in drinking-water infrastructure improvements -The U.S. Environmental Protection Agency (EPA) today released results of a survey showing that $384 billion in improvements are needed for the nation’s drinking water infrastructure through 2030 for systems to continue providing safe drinking water to 297 million Americans. EPA’s fifth Drinking Water Infrastructure Needs Survey and Assessment identifies investments needed over the next 20 years for thousands of miles of pipes and thousands of treatment plants, storage tanks and water distribution systems, which are all vital to public health and the economy. The national total of $384 billion includes the needs of 73,400 water systems across the country, as well as American Indian and Alaska Native Village water systems. “A safe and adequate supply of drinking water in our homes, schools and businesses is essential to the health and prosperity of every American,” said EPA Acting Administrator Bob Perciasepe. “The survey EPA released today shows that the nation’s water systems have entered a rehabilitation and replacement era in which much of the existing infrastructure has reached or is approaching the end of its useful life. This is a major issue that must be addressed so that American families continue to have the access they need to clean and healthy water sources.”
Our Water Is Being Stolen From Us! : A recent episode of the hit TruTV investigative program, "Conspiracy Theory With Jesse Ventura," has literally tapped into a water scandal that most of the US public has no idea about. Multi-national corporations and unscrupulous wealthy individuals are buying up water rights for some of the largest aquifers in the US and the world. With water predicted to become a scarcity within 20 years, it would appear that some of the elite wealthy are trying to corner the market on the earth's most precious life-giving resource, water. American oil-tycoon T. Boone Pickens was one of the first to rush to capitalize on the impending water shortage, investing a meager $100-million in a scheme that he readily admits will make him an easy billion dollars, if not far more. In the Texas panhandle, Roberts County sits over the largest underground aquifer in the US, the Ogallala Aquifer, containing a quadrillion gallons of water. This vast underground reservoir reaches as far north as South Dakota. Roberts county is roughly 924 square miles, yet has only a meager 900 residents. Some people would say they were "ripe for the picking." Perhaps that statement should read, "ripe for Pickens." Mr. Pickens has purchased 68,000 acres, as well as the right to drain up to 50% of the Ogallala aquifer to sell for his own personal profit. Needless to say, that isn't exactly going over too well for many Texas residents.
Fracking Tests Ties Between California ‘Oil and Ag’ Interests - A dirt side road, flanked by an orchard of two-year-old almond trees and a field of alfalfa plants, leads to a two-acre patch where workers were drilling a third well. At a larger rig not too far away, next to a field of potatoes, a 50-foot-tall tower flared off the gas from the crude being extracted from land that used to be a rose field. At yet another site next to almond trees, a fence now surrounds an area where liquids from hydraulic fracturing, the drilling technique commonly known as fracking, leaked into an open pit. Driven by advances in drilling technology and high oil prices, oil companies are increasingly moving into traditionally agricultural areas like Shafter that make up one of the world’s most fertile regions but also lie above a huge untapped oil reserve called the Monterey Shale. Even as California’s total oil production has declined slightly since 2010, the output of the North Shafter oil field and the number of wells have risen by more than 50 percent. By all accounts, oilmen and farmers — often shortened to “oil and ag” here — have coexisted peacefully for decades in this conservative, business friendly part of California about 110 miles northwest of Los Angeles. But oil’s push into new areas and its increasing reliance on fracking, which uses vast amounts of water and chemicals that critics say could contaminate groundwater, are testing that relationship and complicating the continuing debate over how to regulate fracking in California. “As farmers, we’re very aware of the first 1,000 feet beneath us and the groundwater that is our lifeblood,” said Tom Frantz, a fourth-generation farmer here and a retired high school math teacher who now cultivates almonds. “We look to the future, and we really do want to keep our land and soil and water in good condition.”
Monsanto’s growing monopoly - When the Supreme Court unanimously sided with Monsanto recently, it upheld the company’s right to prohibit the replanting of patented seed – handing the biotech giant a major victory. The court ruled that the doctrine of “patent exhaustion,” which an Indiana farmer argued should apply after the first sale of patented seed, “does not permit a farmer to reproduce patented seeds through planting and harvesting without the patent holder’s permission.” It’s not surprising the court ruled in Monsanto’s favor. Still, the case had merit: The farmer, Vernon Hugh Bowman, wasn’t challenging Monsanto’s claims that he knowingly planted seed with its protected genetics. Instead, he challenged the way patent law is currently applied to self-replicating products – a worthy effort, considering the injustices patents on seed have sown across America. Needless to say, Bowman is not alone in his desire to use seed from subsequent generations. More than 150 farmers have been targets of patent infringement lawsuits filed by Monsanto. And legislative initiatives at the federal level also highlight the demand. Rep. Marcy Kaptur, of Ohio, introduced legislation in 2004 and again this year to establish a registration and fee system that would allow farmers to legally save patented seed. “Companies deserve a fair return, not an exorbitant return,” Kaptur has said. She’s right. Should developers of new seed varieties earn returns on their research and development investments? Yes, absolutely. But patents on self-replicating seed – and any living organism, for that matter – are unethical and dangerous.
Yet Another GMO Contamination Outbreak - The problem came to light when an Oregon farmer discovered a stand of Monsanto’s Roundup Ready spring wheat growing feral on his land. This is not a commercially available crop. Monsanto has done hundreds of field tests of genetically engineered wheat in at least 17 states, from 1997 to 2005 and resuming in 2011. This includes the last known testing in Oregon, from 1999 to 2001. But in the face of farmer opposition, fears over the viability of US wheat exports if the supply was contaminated, and other obstacles, the GM rackets never commercialized any GM wheat, and the government never approved it for sale. Today’s discovery is only the latest in a long history of contamination episodes. The USDA’s own Inspector General issued a 2005 report which criticized inadequate agency oversight. The GAO was more harsh in 2008, emphasizing the agency’s own data admitting over 700 violations of USDA testing regulations, including nearly a hundred which could lead to GMO contamination in the ecosystem. USDA “oversight” of the GMO cartel is a typical example of letting the corporations write up their own rules and police themselves, while the government’s only role is to rubber-stamp the process and then lie to the people, telling them a rigorous regulatory protocol exists. It’s further proof that even under “test” conditions, and even where unauthorized release is not deliberate (which we don’t know in this case), GMOs cannot be prevented from escaping into the environment and contaminating economic crops and wild relatives.
Monsanto Weighs Sabotage as Cause of Wheat Incident - WSJ.com: Monsanto said it is considering sabotage as a possible cause of the finding of unapproved genetically modified wheat in an Oregon field and that its testing reaffirms the incident is isolated. The presence of genetically modified wheat in the eastern Oregon field, announced last week by the USDA, is likely due to the "accidental or purposeful mixing of seed" that was planted in the field, said Robb Fraley, Monsanto's chief technology officer. Mr. Fraley wouldn't rule out the possibility of sabotage in a conference call with reporters. "We're considering all options at this point, and that's certainly one of the possibilities we're looking at," he said. He added the company is "certainly not implicating the farmer at all in this." Monsanto is the world's largest seed company and developer of genetically modified crops, which face intense opposition in many parts of the world. The USDA's announcement last week has threatened to upend the wheat market and prompted Asian countries, including Japan and South Korea, to halt wheat shipments from the U.S. while they await further testing.
Monsanto Still Testing Genetically Modified Wheat in Two States - The news of Monsanto's genetically modified (GM) wheat that turned up on an Oregon farm has brought repeated assurances that trials of this GM wheat stopped years ago.But while the particular strain of its GM glyphosate-resistant wheat MON 71800 stopped, Monsanto resumed trials of other GM wheat in 2011, according to Bloomberg, which cites information posted in a U.S. Department of Agriculture (USDA) database. Bloomberg reported that the corporate agriculture giant planted 150 acres of GM wheat in Hawaii last year and 300 acres of GM (also known as genetically engineered or GE) wheat in North Dakota this year. Monsanto did not disclose the specific herbicides these trial wheat crops are bred to tolerate, Bloomberg added. These new GM trials, the seed giant told Bloomberg, are "an entirely different event" from the Monsanto wheat found on the Oregon farm. In a statement last week, the company wrote, "Monsanto’s process for closing out the Roundup [glyphosate] Ready wheat program was rigorous, well-documented and audited."
U.S. Tailors Regional Climate Plans to Help Farmers Beat the Heat - Bloomberg: A U.S. effort that will tailor climate-change relief for farmers by region may help build support for efforts to cut carbon emissions tied to global warming, Agriculture Secretary Tom Vilsack said. Vilsack will introduce U.S. Department of Agriculture programs today to combat the effects of climate volatility. As a Corn Belt drought, the worst since the 1930s, is replaced by the wettest Iowa spring on record, farmers need resources and research to make better choices on planting and dealing with threats from the weather, he said in previewing a speech today at the National Press Club in Washington. “You’re going to see a lot more stress” on crops and livestock from climate change, he said yesterday in an interview. “You’re going to see crops produced in one area no longer able to be produced, unless we mitigate and adapt now.” A USDA report in February concluded average temperatures in the main U.S. growing regions may rise 4 degrees to 6 degrees Fahrenheit (2 degrees to 3 degrees Celsius) in the next four decades, outpacing nationwide trends.
Corporate Summit to Impose Hunger on Africa - The aptly named ”Hunger Summit” is the one year anniversary of the inaugural conference of the “New Alliance for Food Security and Nutrition”, the corporatist strategy for the recolonization of Africa led by Big Ag and the G8. A year ago Obama was master of ceremonies at Camp David. This year Britain’s David Cameron has the honors. The criminal conference will deliver a progress report and issue a public strategy. African farmers, tribes, consumers, environmental and civil society groups are opposing this, with support from anti-corporatists and democracy activists from all over the world. Here’s the order of battle. The whole project is being led by the US and UK governments (and paid for by their taxpayers), along with the rest of the G8. USAid is playing its usual role as “humanitarian” front group, “public” sector version, while Bill Gates and his “Alliance for a Green Revolution in Africa” serve as its “private” counterpart. The corporate beneficiaries, who have signed “letters of intent” to join the ”investment” program (meaning they put up pennies to the taxpayer dollar, while being slated to extract 100% of the profits), include the GMO cartel led by Monsanto, Dupont, Syngenta, along with Norway’s Yara (earmarked to build a massive synthetic fertilizer factory), arch-commodifier Cargill, Unilever, Diageo, and others. Bono is reprising his role as useful idiot celebrity tinsel. An African fig leaf is provided in the form of the African Union’s Comprehensive African Agricultural Development Program (CAADP), which is the Stockholm Syndrome blueprint African governments developed in the wake of the West’s ”structural adjustment” assaults, meant to beg for “investment” on the corporations’ own terms.
American Throw Out 40 Percent Of Their Food, Which Is Terrible For The Climate - On Tuesday, the U.S. Department of Agriculture and Environmental Protection Agency announced their plan to tackle food waste in America, a problem that has grown by 50 percent since the 1970s. Today, as much as 40 percent of food produced in America is thrown away, amounting to 1,400 calories per person per day, $400 per person per year, and notably, 31 million tons of food added to landfills each year. Throwing away food contributes directly to climate change — as EPA Acting Administrator Bob Perciasepe noted in a press release about the program, decomposing food releases methane, a greenhouse gas that is more than 20 times as effective at trapping atmospheric heat than carbon. According to the EPA, 17 percent of U.S. methane emissions come from landfills. But a high rate of wasted food also means a high rate of the energy that goes into food production — the water, fuel and farmland needed to grow crops and produce meat — is also wasted. It’s been estimated that 2 percent of all U.S. energy goes into food that American consumers and retailers are wasting. The problem of food waste isn’t limited to the U.S., and as food insecurity grows around the world, the task of finding ways of solving it becomes more urgent. Worldwide, it’s estimated estimated that one-third to a half of all food is wasted — despite estimates that 870 million people are undernourished. And the effects of climate change — extreme weather, droughts, floods and pest outbreaks — could put 20 percent more people worldwide at risk of hunger by 2050, according to the United Nations’ World Food Program.
New Campaign Chops Down Growing Trend of Burning American Forests for Energy: Southern forests are being burned for electricity, and a new campaign announced today aims to put an end to it. The Natural Resources Defense Council (NRDC) and Dogwood Alliance have launched “Our Forests Aren’t Fuel” to raise awareness of an alarming and rapidly-growing practice of logging forests and burning the trees as fuel to generate electricity At the forefront of burning trees logged from Southern forests for electricity are some of Europe’s largest utility companies, including Drax, Electrobel and RWE. Rising demand by these companies has resulted in the rapid expansion of wood pellet exports from the Southern US. The American South is now the largest exporter of wood pellets in the world. Recent analyses indicate there are twenty-four pellet facilities currently operating in the Southeast, and sixteen additional plants planned for construction in the near-term. Market analysts project that annual exports of wood pellets from the South will more than triple from 1.3 million tons in 2012 to nearly 6 million tons by 2015. All of the South’s largest domestic utilities, including Dominion Resources and Duke Energy, are also beginning to burn wood with plans for expansion in the future.
Forest Service says it’ll hire 500 fewer firefighters this year because of spending cuts - — As dry conditions set the stage for another difficult fire season, the Forest Service said Tuesday it will hire 500 fewer firefighters than last year because of automatic spending cuts imposed by Congress. The agency will still be able to fight wildfires across the West in spite of the force reduction of about 5 percent, Forest Service Chief Thomas Tidwell said, in part because three new air tankers are being put into service, including one being used to combat a massive wildfire in southern California. Four more planes sought by the Forest Service have been delayed because of a protest by a losing bidder. Tidwell told the Senate Energy and Natural Resources Committee that the Forest Service expects to hire about 10,000 firefighters this year, down from 10,500 last year. The agency also will have less equipment than last year.
Trade winds drop 28% since 1970s and leave Hawaii drier and more humid - The effects can be seen from the relatively minor, such as residents unaccustomed to the humidity complaining about the weather and having to use their fans and air conditioning more often, to the more consequential, including winds being too weak to blow away volcanic smog. The winds also help bring the rains, and their decline means less water. It's one reason officials are moving to restore the health of the mountainous forests that hold the state's water supply and encourage water conservation. Scholars are studying ways for farmers to plant crops differently. It's not clear what's behind the shift in the winds. "People always try to ask me: 'Is this caused by global warming?' But I have no idea," said University of Hawaii at Manoa meteorologist Pao-shin Chu, who began to wonder a few years ago about the winds becoming less steady and more intermittent.Chu suggested a graduate student look into it. The resulting study, published last fall in the Journal of Geophysical Research, showed a decades-long decline, including a 28% drop in northeast trade wind days at Honolulu's airport since the early 1970s.
Scientists tell Australia to save Great Barrier Reef: Leading marine scientists warned the Australian government on Wednesday of the growing threat to the Great Barrier Reef from unchecked industrial development. More than 150 scientists from 33 institutions signed a statement saying that the mining and gas boom along the Queensland state coast was hastening the decline of the World Heritage area. The UN's educational, scientific and cultural body meets later this month to discuss proposals to list the giant reef as a site "in danger". A UNESCO report in March found 43 development proposals in the vicinity of the huge reef were under assessment and that the federal and state governments had failed to improve water quality in the area. In the declaration, the scientists voiced concern about "the additional pressures that will be exerted by expansion of coastal ports and industrial development accompanied by a projected near-doubling in shipping, major coastal reclamation works, large-scale seabed dredging and dredge spoil disposal all either immediately adjacent to, or within the Great Barrier Reef World Heritage Area".
Global Biodiversity for $80 Billion Per Year - What would it cost to take large steps to reduce the extinction risk of all globally endangered species? Donal P. McCarthy and a list of 15 other authors estimate "Financial Costs of Meeting Global Biodiversity Conservation Targets: Current Spending and Unmet Needs" in the November 16, 2012, issue of Science magazine. Here is their summary: "World governments have committed to halting human-induced extinctions and safeguarding important sites for biodiversity by 2020, but the financial costs of meeting these targets are largely unknown. We estimate the cost of reducing the extinction risk of all globally threatened bird species ... to be U.S. $0.875 to $1.23 billion annually over the next decade, of which 12% is currently funded. Incorporating threatened nonavian species increases this total to U.S. $3.41 to $4.76 billion annually. We estimate that protecting and effectively managing all terrestrial sites of global avian conservation significance (11,731 Important Bird Areas) would cost U.S. $65.1 billion annually. Adding sites for other taxa increases this to U.S. $76.1 billion annually. Meeting these targets will require conservation funding to increase by at least an order of magnitude." The estimate surprised me a bit, because it's more-or-less one-tenth of 1% of the global economy--a very large amount, but not an unthinkably large amount. However, my guess is that the practical issues of protecting and managing biodiversity-protection areas may be much larger than the straight monetary cost implies.
Climate science tells us the alarm bells are ringing - Man-made heat-trapping gases are warming our planet and leading to increases in extreme weather events. Droughts are becoming longer and deeper in many areas. The risk of wildfires is increasing. The year 2012, the hottest on record for the United States, illustrated this risk with severe, widespread drought accompanied byextensive wildfires. Last month, levels of carbon dioxide in the atmosphere exceeded 400 parts per million, approaching the halfway mark between preindustrial amounts and a doubling of those levels. This doubling is expected to cause a warming this century of four to seven degrees Fahrenheit. The last time atmospheric carbon dioxide reached this level was more than 3 million years ago, when Arctic lands were covered with forests. The unprecedented rate of increase has been driven entirely by human-produced emissions. Projections from an array of scientific analyses summarized by the National Academy of Sciences and most of the world’s major scientific organizations indicate that by the end of this century, people will be experiencing higher temperatures than any known during human civilization — temperatures that our societies, crops and ecosystems are not adapted to.
New D.C. monument: The mall flood wall - Taxpayers are paying for the construction of a new wall on the National Mall. Longer than a football field, the wall has not been built to honor the nation’s fallen heroes or great leaders from our past. It has been quietly constructed over the past 2½ years to protect a vast swath of downtown Washington from a devastating flood. No longer a theory, climate change is here. The wall is a small part of the tens of billions of dollars Americans will have to pay in the future just to take the edge off the devastating effects of climate alteration. Without the flood wall the experts deem necessary, a monstrous stream of water could surge from the Potomac up 17th Street and curl for over 2½ miles through the heart of the city. Such a flood would inundate all of the national museums and the agencies along Constitution Avenue, as well as the Reflecting Pool, a piece of the Ellipse behind the White House, the Federal Triangle, the National Archives, the I-395 tunnel in front of the Capitol and the Federal Center in Southeast Washington. The damage to our national treasures would be literally beyond calculation. A 380-foot berm across 17th Street at a critical low “choke point” is the only way to stop the catastrophe from happening. The plan is that when the largest storms threaten to raise the Potomac, the Park Service would quickly seal off 17th Street with a 9-foot-tall insert in the wall, which now stretches from the grounds of the Washington Monument to the edge of the World War II Memorial. The project has stalled on the very last step: fabricating the critical finger-in-the-dike plug for the middle of the wall. Also, there is the little matter of trying to beautify the concrete to look like stone. The wall right now is universally regarded as an eyesore.
Time to switch to 'Plan B' on climate change: study: Climate policy makers must come up with a new global target to cap temperature gains because the current goal is no longer feasible, according to a German study. Limiting the increase in temperature to 2 degrees Celsius since industrialisation is unrealistic because emissions continue to rise and a new global climate deal won’t take effect until 2020, the German Institute for International and Security Affairs said. “Since a target that is obviously unattainable cannot fulfill either a positive symbolic function or a productive governance function, the primary target of international climate policy will have to be modified,” said Oliver Geden, author of the report, which will be released today as talks begin in Bonn. The study jars with the aim of United Nations negotiations, which have focused on reducing emissions quickly enough to prevent the worst effects of climate change. That ambition was thrown into doubt in May when scientific data showed carbon dioxide in the air passed a level not seen for millions of years. UN analysis shows current targets won’t keep temperature gains to 2 degrees.
Accelerating Ice Sheet Melt Is Raising Sea Levels, Says New Study Accurately Reported By Wall Street Journal - Is it big news that “Rising Sea Level Tied to Faster Melt,” as the Wall Street Journal reported today?Back in 2011, Jet Propulsion Lab researchers concluded that polar ice sheet mass loss is speeding up, threatening a 1 foot sea level rise by 2050. Last year, the most comprehensive analysis of all observational data found that Greenland ice sheet melt is up nearly five-fold since mid-1990s. But I think it qualifies as news when the Wall Street Journal actually does an original piece on one of the more worrisome threats from global warming — and gets it right. Indeed the Wall Street Journal reporters and editorial page editors are kind of like Edward Norton and Brad Pitt (respectively) in Fight Club (spoiler alert) raging a schizophrenic war with one another (literally). The WSJ editors set the first rule of global warming fight club — don’t talk about the threat of manmade global warming, The more sane half of the WSJ reported on a new study in Nature Geoscience, whose abstract explains: … we conclude that most of the change in ocean mass is caused by the melting of polar ice sheets and mountain glaciers. This contribution of ice melt is larger than previous estimates, but agrees with reports of accelerated ice melt in recent years.
The ‘Social Cost Of Carbon’ Is Almost Double What The Government Previously Thought - The U.S. government updated its estimate of how much carbon pollution harms the economy. They found that their previous estimated costs were too low — ranging from 50 to 100 percent depending on the year and the estimate. An interagency working group coordinated by the White House released something called the “Technical Update of the Social Cost of Carbon for Regulatory Impact Analysis” which is a complicated way of saying that when an agency calculates the economic costs and benefits of a regulation, it now has numbers that reflect more of the true economic impacts of climate change. This year’s Economic Report of the President defined the “social cost of carbon” as a monetized estimate of the damages caused by emitting an additional ton of carbon dioxide in one year. These damages cover “health, property damage, agricultural impacts, the value of ecosystem services, and other welfare costs of climate change.” Heather Zichal, President Obama’s top climate advisor, explained that these values “draw on the best available science to calculate the benefits of reducing greenhouse gas emissions.”
What economists say about carbon pricing - I last raised the issue of a carbon price in “What Unconventional Fuels Tell Us About the Global Energy System”, which added several data points to Charles C. Mann’s already thorough discussion of fossil fuels for The Atlantic. My conclusion is: a carbon price is needed to induce large-scale changes of how we produce and consume energy. It’s only part of the solution, but one that many experts say is needed to reduce carbon emissions. A more in depth discussion of carbon pricing will have to wait, but in the meantime, I direct the reader to several resources that I personally have found useful for understanding the economic rationale of a carbon price. There are several points I hope you take away from the readings:
- Economists largely agree that assigning a price to carbon is one of the least intrusive means for reducing carbon emissions.
- The resistance is largely lack of political will/public understanding.
- There are views in favor of pricing carbon across the political spectrum. It’s not simply a liberal/conservative or Democrat/Republican issue.
Roman seawater concrete holds the secret to cutting carbon emissions - Analysis of samples provided by team member Marie Jackson pinpointed why the best Roman concrete was superior to most modern concrete in durability, why its manufacture was less environmentally damaging – and how these improvements could be adopted in the modern world. "It's not that modern concrete isn't good – it's so good we use 19 billion tons of it a year," says Monteiro. "The problem is that manufacturing Portland cement accounts for seven percent of the carbon dioxide that industry puts into the air." Portland cement is the source of the "glue" that holds most modern concrete together. But making it releases carbon from burning fuel, needed to heat a mix of limestone and clays to 1,450 degrees Celsius (2,642 degrees Fahrenheit) – and from the heated limestone (calcium carbonate) itself. Monteiro's team found that the Romans, by contrast, used much less lime and made it from limestone baked at 900˚ C (1,652˚ F) or lower, requiring far less fuel that Portland cement. "In the middle 20th century, concrete structures were designed to last 50 years, and a lot of them are on borrowed time," Monteiro says. "Now we design buildings to last 100 to 120 years." Yet Roman harbor installations have survived 2,000 years of chemical attack and wave action underwater.
China Sticks to Carbon-Intensity Target, Dismisses CO2 Cap - China’s Chief Climate Negotiator Su Wei reaffirmed his nation’s commitment to lower emissions relative to economic output while dismissing reports that it will adopt an absolute cap on greenhouse gases. The Financial Times and Independent newspapers both said last month that China is looking to introduce a cap in 2016. The Independent cited a proposal by the National Development and Reform Commission, the economic planning agency where Su works. The FT cited Jiang Kejun, an NDRC carbon-policy researcher. “The paper quoted an expert,” Su said today in an interview in Bonn, where two weeks of climate talks began yesterday. “It’s not necessarily presenting the view of the government or the NDRC. The NDRC would reaffirm that we have committed to a carbon-intensity target by 2020.” Su’s comments are the first by a senior Chinese negotiator since the reports were published. While not an outright denial, they suggest China isn’t ready to announce a cap at the United Nations talks in Germany, where such a move may have spurred other nations to step up measures against global warming.
Lots of Energy, Little Access: Africa and Asia in the Dark - Some 1.2 billion people globally have no access to electricity, while 2.8 billion are forced to burn waste to cook and heat their homes, according to a recent World Bank-sponsored report. These are some crazy figures that significantly challenged the United Nation’s ambitious goal of ensuring that every person in the world has clean and modern electricity by 2030 While the fossil fuels keep pumping and new discoveries are coming on line continually thanks to technological advances that allow us to drill deeper and unlock unconventional hydrocarbons, this doesn’t necessarily translate into energy accessibility for developing countries. It translates into exports to feed Western consumers, mostly. Nor have renewable energy efforts managed to put a dent in this brand of poverty. Population growth is quickly out-pacing any progress towards increasing energy accessibility. The result is that energy accessibility seems to be at a standstill despite the progress. It isn’t gaining the necessary traction even though an additional 1.7 billion people were given access to electricity between 1990 and 2010. Populations are growing faster, so we’re back to the beginning with the math. It’s a problem largely spanning 20 countries in Africa and Asia.
Energy gains burned by burgeoning population - The world has made important progress towards improving energy efficiency and using more renewable sources of power over the last two decades, but the gains have barely been enough to keep up with population growth and surging energy demand, a new UN-backed report suggests. In the last 10 years, 1.7 billion people around the world gained access to electricity, but the world's population grew by 1.6 billion over that same period, nearly wiping out the gains. Similarly, rising energy demand effectively eliminated half the energy efficiency savings and 70 percent of the gains from growth in renewable energy over the past decade. "Even to stand still, we have to run extremely fast. That's the challenge," said Vivien Foster, a sustainable energy leader at the World Bank, and one of the lead authors of the Global Tracking Framework report, released on Friday. Based on household survey data from 180 countries around the world, the report examines progress over the last 20 years towards three sustainable energy goals the United Nations secretary general has set for 2030: universal access to electricity and fuel sources other than firewood or dung for cooking; a doubling of renewable energy as a share of global energy use; and a doubling of the annual rate of improvement in energy efficiency.
Hints of Climate Change Affecting the Electricity Grid - It's interesting reading the NERC 2013 Summer Reliability Assessment. Although it's not a focus of the report, reading between the lines you can see that climate change is going to have complex effects on the grid, and all of them increase the stress on it:
- Weather extremes, particular heat-waves, cause higher peak demands, and larger swings in power demand. For example, p1 refers to challenges in the Texas interconnect (ERCOT) as follows: "The Anticipated Reserve Margin for ERCOT is 12.88 percent for summer 2013. This is below the 13.75 percent target for ERCOT. Sustained extreme weather could be a threat to supply adequacy this summer.
- Drought (expected to increase under climate change) can affect the operation of thermal generation plants (both nuclear and fossil-fuel powered). Eg p4 says: "When water levels fall significantly, water intake structures may be exposed above the water surface, causing the plant to become nonoperational. Additionally, generators are less efficient as the temperature of cooling water increases and results in a reduction of the power capability of the plant.
- Drought more obviously reduces available hydro-electric generation, eg in the midwest this year (p5): The U.S. Army Corps of Engineers predicts that 2013 will be a drought year, and electric energy produced from the Missouri River will be approximately 80 percent of the historical average."
Sustaining a City in a Long-Term Power Outage - A few comments on this fascinating study from Pittsburgh (site of Carnegie Mellon, which is a center of excellence at studying critical infrastructure issues). The key theme that emerges for me is the interaction of the liquid fuel system (particularly diesel) and the electricity system. In a short outage, lots of critical infrastructure has diesel generator backup, and so the hospitals, 911-call centers, and so on can continue to operate. However, they typically have limited fuel storage capacity (if for no other reason than that diesel doesn't keep indefinitely), and so in a long outage, the availability of diesel becomes critical to keeping everything together. To illustrate the time factors, consider the water situation in Pittsburgh: . Most of the electricity required at the Aspinwall Water Treatment Plant (WTP) is consumed pumping water from the river. From the treatment plant, water is pumped to the three primary reservoirs. About half of the water from the primary reservoirs is delivered directly to homes and businesses. The other half is pumped to a series of smaller reservoirs, tanks, towers, and standpipes around the city.So a short outage is no big deal, but between the first few days and two weeks, things start to go really bad, until the point where everyone is dependent on emergency measures:Current emergency plans include distribution of water by tanker trucks (called water buffalos). Emergency response plans at the city and county level include steps to acquire these trucks from local governments and agencies. With a typical capacity of 2,500 gallons, these trucks would only be practical or providing minimal supplies of water. To provide all 370,000 people in Pittsburgh with an emergency one gallon ration of water per day of water would require 15 trucks working 18 hour days. To provide even 10% of normal drinking water supply would require 240 trucks
Don’t Let Utilities Get Away With Mercury Pollution -- Mercury is a potent neurotoxin, extremely dangerous for fetuses, infants and toddlers; it affects their developing brains, lungs and hearts. After 21 years—and a fierce battle in which you played an important role–in June 2012 the Mercury and Air Toxics Standards to significantly curtail mercury emissions from coal-fired power plants went into effect. Victory? Yowzers! I sure am politically naïve. I hadn’t understood that there is yet another level in the endless–and broken–rule-making process: lawsuits. The latest tactic of certain utilities is to spend millions of ratepayer dollars to tie up the important mercury rules in court — for years. Every year, over 400,000 U.S. newborns are affected by mercury pollution. When I was pregnant, decades ago, I was told by my doctor not to eat tuna because it was contaminated with mercury. But no one ever explained that we have mercury in our fish because of air pollution--toxic emissions spewing from coal-fired power plants, settling in our lakes, rivers and oceans, and entering the food chain.
- Lawsuits against mercury rules mean many more years of mercury and other toxins being spewed into our atmosphere.
- Lawsuits mean many more years of pregnant women, fetuses, infants and children being exposed to the hazards of mercury and other toxics.
- Lawsuits mean many more years of contaminated fish from America’s waters.
- Lawsuits mean many more years of cynically spending ratepayer dollars instead of spending on cleaning up toxic pollution.
World’s biggest coal company turns to solar – to save energy costs The world’s largest coal mining company – Coal India – is looking to innovative solution to reduce its own energy bills: it’s installing solar energy. The company, which is listed but government controlled, and which accounts for more than 80 per cent of coal production in India, is installing a 2MW plant at its Sampalbur coal plant in Odisha. It plans to install solar at its operations across the country, including at its mining research arm, the Central Mine Planning and Design Institut. Officials told local media DNA that the installation of solar PV at mines and staff housing areas is aimed at reducing Coal India’s own energy bills. But the most striking aspect of the decision is the company’s own recognition that fossil fuels are depleting, and that solar is approaching grid parity. “India has an abundance of sunshine and the trend of depletion of fossil fuels is compelling energy planners to examine the feasibility of using renewable sources of energy like solar, wind, and so on,” Coal India’s bid document said.
Alaska’s Bristol Bay mine project: Ground zero for the next big environmental fight? - A dispute over a proposed copper and gold mine near Alaska’s Bristol Bay may be one of the most important environmental decisions of President Obama’s second term — yet few are even aware that the fight is happening. At issue is a proposed mining operation in a remote area that is home to several Alaskan native tribes and nearly half of the world’s sockeye salmon. Six tribes have asked the Environmental Protection Agency to invoke its powers under the Clean Water Act to block the mine on the grounds that it would harm the region’s waterways, fish and wildlife. The two mining firms behind the project, Northern Dynasty and Anglo American, have struck back with a major lobbying and public-relations campaign aimed at derailing any EPA intervention. The Bristol Bay dispute has been largely overshadowed by the high-profile battle over the proposed Keystone XL oil pipeline from Canada to Texas, which has prompted strong opposition from environmental groups and which requires approval from the State Department to proceed. Environmentalists argue that the Bristol Bay project poses a serious threat to the area’s delicate ecosystem and to the local fishing industry. Fishing businesses and tribal leaders, who have often quarreled, have banded together to oppose it.“If we don’t protect this, we’ll have nothing to fight over in the future,” “This is the last place on Earth like this.”
This Is Capitalism Now: How a Coal Company Bilked 20,000 Workers Out of Health Benefits - That's the spin-off company of Peabody Energy, the country's biggest coal producer, that was larded up with 40 percent of its parent company's healthcare liabilities and just 13 percent of its assets back in 2007. A year later, Patriot saddled itself with even more obligations when it bought Magnum Coal, itself a subsidiary of Arch Coal, the nation's second-largest coal company. The end result of all this financial chicanery was Patriot getting stuck holding the bag of retiree health benefits for 22,000 people -- 90 percent of whom never worked a day for Patriot, but rather for Peabody or Arch. Well, guess what. Patriot went bust. And now, as the Wall Street Journal reports, a bankruptcy judge has ruled that it can discharge its $1.6 billion of union healthcare obligations and replace it with ... a $300 million trust, "tens of millions" more in revenue sharing, and 35 percent of the stock of the new Patriot Coal. Not much. Now, it's not completely clear if Peabody deliberately designed Patriot to fail -- that got a "maybe" or "maybe not" from the judge -- as Temple University business professor Bruce Rader has argued. But it is clear that Peabody dumped the legacy liabilities and assets it didn't want in Patriot, which, being generous, added several degrees of difficulty to it being a going concern.
Gas leaks undermine climate benefit from switch: Leaks in the production and delivery of natural gas threaten to undermine the benefits to the climate from expanded use of the fuel in manufacturing, transportation and appliances such as heaters, according to a report. Advanced drilling techniques that are unlocking reserves, promising to supply the U.S. with enough gas for almost 100 years, also trigger stray emissions that must be plugged to achieve national goals, according to a report released today by the Center for Climate and Energy Solutions, a nonprofit group advocating policies for tougher rules to limit the gases. Emissions tied to global warming are falling as utilities switch to gas, which produces half the carbon dioxide as burning coal to generate electricity, according to the report. Further savings are possible by using gas for home water heaters and heavy trucks.
Drillers Silence Fracking Claims With Sealed Settlements - Chris and Stephanie Hallowich were sure drilling for natural gas near their Pennsylvania home was to blame for the headaches, burning eyes and sore throats they suffered after the work began. The companies insisted hydraulic fracturing -- the technique they used to free underground gas -- wasn’t the cause. Nevertheless, in 2011, a year after the family sued, Range Resources Corp (RRC). and two other companies agreed to a $750,000 settlement. In order to collect, the Hallowiches promised not to tell anyone, according to court filings. The Hallowiches aren’t alone. In cases from Wyoming to Arkansas, Pennsylvania to Texas, drillers have agreed to cash settlements or property buyouts with people who say hydraulic fracturing, also known as fracking, ruined their water, according to a review by Bloomberg News of hundreds of regulatory and legal filings. In most cases homeowners must agree to keep quiet. The strategy keeps data from regulators, policymakers, the news media and health researchers, and makes it difficult to challenge the industry’s claim that fracking has never tainted anyone’s water. Because the agreements are almost always shrouded by non-disclosure pacts -- a judge ordered the Hallowich case unsealed after media requests -- no one can say for sure how many there are. Some stem from lawsuits, while others result from complaints against the drillers or with regulators that never end up in court.
Interior Department adds 60 days to comment on drilling rule - The Washington Post: Companies that drill for oil and natural gas — and their critics — will have 60 more days to comment on a new rule regulating hydraulic fracturing operations on public lands. Interior Secretary Sally Jewell announced the extension Thursday after industry groups and environmentalists said they needed more time to digest a 171-page “fracking” rule issued last month. The rule requires companies for the first time to disclose publicly the chemicals used in fracking operations. It also sets standards for proper construction of wells and disposal of wastewater.Jewell called the rule a “common-sense update” that increases safety while also providing flexibility and improving coordination with states and Indian tribes. Drilling regulations were last changed in 1982.
Tar sands supporters suffer setback as British Columbia rejects pipeline - Efforts to expand production from the Alberta tar sands suffered a significant setback on Friday when the provincial government of British Columbia rejected a pipeline project because of environmental shortcomings. In a strongly worded statement, the government of the province said it was not satisfied with the pipeline company's oil spill response plans. The rejection of the pipeline – which was to have given Alberta an outlet to Pacific coast ports and markets in China – further raises the stakes on another controversial tar sands pipeline, Keystone XL. Barack Obama is still weighing a decision on that pipeline, intended to pump tar sands crude to the Texas gulf coast. British Columbia, in its official submission to a pipeline review panel, said the company had failed to demonstrate an adequate clean-up plan for the Enbridge Northern Gateway project. It set five new conditions for the project's approval. "Northern Gateway has presented little evidence about how it will respond in the event of a spill," "It is not clear from the evidence that Northern Gateway will in fact be able to respond effectively to spills either from the pipeline itself, or from tankers transporting diluted bitumen," Jones added.
Map: Another Major Tar Sands Pipeline Seeking U.S. Permit - While all eyes are on TransCanada's Keystone XL pipeline, another Canadian company is quietly building a 5,000-mile network of new and expanded pipelines that would achieve the same goal as the Keystone. In fact, the project by Enbridge, Inc., Canada's largest transporter of crude oil, would bring even more Canadian oil into the U.S. than the much-debated Keystone project. Enbridge has already begun growing its existing pipeline infrastructure to increase the flow of Canadian and U.S.-produced oil into refineries and ports in the Midwest, Gulf Coast and Northeastern Canada. The company's plans have largely escaped public scrutiny, in part because its expansion has proceeded in many segments and phases. The linchpin of Enbridge's Canadian oil transport system is its proposal to increase the capacity of Line 67 (often referred to as the Alberta Clipper pipeline) to bring an additional 430,000 barrels a day of oil into the United States. Line 67 runs from Hardisty, Alberta to Superior, Wisc. and currently ships up to 450,000 barrels of oil a day. Enbridge wants to expand the line’s capacity to 570,000 barrels a day, with the possibility of future growth to 880,000 barrels a day. That's larger than the Keystone XL's proposed daily capacity of 830,000 barrels.
Alberta bitumen: Diluent shortages could make for sticky situation -Alberta’s bitumen growth prospects could slow on shortages of a much lighter product as companies opt to send crude directly to refineries on the U.S. Gulf Coast and in Asia rather than process the stuff at home. Demand for diluent, industry slang for super-light oil called condensate and other natural gas liquids that is blended with bitumen so it can flow in pipelines, is poised to skyrocket as companies such as Imperial Oil Ltd. and Suncor Energy Inc. balk at building hugely expensive upgrading plants that convert raw production into a refinery-ready oil. The reluctance to invest in costly processing comes with oil sands output projected to double to 3.8 million barrels by 2022, according to Alberta’s energy regulator. That could push demand for diluent from about 330,000 barrels a day last year to roughly 935,000 barrels, data from the Energy Resources Conservation Board show, stoking concerns over condensate pricing and potential shortages as imports struggle to match blending needs.
Who The US Imports Crude Oil From - There is energy independence, and then there are crude oil imports, which according to just released and revised Census data, amounted to 233,215 thousand barrels in April, and 914,456 thousand barrels year to date (just under 3 billion annualized). For those unaware who the most important US crude oil trading partners are, here is the updated list of the main countries that serve to fuel America's industrial infrastructure and its engines, in the off chance that the Tesla electric revolution fails to deliver.
IMF Recycle Peak Oil Theory- Since late 2012, on several occasions, the deputy chief of financial modeling at the IMF (International Monetary Fund), Michael Kumhof, has said in interview that: "Ignoring the peak oil issue would be highly unscientific, even irresponsible". While the IMF remains officially neutral on the subject, Kumhof and his colleagues claim to be certain that the scientific basis of their concern, which includes the thermodynamic theory of entropic energy dissipation, is inexorable. In a certain timespan - which they do not define - oil prices could rise by "up to 800%" compared with current prices. To the extent that Kumhof sets timeframes, this process of rising oil prices might begin by 2017 and, Kumhof claims, will go on "for ever".Possibly not unrelated to IMF concern in Peak Oil. Goldman Sachs has on several occasions, since late 2012, issued statements on oil which signal the same "scientific" concern. "Goldman Sachs said the (oil) industry is chronically incapable of meeting global needs (adding that) it is only a matter of time before inventories and OPEC spare capacity become effectively exhausted, requiring higher oil prices to restrain demand. Economists, politicians and the public will continue to deny and ignore the facts, pointing to other factors as the root causes of the state of the economy. Now more than ever, countries like the USA need leaders that are capable of understanding our predicament and lead onto a new path forward".
Rising Costs are Putting Limits on Energy Production - The energy limit we are running into is a cost limit. I would argue that neither the Republican or Democrat approach to solving the problem will really work.The Republicans favor “Drill Baby Drill”. If the issue is that the price of oil extraction is too high, additional drilling doesn’t really fix the problem. At best, it gives us a little more expensive oil to add to the world’s supply. The Wall Street research firm Sanford Bernstein recently estimated that the non-Opec marginal cost of production rose to $104.50 a barrel in 2012, up more than 13 per cent from $92.30 a barrel in 2011. US consumers still cannot afford to buy high-priced oil, even if we extract the oil ourselves. The countries that see rising oil consumption tend to be ones that can leverage its use better with cheaper fuels, particularly coal (Figure 1). See Why coal consumption keeps rising; what economists missed. The recent reduction in US oil usage is more related to young people not being able to afford to drive than it is to improved automobile efficiency. See my post, Why is gasoline mileage lower? Better gasoline mileage?
Costs rise for ‘technological barrels’ of oil - FT.com: New technologies such as fracking in the US shale industry are boosting crude oil supplies – but these new “technological barrels” are flowing at a high cost. Sanford C. Bernstein, the Wall Street research company, calls the rapid increase in production costs “the dark side of the golden age of shale”. In a recent analysis, it estimates that non-Opec marginal cost of production rose last year to $104.5 a barrel, up more than 13 per cent from $92.3 a barrel in 2011. The big increase will have implications both for the market and oil companies, helping to put a floor to energy prices but also capping the profitability of the sector. At the epicentre of the shale revolution is the US, and it represents a paradigm of the cost of technology. Sanford C. Bernstein found an “unprecedented” spike in the US oil marginal cost last year, jumping to $114 a barrel, up from $89 in 2011. Christophe de Margerie, chief executive of Total, the French oil producer, last month warned that technology is not reducing marginal costs in the oil industry. Instead, he said: “What we call technological barrels are day after day more expensive.” The trend of rising production costs in the US shale and Canadian tar sands is of particular concern, as the International Energy Agency – the Western’s countries oil watchdog – anticipates that 40 per cent of the incremental oil production capacity over the next five years will come from North America. US shale and Canadian tar sands production is even more important for the non-Opec supply outlook. The IEA forecasts that North America will account for roughly 65 per cent of non-Opec production capacity growth until 2018.
If Oil Prices Rise the EU May not Survive - Kicking an economy when it’s down! The European Union may be asking when it will all end? Having not yet fully recovered from the banking crisis the EU is likely to now suffer at the hands of high oil prices. Analysts are divided as to how long, and how big, the US shale oil boom will last for. PricewaterhouseCoopers believes that shale oil production will continue to grow, flooding the market with oil and sending prices 40% lower than current levels by 2035. Other analysts believe that the US shale boom will begin to decline over the next few years, at which point European Prices will become very susceptible to OPEC output, which they also believe will decline, sending prices soaring. Daniel Lacalle, the senior portfolio manager at investment management firm Ecofin, believes that “oil prices as they are right now are going to be unsustainable. There is all this 'oomph' about shale oil, but it does not alter the fact that there is still a shrinking amount of exportable capacity in OPEC and that's what drives the supply and demand scenario for the European Union. I think Brent getting stronger to WTI (light sweet crude) is a very likely picture in the coming months.” The EU is far behind other developed nations when it comes to their stage of recovery after the global financial crisis, and if it comes down to a battle for oil supplies as prices increase then they are unlikely to be able to afford enough supply to meet their needs.
U.S. Sinks Nails in Iranian Economic Coffin - Oil priced at around $100 per barrel means Iran for May was out around $300 million in oil revenue because of Western economic sanctions. A U.S. Treasury Department official said sanctions are taking a slice out of oil revenue for the Islamic republic after years of pressure and May exports of oil from Iran may be at record lows. Sanctions are meant to starve Iran of the finances it needs to support its nuclear research. Following a damning report from the IAEA, the country may find itself with its back against the wall unless it changes course and fast. Crude oil shipments from Iran declined in May to around 700,000 barrels per day, which may be the lowest level in decades. Assuming a price per barrel of around $100, Iran lost more than $300 million in oil export revenue from April to May. April exports were already hit when Japan announced it almost completely stopped purchasing Iranian crude.
China Is Reaping Biggest Benefits of Iraq Oil Boom - Since the American-led invasion of 2003, Iraq has become one of the world’s top oil producers, and China is now its biggest customer. China already buys nearly half the oil that Iraq produces, nearly 1.5 million barrels a day, and is angling for an even bigger share, bidding for a stake now owned by Exxon Mobil in one of Iraq’s largest oil fields. “The Chinese are the biggest beneficiary of this post-Saddam oil boom in Iraq,” said Denise Natali, a Middle East expert at the National Defense University in Washington. “They need energy, and they want to get into the market.” Before the invasion, Iraq’s oil industry was sputtering, largely walled off from world markets by international sanctions against the government of Saddam Hussein, so his overthrow always carried the promise of renewed access to the country’s immense reserves. Chinese state-owned companies seized the opportunity, pouring more than $2 billion a year and hundreds of workers into Iraq, and just as important, showing a willingness to play by the new Iraqi government’s rules and to accept lower profits to win contracts. “We lost out,” said Michael Makovsky, a former Defense Department official in the Bush administration who worked on Iraq oil policy. “The Chinese had nothing to do with the war, but from an economic standpoint they are benefiting from it, and our Fifth Fleet and air forces are helping to assure their supply.” The depth of China’s commitment here is evident in details large and small.
Small African Country To "Seize" Chinese Oil Exploration Assets - It's one thing for broke Argentina to nationalize assets of just as broke Spain. However when tiny west-African country Gabon decides to "seize" assets from three international oil companies including China's petrochemical giant Sinopec, things not only get interesting, but puts a brand new pawn on the global geopolitical chessboard. But why is Gabon seeking to antagonize some of the primary participants in its crude extraction supply chain? Simple: leverage, or its own perception thereof. As the FT reports, this surprising move comes as Gabon prepares to "launch a licensing round for the deep waters off its coast. Experts say reserves in the Gabon Basin could rival deep offshore discoveries in Brazil."
The “Chinese Dream” Come True: Gobbling Up Assets Overseas - The “Chinese dream” is the dream of the whole nation and also of every individual Chinese, explained Fu Ying, chairwoman of the Foreign Affairs Committee of the National People’s Congress. The slogan had been coined by President Xi Jinping after he’d ascended to the throne of the Communist Party. It would benefit the world, she said. But for the richest Chinese, it has already come true. So Chinese real estate mogul Zhang Xin bought a big stake in the iconic 50-story white-marble General Motors Building in Manhattan. A few days ago, Shuanghui International Holdings, China’s largest meat processor, offered to acquire Smithfield Foods, the largest pork producer in the US, a couple of months after 16,000 dead pigs floated down the Huangpu River into Shanghai. Maybe, Shuanghui wants to obtain Smithfield’s expertise in food safety; or maybe it just wants to find a place outside China to park a few billions. Other industries have seen similar purchases, particularly the automotive component sector. Or what’s left of it in the US, as many component makers have already moved their production and in some cases even their design centers to China in search of cheap labor. It shows: for the first four months of 2013, imports of Chinese auto components have swollen to over $5 billion and will soon be in second place, behind Mexico but ahead of Japan and Canada.
China’s Economic Empire -THE combination of a strong, rising China and economic stagnation in Europe and America is making the West increasingly uncomfortable. While China is not taking over the world militarily, it seems to be steadily taking it over commercially. By buying companies, exploiting natural resources, building infrastructure and giving loans all over the world, China is pursuing a soft but unstoppable form of economic domination. Beijing’s essentially unlimited financial resources allow the country to be a game-changing force in both the developed and developing world, one that threatens to obliterate the competitive edge of Western firms, kill jobs in Europe and America and blunt criticism of human rights abuses in China. Ultimately, thanks to the deposits of over a billion Chinese savers, China Inc. has been able to acquire strategic assets worldwide. This is possible because those deposits are financially repressed — savers receive negative returns because of interest rates below the inflation rate and strict capital controls that prevent savers from investing their money in more profitable investments abroad. Consequently, the Chinese government now controls oil and gas pipelines from Turkmenistan to China and from South Sudan to the Red Sea. Another pipeline, from the Indian Ocean to the Chinese city of Kunming, running through Myanmar, is scheduled to be completed soon, and yet another, from Siberia to northern China, has already been built. China has also invested heavily in building infrastructure, undertaking huge hydroelectric projects like the Merowe Dam on the Nile in Sudan — the biggest Chinese engineering project in Africa — and Ecuador’s $2.3 billion Coca Codo Sinclair Dam. And China is currently involved in the building of more than 200 other dams across the planet, according to International Rivers, a nonprofit environmental organization.
The China Dance: It Ain’t No One Step - I found this long critique of Chinese expansionary economics in this AMs NYT to be pretty misguided. Lots of good info and the authors did their homework, but their core thesis seemed wrong to me: I don’t agree with the assertion that “Beijing’s essentially unlimited financial resources” support China’s pursuit of “… a soft but unstoppable form of economic domination,” allowing “…the country to be a game-changing force in both the developed and developing world, one that threatens to obliterate the competitive edge of Western firms, kill jobs in Europe and America and blunt criticism of human rights abuses in China.” That’s both non-economic and over-the-top in ways I’ll stress below.
- –There’s too little of the Michael Pettis/Martin Wolf style analysis of simple balance-of-payment identities that underlie a lot of what’s going on here. These imbalances are highly problematic and damaging for sure, but they’re the stuff of demand excesses and shortfalls, not world domination.
- –In this regard, let’s be very clear that there’s a two-step going on, with the US and others as willing dance partners. Our policy makers have happily absorbed excess Chinese (and other surplus countries’) savings, exporting scads of demand/jobs and supporting large US trade deficits (meanwhile, obsessing over far less damaging–to the contrary, necessary in the downturn–budget deficits).
China Manufacturing Tops Estimates in Sign Growth Is Stabilizing - China’s manufacturing unexpectedly accelerated in May, indicating that a slowdown in economic growth in the first quarter may be stabilizing. The Purchasing Managers’ Index rose to 50.8 from 50.6 in April, the National Bureau of Statistics and China Federation of Logistics and Purchasing said in Beijing yesterday. That was higher than all estimates in a Bloomberg News survey of 30 analysts and compares with the median projection of 50, which marks the dividing line between expansion and contraction. The report may provide some comfort to policy makers after the preliminary reading of a private manufacturing survey pointed to the first contraction in seven months. Premier Li Keqiang said last week that government measures to reform the economy will be accompanied by tapered-off levels of growth and warned last month that new stimulus would create risks.
China’s Tiananmen Mothers criticize Xi for lack of reforms (Reuters) - A group of families demanding justice for the victims of China's 1989 Tiananmen Square crackdown has denounced new President Xi Jinping for failing to launch political reforms, saying he was taking China "backwards towards Maoist orthodoxy". The Tiananmen Mothers activist group has long urged the leadership to open a dialogue and provide a reassessment of the 1989 pro-democracy movement, bloodily suppressed on June 4 that year by the government which labeled it "counter-revolutionary". In an open letter released on Friday through New York-based Human Rights in China, the group said Xi "has mixed together the things that were most unpopular and most in need of repudiation" during the time of former paramount leaders Mao Zedong and Deng Xiaoping, the latter who oversaw the suppression of the protests. "This has caused those individuals who originally harbored hopes in him in carrying out political reform to fall into sudden disappointment and despair," the group said.
China’s Minsky Moment - Late last week, Society Generale published a succinct note explaining its view of why China’s credit growth is accelerating but its growth is not. In the first quarter, China’s total credit growth – bank loans, shadow banking credit and corporate bond together – accelerated to the north of 20% yoy, more than twice the pace of nominal GDP growth. This gap has been widening since early 2012. True, the gap was once close to 30ppt in 2009 and credit growth looked like leading economic growth most of the time in the past ten years. However, we still think the recent divergence is particularly worrying. Since 2009, China’s credit growth has outpaced nominal GDP growth in every quarter except one (Q4 11), whereas, in previous years, economic growth managed to better credit growth more than half of the time. The excess borrowing that occurred in 2009 has never been absorbed by the real economy and now more borrowing is being piled on top of this. In addition, the credit binge in 2009 was a result of the exogenous policy shock engineered by Beijing. However, this time, the economic slowdown as well as the credit pick-up is largely endogenous… Another big difference between the current situation and that which occurred in 2009 is the greater and increasing presence of non-bank credit…Borrowing from shadow channels like trusts are hardly a voluntary choice, as costs are often stiflingly high and duration unpleasantly short. Hence, there is an issue of adverse selection. It is those who are unable to roll over bank loans that have to tap the shadow banking system and refinance at more demanding terms…
Is China the new Brazil? - The biggest external risk concerns China. Its real exchange rate has become overvalued. It is heavily exposed to developed world countries ratcheting down their real exchange rates. Since abandoning the fixed 8.28 yuan/dollar rate in 2005, China’s unit labour costs have been rising at 7 per cent a year, and its currency by 4 per cent, for a combined annual 11 per cent in dollars. Overvaluation became a serious problem in 2011. Producer price inflation (PPI) of 7 per cent then matched unit labour costs (in yuan), but crumpled into 2-3 per cent producer price deflation over the past couple of years. April’s 2.6 per cent deflation has intensified from 1.6 per cent in February. Chinese businesses have to slash prices to keep a grip on their export markets. But unit labour costs are still rising at a 5 per cent rate, squeezing profit margins, and are up 20 per cent relative to the export competition since 2011.Adding to this problem is the sudden, related, swing into high real interest rates. In mid-2011, the one-year lending rate from state-owned banks was 6.6 per cent, which combined with 7 per cent PPI to give a slightly negative real rate. But a flight of depositors from China’s banks has kept nominal interest rates high. The nominal interest rate is only down to 6 per cent now, but combined with PPI deflation, the real interest rate is close to 9 per cent. Such high real interest rates combined with squeezed profit margins have pushed China into a prolonged “investment-led” slowdown. That is from Charles Dumas, here is more. Dumas also notes that China is especially heavily invested in assets which are interest-rate sensitive in value.
China takes tit-for-tat move against EU wine exports - FT.com: China has launched a trade investigation into European wine exports, in apparent retaliation for Europe’s proposed tariffs on Chinese solar panels, sharply escalating the dispute between two of the world’s largest trading partners. The investigation comes just one day after the EU offered an olive branch to Chinese solar-panel makers, announcing a temporary lowering of tariffs on Chinese panels while the two sides try to negotiate a solution to their long-running trade dispute. The Chinese Ministry of Commerce said it welcomed negotiations over the solar market, but in the same statement added that it was investigating anti-dumping measures and countervailing duties for European wine exports. The imposition of duties on European wines by Beijing would be a blow to the continent’s producers. China is the fastest growing wine market in the world, and already the fifth-largest globally, according to a recent study by the IWSR, a wine consultancy. Although red and white wines have not traditionally been part of Chinese cuisine, demand has been soaring as newly affluent consumers develop a taste for imported wines.
China has more cards to play in EU trade dispute - China still has plenty more cards to play in an increasingly ugly trade dispute with the European Union, the official People's Daily newspaper said on Thursday, accusing Europe of not realizing that its global power was waning. The EU will impose duties on imports of Chinese solar panels from this week, a move that infuriated Beijing despite European attempts to soften the blow with a reduced rate. China in response announced on Wednesday its own anti-dumping and anti-subsidy probe into imports of wine from the EU. "We have set the table for talks, (yet) there are still plenty of cards we can play," the newspaper wrote. "China does not want a trade war, but trade protectionism cannot but bring about a counter-attack." A declining Europe needs to understand it can no longer laud it over other countries, the paper added.
Paris threatens to block EU-US talks as China trade war looms - FT.com: Paris is threatening to block EU-US trade talks that Britain wants to launch at this month’s G8 summit in Northern Ireland if French demands to exclude cultural industries such as music and film are not met. Washington, London and Brussels are pushing hard for a new transatlantic trade agreement to boost the US and European economies, with President Barack Obama swinging his weight behind the move. But France has mounted a fierce campaign to defend l’exception culturelle – an internationally-agreed system that allows subsidies, tax breaks and quotas to protect local film, television and music industries from being swamped by mainly American, English-language products. President François Hollande has made preserving the system a “red line” for agreeing to talks. The move comes as Europe faces intensifying trade tensions with China, which has launched an investigation into European wine exports. European officials believe the move was a retaliation for Europe’s proposed tariffs on Chinese solar panels. On the EU-US trade talks, David Cameron, the UK prime minister, and the European Commission want Europe to put as much on the table as possible at the start of the negotiations – including the audio-visual sector – while leaving open the prospect of protecting key sectors at the end of the talks. In a recent letter to the European Commission, the EU’s executive arm, and all her EU counterparts, Nicole Bricq, the trade minister, warned of “the risks that a refusal to explicitly exclude audio-visual services from the scope [of the talks] would pose to the very launch of negotiations”. A senior French official said: “Our position is clear. If audio-visual is not excluded there will be no mandate to start the talks.”
Nicaragua gives Chinese firm contract to build alternative to Panama Canal - Nicaragua has awarded a Chinese company a 100-year concession to build an alternative to the Panama Canal, in a step that looks set to have profound geopolitical ramifications. The president of the country's national assembly, Rene Nuñez, announced the $40bn (£26bn) project, which will reinforce Beijing's growing influence on global trade and weaken US dominance over the key shipping route between the Pacific and Atlantic oceans. The name of the company and other details have yet to be released, but the opposition congressman Luis Callejas said the government planned to grant a 100-year lease to the Chinese operator. The national assembly will debate two bills on the project, including an outline for an environmental impact assessment, on Friday. Nicaragua's president, Daniel Ortega, said recently that the new channel would be built through the waters of Lake Nicaragua. The new route will be a higher-capacity alternative to the 99-year-old Panama Canal, which is currently being widened at the cost of $5.2bn. Last year, the Nicaraguan government noted that the new canal should be able to allow passage for mega-container ships with a dead weight of up to 250,000 tonnes. This is more than double the size of the vessels that will be able to pass through the Panama Canal after its expansion, it said.
Major World Bank Report Survives Challenge from China - World Bank President Jim Yong Kim is resisting calls by China and other nations to dilute a key report that ranks countries’ business climates.. China last year was listed behind Kazakhstan, Tunisia, Ghana and 87 other countries in the bank’s “Doing Business” report. The rankings of 185 economies are based on 10 indicators, such as the permitting process, access to electricity, protecting investors, paying taxes, enforcing contracts and resolving failed firms. Mr. Kim said in a statement Friday he’d received a preliminary review — from the chairman of the independent panel set in place last fall — on how the report could be improved. While there may be daylight between the panel’s recommendations and Mr. Kim’s views of the report, the bank president said this year’s report would “proceed as planned.” China, emboldened by its growing global economic clout, has been leading a pack of disgruntled nations rankled over the report. The world’s second-largest economy, ranked No. 91 in last year’s report, wants to eliminate the rankings altogether in the report. It has been prodded on by India, Brazil and France, which itself lagged behind Mauritius and Estonia.
The Asian Housing Bubble Burst - The experience of the Asian financial crisis in 1997-98, in which excess private indebtedness played a big role in causing the crisis in South Korea and Thailand, had provided a salutary lesson to most of developing Asia in the subsequent decade. So it could have been expected that allowing excessive private credit expansion, especially for private retail credit for housing, automobiles and other consumption, is something that would be anathema to Asian countries, especially those that had already gone through one round of devastating financial crises. Yet, in the aftermath of the Great Recession of 2008, many Asian developing countries actually encouraged the growth of consumer credit bubbles as a means to more rapid recovery, accentuating a process that had already been eased by financial liberalisation from 1999 onwards.The result has been an explosion in heavily leveraged consumption as well as in residential real estate activity, even in economies where wage incomes have not increased that much, such as the Republic of Korea. And the impact has been most strongly felt in the housing market. From early 2009, as Charts 1 and 2 show, residential prices in several Asian economies soared dramatically for at least two years.This has been most evident in Hong Kong, where house prices have more than doubled since early 2009. In 2012, when global residential real estate prices increased by around 4 per cent, prices in Hong Kong rose by 24 per cent. It is now the most expensive place on earth, with property prices significantly higher than in New York, London or Shanghai.
Japan Monetary Base Surges 31.6% In May - The monetary base in Japan spiked 31.6 percent on year in May, the Bank of Japan said on Tuesday, standing at 154.141 trillion yen. That followed the 23.1 percent annual increase in April. Banknotes in circulation were up 3.1 percent on year, while coins in circulation added an annual 0.9 percent. Current account balances surged 108.1 percent to 66.305 trillion yen - including a 117.0 percent spike in reserve balances. The seasonally adjusted monetary base climbed 137.7 percent to 156.985 trillion yen.
Nikkei Disses Third Dose of Abenomics, Falls Nearly 4% - Yves Smith - The initial salvo took place last fall when Abe announced aggressive fiscal spending. In April, the Japanese central bank committed to hitting a 2% inflation target, which pushed the yen lower and put the Nikkei, which had already appreciated 50% from its lows, on a new upward trajectory. But to restort to that old Yankee saying, it’s not clear you can get there, meaning to a decent level of growth, from here, which for Japan is a country with terrible demographics and a backdrop of weak global growth.Now G-20 members are attuned to the dangers of beggar-thy-neighbor currency and trade policies. Weirdly, Japan allowed China to push the yen into the nosebleed territory of 80 to the dollar and keep it there. Now, even though a fall to 100 is a large move, the yen was in the 110 to 140 v. the greenback range from the mid-1990s to the unwind of the carry trade during the crisis. So while the fall is helpful, it’s not even to the level of the 1990s, and that was insufficient to spur an export-driven recovery. And Japan’s trade partners are already saber-rattling. South Korea and Germany are already unhappy with the fall of the yen, although South Korea’s trade figures aren’t yet showing enough damage to give it the moral high ground.
Japanese Hodgepodge Of Old Ideas And New Contradictions, Stocks Dive In Sympathy - The leaders of Japan Inc. listened politely as Prime Minister Shinzo Abe laid out his intricately-woven master plan, the cornerstone of Abenomics that would fix everything and offer big handouts to Japan Inc. Yet, as his words seeped out, the Nikkei dove 5% from its intraday high in a couple of hours. Not exactly a ringing endorsement. His plan was a veritable laundry list of reforms, tweaks, cosmetic surgeries, and vague but nearly revolutionary changes. So he wanted to increase the number of women in the workforce, and that’s a good thing to say in modern times. But the problem in Japan isn’t that women aren’t in the workforce, it’s that they rarely make it into upper management, and almost never to the top. The bureaucracy, the government, Japan Inc., even the yakuza – they’re run by guys. He wanted to promote industrial innovation and proffered tantalizing tidbits about tax incentives and other handouts for the corporate welfare state to get companies to invest more. But they are investing – in China, Bangladesh, Mexico, even the US. In Japan, during the first quarter, the undisputed glory days of Abenomics, they cut investments by 3.9% from a year ago. He wanted to raise wages by 3% a year to protect workers’ purchasing power from the inflation that the Bank of Japan has vowed to unleash upon them. But these wage increases are private-sector decisions beyond his control, and they’d fly in the face of declining real wages in the US and other Western countries and would make Japanese production less competitive. This would coincide with his wish to foster competition in Japan by entering into more Free Trade Agreements....
Leverage Versus Debt - Europe, Japan and America are printing money at an extraordinary rate. It has reduced the cost of debt to negligible levels. Usually this is explained with reference to what is happening in the conventional economy, but I suspect there may be another explanation. The systemic effects of the bizarre financial system that we have created, which is based on leverage. That leverage, which is thought of as debt, is not really what we mean by debt. One of the features of the explosion of derivatives in the last 15 years, the rise of “meta money”, is that it was achieved through the creation of massive amounts of leverage. When Long Term Capital Management nearly destroyed the world financial system in 1998, it was done through a highly leveraged play on the rouble. LTCM was brought undone when Russia defaulted on its bonds. Nothing was learned, and the creation of this meta money was encouraged rather than stopped. Derivatives are now more than twice the capital stock of the world. Oh what fools these mortals be.The reason so much leverage is used is that the investment plays can be quite small, based on fairly incremental changes in price. But those small changes can be amplified using huge levels of debt/leverage. Leverage games, especially in the high frequency trading arena, can occur in micro-seconds, perhaps even nano-seconds. This means that the interest rate on the debt is rendered fairly meaningless. If the debt has, say, a 7% interest rate, that is the return over a year. If you incur that debt for only a few minutes, or even a day, the interest costs are so negligible as to be unimportant. All that matters is what happens to the price of the asset that is the subject of the investment play.
Market not buying RBA's optimism - Australia's central bank left rates on hold yesterday as was generally expected. The RBA continues to be quite hawkish as well as relatively optimistic (perhaps too optimistic) on the nation's economy. Given the "cash rate" is at historical lows at 2.75% (see post from November on the topic), the board wants to leave room for further action should the need arise (there are only so many "bullets" left before you hit zero). Australia's interbank rates (to the extent any of the quotes are real) seem to be following the RBA rates to new lows as well. The Guardian: - The Reserve Bank of Australia (RBA) has kept the cash rate unchanged at the record low of 2.75% at its June board meeting, saying that rate cuts in the past 18 months are helping the economy. The RBA last cut the cash rate by a quarter of a percentage point at its May meeting, after making four cuts in 2012. That's quite an optimistic view, particularly given some of the headwinds facing Australia's economy after a long period of strong growth. The Sydney Morning Herald: - Clouds are massing on Australia's economic horizon after new data showed a sharper-than-expected slowdown in GDP growth over the year to March. The national economy, which is in its 22nd consecutive year of expansion, grew 0.6 per cent in the first quarter of 2013, taking the growth for the year to 2.5 per cent, according to figures from the Australian Bureau of Statistics. So far the markets are not buying RBA's optimism. Concerns over the economy combined with a general risk-off sentiment sent the Australian dollar to a multi-year low of 0.95 today.
Ninety Cents Buys Safety on $22 Jeans in Bangladesh - For just pennies per t-shirt or pair of trousers produced, garment manufacturers could build factories where workers get a decent wage, maternity leave, and overtime, where chemicals and fumes are properly vented, and where hallways and fire exits are well lit and wide enough for everyone inside to flee any danger. Tipu Munshi can explain how. The member of parliament and millionaire owner of Sepal Group, one of the country’s biggest garment manufacturers, charges $1.16 to sew a pair of jeans for Asda, the U.K. subsidiary of Wal-Mart Stores Inc. (WMT) He could make clothing for less and often does, but right now, for a pair of 14-pound ($22) George jeans, he’s charging a Hong Kong-based middleman, Li & Fung Ltd. (494), 90 cents plus 26 cents of profit. Anything less, he cautions, and he would have to start cutting corners and compromise worker safety. Graphic: Ninety Cents Buys Safety on $22 Jeans “You let us earn those few cents, and nobody in Bangladesh has to die while making basic, five-pocket jeans,” Munshi said as he juggled phone calls in his second-floor office in downtown Dhaka. “What is 15, 20 cents to a foreigner? Nothing.”
BRICS’ see greater role in Latin America - Last week witnessed some crucial developments from BRICS perspective. The Cuban foreign minister visited New Delhi and sought BRICS’ partnership with Latin American countries, representatives from Cuba, Haiti, Costa Rica and Chile met Russian Foreign Minister, Sergei Lavrov in Moscow and sought Russian cooperation for the development of Latin American countries and Chinese President, Xi Jinping toured Trinidad and Tobago, Costa Rica and Mexico to widen Chinese engagement in the region. Like Africa, Latin America is emerging as a hub of economic development with huge natural resources; it is but natural that it has gained increasing attention of the world. In this context, BRICS’ engagement in the region, consisting of 33 countries with population of 600 million, has become timely. The establishment of Community of Latin American and Caribbean States (CELAC) in 2011 has provided the region a unified voice, and with Brazil being a member of BRICS as well as CELAC, the BRICS’ engagement in the region will be mutually beneficial with larger implications for the globe.
Brazil slashes financial transactions tax - FT.com: Brazil has dismantled one of the cornerstones of its so-called currency war against foreign fund inflows, by slashing a tax on overseas investments in domestic bonds. The government late on Tuesday cut the financial transactions tax, known as the IOF, from 6 per cent to zero in a move that signals its concern that Brazil’s currency, the real, is weakening too quickly against the dollar. “Today, with the market normalising and the movement of the [US] Federal Reserve to reduce its expansionist policies, we were able to remove this barrier,” finance minister Guido Mantega said. Brazil over the past few years has fiercely criticised loose monetary policy in the US for creating a “tsunami” of liquidity that flooded into emerging markets, inflating their currencies and rendering their industry uncompetitive. But in recent weeks the real has depreciated rapidly alongside other currencies as the dollar has rallied on speculation that the Fed is set to “taper” its third wave of monetary expansion, known as quantitative easing.
‘Emerging markets displace Europe as fulcrum of risk’ - There is a wicked double edge to the emerging-market boom that has so enthralled us for the past decade. The economies of these rising powers are by now big enough to shake the entire world if they come off the rails. Some feared this might happen in 1998 when Russia defaulted and East Asia’s currency crisis span out of control, a drama precipitated by a rising dollar. Contagion spread to western Europe, causing the pre-euro “convergence play” to snap back violently. The US hedge fund Long Term Capital Management was caught $100bn (£65bn) short as bond spreads surged in Club Med, and equities plunged. The threat of a chain reaction was serious enough to force emergency rate cuts by the Fed. The crisis abated. Asia’s economy is a much bigger beast today, and so is the emerging market (EM) universe. These countries now account for half of global investment. Gross fixed-capital formation last year by EM powers in the G20 bloc was $6.7 trillion, 48pc of the total. China alone spent $3.85 trillion, eclipsing America at $2.5 trillion – even with the US shale boom. The Chinese figure will surprise nobody who has seen the forest of high-construction cranes in Chengdu or Chongqing, deep in the interior, or passed through railway stations of “Tier III” cities that reduce Waterloo to Lilliputian size. “It is the emerging world that is driving global expansion, so we have to watch very carefully for signs of a turn in the cycle,”
Argentina May Tax Revenue Rises 27.4% on Year to ARS77.8 Billion - Argentina's May tax revenue hit a record of 77.8 billion pesos, a 27.4% gain on the year, the national tax agency Afip announced Monday. Tax revenue regularly posts double-digit annual percentage gains due to economic growth, higher salaries and steep inflation. Private economists estimate an annual inflation rate of around 24%, more than double the widely questioned official rate. That helps to swell government revenue from sales tax, as prices for goods soar. A number of unions have also agreed to wage hikes on the order of 24% in recent weeks, with those sharp raises contributing to the growth in income taxes.
Inflation Slows Across Most Developed Countries - The annual rate of inflation across developed economies fell to its lowest level in three and a half years during April, a development that opens the way for leading central banks to continue to shore up weak growth through stimulus measures. Figures released by the Organization for Economic Cooperation and Development on Tuesday showed consumer prices in its 34 member countries rose by 1.3% in the 12 months to April, having risen by 1.6% in the 12 months to March. That was the lowest rate recorded since October 2009, when the global economy was emerging from the recession that followed the 2008 financial crisis. Four of the Paris-based research body’s 34 members experienced deflation–an outright fall in prices over a 12-month period–during April, including Sweden and Switzerland. However, inflation rates picked up in a number of large developing economies, suggesting that global inflationary pressures have not entirely receded. The relatively low level of inflation across so many leading economies should give central banks more room to continue to cut their key interest rates, or provide other forms of stimulus to support an economic recovery that remains weak.
Shipping Faces $500 Billion Environmental Costs Amid Rates Slump - Shipping faces $500 billion in extra costs to meet environmental legislation at a time when a rout in rates has become so severe that some owners are struggling to maintain vessel safety. The industry will need $50 billion a year between 2015 and 2025 to meet sulfur-emission rules and other regulations, Masamichi Morooka, chairman of the International Chamber of Shipping, representing most of the world’s ship operators, said at a conference in Oslo today. Some shipping companies already aren’t earning enough to maintain their fleets, said Andreas Sohmen-Pao, chief executive officer of BW Group Ltd., a Singapore-based owner. Owners are contending with the biggest fleet surplus since the early 1980s while rates across the industry were the lowest in at least 22 years in 2012, according to Clarkson Plc, the world’s largest shipbroker. Oil tankers and vessels hauling iron ore aren’t making enough to cover running costs including crew and repairs, data compiled by Bloomberg show. “As many companies struggle to survive during the difficult years ahead, we must persuade governments to avoid placing more straws that risk breaking the ship owner’s back,” Morooka said. “Many of the expensive environmental regulations that are about to enter into force were conceived in a different world, at a time when shipping markets were booming.” A global 0.5 percent cap on sulfur emissions is planned for 2020, in addition to a 0.1 percent limit in parts of Europe and North America, Morooka said. Rules governing ballast water, which is used to stabilize ships when they don’t have cargoes, will also add to owners’ costs, according to an e-mailed statement accompanying his speech.
A World Awash in Credit with Much Work to Do - When it comes to debt, it seems nobody has it quite right. Five years after the onset of global financial crisis, the most indebted nations haven’t done enough to reduce their loads, while emerging nations are leveraging up at a pace that calls for careful regulation, , according to a speech by Jaime Caruana, general manager of the Bank for International Settlements. “In most of the advanced economies hit by the crisis, banks, households and firms need to redouble their efforts to deleverage and to repair their balance sheets,” said Mr. Caruana.He added: “There are late-cycle risks in some of the advanced (less affected by the crisis) and emerging market economies that have been experiencing credit booms.” He doesn’t identify the countries with “late-cycle risks” by name, but in an accompanying chart, it lists Hong Kong, China, Korea, Singapore and Indonesia.Asia especially, has seen its credit return to levels not seen since before the 1997 Asian Financial Crisis, as recently documented in a Wall Street Journal story. He advises emerging economies in Asia to keep using and to strengthen so-called macroprudential measures, such lending curbs and real estate transaction taxes, which aim to snuff out lending bubbles before they get out of control. Among the nuggets in his speech: Add up the debt in the G-20, and it’s 30% higher than it was at the beginning of the financial crisis.
Global shock as manufacturing contracts in US and China - Manufacturing has begun to contract in the US and China for the first time since the Lehman crisis, raising fears of a synchronized downturn in the world’s two largest economies. The closely-watched ISM index of US factories tumbled through the “boom-bust line” of 50 to 49, far below expectations. It is the lowest since the depths of the crisis in mid-2009 and a clear sign that US budget cuts are starting to squeeze the economy. New orders plunged 3.5 to 48.8 on weak foreign demand and reduced federal contracts. The news came hours after HSBC said its index for China also fell below 50, a major inflexion point for the world’s industrial workshop. “This is not a good moment for the world economy,” said David Bloom, currency chief at HSBC. “The manufacturing indices came in weaker than expected in China, Korea, India and Russia, and then we got America’s ISM. “We thought we had a clear picture that the US was recovering, Japan was printing money and were we’re back to happy days, and now suddenly a huge spanner has been thrown in the works.” Mr Bloom said a sharp strengthening of the Japanese yen on safe-haven flows and the 16pc fall of the Nikkei index from its peak are disturbing. “People are asking whether the 'Abenomics’ bubble is bursting.”
World-Wide Factory Activity, by Country - World-wide manufacturing was moderately expanding in May, according to one index, even as the U.S. moved into contractionary territory and the euro zone’s downturn continued. Bloomberg News The JPMorgan Global Manufacturing Purchasing Managers’ Index, a broad measure of manufacturing activity across the world, rose slightly to 50.6 in May, basically flat from 50.4 the prior month. The reading above 50 signals that global activity remained in expansionary territory, though it remains close to the neutral level. China gave mixed signals as an official measure of activity noted expansion. while a private figure pointed to contraction. The middling Chinese performance is weighing on other Asian economies that depend on trade. In Europe, though a downturn in the euro zone manufacturing sector continued, the pace of contraction slowed. The U.K., meanwhile, factory activity expanded faster than the prior month,
Inequality Rising — All Thanks To Government Policies - A revealing new examination of the top 1 percent in a variety of countries brings into focus how the American government’s tax, union bargaining, inheritance and other rules widen the growing divide between those at the top and everyone else. Four economists found that such wealthy and technologically advanced countries as Japan, France and Germany have seen growth at the top, but not the chasm of inequality created in recent decades in the U.S. and Britain. That is significant because it means that new technologies and the ability of top talent to work on a global scale cannot explain the diverging fortunes of the top 1 percent and those below, since the Japanese have access to the same technologies and global markets as Americans. The answer must lie elsewhere. The authors point to government policy. The paper’s authors include Emmanuel Saez, the UC Berkeley economist who has won renown for his work examining more than a century of global data on top incomes. The lead author is Facundo Alvaredo of the Paris School of Economics. The four authors looked at four big issues to see how they drive growing inequality:
- —Do lower taxes on the already wealthy, which allow them to save more, make their fortunes snowball?
- —Do current rules redistribute more wealth to executives and managers, perhaps at the expense of the companies they run?
- —Does inherited wealth, which is on the rise in Europe as well as the United States because of tax rules that make it easier to pass fortunes to heirs, reinforce inequality?
- —Does having income from work juice the growth of fortunes, because the savings can be reinvested rather than spent?
It's A "0.6%" World: Who Owns What Of The $223 Trillion In Global Wealth - Back in 2010 we started an annual series looking at the (re)distribution in the wealth of nations and social classes. What we found then (and what the media keeps rediscovering year after year to its great surprise) is that as a result of global central bank policy, the rich got richer, and the poor kept on getting poorer, even though as we predicted the global political powers would, at least superficially, seek to enforce policies that aimed to reverse this wealth redistribution from the poor to the rich (a doomed policy as the world's legislative powers are largely in the lobby pocket of the world's wealthiest who needless to say are less then willing to enact laws that reduce their wealth and leverage). Now that the topic of wealth distribution (or rather concentration) is once again in vogue, below we present the latest such update looking at a global portrait of household wealth. The bottom line: 29 million, or 0.6% of those with any actual assets under their name, own $87.4 trillion, or 39.3% of all global assets.
Counterparties: The revolt of prosperity - What began as a four-person protest over the planned destruction of a small park has turned into a battle for the future of one of the world’s great economic success stories.Thousands have been arrested in cities across Turkey in protests over the authoritarian bent of Prime Minister Tayyip Erdogan. The spark, at least initially, was urban development: Erdogan’s government had a plan to turn “the last significant green space in the center of Istanbul” — a park with a long history of protest — into a luxury mall and apartments. Just don’t call this the Arab Spring, Pawel Morski writes. First, unlike many of its neighbors, Turkey’s got a booming middle class, low income inequality, and has been the fastest growing OECD country since Erdogan’s government took power in 2003. GDP per capita has tripled under Erdogan. “Having become wealthy in the past decade, the people are now embracing a new attitude toward capitalism,” one expert told Bloomberg Businessweek. “They are telling the government, ‘We do not need shopping malls instead of parks.’” As Reuters writes, the Taksim Square development “is one of a few huge government projects that include the world’s biggest airport, a $3 billion third bridge across the Bosphorus and a $10 billion shipping canal that would turn half of Istanbul into an island.” Beyond the government’s religious conservativism and its new restrictions on alcohol, Turkey’s populace is bristling at Erdogan’s economic policy. “Istanbul is seen as a place where you earn a living, where you get rich. It is a gold rush,” a professor and lifelong Istanbul resident told the NYT. The urban poor meanwhile, are being paid to leave so that contractors can build gated communities.
The Most Over/Under-Valued Housing Markets In The World - House prices - with respect to both levels and changes - differ widely across OECD countries. As a simple measure of relative rich or cheapness, the OECD calculates if the price-to-rent ratio (a measure of the profitability of owning a house) and the price-to-income ratio (a measure of affordability) are above their long-term averages, house prices are said to be overvalued, and vice-versa. There are clearly some nations that are extremely over-valued and others that are cheap but as SocGen's Albert Edwards notes, it is the UK that stands out as authorities have gone out of their way to prop up house prices - still extremely over-valued (20-30%) - despite being at the epicenter of the global credit bust. Summing up the central bankers anthem, Edwards exclaims: "what makes me genuinely really angry is that burdening our children with more debt to buy ridiculously expensive houses is seen as a solution to the problem of excessively expensive housing." It's not different this time.
How Work Is Rebounding (or Not) Globally - The International Labor Organization put out a mammoth report Monday on employment around the world. Want to know about part-time work in Germany? The minimum wage in Bangladesh? The middle class in Burkina Faso? It is all in there. The study paints a picture of a world still struggling to create jobs in the wake of the global recession, with developing economies enjoying stronger growth and a better jobs picture than developed economies — especially those in Europe. Here are eight main takeaways.
- The global employment rate of 55.7 percent is still nearly a percentage point lower than it was before the crisis.
- Globally, there are about 200 million — 200 million — unemployed people.
- For developing economies, employment rates will return to their precrisis levels around 2015. For advanced economies, it will take until after 2017.
- For some countries, the crisis never ended.
- For developed countries, a better job market has often gone hand in hand with worse jobs.
- Long-term unemployment is a global scourge. It increased in more than half of surveyed countries, and labor forces have shrunk in more than half of surveyed countries, in part because so many workers have simply given up on looking for a job.
- The bad economy is giving rise to social unrest in many regions of the globe, especially Europe.
- The American middle class is shrinking. And it has been for three decades. The share of adults living in middle-income households has fallen to 51 percent in 2010 from 61 percent in 1970.
Rich Countries Are Creating More Jobs By Creating Worse Jobs - The UN's International Labor Organization released its annual "World of Work" (PDF) report today, and boy are the results depressing. The employment rate won't return to pre-crisis levels in emerging markets until 2015, while advanced economies will have to wait until 2017 for their work woes to end. But even then, the number of unemployed people is still set to grow 4% to 208 million in 2015. How can the employment rate and unemployment levels rise simultaneously? Because the unemployed are dropping out of the work force: In more than half of the countries surveyed, labor force participation declined largely due to discouraged workers giving up the job hunt. Perhaps worse: job quality is worsening around the globe, even where the unemployment rate is falling. The study's researcher made the chart below to compare "job quality," measured by average wages, benefits and hours worked, and job creation, between 2007 and 2011. Basically, the place to be is in the top right quadrant (where countries are creating more and better jobs) and not the bottom left (where economies are creating fewer, worse jobs):
Labor's Falling Share, Everywhere - The Internation Labour Organization discusses some of the data in Chapter 5 if its Global Wage Report 2012/13 on the theme of "Wages and equitable growth." Here, I'll provide a few background charts, and then some thoughts. Here's the labor share of income in the U.S., Germany, and Japan. For example, the U.S labor share of income (shown by the triangles) hover around 68-70% of GDP through the 1970s, and even by the mid-1980s is near the bottom end of this range, but has declined since. Here's a figure showing patterns for several groups of emerging and developing economies. The longest time series, shown by the darker blue diamonds, is an average for Mexico, South Korea, and Turkey. And what about China? Labor share is declining there, too. One of the results of the declining labor share of the economy is that as productivity growth increases the size of economies, the amount going to labor is not keeping up. Here's a figure showing the divergence in output and labor income that has opened up since 1999 for developed economies. The results here are weighted by the size of the economy, so the graph largely reflects the experience of the three biggest developed economies: the U.S., Japan, and Germany.
World faces lost decade of joblessness, ILO warns - The world's advanced economies will suffer a lost decade of jobs growth with more people unemployed for longer and more dropping out of the labour market altogether, a key report has warned.The International Labour Organisation says the risk of social unrest is rising as inequality worsens and unemployment continues to climb, and it will be "a major global challenge for the years to come".It predicts that employment rates in advanced economies will not return to pre-crisis levels until after 2017, more than 10 years on from the start of the global financial meltdown. It forecasts that emerging and developing economies will recover sooner, returning to pre-crisis employment by 2015.The annual World of Work report warns that at a global level, the number of unemployed people will continue to increase unless policies change. Global unemployment is expected to approach 208 million in 2015, compared with slightly over 200 million now.It also stresses that key labour market weaknesses that preceded the crisis have "remained acute or worsened". For example, over the past five years, long-term unemployment has increased in almost two-thirds of advanced and developing countries where data is available.
Unemployment Hits Record High in Euro Zone— Unemployment in the euro zone continued its relentless march higher in April, according to official data published Friday, hitting yet another record, amid a prolonged recession and the absence of a coordinated response by policy makers. The jobless rate for the 17 countries that use the common currency rose to 12.2 percent, from 12.1 percent a month earlier, with 19.4 million people out of work, according to Eurostat, the European Union statistics agency. Some analysts said the number of people without jobs could hit 20 million by the end of the year. Despite the rise, most analysts do not expect the European Central Bank to cut interest rates or take other action to stimulate growth when its policy-making council meets in the coming week. Separate data from Eurostat showed that inflation in the euro zone rose to 1.4 percent from 1.2 percent, which could prompt the central bank to wait for clearer signs that there is no risk of higher prices. Analysts said the continued rise in youth unemployment was particularly alarming. Nearly a quarter of job-seekers under age 25 were unemployed across the zone. Youth joblessness reached 62.5 percent in Greece and 56.4 percent in Spain in April, Eurostat said, threatening to become a long-term drag on growth as young people are unable to start their careers.
The movement of people (and its consequences) - This chart shows the "slow train wreck" that is Eurozone youth unemployment - courtesy of Pedro da Costa of Reuters: This adds up to an aggregate youth unemployment figure of 23.3% (in March 2013) for the Eurozone as a whole. This is what the European Commission plans to do about it: The Youth Employment Initiative was proposed by the 7-8 February 2013 European Council with a budget of €6 billion for the period 2014-20. The Youth Employment Initiative would particularly support young people not in education, employment or training in the Union's regions with a youth unemployment rate in 2012 at above 25% by integrating them into the labour market. The money under the Youth Employment Initiative would therefore be used to reinforce and accelerate measures outlined in the December 2012 Youth Employment Package. In particular, the funds would be available for EU countries to finance measures to implement in the eligible regions the Youth Guarantee Recommendation agreed by the EU's Council of Employment and Social Affairs Ministers on 28 February. Under the Youth Guarantee, Member States should put in place measures to ensure that young people up to age 25 receive a good quality offer of employment, continued education, an apprenticeship or a traineeship within four months of leaving school or becoming unemployed.
Europe's Record Youth Unemployment: The Scariest Graph in the World Just Got Scarier - - Europe's job market is a historic disaster. The EU unemployment rate set a new all-time high of 12.2 percent, according to today's estimates. But it's the youth unemployment crisis that's truly terrifying. In Spain, unemployment surged past 56 percent, and Greece now leads the rich world with an astonishing 62.5 percent of its youth workforce out of a job (graph via James Plunket).My God, look at Greece's trajectory. That thing isn't slowing down. Since April 2012, Greek youth unemployment has grown by about one percentage point a month. At that rate, it would pass 70 percent in early 2014. It is suddenly not insane to imagine a youth unemployment rate of 70 percent in the developed world. And that is insane.
The E.U.’s Feeble War on Unemployment - EUROPEAN leaders have declared war on youth unemployment. At a meeting we attended in Paris last week organized by the Berggruen Institute on Governance, President François Hollande of France called on his fellow E.U. leaders to “act urgently” to address the problem. Germany’s finance minister, Wolfgang Schäuble, warned of an impending “catastrophe” that risks losing “the battle for European unity.” Italy’s labor minister, Enrico Giovannini, added, “We have to rescue an entire generation of young people.” Only a few days ago, his boss, the newish Italian prime minister, Enrico Letta, declared he wanted to make the European summit that begins on June 28 about “the fight” against youth unemployment. The crisis is real. According to a recent report by the International Labor Organization, the youth unemployment rate in France is now above 23 percent. In Italy it is 34 percent. Conditions in Greece, Portugal and Spain are even worse. Moreover, alarmingly high proportions of unemployed young people have been out of work for more than six months. Yet the plans that were under discussion in Paris strike us as grossly inadequate. Even more worrying, they risk distracting E.U. leaders from what really needs to be done to revive the European economy.
Unemployment as an indictment of the Euro - Anyone doubting whether Europe’s adoption of a single currency in 1999 was a major policy blunder need only look at the steady upward march of European unemployment over the past five years to its present staggering level of almost 19.5 million employees. According to EUROSTAT data released last week, Eurozone unemployment rose to another all-time record of 12.25% in April 2013 from around 7.25% in 2008. Meanwhile, youth unemployment rose to almost 24.5%. Equally disturbing has been the growing disparity in unemployment rates between the Eurozone’s prosperous North and its beleaguered South. While unemployment in Germany is currently around 5.5%, in Greece and Spain it is 27%. More disturbing yet, youth unemployment is close to 60% in Greece and Spain and it is over 40% in Italy and Portugal. Sadly, there is every indication that Europe’s unemployment rate will rise over the next twelve months to approximately double its equivalent US rate. Europe needs economic growth of at least 1.25% to stabilize its unemployment rate at its current level. Yet the ECB itself is forecasting that European GDP will decline by over half a percent in 2013. On the basis of Okun’s Law, such a growth shortfall would be associated with a rise in European unemployment to around 13% by end-2013.
Anti-austerity protests: Spain, Germany, Portugal - Anti-austerity protesters on Saturday took to the streets of dozens of European cities, including Madrid, Frankfurt and Lisbon, to express their anger at government cuts they say are making the financial crisis worse by stifling growth and increasing unemployment. Thousands marched peacefully toward Madrid's central Neptuno fountain near Parliament, chanting "Government, resign." Around 15,000 people gathered outside the International Monetary Fund's headquarters in Lisbon shouting "IMF, out of here." Many protesters were carrying banners saying, "No more cuts" and "Screw the Troika," a reference to the European Commission, the European Central Bank and the International Monetary Fund, the three-member group that bailed out the governments of Greece, Ireland, Portugal and Cyprus. The bailout loans were given on the understanding that governments enact stringent austerity measures to rein in their heavily indebted finances.
Blockupy Protest Surrounds European Central Bank in Frankfurt - An estimated 2,500 supporters of the anti-capitalist group "Blockupy" demonstrated in the German financial capital of Frankfurt on Friday, blocking access to the European Central Bank (ECB) in protest of euro-crisis austerity policies.Banging on drums and carrying signs that read slogans such as "Block the ECB -- Fight Capitalism and Austerity" and "Humanity before Profit," the demonstrators cut off roads leading into the downtown financial district. "The business operations of the ECB have been successfully hindered," a spokeswoman said, according to the German news agency DPA. "We are making Europe-wide resistance to devastating policies of poverty visible." The European Blockupy movement, which formed after the Occupy Wall Street movement in 2011, is critical of euro-zone leaders' approach to the debt crisis. Forcing struggling countries to raise taxes and implement tough austerity measures has only served to deepen the Continent-wide recession, they allege.
Portugal's biggest unions band together for general strike - Portugal's UGT labour union said on Monday it will take part in a general strike called for June 27, making it the second time the two biggest unions would walk out together since the country's EU/IMF bailout in 2011. The move will pile pressure on the centre-right governing coalition, which took office in 2011 and whose popularity has dwindled after it enacted the largest tax increase in Portugal's modern history this year to meet stringent deficit targets under the bailout. The more moderate UGT will join the more leftist CGTP, Portugal's largest union with around 750,000 members, which called the general strike on Friday. "We say no to the dictatorship of the Troika - that is what we rebel against," Carlos Silva, the head of the 500,000 members-strong UGT, told a news conference on Monday.
Austerity, like a B-movie monster, will keep coming back - FT.com: Did austerity end last week? This is what the headlines suggested when the European Commission gave five eurozone countries more time to meet their fiscal targets. The message from Brussels is that policy is no longer focused on austerity but on structural reforms. I am afraid that this apparent shift in policy amounts to little more than a tactical retreat by the champions of austerity. Rather than being abandoned, austerity has simply been prolonged. I struggle to think why people consider this to be a relief. In addition, since structural reforms are, by definition, structural, they will not have any short-term effects – if, in fact, they are ever enacted. So let us focus on austerity. High quality global journalism requires investment. Please share this article with others using the link below, do not cut & paste the article. The commission’s latest forecast shows a steady fall in the structural public sector deficit of the eurozone from 3.6 per cent of gross domestic product in 2011 to a projected 2.1 per cent in 2012, 1.4 per cent in 2013 and 1.5 per cent in 2014. Structural balances are adjusted for the business cycle and asset price fluctuations, so show the real scale of the adjustments. The data show that, before last week’s apparent U-turn, it was already clear that the first big phase of fiscal adjustment would end this year. In fact, most of the adjustment took place in 2012. But, like a B-movie monster, austerity will rise from the dead in 2015 and 2016 when countries have to meet their delayed fiscal targets and, in addition, implement a commitment to repay a portion of their excessive debt each year. I assume that most countries will not have fixed their banks by then, so that overall growth will probably still be low because credit conditions will still be tight. Austerity will once again be pro-cyclical.
Sweden Housing Crash Coming Up; Average Swede to Repay Mortgage in 140 Years; Swedish Central Bank Ponders New Rules - Swedish repay their mortgages so slowly that it will take 140 years on average, according to the IMF. The International Monetary Fund lamented Friday that Swedish households pay their mortgages so slowly that they are planning to do an average of 140 years. "Financial stability is [...] reinforced by a steady reduction in repayment schedules - that exceed an average of 140 years," the IMF said in a statement after a mission in Sweden. This statistic was revealed in March by a government agency, the inspection of the financial sector. It covers loans considered relatively safe, those where the real estate buyer had an initial contribution equal to or greater than 25% of the value of the property and pay the higher monthly interest alone.According to the Washington-based institution, the Swedish real estate market is a major risk to the economy, along with the eurozone crisis.
College in Sweden is free but students still have a ton of debt. How can that be? - Swedish colleges and universities are free. Yep. Totally free. But students there still end up with a lot of debt. The average at the beginning of 2013 was roughly 124,000 Swedish krona ($19,000). Sure, the average US student was carrying about 30% more, at $24,800. But remember: Free. College in Sweden is free. That’s not even all that common in Europe anymore. While the costs of education are far lower than in the US, over the past two decades sometimes-hefty fees have become a fact of life for many European students. And yet, students in Germany and the UK have far lower debts than in Sweden. And 85% of Swedish students graduate with debt, versus only 50% in the US. Worst of all, new Swedish graduates have the highest debt-to-income ratios of any group of students in the developed world (according to estimates of what they’re expected to earn once they get out of school)—somewhere in the neighborhood of 80%. Why? College in Sweden is free. But rent isn’t. And food isn’t. Neither is the beer that fuels the relatively infrequent, yet legendary, binges in which some Swedes partake. Costs of living in Sweden are high, especially in cities such as Stockholm, which regularly ranks among the world’s most expensive places to live. But again, this stuff isn’t free for students in other European countries either. So why do Swedish students end up with more debt? It’s pretty simple, actually. In Sweden, young people are expected to pay for things themselves instead of sponging off their parents.
Endangered Species: SMEs in Italy, Spain - Make no mistake: there are giant companies in Italy and Spain. However, many of the specialist products these countries are known for are from small- and medium-sized enterprises (SMEs) which also provide the bulk of employment. Unfortunately for them, the credit crisis has made their existences rather difficult. Especially since they are not very large, they find it hard to raise capital via stock or bond issuances.. It's too bad that the European crisis has made many banks doubly wary of lending to these SMEs at a time when their needs for credit are the greatest. Hence the sob stories in these troubled times in troubled Latin economies. Let us begin with Italy, whose leaders haven't been especially keen on lending them a helping hand: With an estimated 5 million enterprises accounting for 80 percent of Italy's gross domestic product, SMEs have long been the main driver of Italy's export-led economy.The crisis for the SME sector is prompting widespread calls for the government to help small businesses and save the 'Made in Italy' brand from collapse... Italy's SMEs are also notoriously inefficient. There are approximately 65 SMEs per 1000 inhabitants in Italy, substantially above the European Union average of 40 per 1000 inhabitants, according to data from the European Commission (EC). But while Italy has some 1.7 million more SMEs than Germany, they provide 3 million fewer jobs (12.2 million persons employed as opposed to 15.2 million in Germany) and produce only 56 percent of the total value-added of their German counterparts.
European recession eases - Manufacturing data was out in Europe overnight with again some upside:
- Final Eurozone Manufacturing PMI at 48.3 in May (flash:47.8)
- Downturns ease in all nations covered
- Price deflationary pressures remain, as input costs and output prices fall further
The eurozone manufacturing downturn eased for the first time in four months in May. Moreover, all sub-indices from the latest survey improved on the earlier flash estimates except suppliers’ delivery times. At a 15-month high of 48.3 in May, up from April’s four-month low of 46.7, the
seasonally adjusted Markit Eurozone Manufacturing PMI indicated the slowest pace of contraction since February 2012. Business conditions still deteriorated overall, however, with the current downturn extended to a twenty-second month. PMIs for all of the nations covered by the survey signalled weaker rates of contraction in May. The German PMI signalled the slowest rate of contraction overall and moved close to the stabilisation level as output and new orders both rose for the first time in three months. Downturns in the Netherlands and Austria were also only moderate. Are we finally seeing some good news out of the Eurozone? Yes and no. Firstly, although these numbers are monthly highs across the board not one single country managed to register an expansion. Yes, manufacturing appears to be bottoming out, at least in the short term, as demand for export goods picks up in a number of periphery nations, however, as we saw from the latest unemployment figures and has also been backed up by service PMI data, much of the gain in the export sector is coming at the expense of internal demand.
Spain’s Economy Rebounds as Exports Transform Country - Government investment had been the last hope for Alberola’s Voxelstudios, which produced promotional videos to help builders win bids before Spain’s largest developers began going bust when markets for housing, commercial real estate and banking collapsed in 2007. Profit fell by 76 percent the year of the cancellation. He had only one more card to play: He hit the road, heading for the Middle East, Asia and Latin America. Alberola is among a growing percentage of standouts in a country with 27 percent unemployment -- 56 percent for those less than 25 years old. Their success also is forging a path for the euro region’s fourth-largest economy to emerge from a sixth year of recession. Spanish exports climbed to a record 223 billion euros ($291 billion) last year as a drought in orders at home pushed companies to upgrade products and go abroad. It was another step away from a decade of growth fueled by mass construction and tourism.
Could business optimism in Greece translate into stabilization? - Last week the International Monetary Fund said it will provide Greece with another installment in the amount of €1.7 billion under the second bailout plan. As the nation complies with troika's bailout provisions, including dismissing thousands of public-sector employees, economic indicators out of Greece continue to worsen. The latest unemployment rate clocked at 27%, resulting in a spectacular drop in consumer spending.The banking system is nearly frozen, as credit to private sector continues to decline (as old loans mature). Manufacturers struggle to bring product to market because they can't finance purchases of raw materials. In many cases neither the banks nor the suppliers are willing to provide credit (except for Iran who lends oil to Greek refiners). On its own, Greece would do what Japan is currently doing - flood the banking system with excess reserves, force the central bank to buy government debt, and devalue the currency. But as long as the nation is part of the Eurozone, it has no control over the monetary system. Amazingly, in spite of this full fledged economic depression, surveys are showing improvements in business sentiment and future outlook. When in comes to business conditions, Greeks seem to be at least as optimistic as the rest of the Eurozone, if not more.
IMF to Reduce Germany GDP Forecast - Germany's 2013 growth prospects have been cut in half by the International Monetary Fund, as it warned that the outlook for Europe's strongest economy could worsen if a eurozone recovery fails to materialise. The IMF said falling business investment and the eurozone's ongoing recession, which have hampered German growth, meant the economy would grow by just 0.3pc this year, compared with an April estimate of 0.6pc. "The uncertainty, mainly surrounding prospects for the euro area and the ongoing recession in the region, have led to declining German exports to the region as well as a sharp pull back in business investment," the IMF said in a report on Monday.
IMF halves German 2013 growth forecast - Germany's 2013 growth prospects have been cut in half by the International Monetary Fund, as it warned that the outlook for Europe's strongest economy could worsen if a eurozone recovery fails to materialise. The IMF said falling business investment and the eurozone's ongoing recession, which have hampered German growth, meant the economy would grow by just 0.3pc this year, compared with an April estimate of 0.6pc. "The uncertainty, mainly surrounding prospects for the euro area and the ongoing recession in the region, have led to declining German exports to the region as well as a sharp pull back in business investment," the IMF said in a report on Monday. The Fund also warned of further risks to Germany's growth prospects. "Should the alleviation of uncertainty and an expected gradual recovery in the rest of the euro area fail to materialise, growth can be expected to remain below its potential for longer, leading to a widening of the output gap which would eventually result in slack in the labour market," it said.
Merkel Maligned: IMF Board Attacks Euro Crisis Management - The EU's bailout of Cyprus has elicited unusually frank and vehement criticism from the finance experts grouped in the IMF's Executive Board. Their damning indictment at an IMF meeting in May reflects global skepticism, especially in emerging economies, about the euro zone's crisis management. Normally, the IMF Executive Board is a secretive group of experts. There are rarely any leaks, and certainly no evidence of sharp indictments or internal strife, emerging from the tight-lipped group, to which the IMF member states appoint experienced officials from their finance ministries and central banks. There is something of an esprit de corps among these experts, dominated by a sense of being responsible for the fate of the global economy, which makes the severity of the criticism the envoys of the IMF member states had for the Europeans seem all the more unusual. The charges ranged from sheer inability to denial of reality and excessive confidence. The fact that the IMF conference delivered a damning indictment of European politicians efforts to save the euro is not just proof of their dissatisfaction with the most recent decisions on the Cyprus bailout. It also documents a deep-seated change in the global economy's most important financial institution. Prior to the financial and euro crisis, it was usually the West that faulted the developing nations and emerging economies for incurring excessive debt and constantly begging for money from the IMF.
BIS records startling collapse of eurozone interbank loans - Cross-border lending is falling drastically across the western world as banks slash exposure to Europe and bend to tougher capital rules, according to data from the Bank for International Settlements. Foreign bank loans fell by $472bn (£311bn) in rich countries in the fourth quarter of last year, contracting at an 8pc annual rate. The retrenchment was led by a collapse of interbank loans in the eurozone, where lenders in the creditor states continue to pull back from periphery countries. Volumes fell by $284bn across the eurozone, a 20pc rate of contraction. Belt-tightening by banks is a key reason why the region remains stuck in recession for the seventh quarter in a row. The BIS said in its quarterly report that the markets are “under the spell of monetary easing”, convinced that central banks will keep the asset boom going despite signs of “broad deceleration” in the US economy and fatigue in China.
ECB backs away from use of ‘big bazooka’ to boost credit - FT.com: The European Central Bank is backing away from any “big bazooka” style intervention to revive lending within the eurozone, delivering a blow to some market hopes of ambitious action. Small and medium sized businesses that form the backbone of the Spanish and Italian economies have seen their borrowing costs rise to unaffordable levels during the crisis while interest rates charged to their German counterparts are near record lows, reflecting the ECB’s rates. This credit crunch, first revealed by the ECB’s own data, has become one of the most visible examples of financial fragmentation dividing the 17-nation eurozone, prompting calls for action. But the ECB’s review of the problem suggests that the blockage in lending is the result of weakened bank balance sheets and would not warrant direct intervention in the SME borrowing process by the central bank. The ECB has already announced that it is working with the European Investment Bank to devise ways of broadening the access to financing for SMEs by reviving a market for asset backed securities. Senior officials view the initiative as worthwhile but unlikely to be concluded soon or to have a big impact.
The Macroeconomics of European Disunion - Paul Krugman -- Wolfgang Münchau makes a point that isn’t new, but still gets overlooked too often: the euro area is, for practical macroeconomic purposes, a single unit — and one that doesn’t really do all that much trade with the rest of the world. Aggregate euro area policy, monetary and fiscal, should therefore be subject to more or less the same rules that apply to the United States.Yet because monetary union wasn’t accompanied by political union, the continent as a whole is pursuing what amount to insanely restrictive policies. Here we have an economy with massive unemployment and inflation that is too low by any reasonable standard (Europe, even more than America, would do a lot better with a 4 percent inflation target): Yet what we see is sharply restrictive fiscal policy: And the ECB isn’t even trying to offset this fiscal drag with expansionary monetary policy, in part because of fear of adverse reactions to possible higher inflation in Germany.We can and often do get bogged down in the details of country analysis, not to mention the difficult politics of the situation. But every once in a while it’s worth backing up and thinking about the fundamental craziness of aggregate European policy.
The ECB, negative rate confusion and the prepay tax option - The ECB meets this week and expectations about what Draghi and team may or may not do seem to be erring towards the non-event side of things. But, as Beat Siegenthaler at UBS observed in a note on Monday, there still seems to be a lot of confusion about the likelihood and usefulness of negative rates being introduced. A rise in eurozone rates over the past two weeks has only added to the confusion: As FT Alphaville has noted before there’s a strong argument to be made that negative rates would actually end up being a contractionary force in the money markets.This is because rather than operate within the bounds of a reserve system at punitive negative rates, banks would understandably be encouraged to take money outside of the eurozone system (weakening the euro in the process) or transform such reserves into banknotes, especially if vaulting costs were lower on a net basis than negative rate charges. Either way, the amount of buffer/surplus liquidity in the system — the amount needed to avoid overnight settlement risk — would be severely contracted, making unsecured liquidity much more expensive to bilateral participants in the market. The second point is that in a negative interest world, there would be a clear incentive to transform reserve liquidity into almost anything that tracked the nominal value of a euro, but which did not incur a negative rate. The most obvious way to do that would be by means of prepaying government tax liabilities. After all, if you have the excess liquidity and can anticipate your tax costs, it makes sense to turn that liquidity into a tax credit as soon as possible.
On crossing the ECB interest-rate streams - If the ECB were to introduce negative rates, FT Alphaville has mostly focused on the idea that the it would do so primarily in its deposit rate. That’s where market chatter has largely concentrated. But as someone wiser than us noted in an emailed comment, that would be almost entirely redundant. Institutions would just keep liquidity in the reserve account at zero instead:…the ECB pays 75 bps on required reserves, 0 on reserves beyond the rr in the reserve account, and 0 bps on the deposit account. Transfers from the reserve account to the depo account are voluntary. In the old days when the depo account had a positive remuneration you would have an incentive to move cash from the reserve account to the depo account if your bumbling reserve manager could not lend it o/n at a higher rate ( or your cunning reserve manager was trying to corner the market by creating an illusion of a reserve shortage). But it was always voluntary. So if the depo account rate were to become negative you simply would never make a transfer of excess reserves into it. You would keep the funds in the reserve account and receive zero. It’s clear, therefore, that in order to have any impact a negative deposit rate would have to be implemented alongside an equally negative rate on the reserve account. This is largely what we have been assuming would likely happen. Our contractionary case is very much based on this hypothesis.
Why the ECB is reluctant to “go negative” - The ECB decided yesterday against “going negative” by reducing its deposit rate from zero to -0.25 per cent. The Governing Council again debated the pros and cons of such a measure, which would represent the first time that any of the major four central banks would ever have reduced a key policy rate to below zero [1]. Mr Draghi said again that the ECB was “technically ready” to take this action, and that the option remains “on the shelf”. Many in the markets believe that this is just a bluff to prevent the euro from rising in the foreign exchange markets. There have been several unsupportive comments from leading members of the Governing Council (Asmussen, Mersch, Noyer and Nowotny) and Mr Draghi admitted that disagreements exist in the Council. Nevertheless, the President has deliberately left the option on the table, so it is important to understand the debate. The technical aspects of negative rates have been very well covered in FT Alphaville recently, but I would like to focus on the broader policy implications. Why would a central bank want to take this action, and could it back-fire on them?
ECB Faces Resistance on Banking Union -—The European Central Bank, which holds its monthly meeting Thursday, is likely to hold back from new measures to revive growth in the euro-zone economy amid mounting concern that governments are backtracking on pledges to build a common safety net for their banks. European Union officials, including at the ECB, are pressing for the creation of a central authority, backed by a single pot of money, tasked with "resolving" or winding down stricken banks anywhere in the 17-nation currency bloc. The ECB and many analysts see such a step as a vital part of stabilizing the euro zone. But Germany and France last week proposed leaving the job of resolving broken banks with national authorities and instead promoting more "cooperation" through a board of country representatives. The growing reluctance in national capitals to countenance steps that would transfer powers to the European level is highlighting longstanding fears at the ECB that its own efforts to take the sting out of the debt crisis would take the pressure off politicians to act."Agreement on the two most important political questions—who decides and who pays—is still a long way off." Most analysts expected the ECB to leave interest rates on hold Thursday, after it lowered its key lending rate by a quarter of a percentage point to 0.5%, a record low, last month. Some analysts said a further rate cut is possible, however, because inflation is well below the ECB's 2% target.
Horrible European Retail Sales - At least as of April, the European consumer had not stopped bleeding. In April 2013, compared with March 2013, the volume of retail trade fell by 0.5% in the euro area (EA17) and by 0.7% in the EU272, according to estimates from Eurostat, the statistical office of the European Union. In March retail trade decreased by 0.2% and 0.1% respectively. In April 20134, compared with April 2012, the retail sales index dropped by 1.1% in the euro area and by 0.6% in the EU27.
French jobless rate at 15-year high - French unemployment rose to 10.8% in the first quarter of the year - its highest level since 1998, official estimates have shown. The jobless rate grew from 10.5% in the last quarter of 2012, the official Insee statistics agency said. The French economy went into a recession after seeing GDP fall by 0.2% in the first quarter. President Francois Hollande has pledged to boost jobs and growth, but demand has been sapped by the eurozone crisis. According to Eurostat, the European statistics agency, which uses a slightly different measure, the jobless rate has already reached 11%. The figures came as the European Central Bank (ECB) prepared to meet later, when it is expected to maintain its benchmark interest rate at 0.5%. There has been speculation that the central bank will unveil plans to revive lending in the eurozone, especially for small and medium-sized businesses (SMEs). SMEs provide around three quarters of jobs in the eurozone.
French social security deficit seen overshooting target - France's social security deficit is running over target this year as revenues fall short in the face of rising unemployment, an official body that monitors its accounts said on Thursday. The Commission for the Social Security Accounts said the deficit was set to hit 14.3 billion euros ($19 billion) this year and 17.3 billion euros when including the deficit of a fund for minimum retirement benefits. That was well over the estimates in the 2013 social security budget, which foresaw a deficit of 11.4 billion euros and 13.9 billion euros including the retirement fund. Even though the social security system is financed mainly by taxes for that purpose on employers and companies, its deficit is among the highest in the euro zone and accounts for about 12 percent of the overall public deficit.
Encouraging Figures Nothing But a Seasonal Mirage The Spanish government can hardly contain its glee over seasonal (un)employment improvements Spain's Social Security administration released its May data on registered employment and unemployment, which PM Mariano Rajoy had anticipated over the weekend would be "encouraging". In comparison with April the headline figures were 98,000 fewer registered unemployed, and 135,000 more registered workers, reports El Economista. However, stripped of seasonal effects the data are much less impressive. Corrected for seasonality, registered unemployment decreased by all of 265 people. On a year-on-year basis, registered unemployment grew by 177,000. The government has embarked on a campaign to paint the data as evidence of the start of the economic recovery and proof that the government's economic reforms, notably its easing of dismissal rules, are working to create jobs. To be fair, the reduction in registered unemployment in May is typically half the size observed this month.
Down So Long It Looks Like Up to the Euro Zone - This is what passes for good economic news in Europe: Spain just added 265 jobs. ... Never mind that nearly five million people in Spain are out of work. The latest unemployment report from the government, issued on Tuesday, was held up by Mr. Rajoy as a sign that maybe, just maybe, the economy is getting better. Nearly six years after the financial crisis in the United States spread across the Atlantic, plunging Europe into recession and, in some places, desperate depression, “good” is relative. .. During a visit to Athens last week, the Dutch finance minister said he detected “the first signal of a turn in the economy.” Then, on Wednesday, news arrived from Brussels that the Greek economy was indeed getting better. It shrank by only — only — 5.3 percent in the first three months of the year. That was in fact an improvement: it had contracted 5.7 percent the previous quarter.
Talk of recovery in Greece is premature – and all about justifying austerity - Perhaps you remember reading about a basket case called Greece. The first domino to fall in the eurozone crisis, it was officially broke and only kept afloat by hundreds of billions in euros from Europe and the IMF. To secure the loans, Athens had to slash spending, lay off or cut pay for thousands of public servants and flog state assets. The result was social uproar, political turmoil and economic collapse. Hundreds of thousands of Greeks took to the streets. The country faced ejection from the euro, what economists drolly dubbed a "Grexit". In short, it was in a deep hole. But if that's your image of Greece then you need to update it: that's so spring/summer 2012. Over the past few weeks, Athens' top brass have been trying to convince the world that happy days are here again. Prime minister Antonis Samaras now talks of the Greek "success story". The boss of the central bank and the finance minister say Greece has turned a corner. Editorialists in the national press and parts of the international financial press dutifully nod their assent. And those with Greek or European assets to sell clap along: "Forget Grexit – it could be Greecovery instead," ran one particularly bone-headed "research" note I received on Friday. What's at stake here is a much bigger prize than whether an economy worth 2% of Europe's annual GDP really is on the mend. It's about justifying the shock therapy imposed on distressed members of the eurozone.
IMF admits to errors in international bailout of Greece - FT.com: The International Monetary Fund has published a scathing report about how it and the European Union handled Greece’s first €110bn bailout, saying growth assumptions were too optimistic and that debt restructuring should have occurred earlier. The study says that the rescue went ahead even though Greece did not meet one of the IMF’s four criteria for such a huge programme – a good chance of debt sustainability in the medium term – and may have failed two of the others as well. The report is likely to become a textbook case for all large IMF rescues in the future, with the fund demanding greater losses for private creditors, more realistic growth and debt forecasts, and changes when it operates inside a monetary union. It exposes disagreements among the international lenders overseeing Greece’s rescue and has generated controversy even within the IMF itself. The “programme avoided a disorderly default and limited euro-wide contagion. Greece has also been able to remain in the euro, but the recession has been deep with exceptionally high unemployment. The programme did not restore growth and regain market access as it had set out to do,” says the report. According to the study, the decision to force losses on private holders of Greek bonds should have occurred much earlier than October 2011, but it argues that resistance from Europe made that impossible. “Not tackling the public debt problem decisively at the outset or early in the programme created uncertainty about the euro area’s capacity to resolve the crisis and likely aggravated the contraction in output,” it says
Greek Regrets - Paul Krugman - The IMF has released a fairly remarkable piece of self-criticism (pdf) over policy in Greece. On a first read, the report seems to suggest two main failings on the IMF’s part: it failed to acknowledge early on that Greece simply could not repay its debt in full, and it vastly underestimated the economic damage austerity would inflict. Both errors were, if I may say so, obvious at the time. The troika plan was clearly not realistic — and just about all of us on the Keynesian side were warning, loudly, that multipliers estimated from normal periods with offsetting monetary policy were grossly misleading for fiscal policy under current conditions. All one can say is that the IMF was better than the rest of the troika, with the ECB in particular actually buying in to the fantasy of expansionary austerity. What could/should have been done differently? The report more or less acknowledges that the pain would have been less with some major debt forgiveness upfront, but dismisses the notion of a more gradual adjustment on the grounds that the financing wouldn’t have been available. But look: if we’re willing to imagine a world in which the troika was willing to admit in 2010 that major debt forgiveness was necessary, why not also imagine that in this world the ECB was willing from the start to backstop sovereign debt the way it finally began to do years later?
Counterparties: International Monetary Fail - The International Monetary Fund is now on record saying what everyone realizes about the Greek bailout: it didn’t work very well. Market confidence was not restored, the banking system lost 30% of its deposits and the economy encountered a much deeper than expected recession with exceptionally high unemployment.The full report, which for unknown reasons was originally internal and marked “strictly confidential”, is now public; Joseph Cotterill has the best roundup of the key findings.The report is interesting not only because of its authorship. It’s a well-written and informative read, and Pawel Morski points out that stands to reason: self-flagellation is “turning into a bit of a habit” at the IMF. (See the Argentine and Asian editions.)The European Commission is defending policies that have become plainly indefensible. Choosing to restructure Greece’s debt earlier would have led to a “systemic contagion”, a commission spokesman said, failing to note the impact of delaying a restructuring. Mario Draghi offered an odd dismissal that simply characterized the report in Rumsfeldian terms: “These mea culpas are a mistake of historical projection. You judge things that happen yesterday with today’s eyes”. The IMF has gone through policy course corrections before. It was a long-time supporter of austerity and anti-inflation measures. In April, the IMF published its World Economic Outlook, and became, as Neil Irwin puts it, “among the strongest voices against excessive fiscal austerity and tight money”. (Although the Fund is still asking France to cut government spending.) It supported the initial Cyprus rescue plan, and then, in the face of widespread domestic and international criticism, worked to create a small depositor-friendly plan. Additionally, despite producing top-notch research on the negative effects of income inequality, the Fund doesn’t really take them to heart in terms of policy.
Memo to Paul Krugman on the Eurozone – Read Your Own Research! - The major policy issue around the Eurozone has historically been seen as its existence as a currency area. As a result, neoclassical economists (especially American ones, including Krugman) have tended to analyze it in terms of Optimal Currency Area theory (I briefly discussed Optimal Currency Area theory in another piece about the Euro here). The originator of this literature, Robert Mundell, often called the “founder of the euro”, argued that the important element determining optimal currency areas was a high degree of labor mobility. Thus when Krugman started writing about the Eurozone, he inevitably pointed out that Euro didn’t live up to Mundell’s standards for labor mobility. Monday, Krugman claims to have realized that labor mobility within the Eurozone has been hurting the Eurozone: And while I didn’t think of it until now, there’s even a case to be made that labor mobility within Europe is actually worsening the problem, making the euro less sustainable. Via FTAlphaville, Frances Coppola documents the extraordinary rates of emigration among young people in Europe’s disaster economies — not really a surprise when you consider the incredible levels of youth unemployment. But as she says, once those young people are gone, who will pay the taxes to support retirees? The reason that this is so amazing is that Coppola’s reasoning comes straight out of his (admittedly older) research on Economic Geography. To quote Krugman himself: Now suppose that some resources. say, workers are mobile. If one of the locations offers a larger market, they will have an incentive to move to that location. But the movement of workers itself tends to increase the size of the market wherever they go, decrease it where they come from; so one immediately arrives at the possibility that a small asymmetry between locations, perhaps arising from some small chance event, will prove self-reinforcing.
IEA's shadow MPC votes 5-4 to hike Bank rate by 0.25% - In its most recent e-mail poll, which was finalised on 29th May, the Shadow Monetary Policy Committee (SMPC) decided by five votes to four that Bank Rate should be raised on Thursday 6th June. Four SMPC members wanted an immediate increase of ½%, while one advocated a rise of ¼%. Such a split vote for a rate hike would imply a rise of ¼% on normal Bank of England voting procedures. However, a substantial minority of four SMPC members believed that economic activity in Britain – and also in some of its main trading partners – remained so weak that Bank Rate should be held at its present ½% for the time being. Almost irrespective of their precise views on rates, most members of the shadow committee saw no immediate justification for adding to the existing stock of Quantitative Easing (QE). However, one wanted to start on the process of reversing it. One reason why a narrow majority of the SMPC wanted to raise Bank Rate in June was the belief that lending costs would have to be normalised at some point. It was less disruptive to make the necessary rate hikes early and in ‘baby steps’ than to leave it too late and then have to make an abrupt upwards move; perhaps, because the financial markets had lost faith in the resolve of the British authorities. There remained widespread concern that excessive financial regulation was impeding credit creation to the private sector. Nevertheless, UK broad money growth had now recovered sufficiently to sustain a non-inflationary recovery, given the slow growth of productive potential.
Services complete trio of good PMIs - Good news from Britain's service sector completed a trio of good purchasing managers' surveys, following construction and manufacturing PMIs that were both above the key 50 expansion-constraction level. The service sector PMI jumped from 52.9 in April to 54.9 in May, with new business rising at its fastest pace for three years. The survey also suggested a welcome easing of inflationary pressures. According to Markit, which prepares the data: "UK service sector activity rose at an accelerated rate during May as new business increased at the sharpest pace for over three years. Amid evidence of marginal capacity pressures and with positive expectations for the coming year, companies added to their payroll numbers for the fifth consecutive month. "Meanwhile, latest price data showed that cost inflation maintained a downward trend, hitting a one-year low. Competitive pressures led to a slight fall in average output charges. "The headline seasonally adjusted Business Activity Index remained firmly above the 50.0 no-change mark during May to signal a fifth consecutive month of service sector growth. Moreover, reaching 54.9, up from April’s 52.9, the index signalled a rate of growth that was the sharpest since March 2012."
UK doubles down on housing disaster - Regular readers will recognise that I am highly sceptical of the UK housing system, which I believe operates world’s worst practice when it comes to social and economic outcomes. A key tenet of the UK’s housing malaise is its dysfunctional supply system, which has become increasingly constipated following sixty years of urban consolidation policies and strict planning. When combined with decades of easy credit and policies aimed at stoking demand, UK housing has displayed high levels of price volatility, as well as extreme unaffordability (see next chart). The forced urban consolidation caused by the UK planning system – whereby only 8% of the UK is urbanised, compared with roughly 28% in Germany, 20% in Italy, 28% in the Netherlands, 18% in Switzerland, and 9% in Spain – has also caused Britons to live in some of the worst and most cramped housing conditions in Europe. As shown by the below table, which comes from the London School of Economics, new homes in the UK are, without exception, the smallest in Western Europe: And yet despite the size of UK homes shrinking, they remain amongst the most expensive in Europe, caused primarily by decades of strangulating urban land supply and escalating land costs.Instead of treating the supply problem at its core, UK authorities are instead opting for short-sighted policies aimed at “improving affordability” by increasing would-be buyers’ access to credit and lowering borrowing costs.
Bilderberg Group? No conspiracy, just the most influential group in the world - Conspiracy theorists claim it is a shadow world government. Former leading members tell the Telegraph it was the most useful meeting they ever went to and it was crucial in forming the European Union. Today, the Bilderberg Group meets in Britain. It was June 2011. And in tranquil St Moritz, high in the Swiss alps, half a dozen of the most powerful men in the West had taken a break from a weekend of intensive and strictly confidential debate to walk in the woods, when their paths crossed with the protesters who had come from around the world to keep an eye on them. No such encounters will take place in Watford this week, as the Bilderberg, the annual conference for 140 of the world’s most powerful, meet for four days at The Grove, a £300-a-night golf hotel close to the M25. The entire hotel has been booked out, and a high fence erected around the exclusion zone. Armed checkpoints have been set up on local roads, and locals must show their passports to enter their own driveways. The Home Office may foot the bill. A US news site dedicated to uncovering conspiracies had booked a room for last week but were told by phone not to turn up. The Bilderberg was founded in 1954 to bring the leaders of Western Europe and the United States closer as the Soviet Union cemented its control of the Eastern bloc. In that first meeting, the participants – including bankers, economists, and the future Labour leader Hugh Gaitskell – debated the Communist threat and the prospect of European integration. Publicly, the group says it is still merely a debating society – a forum for leaders to "listen, reflect and gather insights" unbound by official policy positions.


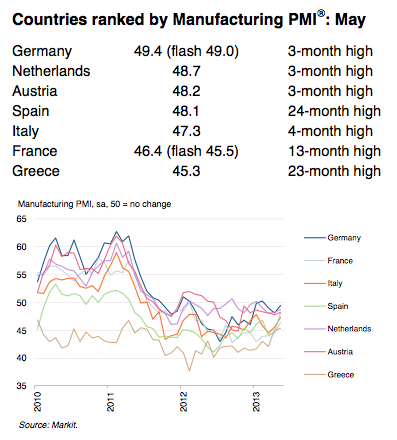
No comments:
Post a Comment