FRB: H.4.1 Release--Factors Affecting Reserve Balances--April 10, 2014: Factors Affecting Reserve Balances of Depository Institutions and Condition Statement of Federal Reserve Banks
Jamie Dimon Explains Why The Fed's Massive $4.5 Trillion Balance Sheet Is Actually Small - Since the financial crisis, the Federal Reserve has been buying up bonds and other securities in its efforts to keep interest rates low and put cash in people's hands. While this has arguably been beneficial for the economy, the immense presence of the Fed has some folks freaked out. "The Fed’s balance sheet has gone from $1 trillion in 2007 to an estimated $4.5 trillion by the end of this year," noted JP Morgan CEO Jamie Dimon in his annual letter to shareholders. "Some feel the Fed’s QE policies have been too aggressive and ultimately will be inflationary. Additionally, there is a fear that ending QE will be risky and complex, particularly since QE has little precedence." But he did offer some context in his efforts to calm down the worry-worts. From his letter: The value of all financial assets in America today is approximately $90 trillion. When the Fed stops buying securities, the $4.5 trillion it owns will run off to $2 trillion by 2020 simply from paydowns of principal in Treasuries and mortgages. While it is not clear what the new steady state will be – the Fed probably will not need to take its balance sheet all the way back down to $1 trillion. Even if the Fed eventually needs to sell some securities, the American economy should be able to handle it easily – particularly in a strong economy. In other words, Dimon is telling us that the Fed could conceivably trim $3.5 trillion off of its balance sheet, but that amount would be pretty small relative to the $90 trillion domestic financial market.
Fed’s Evans Worries Policy Makers Will Tighten Policies Too Early -- Federal Reserve Bank of Chicago President Charles Evans said Tuesday said there is a risk that policy-makers will tighten credit before the economy fully heals. “One of the big risks is that we withdraw our accommodative policies prematurely,” Mr. Evans said during a panel discussion at the International Monetary Fund’s spring meetings. “I think it’s just human nature to start thinking we’ve been doing this for a long time.” The Fed’s benchmark short-term interest rate has been pinned near zero since late 2008, which could prompt some policy-makers to think “that must have been long enough. Maybe it’s time to start the process of renormalizing,” Mr. Evans said. Most Fed officials indicated last month they expect to start raising rates next year. “Well, let me just remind everybody inflation is 0.9% in the U.S.” in February, as measured by the Commerce Department’s personal consumption expenditures price index — the central bank’s preferred inflation gauge – when it should be averaging 2%, Mr. Evans said. The Fed has a 2% inflation target. Inflation has run below that target for 22 months in a row. Mr. Evans also stressed that inflation around the world is low. “I think that’s a sign of weakness I think that’s a sign of risk,” he said.
Fed’s Kocherlakota: Fed Should Consider More Steps to Boost Recovery - Minneapolis Federal Reserve Bank President Narayana Kocherlakota said the central bank should consider further steps to demonstrate its commitment to a full economic recovery, but he doesn’t plan to “re-litigate” its decision to wind down its bond-buying program. In remarks to reporters following a speech here Tuesday, Mr. Kocherlakota said a range of options exist, such as lowering the Fed’s benchmark short-term interest rate from near zero or changing its policy statement. However, Mr. Kocherlakota said he doesn’t see a need to challenge the Fed’s decision to gradually pare its monthly bond purchases, which are aimed at spurring growth. Mr. Kocherlakota dissented last month from the Fed’s decision to scrap language pledging it would not raise interest rates until unemployment fell below 6.5%. Instead the Fed’s policy committee said in its statement that it would consider “a wide range of information” on the labor market, inflation and financial developments when considering when to start raising rates. This change weakened the Fed’s apparent commitment to push inflation up from around 1 % toward its 2% target, he said Tuesday, calling for further Fed actions to demonstrate that commitment. “The way you really build up that belief in your commitment to hitting the target is through actions,” Mr. Kocherlakota said. In his speech, Mr. Kocherlakota said the Fed is falling far short on its job and inflation goals. He noted, “below-target inflation signals a significant problem in our economy,” and added “low inflation in the United States tells us that resources are being wasted.” He said, “low inflation rate is a signal that the FOMC is underperforming with respect to its maximum employment objective.” He said while he and other Fed officials expect weak inflation to return to target, “I expect that return to 2% to take a long time–probably on the order of four years.”
Fed’s Plosser: More Bond-Buying Won’t Boost Low Inflation - There isn’t much the Federal Reserve can do to address low inflation in the short term, and the central bank shouldn’t try to boost inflation by prolonging its bond-buying program, Federal Reserve Bank of Philadelphia President Charles Plosser said Tuesday. “I can be concerned about inflation, but then the question is, what do you do about it? We’re still adding accommodation and we’ve got record-low interest rates,” Mr. Plosser told reporters following a speech. “I don’t believe, for example, that buying even more assets than we are will help our inflation problem.” The Fed already has been making large asset purchases, he noted, “and inflation has done nothing but drift down. So it’s not obvious to me that continuing to buy would be an answer to concern about inflation.” Mr. Plosser has been skeptical of the Fed’s bond-buying efforts. He has a vote this year on the Fed’s policy committee, which next meets April 29-30.
The effectiveness of unconventional monetary policy - What is the evidence for the effectiveness of these policies, and are there any risks? Historically, when the U.S. economy went into recession, the Federal Reserve would lower interest rates through its control of the fed funds rate, an interest rate on overnight loans between banks. Lower interest rates helped stimulate demand for items such as housing and autos and raise asset prices more generally, all of which would help spur economic recovery. But that tool is not available to the Fed in today’s environment in which the fed funds rate is essentially already zero. The Fed has adopted less conventional policies in the current environment by buying assets in huge volumes (large-scale asset purchases) and by indicating its intention to keep the fed funds rate low even after the economy was well into recovery (forward guidance). Although the trillions of dollars involved in LSAP may seem dramatic, the reserves that the Fed created to pay for these operations are for the most part still just sitting idle on banks’ balance sheets at the end of each day. Since those reserves earn interest when left with the Fed overnight, I think the best way to think of them is as overnight loans from banks to the Fed. If all the Fed did with these operations was buy short-term Treasury bills, essentially LSAP would just swap one short-term liability of the U.S. government (Treasury bills) for another very similar short-term liability of the U.S. government (reserves held in accounts with the Fed). Such a swap would be unlikely to change anything that matters regardless of how many trillions of dollars were involved.
Fed’s Bullard: Encouraged by Rebound in March Jobs Data - St. Louis Fed President James Bullard said Monday the rebound in hiring during March suggests the economy is getting back on track after taking a hit from bad weather at the start of the year. Employers added 192,000 jobs in March, amid a stable 6.7% unemployment rate, the Labor Department reported Friday. Those figures were “encouraging,” Mr. Bullard told reporters after a speech in Lost Angeles. “As we come out of the spring here, I’m expecting the economy will grow somewhat faster and that the jobs numbers will improve,” he said. Mr. Bullard said he was “optimistic” about the economy this year, expecting it to expand 3%. He said nothing has changed his views on monetary policy, especially on the Fed’s wind down of its bond-buying program. The purchases aim to boost growth by lowering long-term interest rates. The Fed is buying $55 billion a month in Treasury and mortgage bonds and is expected to gradually cut that amount by $10 billion at each policy meeting in coming months, ending the program later this year. Mr. Bullard told reporters that altering that pace is not something to be done lightly because doing so would “cause a big change in financial markets.” He also said he continues to be surprised by how weak inflation is relative to the Fed’s official 2% target. But he expects it to rise this year and hit that goal over time, he said.
Hilsenrath Analysis: Jobs Report Keeps Fed Policy on Track - Friday’s employment report isn’t likely to shake the Federal Reserve from its strategy of slowly winding down its bond-buying program while keeping short-term interest rates pinned near zero well into 2015. Key data points were largely consistent with the Fed’s view of how the economy is evolving. A healthy payroll employment gain of 192,000 in March, taken together with upward revisions to hiring estimates for the two previous months, suggest the labor market is strong enough to tolerate the Fed’s slow retrenchment of its bond program. A one-penny drop in average hourly earnings for all workers and an unchanged unemployment rate at 6.7% support Fed Chairwoman Janet Yellen’s conclusion that wage and inflation pressures aren’t building and interest rates can stay low for longer. Beneath these headline numbers were some encouraging trends. The employment-to-population ratio — a measure of the proportion of Americans who are working — rose slightly to 58.9%, its highest level since August 2009, from 58.8% in February. That points to an economy that is gradually taking up economic slack. Labor force participation — the share of adults holding or actively seeking jobs –rose to 63.2% from 63.0%, a sign Americans might be returning from the fringes of a weak economy to find and look for jobs. That is still no higher than it was in September. One line in the report deserves extra scrutiny. The number of people out of work for six months or longer dropped 110,000 to 3.739 million, after rising the month before. In all the pool of long-term unemployed was down 837,000 from a year earlier. We need to learn more about what is driving these numbers down. It is either because long-term unemployed dropped out of the labor force or because they found jobs. If it is the latter, it supports Ms. Yellen’s view that a stronger economy will take up the slack.
IMF: Successful exit from QE balances on a knife-edge - A badly-timed exit from quantitative easing (QE) and subsequent interest rate rise in the US could wreak havoc with global financial stability, the International Monetary Fund (IMF) has warned. The think tank cautioned that, on the one hand, the longer the US Federal Reserve continued with “extraordinary policies” - QE and ultra-low interest rates - the more financial stability risk will build up. On the other, a hasty end to QE, triggered by rising inflation or concern about financial stability, would shock global markets, the IMF warned in its Global Financial Stability Report. The Fed’s announcement last May that it was considering reducing bond purchases - or tapering - unleashed a global sell-off as investors braced for a sharp reduction in the amount of liquidity in the financial system. Emerging market assets were the worst-hit. The US central bank did not start tapering until December and has trimmed asset purchases at every policy meeting since. Asset purchases have now fallen to $55bn per month from the monthly $85bn prior to December. “As the turbulence of last May demonstrated, the timing and management of exit is critical,” said the report. It added: “Undue delay could lead to a further build-up of financial stability risks, and too rapid an exit could jeopardize the economic recovery and exacerbate still-elevated debt burdens in some segments of the economy.”
FRB: Press Release--Minutes of the Federal Open Market Committee, March 18-19, 2014 --April 9, 2014
Fed minutes indicate easy-money policy may persist - — An account of the Federal Reserve's last meeting suggests that policymakers aren't as eager to take away the punch bowl as the market thought. The minutes of the March 18-19 meeting state that Fed officials worried that their individual projections for when the central bank would start raising interest rates "could be misconstrued" as indicating a shift by the Fed committee to tighter monetary policy. The average projections released after the March meeting showed a slight move forward in the anticipated timing of a Fed rate increase, and Fed Chairwoman Janet L. Yellen herself gave the impression in a news conference that day that a rate hike could be made by mid-2015, earlier than what the market had been expecting. But since then, Yellen has sought to reassure investors and others that the Fed remains committed to its easy-money policy, largely because of the weak labor market. The minutes reinforced that view — and investors welcomed it. If investors were looking for something cheery in the minutes, analysts said, they seemed to seize on this line in particular: "Several [Fed] participants noted that the increase in the median projection overstated the shift in the projections." Still, it's an open question when the Fed will begin to raise its benchmark short-term interest rate, which has been pinned near zero since December 2008.
Minutes show Fed struggled to agree on rate policy - The Federal Reserve struggled last month over how to convey to investors the pace at which it will raise short-term interest rates once it increases them from record lows. Two weeks before the Fed's regular meeting March 18-19, it held an unusual and previously unannounced videoconference to debate the issue, according to minutes of the meeting released Wednesday. In the end, the Fed settled on an open-ended approach: That even after employment and inflation are nearly back to normal, short-term rates may need to stay unusually low for a while because the economy isn't fully healthy. Stock and bond investors read the minutes to signal that the Fed plans to favor low short-term rates longer than many had assumed. Stocks rose sharply after the minutes were released, and bond yields fell. The Dow Jones industrial average, which had risen modestly before the minutes were released, was up 154 points 30 minutes later. Investors have been intensely following the Fed's guidance on rates because higher short-term rates would elevate borrowing costs and could hurt stock prices. The minutes covered the first Fed meeting at which Yellen presided as well as the March 4 videoconference. At both sessions, the issue of the language the Fed uses in its statements to signal the timing of future policy actions was a topic of extended debate. The Fed has kept its key short-term rate at a record low near zero since December 2008. It made no change to that rate at the March meeting. But it dropped language from its statement that had previously said this rate would likely remain low "well past" the time unemployment fell below 6.5 percent. Instead, the Fed said it would review a "wide range of information" before starting to raise rates. It repeated language that it expected to keep rates low for a "considerable time" after it stops buying bonds.
Fed Officials See Dwindling Risks and Uncertainty in Their Forecasts - Federal Reserve officials may not be very confident that they can send clear signals about the path of interest rates. What they are increasingly certain about is the path of the economy. As part of the Federal Open Market Committee’s minutes, officials publish their assessments of uncertainty and risks in their own forecasts, and their confidence has only grown over the past three years. In their most recent assessment, most officials said the economy would grow 2.8% to 3.2% and the unemployment rate would end the year at 6.1% to 6.3%. Throughout 2012, nearly all Fed officials said their forecasts were highly uncertain, yet over 2013 their confidence rose and their estimates of uncertainty have dwindled. In the minutes to their March 18-19 meeting, only two officials rated their uncertainty about growth and unemployment as high. Fed officials also estimate whether their risks are weighted to the upside or downside, that is, whether they believe there is a greater chance of a deterioration in the economy or an uptick. Over the past two years, officials have grown much less concerned that growth may disappoint or that the unemployment rate may begin to rise. In March, none of the Fed’s 16 policy makers saw the risks to joblessness as weighted toward a higher unemployment. Only two officials said growth was likelier to disappoint than not.
Fed Watch: When Will The Fed Change Its Reaction Function? - The March FOMC minutes were generally interpretted as having a dovish tenor, contrasting with the generally hawkish reception for the statement and ensuing press conference. Overall, the Fed appears committed to a long period of low interest rates and I continue to think this should be the baseline view. This was my interpretation - the upward shift of the dots were consistent with a change in the unemployment projections given the Fed's reaction function. But that doesn't quite explain why the reaction function is so tight to begin with. This is I think the best explanation: In their discussion of recent financial developments, participants saw financial conditions as generally consistent with the Committee's policy intentions. However, several participants mentioned trends that, if continued, could become a concern from the perspective of financial stability. A couple of participants pointed to the decline in credit spreads to relatively low levels by historical standards; one of these participants noted the risk of either a sharp rise in spreads, which could have negative repercussions for aggregate demand, or a continuation of the decline in spreads, which could undermine financial stability over time. One participant voiced concern about high levels of margin debt and of equity market valuations as well as a notable shift into commodity investments. Another participant stressed the growth in consumer credit to less creditworthy households. I think the Fed's reaction function now includes some financial stability variable, but the Fed is loath to discuss that variable and the related parameters impacting policy. That said, we are fairly confident that the push to end asset purchases and plan the exit from zero rates were a response to bubbling financial stability concerns at the Fed. They simply hid that behind the "progress toward goals" language.More surprisingly is that not only did they begin the exit from extraordinary stimulus in the face of clearly suboptimal labor outcomes, they did so in the face of clearly suboptimal inflation outcomes. Now, though, they may be realizing the error of their ways.
Bank Of America’s Harris Laments Fed Minutes Muddled Messaging - In a note to clients, Bank of America Merrill Lynch chief economist Ethan Harris said, “of all the Fed’s communications tools, the minutes seem to be the most confusing to markets.” Instead of the consensus view presented by the official policy statement that follows each policy meeting, the minutes are simply a jumble. . The central bank releases the minutes of each meeting of the Fed’s policy committee three weeks after the gathering. The document is not a transcript of the conversations, and does not identify speakers by name. But it is nevertheless a detailed description of the officials’ discussion and decisions. As Mr. Harris sees it, the problem with the minutes is they doesn’t represent the true balance of power on the policy committee. Because all voices are heard and recorded in the minutes, the document can obscure the strong and dominating role played by Fed Chairwoman Janet Yellen, other Washington-based Fed governors and New York Fed president William Dudley. The 12 regional bank presidents who participate in the deliberations often hold views that diverge with Ms. Yellen and her allies. But for some time now, these dissident and alternative views have rarely influenced the choices made by the Fed. “The minutes present a confusing comingling of the views from the majority voters, dissenters and nonvoters” on the committee, Mr. Harris said. Because there’s no weighting of the views, the minutes can on many occasions seem like the Fed is collectively more interested in moving away from its current ultra-easy money regime than is the case. “The minutes provide a platform for the hawks to protest against the current policy” supported by core of Fed officials, who have been consistently supportive of aggressive action to lower unemployment and push inflation back towards the Fed’s 2% target, the economist said.
NY Fed Survey: Dealers Expected Fed to End Thresholds at March FOMC - Surveyed ahead of the Federal Reserve’s March policy meeting, Wall Street’s biggest banks broadly expected the central bank to stop providing numbers-based guidance about the timing of a future interest rate increase.On Thursday, the Federal Reserve Bank of New York reported the findings of its regular pre-policy meeting survey of the large banks that form the list of so-called primary dealers. This 22-deep roster deals directly with the Fed as it intervenes in markets to implement monetary policy. The banks’ views were collected ahead of the March 18-19 Federal Open Market Committee meeting.At that gathering, the Fed continued to cut the pace of its bond-buying program and indicated it would gradually wind down the effort on the way to closing it some time before the end of the year. The Fed also stopped providing specific job and inflation thresholds that, once reached, would cause central bankers to start considering the possibility of an increase in short-term interest rates. The Fed switched to a softer form of guidance about the outlook for rate increases, in large part because the current 6.7% unemployment rate was very close to the 6.5% threshold that was intended to start the rate hike dialogue. The end to numbers-based guidance had been widely signaled by Fed officials ahead of their meeting. Influential New York Fed President William Dudley told The Wall Street Journal in early March the threshold system had become “obsolete” and that he was in favor of a change.
Fed’s Tarullo: Uncertainty Over Labor Market Slack Means Fed Must Proceed “Pragmatically” - Federal Reserve Governor Daniel Tarullo on Wednesday said policy makers should proceed cautiously in judging when inflationary pressures are building in the economy, given uncertainty that surrounds just how much slack remains in the labor market. Mr. Tarullo placed himself in the camp of Fed Chairwoman Janet Yellen, saying he believes the labor market is still operating well short of its potential and associating himself with her March 31 speech explaining the reasons why. Given there is some debate over how to measure labor market slack, “we are well advised to proceed pragmatically,” he said. He stressed Fed officials should await actual evidence that labor markets had tightened enough to trigger inflationary pressures that could push inflation above the Fed’s 2% inflation target. The Commerce Department’s personal consumption expenditures price index, the Fed’s favored measure of inflation, was up 0.9% in February from a year earlier. The Labor Department’s consumer price index, an alternative measure, was up 1.1%. “But we should not rush to act preemptively in anticipation of such pressures based on arguments about the potential increase in structural unemployment in recent years,” he said.
Economy Doing So Well, Fed Carries Out Staged Withdrawal -- Yes, the economy is doing so well that, in the coming final day of the Fed’s staged withdrawal from QE, the Fed’s choppers will leave from the rooftops of Washington and Wall Street as friendly forces scramble to get aboard the last one. That’s how well things are going. As the banksters leave town with their sacks of stolen gold on the last of those Fed copters, the population will be abandoned to fend for itself, after years of having their savings stolen and no fake jobs created to ease their pain in return. The good manufacturing jobs left decades ago, and there are no new orders for big ticket goods coming to restore them. But fear not, workers of America! Yesterday we got the good news that new job openings in February were the highest in six years. Bubbleberg was so enthused, it blabbered: Job openings in the U.S. rose more than forecast in February to a six-year high as employers moved to boost hiring in response to rising consumer demand. The number of positions waiting to be filled in the U.S. climbed by 299,000 to 4.17 million in February, the most since January 2008, from a revised 3.87 million the month before, the Labor Department reported today in Washington. I wondered if those “positions” were missionary or doggie style. And I thought, “Wow, since 2008? But aren’t there 24 million more Americans now than then? Wouldn’t it be more honest to reveal the job openings ratio?” So, as is my compulsion, I chewed on my thoughts and digested them. Below is what came out.
Vital Signs: Inflation Is Still Low, and the Fed Is Still Concerned - Pricing power remains weak for most businesses, a sign that demand in the U.S. economy lags available supply. That gap is a growing concern at the Federal Reserve. According to Friday’s producer price index report, producer prices for final demand goods and services were up just 1.4% in the year ended in March. The PPI for just goods was up 1.1%, and for services, 1.6%. After energy prices pumped up inflation in 2011, price increases at the production level have not shown much momentum. Except for one or two months, yearly price gains have stayed below 2%. Fed officials are growing concerned that inflation is too low. In an April 8 speech, Minneapolis Fed president Narayana Kocherlakota explained why the lack of pricing power is a problem: “Inflation is low compared to the Fed’s target when the demand for goods and services is too low to fully use the available resources in society. The low inflation in the United States tells us that resources are being wasted.”
Evans: Fed Should Address Low Inflation with ‘Strong Accommodation’ - Low inflation is a serious concern and the Federal Reserve should keep interest rates low for a long time to help address it, Federal Reserve Bank of Chicago President Charles Evans said Wednesday. “We have strong accommodation in place, and we need to leave it in place in order to do the job that it’s intended to do,” Mr. Evans told reporters following a speech at a conference here. He added, “I’m not quite sure why we would want to raise interest rates with a 1% inflation rate, no matter what the unemployment rate is.” The Fed is winding down its bond-buying program, which aims to spur economic growth by reducing borrowing costs, as the labor market improves. The Fed has cut its monthly bond buying in $10 billion increments from $85 billion in December to $55 billion currently. Mr. Evans said continuing to reduce purchases by $10 billion per policy meeting “seems like a reasonable pace” that would wind down the program this year. When it comes to raising short-term interest rates, which have been anchored near zero for more than five years, Mr. Evans said it’s likely the first rate hike will come in late 2015. But, he said, “if I had my druthers, I’d want more accommodation and I’d push it into 2016, just because I think we need more accommodation. I think later will be better for the economy than earlier.” The Fed’s preferred inflation gauge, the Commerce Department’s personal consumption expenditures price index, rose 0.9% in February from a year earlier, and was up 1.1% excluding the volatile categories of food and energy. That was the 22nd consecutive month inflation had undershot the Fed’s 2% long-term target. “We need to get it up to 2% and a modest overshoot is, I think, completely reasonable,” Mr. Evans said.
Forward Guidance - Kunstler - Guess what? There is none. Rather, the Federal Reserve practice of Delphically divulging its intentions ought to be understood as the master pretense of US economic life — the delusion that wise persons are actually in control of anything. The result of this guidance continues to be the mis-pricing of everything, especially the cost of money as represented in the operations of debt, and hence the value of everything denominated in money. The interventions of our central bank have really been aimed at one objective: to compensate for the contraction of real wealth in an economy that replaced purposeful activity with Kardashian studies and tattoo art. Purposeful economic activity provides surpluses that allow for the repayment of debt. Kardashian study and tattoo art lead to entropic entrapment, aka, a death spiral of culture and economy. That’s where we are at. The debt is now eating us alive, and the central bank trick of piling on additional debt to mask the failure of repaying old debt is losing its palliative punch. One big problem with the Fed’s policies is that the mis-pricing of everything ends up being expressed in the very statistics (GDP, unemployment, inflation) that are used to justify further interventions that produce ever deeper perversities. That is, the Fed distorts prices, which distort statistics used to make policy, which prompt the fed to ramp up policies that further distort prices, a dangerous recursive dynamic. Since prices are the basic information for running an economy, we end up in a situation where nothing really adds up. The antidote to that has been pervasive accounting fraud — the covering-up of mis-pricing, pretending that things add up when they don’t. The poster child for that, of course, is the US government, the operations of which are so saturated in falsity that the inspectors general in every branch and agency might as well just fling linguini against the wall to arrive at whatever conditional reality suits their bosses. The pretense extends to the largest financial institutions including the TBTF banks (their vaults stuffed with the detritus of epic swindles), to the giant pension funds, which were among the chief victims of the swindling, to the corporations dedicated to producing this-and-that, whose cost structures are so fatally impaired by all the aforesaid mis-pricing and accounting fraud, that they must resort to massive stock share buy-backs to maintain the illusion of being going concerns, to the millions of ordinary households running on maxed-out plastic.
Who Bears “Federal Reserve Risk”? -Actions by the Federal Reserve are having strong effects on the price of stocks, bonds, and other financial assets in the economy. You can see this effect clearly on Fed meeting days, which are associated with large market movements. A question we tackled in an earlier post was: what assets bear the most risk of surprise Fed announcements on the direction of monetary policy? We are following up on that post because we now have another observation: the March 19th, 2014 Fed meeting which was Janet Yellen’s first meeting as Fed Chair. The meeting released information that the Fed planned on tightening sooner than markets expected — many attributed the market’s reaction to some combination of FOMC forecasts and Yellen’s statement that there would likely be 6 months between tapering ending and increases in the target Federal Funds Rate. So we now have three days where we observe the Fed “surprising” markets with new information on the pace of tightening: So what investments bear “Fed risk”? As we did before, we choose to look at ETFs available from Vanguard. This was an arbitrary choice–we just wanted to examine broad asset classes. We deleted a few because there were too many to see clearly on charts. We then take the single-day returns on these three days to see which investment move the most. Those that move the most on these days are those that bear the most Fed risk. As we will show below, there is an amazing degree of consistency across the three events in the assets that bear Fed risk. This is despite the fact that the first and last event occurred 9 months apart! So there really seems to be a “Fed risk factor” on which some investments load. We start with the punchline, and those interested can see more details below. Here is a ranking of the investments, where the investment on top of the list bears the most Fed risk, and the investment on the bottom bears the least:
The foxy Fed - A few days ago, the Fed released its workhorse model of the macroeconomy - the FRB/US model - to the public. The model had been only semi-private before, since the Fed would send it to interested researchers, and revealed some information about it to the general public. But now the model is fully public. How should we interpret that action?Why didn't the Fed fully reveal FRB/US model before now? It always seemed to me that it was basically because of - for lack of a better word - embarrassment. Academic macroeconomists haven't used or studied this type of model in decades (having abandoned everything else in favor of DSGE). In 2010, Chris Sims appeared to call models like FRB/US "something close to a spreadsheet". Since most Fed employees are drawn from the same pool of people as academic macro (and interact with academic macroeconomists quite frequently), the fact that they use something like FRB/US must have seemed a bit awkward. In fact, I've heard academic macroeconomists make fun of FRB/US a number of times. So if my guess is right, the Fed's publication of FRB/US indicates that whatever embarrassment existed is now essentially gone. That is kind of interesting.
Oligarchy and Monetary Policy - Paul Krugman - I’ve been thinking about how we talk about — or don’t talk about — the desirability of low inflation targets. As I noted the other day, the lates IMF World Economic Outlook makes a compelling case for raising the target above 2 percent — but avoids saying so explicitly, resorting to coded euphemisms. Meanwhile, inflation paranoia is very much a partisan thing. In my class notes for tomorrow I list the signatories of the economists’ letter warning about dollar “debasement” from quantitative easing; it’s obvious that everyone on the list is a highly committed Republican, and some people with the right ideological credentials are on board even though they have no relevant professional credentials. (William Kristol and Dan Senor, monetary experts?) So what’s going on here? Let me suggest that it is, ultimately, a class thing. Monetary policy isn’t really technocratic and politically neutral; moderate inflation may be good for employment, especially when you’re trying to work off a debt overhang, but it’s bad for the 0.1 percent. And that fact ends up exerting a huge influence on the discussion.
Oligarchs and Money, by Paul Krugman - Econonerds eagerly await each new edition of the International Monetary Fund’s World Economic Outlook. Never mind the forecasts, what we’re waiting for are the analytical chapters, which are always interesting and even provocative. This latest report is no exception. In particular, Chapter 3 — although billed as an analysis of trends in real (inflation-adjusted) interest rates — in effect makes a compelling case for raising inflation targets above 2 percent, the current norm in advanced countries. This conclusion fits in with other I.M.F. research. Last month the fund’s blog — yes, it has one — discussed the problems created by “lowflation,” which is nearly as destructive as outright deflation. An earlier edition of the World Economic Outlook analyzed historical experience with high debt, and found that countries that were willing to let inflation erode their debt fared much better than those that clung to monetary and fiscal orthodoxy. But the I.M.F. evidently doesn’t feel able to say outright what its analysis clearly implies. Instead, the report resorts to euphemisms that preserve deniability: the analysis “could have implications for the appropriate monetary policy framework.” So what makes the obvious unsayable? In a direct sense, what we’re seeing is the power of conventional wisdom. But conventional wisdom doesn’t come from nowhere, and I’m increasingly convinced that our failure to deal with high unemployment has a lot to do with class interests.
Are Investors Less Confused About Real and Nominal Interest Rates Than They Were 40 Years Ago? - Dean Baker - Brad DeLong picks up on Paul Krugman's column and questions whether the top one percent of the income distribution (or top 0.01 percent) really have much to fear from higher inflation. Brad concludes that they don't, but that they think they do. He says: "The top 0.01% were impoverished by the 1970s as a whole. But they have not been enriched by the post 2008 era. What they have gained via a higher capitalization via low safe interest rates has been offset by what they have lost as a result of depressed profits, depressed by a low level of economic activity, a depression which has not been completely offset by downward pressure on wages. The top 0.01% would not be poorer absolutely (although they would be poorer relatively) in a high-pressure higher-inflation economy."I'm not sure about Brad's story here. While weak GDP growth has undoubtedly depressed profits, this has been largely offset by a large increase in profit shares. If I were a 0.01 percenter, I would certainly not be confident that a return to something resembling full employment would not depress profits. In other words, a loss in profit share due to higher wage pressures could certainly offset the gains due to increased output. Also, from the standpoint of the rich, why risk it? The other factor that could carry much weight in the minds of the super-rich is the impact of inflation on the stock market. Brad notes the plunge in stock valuations in the 1970s as one of the items that reduced the wealth of the rich:
Which social groups and classes should fear higher price inflation? -- Paul Krugman considers who is helped and hurt by higher rates of price inflation, and he sees the big losers as the wealthy oligarchs (and see his column today here). In contrast, I see the big losers as those with protected service sectors jobs who do not wish to have their contracts reset. If you are a schoolteacher, a nominal wage cut is likely to mean a real wage cut because you don’t have the power to renegotiate into a deal as good as the one you started with. The declining labor mobility of the United States in general means that workers are more vulnerable to higher rates of price inflation. A guy living in Cleveland who plans on leaving for Houston is probably less worried about nominal variables, because he will be doing a new contract negotiation anyway. We all know that inflation is extremely unpopular with voters. We also observe that inflation remains extremely unpopular in a variety of northern European economies, which typically have more egalitarian distributions of income (though not always wealth) than does the United States. In any case the top 0.1 percent in those countries has less wealth per capita than in the U.S. and, at least according to progressives, less political influence too. Of course the ability of inflation to erode rents is one of its virtues. The super-wealthy are often earning rents, but typically those rents are structured to be relatively robust to changes in nominal variables. For instance the rent might take the form of IP rights, or resource ownership rights. Simple loans of money, as we find in traditional creditor-debtor relationships, just aren’t monopolizable enough or profitable enough to be a major source of riches for the most wealthy.
Only the ignorant live in fear of hyperinflation - FT.com: Some years ago I moderated a panel at which a US politician insisted that the Federal Reserve’s money printing would soon cause hyperinflation. Yet today the Fed’s main concern is rather how to get inflation up to its target. Like many others, he failed to understand how the monetary system works. Unfortunately ignorance is not bliss. It has made it more difficult for central banks to act effectively. Fortunately the Bank of England is providing much needed education. In its most recent Quarterly Bulletin , its staff explain the monetary system. So here are seven fundamental points about how it really works as opposed to how people think it does. First, banks are not just financial intermediaries. The act of saving does not increase deposits in banks. If your employer pays you, the deposit merely shifts from its account to yours. This does not affect the quantity of money; additional money is instead a byproduct of lending. What makes banks special is that their liabilities are money – a universally acceptable IOU. In the UK, 97 per cent of broad money consists of bank deposits mostly created by such bank lending. Banks really do “print” money. But when customers repay, it is torn up. Second, the “money multiplier” linking lending to bank reserves is a myth. In the past when bank notes could be freely exchanged for gold, that relationship might have been close. Strict reserve ratios could yet re-establish it. But that is not how banking operates today. In a fiat (or government-made) monetary system, the central bank creates reserves at will. It will then supply the banks with the reserves they need (at a price) to settle payments obligations.
Central Banks See What They Want in Ignoring Deflation - Federal Reserve Chair Janet Yellen and her international counterparts are suffering from a case of what psychologists call confirmation bias: They keep insisting inflation will accelerate even as it continues to ebb. That’s the diagnosis of Ethan Harris, co-head of global economics research at Bank of America Corp. in New York. He says central bankers are seeing what they want to see by blaming subpar inflation in their countries on temporary, partly home-grown forces. That risks ignoring more lasting, global influences ranging from weak worldwide demand and more emerging-market competition to cheap labor in developing nations, cooling commodity prices and technological breakthroughs. “There is much lower-than-expected inflation showing up in too many places in the world to dismiss it as transitory,” Almost two-thirds of the 121 economies tracked by Bloomberg are experiencing smaller gains in consumer prices than a year ago, with many undershooting their goals. Global inflation was just 2 percent in February, the lowest since late 2009, when the world was struggling with recession, according to a tally by economists at JPMorgan Chase & Co.
Now is the time to preempt deflation - AEI - Key points in this Outlook:
- Inflation is falling in the United States, Europe, and China, suggesting a real threat of impending deflation that could cripple the global economy.
- Deflation is especially dangerous because it is self-reinforcing; once it takes hold, economic conditions will get much worse before they get better.
- Central banks in the United States and around the world must end their complacency and respond preemptively to the threat by monitoring inflation rates and undertaking aggressive monetization.
Anyone taking painkillers knows that it is important to ingest the medicine before the pain intensifies. You must be preemptive. If you delay taking that pill until you feel pain, you are in for some real discomfort before you feel relief. The same is true with deflation. It is necessary to be preemptive. Deflation is self-reinforcing, so if you wait to offset it until prices are actually falling, you risk losing control. The resulting pain can be more substantial than the physical pain that results from delaying ingestion of painkillers, since those will eventually quell discomfort, and deflation’s appearance suggests that it will intensify before you can get control of it.
The future for real interest rates - The OECD pointed out last week that the ratio of public debt/GDP will reach all time historic highs in 2014, at about 120 per cent. Taken in isolation, this could certainly viewed as a worrying fact, with bad implications for the future of real interest rates and possibly inflation. A couple of days later, however, the IMF published a fascinating chapter in its latest World Economic Outlook (WEO) on global real interest rates, showing that the global real rate has fallen from about 6 per cent in the early 1980s to about zero today. Both of these facts are of course very well known, but placed side-by-side, they still represent a stark contrast: They also present a conundrum for policy makers and investors. Why has the surge in public debt not resulted in a large rise in real borrowing costs for the government, and for the wider economy? And what does this tell us about the future of the risk free real rate in the global economy? The risk free rate is the bedrock of asset valuation, and is often presented as one of the great “constants” in economic models. But in the past few decades, it has been anything but constant.
'Summers: Lack of Demand Creates Lack of Supply' - For those of you who just can't get enough of Larry Summers (his 2 hour talk starts at the 9:00 mark):
The Most Important Charts In The World - Business Insider: Here they are: the most important charts in the world. We asked our favorite portfolio managers, strategists, analysts, and economists across the Street for the charts they deem the most important right now. This is what they sent us. Much of the focus is on the amount of slack left in the labor market and the U.S. economy in general. Many are focused on the euro, too, which has surprised many observers with its persistent strength. But there are a lot of other things going on — such as the drop in inflation expectations since the Fed began winding down quantitative easing (QE).
Treasury Snapshot: 10-Year Yield Closes Near Its 2014 Low -- The daily close yield on the 10-year note has been relatively range-bound since early February, with low of 2.60% on March 3rd and a high of 2.82% on April 2nd, which was the record closing high for the S&P 500. Today's official close is 5 bps above that March low, which was also the lowest close of 1014. The latest Freddie Mac Weekly Primary Mortgage Market Survey, released today, puts the 30-year fixed at 4.34%, 103 bps above its all-time low of 3.31% in late November of 2012 year and 24 bps below its 4.58% interim high reported in August of last year. The 30-year Treasury closed today at 3.52%. Here is a snapshot of the 10-year yield and 30-year fixed-rate mortgage since 2008. A log-scale snapshot of the 10-year yield offers a more accurate view of the relative change over time. Here is a long look since 1965, starting well before the 1973 Oil Embargo that triggered the era of "stagflation" (economic stagnation with inflation). I've drawn a trendline connecting the interim highs following those stagflationary years.
America is not broke -- “We’re broke.” House Speaker John Boehner (R-Ohio) and Tea Party groups have repeated that phrase so frequently that it must be true, right? But America is not broke. Our short-term budget outlook is stable, and our long-term challenges are manageable if both sides are willing to compromise. So why would politicians falsely claim that we’re broke? To justify radical changes to our nation’s social contract that Americans would never accept any other way. This may be surprising, given how much we hear about a looming “debt crisis.” But annual budget deficits have fallen by almost two-thirds over the past five years. The total national debt is actually projected to shrink in each of the next three years as a share of the economy.Exaggerating our debt does not advance smart fiscal policies. It does, however, undermine the social programs created by the New Deal and the Great Society by making their successes appear hopelessly unaffordable and doomed to failure. If our debt is out of control, then Social Security, Medicare and Medicaid would seem like unrealistic pipedreams. Feeding the hungry, rebuilding our infrastructure and educating our children would sound like nice ideas, but too much for the government to handle. That’s where the Republican budget comes in. For the past few years, House Republicans have passed a budget that radically reduces support for healthcare, economic opportunity and a safety net for hard times. By claiming to address an urgent “debt crisis,” it dismantles the social contract that Americans have made with their government for decades. These Republican budgets replaced Medicare with a voucher to help pay for health insurance. But that voucher would fail to keep up with the rising cost of healthcare, so those expenses would just shift from the government to senior citizens.
America’s Fiscal Health Affirmed as Treasuries Demand Rises - America’s improving fiscal health is starting to be reflected in the market for Treasuries. As the Federal Reserve scales back its unprecedented bond buying this year, the ability of the world’s largest debtor nation to attract investors underscores the strides the U.S. has made to strengthen its creditworthiness after the worst financial crisis since the Great Depression. With the budget deficit at a seven-year low and household wealth rising to a record, investors from mutual funds to foreign central banks are buying a greater share of Treasuries at government auctions than ever compared with bond dealers that are obligated to bid. “This goes a long way to blunting the criticism of investing in the U.S. dollar,” Investors submitted bids for $1.73 trillion of government notes and bonds at auctions held in the first quarter, or 3.07 times the $564 billion that was sold, according to data compiled by Bloomberg. The bid-to-cover ratio rebounded from last year’s 2.87, which was the lowest annual level in four years. The last time the ratio was higher on a quarterly basis was in 2012, when demand peaked at a record 3.12 times. Investors also bought a 58.7 percent of Treasury debt issued last quarter, with the rest purchased by the 22 primary dealers that trade with the Fed. Increased demand has helped curb U.S. borrowing costs, confounding forecasters who said yields would rise as the Fed started to cut back on its $85 billion of monthly purchases of Treasuries and mortgage-backed bonds to support the economy.
CBO: Federal Deficit through March $187 billion less this year than it was in fiscal year 2013 - From the Congressional Budget Office (CBO): Monthly Budget Review for March 2014 The federal government ran a budget deficit of $413 billion for the first six months of fiscal year 2014, CBO estimates—$187 billion less than the shortfall recorded in the same span last year. Revenues were about 10 percent higher; and outlays, about 4 percent lower. ... And for March 2014: The federal government incurred a deficit of $36 billion in March 2014, CBO estimates—$71 billion less than the $107 billion deficit incurred in March 2013. Because March 1 fell on a weekend in 2014, certain payments that ordinarily would have been made in March this year were made in February. Without those shifts in the timing of payments, and prepayments of deposit insurance premiums that lowered collections in fiscal year 2013, the deficit in March 2014 would have been $34 billion smaller than it was in the same month last year. The consensus was the deficit for March would be around $133 billion, and it appears the deficit for fiscal 2014 will be smaller than the CBO currently expects (less than 3.0% of GDP). Of course there will be a solid surplus in April.
NY Times on the Smaller Budget Deficit - First an error ... From the NY Times: Tax Revenue Soars, Decreasing Deficit, U.S. says Over all, the deficit is expected to equal 4.1 percent of gross domestic product in 2014, down from nearly 10 percent in 2009, during the depths of the recession. Actually in February the CBO projected the deficit to be 3.0% of GDP in fiscal 2014 (4.1% was for fiscal 2013). Next week the CBO will update their projections, and I expect the deficit projection for 2014 to be revised down again. NY Times: The deficits in the next few years are expected to stay at 2 to 3 percent of gross domestic product, before widening sharply again toward the end of the decade. It depends on what "widening sharply" means, but the CBO is projecting 3.4% in 2019 and 3.7% in 2020. And this is a key point: “It is the fastest four-year reduction in deficits since the demobilization after World War II,” [said Ernie Tedeschi, head of fiscal analysis at ISI], “but it has come in the middle of an economy that is not yet healed from the worst recession since the Great Depression.” The economy would probably be better off (more employment, faster GDP growth) if the deficit hadn't been reduced so quickly.
As Congress Votes on Budget Proposals, It Is Also Voting on Whether It Understands the Economy - Later today and tomorrow, the House of Representatives will consider and vote on six different budget proposals—those put forth by the House leadership of both the Democratic and Republican parties, as well as by the Obama administration, the Congressional Progressive Caucus (CPC), the Congressional Black Caucus, and the Republican Study Committee.We already know that only the Republican budget, authored by House Budget Committee Chair Paul Ryan (R-Wisc.), will pass in the House—and even then, it won’t become law—but it is still important to understand what these proposed budgets call for. While it’s true that a budget proposal is a statement of values, it is also the reflection of its supporters’ understanding of the economy.The chart below shows the cuts and increases to various parts of the budget, as called for by the proposals made by Chairman Ryan, House Budget Committee Ranking Member Chris Van Hollen (D-Md.), and the CPC. Chairman Ryan includes deep cuts to just about every budget function, and doubles down on the unspecified sequester cuts. Rep. Van Hollen’s budget gets rid of the onerous sequestration spending cuts but otherwise primarily stays the course. Meanwhile, the CPC’s budget calls for immediate stimulus spending in order to meet its stated goal of returning the economy to full employment over the next three years.
Now is the time to rebuild our national infrastructure - Opinion - Larry Summers : Are you proud of New York’s John F. Kennedy Airport? It’s a question I ask nearly every audience I speak to these days. JFK, after all, is the largest entry point for foreign visitors arriving in what sees itself as the greatest city on earth. To a person, I’ve never heard anyone answer, “Yes.” Vice President Joe Biden took it one step further in a speech earlier this year, likening the airport down the road, New York’s LaGuardia, to being in “some third-world country.” Yet the unemployment rate for construction workers in the United States is in the double digits. And the government can borrow — in the currency we print — at long-term rates of less than 3 percent. If now is not the moment to rebuild these airports, when will that moment ever come? Related We don’t need another ‘bridge to nowhere’ Boston startup boom wasn’t just luck — thank MeninoThe American economy is not performing to the satisfaction of the American people. Total incomes are about $1.5 trillion less today — or $5,000 per person — than was anticipated in 2007 before the financial crisis began. The share of American adults working has increased only slightly since the recesssion’s trough, and more than 5 million fewer people are working than when employment was at peak levels in the mid-2000s. Median family incomes and hourly wages have remained essentially stagnant for more than a generation. The single most important step the US government can take to reverse these discouraging trends is to mount a concerted, large-scale program directed at renewing our national infrastructure. At a time of unprecedented low interest rates and long-term unemployment, such a program is good economics but, more fundamentally, it is common sense.
Summers on Infrastructure Needs - If there’s something awry in the logic of Larry Summers’ argument here for more infrastructure investment, I certainly can’t see it. Based on low real interest rates, still high unemployment particularly among blue-collar production and construction workers, and most of all, the need for productivity-enhancing investments in our aging public goods, Larry is very much correct to ask “if not now, when?” A few key points:
- –we are, at some point, going to wise up and start engaging in the needed maintenance of our depreciating stock of public goods. America’s roads, airports, and public schools of 2024 will not be those of 2014. So given the confluence of factors Larry identifies, shouldn’t we start now?
–there are many “two-fers” in this space: create jobs for the un- and underemployed WHILE improving productive capacity; borrow to invest WHILE real rates are still low; repair our public schools WHILE improving their energy efficiency (see our FAST! idea)
–Larry doesn’t get much into the politics, but they’re of course central. One could historically count on bipartisan support for this type of investment. I mean, business interests might oppose the minimum wage and unions, but of course they want and need adequate ports, roads, airports, and so on, not to mention a skilled work force. No firm can supply these public goods.
Sources of Federal Revenues, Explained - CBPP -- As Tax Day approaches, we’ve updated several backgrounders that explain how the federal government and the states collect and spend tax dollars. As policymakers and citizens weigh key decisions on how best to shape our future federal government, it’s helpful to examine where the dollars that comprise the budget come from and where they go. The next in our series of revised “Policy Basics” backgrounders explains where our federal revenues come from. In fiscal year 2013, the federal government spent $3.5 trillion on the services it provides, such as national defense, health care programs like Medicare and Medicaid, Social Security benefits for the elderly and disabled, and investments in infrastructure and education, in addition to interest on the debt. Federal revenues financed close to $2.8 trillion of that spending; borrowing financed the remaining $680 billion. The three main sources of federal tax revenue are individual income taxes, payroll taxes, and corporate income taxes; other sources include excise taxes, the estate tax, and other taxes and fees (see chart). Over recent decades, the share of federal revenues coming from individual income plus payroll taxes has grown, while the share from corporate taxes and other revenues has fallen. The Great Recession and the policies enacted to combat it, including temporary tax cuts, depressed federal revenues below the typical levels of recent decades. Revenues fell from 17.9 percent of gross domestic product in 2007 (the last fiscal year before the recession) to 14.6 percent in 2009 and 2010. In 2013 they were 16.7 percent. As the economy recovers, federal revenues are projected to return to higher levels. Click here to read the full paper. For more detail on the tax rates that Americans pay, read our related Policy Basics: Marginal and Average Tax Rates.
Where Our Federal Tax Dollars Go - CBPP - As Tax Day approaches, we’ve updated several backgrounders that explain how the federal government and states collect and spend our tax dollars. As policymakers and citizens weigh key decisions on how best to shape our future federal government, it’s helpful to examine where the dollars that comprise the budget come from and where they go.The first of our revised “Policy Basics” backgrounders explains what federal taxes pay for. In fiscal year 2013, the federal government spent $3.5 trillion — 21 percent of the nation’s gross domestic product — on the critical services it provides, such as national defense, health care programs like Medicare and Medicaid, Social Security benefits for the elderly and disabled, and investments in infrastructure and education, in addition to interest on the debt. As the chart shows, three major areas of spending each make up about one-fifth of the budget: defense and international security assistance; Social Security; and Medicare, Medicaid, and the Children’s Health Insurance Program (CHIP). Together, two other categories account for another fifth of spending: the first is safety net programs, including critical programs like unemployment insurance and SNAP (formerly known as food stamps), which protect people through difficult financial times, and the refundable portion of the Earned Income Tax Credit and the Child Tax Credit, which lift millions of people out of poverty each year; and the second is interest on the national debt. The remaining fifth supports a variety of other public services (see chart).
If You Have High Income, Your Taxes Are Going Up - As the April 15 deadline for filing 2013 income taxes nears, most of us are finding that Uncle Sam will take about the same share of our income as last year. But the story is very different for people at the top of the income ladder. Their taxes are going up, in many cases by a lot. Last year, the American Taxpayer Relief Act (ATRA) extended the Bush-era tax cuts for most Americans but restored higher pre-Bush taxes for high-income households. The top tax rate reverted to 39.6 percent for taxable income over $400,000 for singles and $450,000 for couples. And after a three-year hiatus, the phaseout of personal exemptions (PEP) and the limitation on itemized deductions (Pease) resumed for taxpayers with adjusted gross income (AGI) over $250,000 ($300,000 for joint filers).Virtually all of the tax increase from those provisions and the higher top tax rate falls on those at the top of the income distribution: TPC estimates that after-tax income of the top 1 percent will fall by more than 3 percent. In addition, the Patient Protection and Affordable Care Act (ACA) created two new taxes that were aimed directly at high-income folks and are showing up for the first time on their 2013 tax returns. The Net Investment Income Tax adds an additional 3.8 percent income tax on dividends, capital gains, interest, and other investment income, while the Additional Medicare Tax adds a 0.9 percent tax on wage, salary, and self-employment income. Both taxes kick in when AGI tops $200,000 for singles or $250,000 for couples. Those thresholds are not indexed for inflation (in contrast to tax brackets, PEP, and Pease) and the two taxes will therefore affect more taxpayers in the future. TPC estimates that almost 90 percent of the tax increase will fall on the top 1 percent this year, cutting their after-tax income by nearly 2 percent.
Distressed homeowners seeking mortgage relief could get stuck with a big tax bill - Struggling homeowners across the country could face significant new tax bills if they receive mortgage relief from their banks, a prospect that threatens to slow the housing recovery and put further strain on distressed borrowers. The collapse of the housing market and plunging home prices left millions of people stuck owing more on their mortgages than their homes were worth. Some have worked with their banks to reduce the loan amount to avoid foreclosure or enable a sale. In 2007, Congress adopted a law that spared those homeowners from being taxed on the amount of the loan that was forgiven. But that tax break expired in December, and now the forgiven debt can be counted as income by the IRS. Housing advocates worry that the lapse could scare homeowners away from making a deal with their bank, which could disrupt efforts to reduce foreclosures and harm borrowers who were just getting back on their feet. A recent analysis by the Urban Institute found that about 2 million homeowners will be at risk of incurring that kind of tax liability. A congressional analysis estimates that borrowers will be on the hook for $5.4 billion in extra taxes if Congress fails to renew the tax break, known as the Mortgage Forgiveness Debt Relief Act. At issue are millions of underwater borrowers who are unable to refinance or sell their way out of trouble unless they strike a deal with their lenders, such as a reduction in the amount owed on the loan or the approval of a “short sale,” such as Thompson’s.
Social Security, Treasury target taxpayers for their parents’ decades-old debts - Social Security claims it overpaid someone in the Grice family — it’s not sure who — in 1977. After 37 years of silence, four years after Sadie Grice died, the government is coming after her daughter. Why the feds chose to take Mary’s money, rather than her surviving siblings’, is a mystery. Across the nation, hundreds of thousands of taxpayers who are expecting refunds this month are instead getting letters like the one Grice got, informing them that because of a debt they never knew about — often a debt incurred by their parents — the government has confiscated their check. The Treasury Department has intercepted $1.9 billion in tax refunds already this year — $75 million of that on debts delinquent for more than 10 years, said Jeffrey Schramek, assistant commissioner of the department’s debt management service. The aggressive effort to collect old debts started three years ago — the result of a single sentence tucked into the farm bill lifting the 10-year statute of limitations on old debts to Uncle Sam. No one seems eager to take credit for reopening all these long-closed cases. A Social Security spokeswoman says the agency didn’t seek the change; ask Treasury. Treasury says it wasn’t us; try Congress. Congressional staffers say the request probably came from the bureaucracy.
Is the IRS Unraveling? - The central function of the Internal Revenue Service is intrinsically difficult. In 2013, the IRS processed 146 million individual income tax returns; 2.2 million corporate income tax forms, and overall about 10.5 million business tax returns (including C corporations, S corporations, and partnerships); nearly 30 million employment tax forms (on which employers, including the self-employed, report the income paid to employees and taxes withheld); 1.2 million excise tax forms from the businesses required to collect federal excise taxes on cigarettes, alcohol, and gasoline; and about 275,000 gift or estate tax forms. All of this needs to happen in a mobile and evolving U.S. economy, against the backdrop of an ever-more globalized world economy, and with a tax code that approaches 74,000 pages in length and changes every year. Just in case this isn't enough, we have been loading up the IRS with additional major tasks, too. For example, a number of major income transfer programs like the Earned Income Tax Credit and the Child Tax Credit are now administered through refundable tax credits--that is, payments from the IRS to eligible families. U.S. policymakers count on the progressivity of the U.S. income tax--higher marginal tax rates on those with higher incomes--as a way to limit the rise in income inequality. The U.S. Department of Education often uses the IRS to withhold tax refunds as a way of repaying out-of-date student loans. The Patient Protection and Affordable Care Act was written to require that those who did not have health insurance would make a payment to the IRS, along with many other provisions affecting various business and investment taxes. The IRS is in the center of campaign financing issues with the decisions it makes (and how it makes those decisions) on what groups are eligible for certain kinds of tax-free status. And while this is happening, funding and personnel levels at the IRS have been cut in the last few years.
Rich people rule! - Everyone thinks they know that money is important in American politics. But how important? The Supreme Court’s Gilded Age reasoning in McCutcheon v. FEC has inspired a flurry of commentary regarding the potential corrosive influence of campaign contributions; but that commentary largely ignores the broader question of how economic power shapes American politics and policy. For decades, most political scientists have sidestepped that question, because it has not seemed amenable to rigorous (meaning quantitative) scientific investigation. Qualitative studies of the political role of economic elites have mostly been relegated to the margins of the field. But now, political scientists are belatedly turning more systematic attention to the political impact of wealth, and their findings should reshape how we think about American democracy. A forthcoming article in Perspectives on Politics by Martin Gilens and Benjamin Page marks a notable step in that process. Drawing on the same extensive evidence employed by Gilens in his landmark book “Affluence and Influence,” Gilens and Page analyze 1,779 policy outcomes over a period of more than 20 years. They conclude that “economic elites and organized groups representing business interests have substantial independent impacts on U.S. government policy, while mass-based interest groups and average citizens have little or no independent influence.”
The Richest Rich Have Never Been Richer Than The Rest Of Us - "The message for strivers is that if you want to be very, very rich, start out very rich," is the wondrous conclusion Bloomberg BusinessWeek's Peter Coy has from delving into the details of the latest data on income growth in America. The richest 0.1 percent of the American population has rebuilt its share of wealth back to where it was in the Roaring Twenties. And the richest 0.01 percent’s share has grown even more rapidly, quadrupling since the eve of the Reagan Revolution.
Why We’re in a New Gilded Age - Paul Krugman - Piketty and a few colleagues have pioneered statistical techniques that make it possible to track the concentration of income and wealth deep into the past—back to the early twentieth century for America and Britain, and all the way to the late eighteenth century for France.The result has been a revolution in our understanding of long-term trends in inequality. Before this revolution, most discussions of economic disparity more or less ignored the very rich. But even those willing to discuss inequality generally focused on the gap between the poor or the working class and the merely well-off, not the truly rich—on college graduates whose wage gains outpaced those of less-educated workers, or on the comparative good fortune of the top fifth of the population compared with the bottom four fifths, not on the rapidly rising incomes of executives and bankers. It therefore came as a revelation when Piketty and his colleagues showed that incomes of the now famous “one percent,” and of even narrower groups, are actually the big story in rising inequality. And this discovery came with a second revelation: talk of a second Gilded Age, which might have seemed like hyperbole, was nothing of the kind. In America in particular the share of national income going to the top one percent has followed a great U-shaped arc. Before World War I the one percent received around a fifth of total income in both Britain and the United States. By 1950 that share had been cut by more than half. But since 1980 the one percent has seen its income share surge again—and in the United States it’s back to what it was a century ago.
Tying Jobless Benefits to Corporate Tax Cuts Would Be Inappropriate - CBPP - Key House Republicans reportedly want to tie resuming federal unemployment insurance to extending various corporate tax cuts — including permanent extension of “bonus depreciation.” Policymakers should reject any such effort, given that permanently extending bonus depreciation:
- Entails huge cost. Permanently extending the tax break, which allows businesses to take bigger upfront deductions for certain new investments, would cost $263 billion over the next decade, according to the Congressional Budget Office (CBO).
- Has little bang for the buck. Enacted in 2008, bonus depreciation was among the weakest federal measures to promote jobs and growth in the Great Recession. Mark Zandi of Moody’s Analytics rated it near the bottom of a wide range of stimulus options, estimating that it delivered only 29 cents of additional gross domestic product (GDP) for each dollar of budgetary cost. (Zandi rated unemployment benefits near the top, estimating that it delivered $1.55 of additional GDP per dollar of cost; see chart.) CBO has reached similar conclusions. Also, the Congressional Research Service in 2013 cited studies by the Federal Reserve and others as providing “additional support for the view that temporary accelerated depreciation is largely ineffective as a policy tool for economic stimulus.”Most recently, Goldman Sachs noted “multiple indications that firms do not respond strongly” to bonus depreciation and concluded that its expiration “should have little effect” on the economy.
Congress once again moves to extend ‘tax extenders’ -- The perennial “tax extenders” bill, consisting mostly of corporate tax breaks, always captures the interest of corporations and their lobbyists, if not the public. These tax breaks, over fifty in all, are habitually given one- or two-year temporary extensions, but never made permanent. For example, the tax credit for research and development, one of the largest ones in the bill, has been extended fifteen times since first introduced in 1981. The most recent tax extenders bill expired at the end of 2013; this new bill retroactively extends the provisions through 2015, at a cost of around $86 billion. Unlike oft-heard demands to offset the cost of unemployment benefits or other government spending, the Senate Finance Committee did not compensate the budget for this $86 billion, instead choosing to increase federal spending in a way most comfortable to politicians and their backers, through the tax code. Lawmakers make a big show of lamenting the process of drafting and passing legislation for the same tax breaks every year or two. However, while inefficient, the perpetual uncertainty around tax extenders serves the purposes of both lawmakers and lobbyists. Politicians position themselves as the “champion” of a certain tax break to extract campaign contributions from interested parties. In addition, it’s easier politically to pass a short-term bill that increases the deficit slightly than to make them permanent, with a much larger price tag (close to $1 trillion over a ten-year time frame).
Hypocritical Tax Cuts - On Thursday, a strong bipartisan majority in the Senate Finance Committee voted to reinstate dozens of temporary tax breaks that had expired at the end of 2013. The package, mainly tax cuts for businesses, included sensible items like tax credits for the production of wind energy and other alternative fuels, and for research and development. It also included special-interest giveaways and some silly stuff like bigger write-offs for racehorses. But what’s particularly outrageous is that the bill calls for the government to borrow the entire $85 billion cost of the two-year reinstatement. That is not just imprudent but hypocritical. For the past few years, Democrats have gone along with the Republicans’ refusal to incur debt for programs that are far more effective than tax cuts at boosting the economy and far more urgent — like jobless benefits and spending on education and infrastructure. Instead of borrowing to pay for such needs, lawmakers have coupled most new outlays with spending cuts elsewhere in the budget, which amounts to giving with one hand and taking away with another. In contrast, borrowing to finance the tax cuts basically transfers money to corporate owners and executives, with no reduction demanded in other forms of government aid to business and with future taxpayers left to pay the bill. The Democrats seemed more concerned about defending the tax-cut package than about the double standard involved in subjecting social spending, but not tax breaks, to offsetting budget cuts.
Tiny Maine Against Tax-Dodging Multinationals -- While Congress cowers before multinationals’ lobbyists and moves to re-enact loopholes that let corporations like GE and Apple hide their income from the IRS, the Maine Legislature decided it had had enough. On Friday, April 4, Maine passed legislation that will end some of the games. “I would like the Governor to sign the bill,” said Rep. Adam Goode, the sponsor of the legislation. “The bill is about huge multinational corporations that hide their income in off shore tax havens. Small businesses in Maine don’t use these tricks. That puts Maine’s small businesses at a competitive disadvantage.” Governor LePage has ten days to sign the bill into law, veto it, or let it become law without his signature. According to Maine Revenue Services, closing the “Water’s Edge” loophole will raise $10 million for every two year budget cycle. “In Maine $10 million is a lot of money,” said Rep. Goode. If the Governor vetoes the bill, “we’re sending a message that we’re prioritizing multinational corporations’ access to tax havens over kids’ access to head start or seniors’ access to prescription drugs. Those programs are routinely on the chopping block.”
‘Flash Boys’ Fuels More Calls for a Tax on Trading - It’s not every day that you find a fan club for new taxes, especially among economists and legal experts.But a burst of outrage in recent days generated by Michael Lewis’s new book about the adverse consequences of high-frequency trading on Wall Street has revived support in some quarters for a tax on financial transactions, with backers arguing that a tiny surcharge on trades would have many benefits.“It kills three birds with one stone,” said Lynn A. Stout, a professor at Cornell Law School, who has long followed issues of corporate governance and securities regulation. “From a public policy perspective, it’s a no-brainer.”Not only would the tax reduce risk and volatility in the market, Professor Stout said, but it would also raise much-needed revenue for public coffers while making it modestly more expensive to engage in a practice that brings little overall economic benefit. Despite these arguments, and support from many economists on the left for what European advocates have called a “Robin Hood tax,” even backers acknowledge the idea faces a struggle to become law, especially in the United States but also more broadly in Europe.
The Front-Runners of Wall Street -- In the world of financial trading, a front-runner is someone who gains an unfair advantage with inside information, including access to a high-speed transaction network revealing specific trades other people are trying to make. “Flash Boys,” Michael Lewis’s new nonfiction thriller, reveals the high-tech details of this largely invisible process. More important, it reveals the enabling policies of major Wall Street institutions that did little to discourage it. Like the public bailout of major banks during the last financial crisis, tolerance of front-running challenges the faith that competition always guarantees efficient outcomes and the creed that market value accurately measures real contributions. The book itself sticks to a heroic narrative driven by likable good guys who patiently decipher and partially remedy illegal practices. More bluntly, Mr. Lewis announced on “60 Minutes” last week that the stock market is rigged. Some titans of the financial world, including Charles Schwab, founder of a well-known discount brokerage house, agree. Mr. Schwab describes the form of front-running practiced by high-speed frequency traders as a cancer undermining confidence in the free-enterprise system. Others, including Vanguard’s founder, John Bogle, insist that few investors have actually been hurt by front-running and that high-frequency trading has redeeming features, such as lowering transaction costs. But in merit-based competition, a violation of the rules undermines the larger game regardless of how many individuals are directly harmed by it.
The Father Of High Speed Trading Speaks: "The Market We Created Is A Casino; A Complete Mess; A Rigged Game"-- "I must confess to you that I was an ardent proponent of bringing technology to trading and brokerage. Unfortunately, I only saw the good sides. I saw how electronic trading and record-keeping could be used to force people to be more honest, to make the process more efficient, to lower transaction costs and to bring liquidity to the markets. I did not see the forces of fragmentation and the opportunity for people to use technology to keep to the letter but avoid the spirit of the rules -- creating the current crisis.... Technology, market structure, and new products have evolved more quickly than our capacity to understand or control them. ... To the public the financial markets may increasingly seem like a casino, except that the casino is more transparent and simpler to understand.... The result has been a series of crises over the past few years that have caused many investors to lose confidence or to think that the whole system is a rigged game."
If the New York Stock Exchange is a “High-Frequency Brothel” then the SEC is its Pimp - Pam Martens - Yesterday, Jonathon Trugman wrote in the New York Post that “These traders who use the HOV lane to get ahead of investors could not do their trades without the full knowledge and complicity of the New York Stock Exchange and Nasdaq.” Trubman went on to compare the two best known stock exchanges in the U.S. to houses of ill repute, writing: “What is clearly unfair and unethical — and, frankly, ought to be outlawed — is how the exchanges have essentially taken on the role of running a high-priced, high-frequency brothel…” While it’s true that the New York Post might possibly overuse sexual analogies (on August 10, 2011 it ran a front page cover comparing the Dow Jones Industrial Average to a “hooker’s drawers”), in this instance Trugman is spot on. Not only are the New York Stock Exchange and Nasdaq allowing high frequency traders to co-locate their computers next to the main computers of the exchanges to gain a speed advantage over other customers at a monthly cost that only the very rich can afford to pay but they’re now tacking on infrastructure charges that price everyone out of efficient use of the exchanges except the very top tier of trading firms. Lewis writes in “Flash Boys” that “both Nasdaq and the New York Stock Exchange announced that they had widened the pipe that carried information between the HFT [high frequency trading] computers and each exchange’s matching engine. The price for the new pipe was $40,000 a month, up from the $25,000 a month the HFT firms had been paying for the old, smaller pipe.” By late 2011, according to Lewis, “more than two-thirds of Nasdaq’s revenues derived, one way or another, from high-frequency trading firms.”
Blogs review: High frequency trading -- Michael Lewis’ new book “Flash Boys: A Wall Street Revolt” has unleashed a huge controversy about the economic benefits and costs of high frequency trading (HFT). For the author, this new breed of traders use sophisticated algorithms and fast computers to effectively front-run trades, a practice that is illegal if performed by humans but which remains legal if performed by computers.
Dark markets may be more harmful than high-frequency trading (Reuters) - Fears that high-speed traders have been rigging the U.S. stock market went mainstream last week thanks to allegations in a book by financial author Michael Lewis, but there may be a more serious threat to investors: the increasing amount of trading that happens outside of exchanges. Some former regulators and academics say so much trading is now happening away from exchanges that publicly quoted prices for stocks on exchanges may no longer properly reflect where the market is. And this problem could cost investors far more money than any shenanigans related to high frequency trading. When the average investor, or even a big portfolio manager, tries to buy or sell shares now, the trade is often matched up with another order by a dealer in a so-called "dark pool," or another alternative to exchanges. Those whose trade never makes it to an exchange can benefit as the broker avoids paying an exchange trading fee, taking cost out of the process. Investors with large orders can also more easily disguise what they are doing, reducing the danger that others will hear what they are doing and take advantage of them. But the rise of "off-exchange trading" is terrible for the broader market because it reduces price transparency a lot, critics of the system say. The problem is these venues price their transactions off of the published prices on the exchanges - and if those prices lack integrity then "dark pool" pricing will itself be skewed. Around 40 percent of all U.S. stock trades, including almost all orders from "mom and pop" investors, now happen "off exchange," up from around 16 percent six years ago.
Let’s Stop Talking About HFT for a Little While - mathbabe - It’s unusual that I find myself in the position of defending Wall Street activities, but here goes. I just don’t think HFT is that big of a deal relative to other Wall Street evils. I have written a couple of times about HFT and I’m not a huge fan, and I don’t buy the “liquidity is good and more liquidity is better” argument: at some point enough is enough. I do think that day-to-day investors have largely benefitted from it but that people whose money is in massive funds which are regularly traded have seen their money get skimmed every month. Overall it’s a smallish negative tax on the average person, I’d expect. Here’s why HFT deserves some of our hatred: there’s way too much human resources going into this stuff and it’s embarrassing, what with the laying of cables and blasting through mountains and such. And it’s a great sociological look into the absolutely greed-led mindset of the Wall Street trader, but honestly I think we already had that. It’s really business as usual at a microscopic scale, and nobody should really be surprised to learn that people will do anything to make money that’s technically possible and technically legal, and that they will brag about how they’re making the world a better place while they do it. Same old same old.You wanna focus on something? Let’s talk about money laundering in HSBC and now Citi that is not under control. Let’s talk about ongoing mortgage fraud and robo-signing and the ongoing bailout/ taxpayer subsidy and people still losing their homes, and the poor still being the targets of illegal and predatory loans, and Too-Big-To-Fail getting worse, and the direct line between the bailout and the broken pension promises for civil servants and the overall price list for fraud that has been built.
Why Won't Washington Take on Wall Street's Biggest Crimes? - Yesterday, the judge in the SAC case accepted the firm's plea deal with the Justice Department, in which the firm and its subsidiaries pled guilty to wire fraud and securities fraud and agreed to pay a $900 million penalty and $300 million in disgorged profits. The Southern District hailed the deal as the crowning victory in their multi-year campaign against insider trading, which notably has resulted in more than 70 convictions and exactly zero acquittals. Congratulations. But what many of us want to know is: why, immediately after the most severe financial crisis in more than seventy years, which resulted in the loss of almost nine million jobs, did the Justice Department choose to train its heavy artillery on insider traders? Sure, insider trading is bad. It's very rich people cheating to make themselves extravagantly rich. It should be illegal, and people should go to jail for it. But it's far from the biggest thing wrong with our financial markets and institutions.
A Nefarious Wall Street Practice Quietly Makes a Comeback - Pam Martens - Until bestselling author, Michael Lewis, blanketed the airwaves last week with the news that yet another cartel has formed on Wall Street to front-run the stock trades of ordinary investors with a super-speedy fiber-optic line financed by private investors, the public remained in the dark about the latest weapon in Wall Street’s high-tech arsenal for transferring the little guy’s wealth into the hands of the one percent. The plan was so insidious that it reminded us of the stealth practices carried out by Wall Street in the tech boom of the late 1990s to line the pockets of the corner offices while separating the small investor from his life savings. One of those practices is benignly called a “penalty bid”. And quietly, without news media coverage, the dirty practice is back. It made its comeback on November 27, 2013 in an equally questionable maneuver between the Securities and Exchange Commission, now hobbled with a pack of former Wall Street lawyers running the place, and the Financial Industry Regulatory Authority (FINRA), a self-regulatory body that also runs a private justice system for Wall Street that is devoid of the legal protections afforded in a court of law. Here’s how young stockbrokers on Wall Street typically learn about the penalty bid: a client calls to see if they can buy 200 shares of a company that is going to start trading for the first time (an Initial Public Offering or IPO). The young broker is told his client can have only 100 shares because it’s a “hot” issue (expected to rise in price). On the first day of trading, the stock pops 40 percent and the client calls and tells the broker to sell his shares. But when the trader attempts to place the order to sell, he is told by a superior in his office that his commission will be taken away if he “flips” the trade within 30 days. The young broker takes his order back from the wire operator and heads for his office – presumably to call his client and talk him out of selling his shares. (I personally observed this exact scenario in a Wall Street brokerage firm.)
All the Presidents’ Bankers: Nomi Prins on the Secret History of Washington-Wall Street Collusion (Democracy Now video w/ transcript) With U.S. inequality at its highest point since 1928 and Wall Street bonuses hitting pre-2008 levels, we look at the 100-year history of secret collusion between Washington and the financial industry. In her new book, "All the Presidents’ Bankers: The Hidden Alliances that Drive American Power," financial journalist Nomi Prins explores how a small number of bankers have played critical roles in shaping a century’s worth of financial, foreign and domestic policy in the United States. Prins examines how these relationships have influenced events from the creation of the Federal Reserve, the response to the Great Depression, and the founding of the International Monetary Fund and the World Bank. Now a senior fellow at Demos, Prins is a former managing director at Bear Stearns and Goldman Sachs, and previously an analyst at Lehman Brothers and Chase Manhattan Bank.
Yes, the SEC was colluding with banks on CDO prosecutions -- Back in 2011, I asked whether the SEC was colluding with banks on CDO prosecutions. And now, thanks to an American Lawyer Freedom of Information Request, we have the answer: yes, they were. This comes as little surprise: it beggared belief, after all, that every bank would end up being prosecuted for one and only one CDO. But now we have chapter and verse: the key precedent, it seems, was the first one, Goldman Sachs. The SEC filed its case against Goldman and Tourre on April 16, 2010. Three days later Goldman reached out with a $500 million settlement offer, according to an email that Reisner sent Khuzami. Although that proposal was close to the final payment, it took another three months to announce a settlement. As Khuzami described to Kotz, Goldman wanted a global settlement that resolved not just the Abacus investigation but the SEC’s probes into roughly a dozen other Goldman CDOs. Khuzami didn’t want to give Goldman that public victory. When the SEC and Goldman announced on July 16, 2010, that the investment bank would settle the Abacus case for $550 million, the SEC said in a press release that the settlement “does not settle any other past, current or future SEC investigations against the firm. It’s quite impressive how quickly and accurately Goldman nailed the amount of money that it would have to pay the SEC to settle the case: when it took three months to come to the $550 million settlement, I for one assumed that Goldman had to be dragged kicking and screaming to that point. In fact, however, Goldman was happy to offer half a billion dollars right off the bat. The tough part of the negotiation was not over the Abacus fine — it was over the question of whether the SEC, with the Abacus prosecution successfully under its belt, would then go after Goldman for a dozen other deals which were functionally equivalent.
SEC: More Than Half the Private Equity Firms Gouge on Fees - Yves Smith -- Today, two stories broke on the SEC’s activities in private equity, one in Bloomberg, another in Reuters, and they look to be based on authorized leaks. Together, they suggest that the SEC, which obtained new oversight authority for private equity firms under Dodd Frank, has been turning over rocks and found so many creepy-crawlies that even the normally complacent agency felt compelled to take notice. The Bloomberg story gives broad outlines of the scale of the violations the SEC has found, that over 200 firms examined have engaged in fee abuses: A majority of private-equity firms inflate fees and expenses charged to companies in which they hold stakes, according to an internal review by the U.S. Securities and Exchange Commission, raising the prospect of a wave of sanctions by the agency. More than half of about 400 private-equity firms that SEC staff have examined have charged unjustified fees and expenses without notifying investors…While some of the problems appear to have resulted from error, some may have been deliberate, the person said.. The private equity industry is nowhere near as concentrated as the banking industry, so the odds are high that this probe has uncovered abuses at some of the leading firms. Of course, this scrutiny into fees will also correctly embarrass the heretofore complacent limited partners, since some practices that people would consider from a commonsense standard to be abusive, like charging the use of private jets as a fund expense, would be considered kosher by the SEC if disclosed in the investment manager’s annual disclosure document, known as Form ADV. But how do you think it will play among retired cops, bus drivers, and teachers to learn their pension fund dollars are paying for private jet use by firms that are plenty rich enough to pay for that sort of thing on their own nickel?
Bank of America Must Refund $727M to Customers - Millions of credit card holders who bought add-on services from Bank of America may be in line for substantial payments from the company thanks to the Consumer Financial Protection Bureau. The CFPB determined that the bank used deceptive marketing tactics to sell services such as “credit protection deluxe” and then unfairly billed consumers for services they weren’t actually receiving. According to documents released by the CFPB on Wednesday, up to 2.9 million consumers will split some $727 million in refunds as a result of the consent order the bank negotiated with CFPB. “We have consistently warned companies about illegal practices related to credit card add-on products,” said CFPB Director Richard Cordray. “Bank of America both deceived consumers and unfairly billed consumers for services not performed. We will not tolerate such practices and will continue to be vigilant in our pursuit of companies who wrong consumers in this market.” The agency says the problems began with the telemarketers who were charged with selling the credit protection programs. Customers were told that if they purchased the product, Bank of America would cancel a portion of their debt in the event of certain adverse events, such as involuntary unemployment or disability.
Fed gives banks more time on Volcker rule detail (Reuters) - The U.S. Federal Reserve will give banks two more years to divest collateralized loan obligations (CLOs) that fall under the Volcker rule, a part of the Dodd-Frank financial law that bans banks from making a range of risky investments. The Fed said banks will now have until July 21, 2017 to shed these funds, which pool together risky loans. CLOs are a way for banks to remove loans from their balance sheets by selling the exposure to other investors, a form of securitization. Those investors can be other banks. But the Volcker rule, part of the 2010 Dodd-Frank financial reform law, caps banks' ability to invest in risky funds such as hedge funds and private equity funds to 3 percent, and some CLOs fall under this rule. The loans held in CLOs are high-yielding, and are generally used in leveraged buy-outs, to finance the acquisition of a company by a private equity firm. Issuers of CLOs had been holding back this year, with year-to-date new volume 40 percent lower than a year ago, because of the regulatory uncertainty. Even with the delay, the rule would lead to sharp losses for banks, the Loans Syndications and Trading Association said. "Considering the amount of CLO notes that would have to be sold ... investors should be able to demand a punitive price," it said in an emailed statement. "This would drive significant realized losses for the banks."
Banks Ordered to Add Capital to Limit Risks - Federal regulators on Tuesday approved a simple rule that could do more to rein in Wall Street than most other parts of a sweeping overhaul that has descended on the biggest banks since the financial crisis.The rule increases to 5 percent, from roughly 3 percent, a threshold called the leverage ratio, which measures the amount of capital that a bank holds against its assets. The requirement — more stringent than that for Wall Street’s rivals in Europe and Asia — could force the eight biggest banks in the United States to find as much as an additional $68 billion to put their operations on firmer financial footing, according to regulators’ estimates.Faced with that potentially onerous bill, Wall Street titans are expected to pare back some of their riskiest activities, including trading in credit-default swaps, the financial instruments that destabilized the system during the financial crisis.In that respect, some regulators and advocates for tougher financial regulation said, the new rule is a more straightforward tool that will be harder to evade and easier to enforce than many of the new regulations covering the sprawling, complex businesses of banking. Capital is important to banks because it acts as a buffer for potential losses that might otherwise sink an institution.
Fed's hard line on funding to bring more pain to Wall Street: The U.S. Federal Reserve's drive to wean Wall Street off risky funding sources is expected to bring more financial pain to the biggest U.S. banks in the coming months, analysts warned on Wednesday. They said bank regulators' release this week of tough new limits on debt funding is just a preview of other rules that may have even more bite. The eight largest U.S. banks must boost their capital levels by an estimated total of $68 billion to meet new limits on debt that regulators approved on Tuesday, a move designed to reduce banks' reliance on the type of risky financing that fueled the 2007-2009 financial crisis. Goldman Sachs and Morgan Stanley could be most affected since regulators proposed a framework that is tougher on businesses like the selling of credit derivatives to protect against corporate defaults, according to Steven Chubak, a banking analyst at Nomura Securities.Executives at some of the biggest Wall Street banks said in interviews that they began planning for the rules when they were proposed last year, and they expect to be in full compliance before the regulations take effect in 2018. But analysts paid special attention to comments from Federal Reserve Governor Daniel Tarullo, who said on Tuesday the tough rules should spur regulators to set more funding limits. Those proposed reforms include a surcharge for the biggest global banks and possibly additional capital rules for banks that rely on risky, short-term funding.
Heroes of Banking Reform -- Simon Johnson -- In the mid-2000s, Sheila Bair, then the chairwoman of the Federal Deposit Insurance Corporation, fought to retain a rule that would limit the amount of leverage, i.e., the amount that could be borrowed, particularly by the largest American financial companies. Among her most difficult opponents were key people at the Federal Reserve and most of the international community involved with bank regulation. (The details are in Chapter 3 of her book, “Bull by the Horns.”) The financial crisis made a big difference. Ms. Bair was proved right. Her critics in the United States and in Europe had insisted that a sophisticated “risk-weighted” approach to measuring the adequacy of bank equity capital would suffice. But the risk-weights used, by regulators and the industry, proved repeatedly wrong. Complex derivatives based on mortgage-backed securities and European sovereign debt were rated as AAA (the safest possible); both turned out instead to be highly risky and prone to fall rapidly in value. This week, Ms. Bair and the people who agree with her on the need to restrict leverage at our largest banks won a major victory. .The new rule is the “supplementary leverage ratio,” and it limits how much the largest banks can borrow relative to their overall assets. You need “more than $700 billion in consolidated total assets” or “more than $10 trillion in assets under custody” in order to be covered by this rule. (The link above is to the summary news release; the full rule is 54 pages long.) By 2018, the eight largest financial companies will need to fund their overall activities with at least 5 percent equity (so they can still have up to 95 percent debt, relative to their total balance sheet size). As the Fed puts it, in official-speak, “A perception persists in the markets that some companies remain ‘too big to fail,’ posing an ongoing threat to the financial system.”
Mirable Dictu! US Regulators Impose Tougher Rules on Bank Capital - Yves Smith - It’s easy to be cynical about the state of bank regulations, since the regulators themselves have for the most part been badly captured by the industry. So it’s important to give them credit when they take a meaningful step in the right direction. Remarkably, today the Fed, FDIC and Office of the Comptroller of the Currency announced that the US was implementing a 5% simple leverage ratio for big bank. From the OCC’s press release: The final rule applies to U.S. top-tier bank holding companies with more than $700 billion in consolidated total assets or more than $10 trillion in assets under custody (covered BHCs) and their insured depository institution (IDI) subsidiaries. Covered BHCs must maintain a leverage buffer greater than 2 percentage points above the minimum supplementary leverage ratio requirement of 3 percent, for a total of more than 5 percent, to avoid restrictions on capital distributions and discretionary bonus payments. IDI subsidiaries of covered BHCs must maintain at least a 6 percent supplementary leverage ratio to be considered “well capitalized” under the agencies’ prompt corrective action framework. The final rule, which has an effective date of January 1, 2018, currently applies to eight large U.S. banking organizations that meet the size thresholds and their IDI subsidiaries. The final rule is substantively the same as the rule proposed by the banking agencies in July 2013.
Unofficial Problem Bank list declines to 533 Institutions - This is an unofficial list of Problem Banks compiled only from public sources. Here is the unofficial problem bank list for April 4, 2014. Surprisingly there were a number of changes to the Unofficial Problem Bank List in between updates from the FDIC and OCC. In all, there were six removals and one addition that leave the list at 533 institutions with $171.9 billion in assets. A year ago, the list held 790 institutions with assets of $290.0 billion. The addition this week is International Bank of Chicago, Chicago, IL ($480 million).
Foreclosure activity at lowest level since 2Q 2007 --- There were 117,485 foreclosure filings in March 2014, which is up 4% from February but still down 23% compared to March 2013, according to RealtyTrac’s “U.S. Foreclosure Market Report.” RealtyTrac’s report on foreclosures — that includes default notices, scheduled auctions and bank repossessions — covers the month of March and the first quarter of 2014. March was the 42nd consecutive month where U.S. foreclosure activity decreased from a year ago, helping to drop first quarter foreclosure activity to the lowest level since the second quarter of 2007. “Now that the foreclosure deluge has dried up, banks are turning their attention back to properties that have been sitting in foreclosure limbo for some time,” said Daren Blomquist, vice president at RealtyTrac. “This is most evident in judicial foreclosure states that were more likely to have impediments in the foreclosure process, but there are also signs of this catch-up trend happening in some non-judicial states like California, where an increasing number of judicial foreclosure filings boosted foreclosure starts in the first quarter.” The monthly increase in foreclosure activity was driven by a 7% month-over-month increase in foreclosure starts — the initial public notice starting the foreclosure process — and a 6% monthly increase in scheduled foreclosure auctions.
Newly started foreclosures head higher in 19 states - While national trends for troubled properties are improving, there are 19 states where newly started foreclosures are heading higher, according to data released Thursday. In March, there were foreclosure filings on about 117,000 properties throughout the country, up 4% from February, but down 23% from a year earlier, online foreclosure marketplace RealtyTrac said. Such filings include default notices, scheduled auctions and bank repossessions. In addition, trends show national improvement: For the first quarter, there were about 342,000 properties with foreclosure filings, also down 23% from a year earlier. Looking nationally, the pipeline of foreclosures has narrowed since the housing bubble burst. The past year in particular has seen a rebound for the U.S. housing market, with rapidly rising prices enabling many troubled borrowers to gain equity. But at the state level, the foreclosure news is somewhat darker, with 19 states posting annual growth in foreclosure starts for the first quarter. A start is the first public notice of a foreclosure, such as notices for default or a trustee’s sale. Check to see whether your state is among the 19 where foreclosures are headed higher.
Fewer Foreclosures Could Mean Fewer Homes for Sale - Housing analyst Ivy Zelman cut her forecast for existing home sales this year but says she’s still bullish about the U.S. housing recovery. In a report Friday, her firm Zelman & Associates said it now expected a 5% drop in sales of previously owned homes for 2014 to a seasonally adjusted annual level of 4.8 million units. At the start of the year, the firm had forecast nearly a 6% gain from last year, to 5.4 million from last year’s 5.1 million units. The forecast calls for sales to increase modestly in 2015 and 2016, to 4.9 and 5 million units, respectively, down from earlier forecasts of 5.7 and 5.9 million units. Ms. Zelman isn’t changing her forecasts for new home sales, which are forecast to hit 505,000 units this year, up 17% from last year. Her estimates of new home construction were mostly unchanged. So why the cut to the existing home forecast? Part of it has to do with the hit from higher mortgage rates last summer, which combined with rising prices led to a slowdown in demand last fall that has carried over into the first quarter. Large declines in the supply of foreclosed and other distressed homes for sale mean that there’s less to buy, holding back re-sales. The housing rebound that took hold over the last two years came largely as bargain seekers — investors and traditional owners alike — took advantage of low prices on discounted homes. Now that the foreclosure floodwaters are receding, the potential for strong gains in existing home sales has ebbed, too. Ms. Zelman estimates that the supply of bank-owned homes and other distressed homes for sale is down by nearly 20% from a year earlier, which could cut around three to four percentage points from annual growth in existing home sales.
Mortgage Monitor: Delinquencies are below 6% for the first time since 2008, "Little Sign of Easing" in Credit Standards -- Black Knight Financial Services (BKFS, formerly the LPS Data & Analytics division) released their Mortgage Monitor report for February today. According to LPS, 5.97% of mortgages were delinquent in February, down from 6.27% in January. BKFS reports that 2.22% of mortgages were in the foreclosure process, down from 3.38% in February 2013. This gives a total of 8.17% delinquent or in foreclosure. It breaks down as:
• 1,749,000 properties that are 30 or more days, and less than 90 days past due, but not in foreclosure.
• 1,242,000 properties that are 90 or more days delinquent, but not in foreclosure.
• 1,115,000 loans in foreclosure process.
For a total of 4,106,000 loans delinquent or in foreclosure in February. This is down from 5,104,000 in February 2013.This graph from BKFS shows percent of loans delinquent and in the foreclosure process over time. Delinquencies and foreclosures are moving down - and might be back to normal levels in a couple of years. BKFS reports: "Delinquencies are below 6% for the first time since ‘08; foreclosures down 34% in the last year" The second graph from BKFS shows the credit score distribution for all mortgage originations. From Herb Blecher, senior vice president of Black Knight’s Data and Analytics division: “Credit standards have shown little sign of easing -- only about 30 percent of 2013 loans went to borrowers with credit scores below 720 -- which indicates that significant opportunity to expand mortgage origination activity is available, if risk appetites allow."
Homebuyer Traffic in March Was Down From Last Year -- What would you do if you went to a store and found bare shelves and high prices? If the answer is come back later, then you have a good idea of how home shoppers are feeling as real estate heads into the important spring selling season. In March, the traffic of potential homebuyers was down a little more than a third from March of last year, according to a monthly survey of real estate agents by Credit Suisse. The survey tracks 40 big U.S. home markets, and traffic was down in two thirds of those cities. That was well below what real-estate agents were hoping for and suggests there could be a dark cloud over real-estate sales in the coming months. Credit Suisse said comments from real-estate agents included that sellers were backing out of listings, buyers are frustrated by the lack of homes for sale, and that the strongest segment remains luxury new homes. Of course, some markets remain hot, such as most of Texas: Austin, Dallas, Houston and San Antonio had strong traffic and pricing. The buyer slowdown has been worst in markets that might be described as boomerang cities: Places like Phoenix, Las Vegas and Riverside, Calif., where home prices were crushed during the recession but have snapped back as much as 20% over the past year, according to CoreLogic.
US banks just had the worst quarter for mortgages in 14 years – Quartz: We already knew that US banks are facing a pretty rough first quarter, with a slowdown in fixed income currencies and commodities units–known as FICC. Trading FICC instruments, such as derivatives, bonds, and currencies, has historically been a big revenue-driver for banks, but trading volume in that area has significantly retreated in the face of new regulatory scrutiny.Now recent data from Inside Mortgage Finance, a trade publication, indicates that the home loan market has experienced its worst quarter in nearly a decade and a half. In the first three months of the year, mortgage origination amounted to $192 billion, according to Inside Mortgage Finance. That’s 26% down sequentially from the fourth quarter of 2013, and 60% down from the first quarter of 2013. The origination numbers were the weakest seen in the first three months of the year since 2000, when total home loan volume for the quarter was $122 billion. Lackluster mortgage production has implications for the big US banks, which feasted on a refinancing boom that helped fatten profits in the wake of the 2008 crisis. With interest rates hovering around historically low levels over the past several years, big banks have been making good money bundling these home loans and selling them to institutional and private investors. But mortgage rates have jumped sharply higher since last May, when the Federal Reserve first suggested it could gradually start to reduce its support for the US economy. That has translated into weaker mortgage volume. And for the banks, that means weaker fee revenue. It also puts a dent in bank trading activity, since mortgage bonds (or mortgage-backed securities, as they are known in financial circles) have represented a healthy chunk of typical banks’ overall trading activity.
Black Knight: Originations fall to lowest level in 14 years -- Black Knight Financial Services mortgage data for February data showed that monthly mortgage originations dropped to the lowest number in at least 14 years. Real estate sales, they found, have been mainly buoyed by cash investor transactions. “February’s data showed the continued trend of declining origination activity we’ve been observing since mid-2013, with monthly originations falling to their lowest recorded point since at least 2000,” said Herb Blecher, senior vice president of Black Knight’s Data and Analytics division. “In spite of this decline, residential real estate sales have remained strong due at least in part to investor activity and the fact that cash sales account for almost half of all transactions. In addition, while total transaction levels were flat on a year-over-year basis, traditional sales were up almost 15% from last year as the share of distressed transactions continues to decrease. Credit standards have shown little sign of easing -- only about 30% of 2013 loans went to borrowers with credit scores below 720 -- which indicates that significant opportunity to expand mortgage origination activity is available, if risk appetites allow. “As the inventory of distressed loans continued to resolve during 2013, loan modification activity also declined significantly, ending the year with near post-crisis lows,” Blecher said. “However, new changes to FHA’s Home Affordable Modification Program have increased such activity in the first months of this year. We continue to see that as industry modification efforts have matured, including offering more effective modification types (including HAMP’s interest rate reductions), far fewer borrowers are experiencing re-defaults than in the early years post-crisis.” More than 95% of the roughly 2.5 million interest rate reduction modifications still face rate resets, with many of these set to begin adjusting this fall.
Mortgage Originations Plunge To Lowest On Record - New mortgage originations fell over 23% month-over-month and a stunning 47% year-to-date according to Black Knight (formerly LPS). As they show in their detailed presentation, with a 65% year-over-year drop, new mortgage originations are at their lowest since their records began and what is perhaps more concerning is prepayment speeds signal further declines are ahead and the ratio of serious deterioration to foreclosure (along with huge numbers of loan mods due to reset) suggest the housing market is anything but recovering fundamentally with the average loan in foreclosure now 2.6 years past due.
Mortgage Loan Originations Lowest on Record - Black Knight's February Mortgage Data shows Monthly Loan Originations Lowest on Record. Key Points:
- Origination volume is the lowest on record with prepay speeds signaling more drops in refi originations
- Monthly sales were essentially flat year over year, but traditional sales were up almost 15%
- The government share of originations has decreased, led by a sharp drop in HARP originations
- Credit standards have shown few signs of loosening, with very little origination activity in the lowest credit score buckets
- Modification re-default rates for underwater borrowers about 30 percent higher than those with equity
New Mortgage Lending at 14-Year Low - Mortgage originations in February fell to their lowest level in at least 14 years due to the months-long plunge in refinancing activity and weak demand for loans to purchase new homes. The mortgage data, from a report released earlier this week by Black Knight Financial Services, gives some heft to bearish predictions of several industry executives who have said that the U.S. mortgage market faces its greatest shift in more than a decade after an era of falling interest rates that began in 2000 ended abruptly last year. The Mortgage Bankers Association, meanwhile, reported on Wednesday that the share of mortgage applications for refinances hit their lowest level since July 2009 last week. Refinances have been a major source of revenue for banks with every successive round of Federal Reserve stimulus over the past six years. A drop in refinancing isn’t a major threat to the housing market, and weak loan demand for home purchases hasn’t yet hurt the market because demand remains strong from investors paying cash. For lenders, the drop in refinancing could pose a major threat. While everyone knew the refi gravy train couldn’t last forever—at some point, loan officers will burn through the universe of borrowers who can be encouraged to reduce their rate by refinancing—the refinance boom of 2012 and 2013 ended more abruptly than many anticipated. Mortgage rates jumped last May as the Federal Reserve hinted at a possible slowdown in its bond-buying program. The average 30-year fixed-rate mortgage jumped from 3.6% in early May 2013 to 4.6% by late June. As the charts here indicate, refinancing is very sensitive to the direction of interest rates. Refinances rise when rates fall, and they fall when rates rise or stay flat. Mortgage rates have hovered around the 4.6% range since last summer.
MBA: Mortgage Purchase Applications Increase, Refinance Applications Decrease - From the MBA: Mortgage Purchase Applications Increase in Latest MBA Weekly Survey: Mortgage applications decreased 1.6 percent from one week earlier, according to data from the Mortgage Bankers Association’s (MBA) Weekly Mortgage Applications Survey for the week ending April 4, 2014. ... The Refinance Index decreased 5 percent from the previous week and is at its lowest level since the end of 2013. The seasonally adjusted Purchase Index increased 3 percent from one week earlier. ...The average contract interest rate for 30-year fixed-rate mortgages with conforming loan balances ($417,000 or less) remained constant at 4.56 percent, with points increasing to 0.33 from 0.31 (including the origination fee) for 80 percent loan-to-value ratio (LTV) loans.
Mortgage apps drop for 4th consecutive week - Mortgage applications dropped 1.6% from one week earlier, according to the Mortgage Bankers Association’s survey of mortgages for the week ending April 4, 2014. The MBA’s measure of mortgage loan application volume fell 1.6% on a seasonally adjusted basis from one week earlier, the fourth decline in four weeks after a spike of almost 10% at the start of March. The refinance index decreased 5% from the previous week and is at its lowest level since the end of 2013. The seasonally adjusted purchase index increased 3% from one week earlier.\ “Despite a drop in overall applications from the week before, purchase activity is still climbing as rates remain low and spring selling season is starting to ramp up. With home values back at healthy levels, look for inventory to increase in the coming weeks, which will continue to drive this trend of rising purchase activity,” said Quicken Loans vice president Bill Banfield.
Freddie Mac: "Fixed Mortgage Rates Tick Down" --- From Freddie Mac today: Fixed Mortgage Rates Tick Down Freddie Mac today released the results of its Primary Mortgage Market Survey® (PMMS®), showing average fixed mortgage rates moving down slightly as we head into the spring homebuying season. ...30-year fixed-rate mortgage (FRM) averaged 4.34 percent with an average 0.7 point for the week ending April 10, 2014, down from last week when it averaged 4.41 percent. A year ago at this time, the 30-year FRM averaged 3.43 percent. 15-year FRM this week averaged 3.38 percent with an average 0.6 point, down from last week when it averaged 3.47 percent. A year ago at this time, the 15-year FRM averaged 2.65 percent. This graph shows the 30 and 15 year fixed rate mortgage interest rate from the Freddie Mac Primary Mortgage Market Survey®. After increasing last June, mortgage rates have mostly moved sideways for the last 9 or 10 months.
Weekly Update: Housing Tracker Existing Home Inventory up 7.7% year-over-year on April 7th - Here is another weekly update on housing inventory ... There is a clear seasonal pattern for inventory, with the low point for inventory in late December or early January, and then usually peaking in mid-to-late summer. The Realtor (NAR) data is monthly and released with a lag (the most recent data was for February). However Ben at Housing Tracker (Department of Numbers) has provided me some weekly inventory data for the last several years.This graph shows the Housing Tracker reported weekly inventory for the 54 metro areas for 2010, 2011, 2012, 2013 and 2014. In 2011 and 2012, inventory only increased slightly early in the year and then declined significantly through the end of each year. In 2013 (Blue), inventory increased for most of the year before declining seasonally during the holidays. Inventory in 2013 finished up 2.7% YoY. Inventory in 2014 (Red) is now 7.7% above the same week in 2013. Inventory is still very low, but this increase in inventory should slow house price increases.
Only 17% of metros have recovered from the housing crash -- Only about 17% of the 350 metro markets in America have seen a return to or growth beyond their last normal levels of housing activity, according to the National Association of Home Builders/First American Leading Markets Index. Exactly 59 metros can be said to have fully recovered. This represents a net gain of 11 metros year over year. Notably, a large number of the most recovered metros are in and around renewed petroleum activity – places in West Texas and North Dakota. The index’s nationwide score ticked up to .88 from a March reading of .87. This means that based on current permit, price and employment data, the nationwide average is running at 88% of normal economic and housing activity. For single-family permits and home prices, 2000-2003 is used as the last normal period, and for employment, 2007 is the base comparison. A little more than a quarter of metros saw their score rise this month and 83% have shown an improvement over the past year, the report says.
Zillow Study Shows 1 In 3 Homes Are Unaffordable, But Vacation-Home Sales Are Soaring --In a further demonstration of the socially destructive and ever widening gap between the haves and have nots, we see that the affluent are buying second homes at an ever increasing clip (up 30% last year), while first home buyers recede into the abyss as private equity and Chinese buyers make purchasing a home unaffordable for the average American. Specifically, a recent study from Zillow showed that more than half the homes in seven major American cities are unaffordable based on historical standards. Specifically, a recent study from Zillow showed that more than half the homes in seven major American cities are unaffordable based on historical standards. Those cities are: Miami, Los Angeles, San Diego, San Francisco, Denver, San Jose and Portland, Ore. Nationwide, it found that 1 in 3 homes were unaffordable. The results seem to back up housing analyst Mark Hanson’s recent conclusion that despite low interest rates, housing is even less affordable than the most bubbly year ever, 2006. This also appears to be a primary reason behind Zillow now actively pitching its U.S. real estate listing to the Chinese, many of whom are corrupt and looking to launder ill gotten gains.
Trulia: Asking House Prices up 10.0% year-over-year in March - From Trulia chief economist Jed Kolko: Home Prices and Population Growth: Cities vs. Suburbs Despite declining investor purchases and more inventory coming onto the market, asking home prices continued to rise at the start of the spring housing season. Month-over-month, asking prices rose 1.2% nationally in March 2014, seasonally adjusted. Quarter-over-quarter, asking prices rose 2.9% in March 2014, seasonally adjusted, reflecting three straight months of solid month-over-month gains. Year-over-year, asking prices are up 10% nationally and up in 97 of the 100 largest metros. Albany, NY, Hartford, CT, and New Haven, CT, are the only three large metros where prices fell year-over-year, albeit slightly....In March, rents rose 3.9% year-over-year nationally. Rent increases were higher for apartments (4.4% year-over-year) than for single-family homes (1.9% year-over-year). In November 2013, year-over-year asking prices were up 12.2%. In December, the year-over-year increase in asking home prices slowed slightly to 11.9%. In January, the year-over-year increase was 11.4%, in February, the increase was 10.4% - and now the increase is 10.0%. This suggests prices are still increasing, but at a slightly slower pace.
FNC: Residential Property Values increased 9.0% year-over-year in February - FNC released their February index data today. FNC reported that their Residential Price Index™ (RPI) indicates that U.S. residential property values increased 0.5% from January to February (Composite 100 index, not seasonally adjusted). The other RPIs (10-MSA, 20-MSA, 30-MSA) increased between 0.7% and 0.8% in February. These indexes are not seasonally adjusted (NSA), and are for non-distressed home sales (excluding foreclosure auction sales, REO sales, and short sales). Since these indexes are NSA, this is a strong month-to-month increase. The year-over-year change continued to increase in February, with the 100-MSA composite up 9.0% compared to February 2013. In January, the year-over-year increase was 8.9%. The index is still down 22.8% from the peak in 2006.
Urban Real-Estate Prices Are Booming, but Most People Live in Suburbs - Urban real estate prices increased faster than suburban prices between March of this year and last, according to Trulia. But suburbs continue to outpace cities in population growth, and for good reason — there’s a lot more suburbs than cities, and since it’s easier to build in suburbs, the ‘burbs can add new homes more quickly, holding prices back. Nationally, urban home prices increased 9.8% over the past year. Suburban home prices grew 9.4%. The order is flipped for household growth, however: Suburban population increased by 1.1% and the urban population by 0.9%. Trulia defines urban and suburban differently than your typical demographer. Rather than focus on political boundaries — say, the City of San Francisco compared with smaller cities around it — they define urban and suburban by form. An urban neighborhood, by Trulia’s definition, is one where a majority of the housing is attached product like apartments and towering condos — the kind of place that “feels like a city.” Suburban neighborhoods are where there’s a majority of single-family homes. Some people will ask: What about all the cranes and high-rises you see in cities across the country? There are indeed a lot of cranes going up, and prices in the few ultra-dense downtown neighborhoods — high-rise neighborhoods, in Trulia’s parlance — rose 11.4%, outpacing other urban and suburban neighborhoods. But a lot of those cranes are building apartments after years of underbuilding during both the boom years and the recession. To some extent, cities are playing catch-up. City populations are also growing faster than they were during the boom years — just not as fast as other suburbs.
West Coast Condo Values Continue to Rise - Downtown condominium prices continue to skyrocket in West Coast cities, as the booming tech industry and interest from foreign buyers sends condo prices skyward and leaving little left to buy. Few markets are more frenzied than San Francisco, where new condominium prices are now over $1,000 per square foot, according to The Mark Co., a marketing and sales firm in San Francisco. San Francisco’s new downtown condo prices were up 13% in March from a year ago, to $1,030 per square foot. The inventory of new condos was down by roughly a third and is pretty much bare: In a press release, The Mark Co. noted that in 2007 there were about 3,000 new condo units for sales. In March there were 138. The Mark Co.’s new condo price index is based on the per-square-foot price of a 1,000 square foot condominium that sits on the 10th floor of a new building. Naturally, penthouses – defined as a 2,000 square-foot condo on the 30th floor – are much more. In San Francisco, new penthouses fetched $1,768 per square-foot, up 13% from a year ago. Prices are up in in other major West Coast cities as well. In Seattle, new condo prices were up 18% in March form a year ago, to $727 per square-foot. In downtown Los Angeles, new condo prices were up 8%, to $656/square foot.
Hot Air Hisses Out Of Housing Bubble 2.0: Even Two Middle-Class Incomes Aren’t Enough Anymore To Buy A Median Home - As home prices have soared in cities around the country, sales have cratered. The weather has been blamed, though the weather has been gorgeous in California where sales have crashed too, even in temporary boom town San Francisco. The “lack of inventory” and other excuses have been dragged out as well. In reality, homes have gotten too expensive.... Even for hedge funds, private equity funds, REITs, and other forms of Big Money with access to the Fed’s limitless free juice. They’d become powerful buyers over the last two years, gobbling up vacant homes sight-unseen by the thousands, in order to get them off the closely watched for-sale list and shuffle them over to the ignored for-rent list, where they might languish undisturbed. . But now their business model has collapsed. “Prices have gotten to the stage where we cannot buy a house, renovate it, rent it, and still make a reasonable return,” explained Peter Rose, a spokesman for Blackstone Group, “There was a moment in time where it made sense,” Rose said. Not anymore. Blackstone already cut its purchases in California by 90% last year. It wasn’t alone. Another mega-buyer with access to nearly free money, Colony Capital, is doing the same thing. Oaktree Capital is trying to dump its portfolio of 500 homes before prices head south. “Private capital made a lot of money early, and now they’re starting to pull back,” . “Home prices are up significantly, and houses are definitely less attractive.” With these mass-buyers out of the market, volumes have collapsed to a four-year low, according to Redfin, an electronic real-estate broker that covers 19 large metro areas around the country. Because, let’s face it, who can still afford to buy these homes?
American sanctions on Russia are causing Russian buyers to desert the U.S. real estate market -- Yahoo Finance’s The Daily Ticker produced a report today, April 7th, highlighting the fact that the high-end real estate market in several U.S. cities had been hurt by the ongoing Russia/Ukraine crisis and the sanctions that have been levied against wealthy Russians. Julie Satow, who wrote an article in The New York Times on the topic, was interviewed for the report. Satow mentioned that she had spoken to a Russian who said that many were “afraid to do business” in the U.S. right now because of the tense relationship between the two countires. She also mentioned speaking to a New York real estate agent with a client who was a member of Russia’s parliament and “was looking for a $25 million-$52 million purchase and he sent [his realtor] an email after the invasion saying ‘I’m sorry. I’m pulling out.’”
Lawler: Number of Home Owners Lower than 2006! - From housing economist Tom Lawler: Below are my “best guess” estimates of the number of US households – total and by tenure – from 2006 to 2013. The numbers for 2000 and 2010 are the “official” decennial Census numbers, while the numbers for other years from 2006 to 2012 are yearly averages derived from ACS data, adjusted (1) to reflect differences between ACS and decennial Census results; and (2) to reflect updated population estimates (total and by age group) for each year. Numbers for 2013 are “guesstimates” based on population estimates and headship/homeownership rates. Also shown are homeownership rates. These homeownership rates are lower than the ones shown in the more widely followed Housing Vacancy Survey, as the HVS homeownership rates, both total and by age group, were “way off” from Decennial Census results for 2010.
What the Jobs Report Means for Housing - Here’s the big question for the ongoing housing recovery: Can it kick things into second gear? Friday’s jobs report offered some encouraging signs. First, a little context. Two forces have driven the rebound in home prices that began more than two years ago: investors buying up bargain-priced homes — often foreclosures — and traditional owner-occupants taking advantage of ultralow mortgage rates after rates tumbled to record lows in 2012. There’s little doubt that the housing market has cooled over the past six months as homes have grown less affordable, due in part to higher interest rates and home prices. Investors have also pulled back as rising prices make deals on homes less compelling. So getting back to our initial question, the key factor in picking up still more speed will be whether the housing market can hand off the baton to more traditional demand drivers in 2014. Friday’s employment figures offer a few signs that things are moving in the right direction, though probably not as fast as anyone would like. The job recovery for young adults, as measured by the employment-to-population ratio for 25-to-34 year olds, is holding up, notes Jed Kolko, chief economist at Trulia. Still, Mr. Kolko notes that young-adult employment — at around 76% in March from a low of less than 74% in 2011 — is still less than halfway back to its pr-crisis level of 78% to 80%. “Having a job matters for housing,” he said. Around one in eight employed young adults lives with their parents, compared to one in five who are unemployed. The report also showed that hourly earnings were unchanged in March, and earnings growth slowed from 2.2% to 2.1% on a year-over-year basis. Home prices can’t keep posting double-digit gains if wages don’t rise and if interest rates don’t fall, or they’ll eventually be out-of-whack (again) relative to incomes.
Consumer credit rose $16.49 billion in February, beating estimates of a $14.09 billion increase: U.S. consumer credit rose more than expected in February, likely reflecting a surge in demand for student and automobile loans. Total consumer credit increased by $16.49 billion to $3.13 trillion, the Federal Reserve said on Monday. January's consumer credit figure was revised to show a $13.80 billion increase instead of the previously reported $13.70 billion gain. Economists polled by Reuters had expected consumer credit to rise by $14.09 billion in February. Revolving credit, which mostly measures credit-card use, tumbled by $2.42 billion after January's $241-million drop. It was the second straight month of declines. Nonrevolving credit, which includes auto loans as well as student loans made by the government, surged $18.91 billion in February. That was the biggest gain in a year and followed a $14.04 billion increase in January.
Non-student-loan consumer credit growth leveling off - Consumer credit growth for February came in considerably better than expected in spite of the economic soft patch this winter. BW: - The $16.5 billion advance in credit exceeded all estimates in a Bloomberg survey of economists and followed a revised $13.8 billion gain in the previous month, Federal Reserve figures showed today in Washington. The median forecast in the Bloomberg survey called for a $14 billion increase. It is important to point out however that in order to track the actual private sector consumer credit measures, one must remove the government-sponsored student loans that have been distorting growth indicators. The non-student-loan consumer credit growth has leveled off recently, rising at around 2.5% per year (as opposed to over 5.5% when student loans are included).For the month of March we will probably see an improvement in this rate, especially as auto loan demand picks up. However with wage growth remaining subdued at just above 2% per year (see chart below), it should not be a surprise that consumer credit growth has leveled off. Consumers still remain cautious on leverage. The non-student-loan consumer credit was growing at a rate in the neighborhood of 6% in the years preceding the financial crisis. With wage growth constrained for now, there is little chance we are returning there in the near future.
98% Of All Consumer Credit In Past Year Was Student And Car Loans - Same shit, different month. If last month total consumer credit increased by $13.8 billion, of which $14.0 billion went into student and car loans meaning consumers continued deleveraging on their credit card statements (some expectation for a recovery there), then February was even worse. The headline number was great: $16.5 billion, well above the $14.0 billion expected. The problem is that of this number well more than 100%, or $18.9 billion was once again slated for car purchases and paying down "student bills" (not really - as has been reported numerous times before Americans increasingly use student loans as a means to pay for everything else but tuition). In other words, anyone suggesting that the "surge" in household lending is in any way remotely indicative of consumer hope in a recovery is i) an idiot or ii) clueless and won't even be bothered to read the fine print which once again suggests that the only credit Americans will take on is whatever comes implicitly free, and is certainly not meant to be repaid, courtesy of Uncle Sam. Unlike credit cards.
Americans Owed Less on Their Credit Cards in February - Americans shed more credit-card debt in February, the latest sign of consumer caution about borrowing and spending since the recession. Agence France-Presse/Getty ImagesTotal outstanding consumer credit across the economy rose at a seasonally adjusted annual rate of 6.4% in February to more than $3.129 trillion, the Federal Reserve said Monday. But outstanding revolving credit, which includes credit-card debt, fell $2.42 billion from January, representing an annualized decline of 3.4% in February. Revolving credit also fell in January. Winter weather, postholiday shopping fatigue and the arrival of tax-refund checks all have contributed to lower debt levels in recent months. But borrowers also have become more diligent about paying off their balances, he said. “They are more considerate of the debt that they are putting on,” “They’re managing their budgets a little more rigorously.” Credit-card borrowing surged in the prerecession years before declining sharply during the downturn. After the economy bottomed out, consumers began to borrow again, albeit more cautiously. Outstanding revolving credit has increased 0.5% over the last year. But it has been an uneven climb, with seasonally adjusted revolving credit rising just six of the last 12 months. It fell three of the last four months. Total outstanding consumer credit, including student and car loans but excluding real-estate loans like mortgages, has increased 5.6% from a year ago. The volume of outstanding federal student loans has been climbing steadily, hitting an unadjusted $764 billion in February.
Preliminary April Consumer Sentiment increases to 82.6 - Click on graph for larger image. The preliminary Reuters / University of Michigan consumer sentiment index for April was at 82.6, up from 80.0 in March.This was above the consensus forecast of 81.0. Sentiment has generally been improving following the recession - with plenty of ups and downs - and a big spike down when Congress threatened to "not pay the bills" in 2011, and another smaller spike down last October and November due to the government shutdown. I expect to see sentiment at post-recession highs very soon
Michigan Consumer Sentiment: April Preliminary of 82.6 Beats Expectations - The University of Michigan Consumer Sentiment preliminary number for April came in at 82.6, a jump from the 80.0 March final. This is the highest reading since the 85.1 interim high set in July of last year. Both Investing.com and Briefing.com had forecast of 81.0. See the chart below for a long-term perspective on this widely watched indicator. I've highlighted recessions and included real GDP to help evaluate the correlation between the Michigan Consumer Sentiment Index and the broader economy. To put today's report into the larger historical context since its beginning in 1978, consumer sentiment is now 3 percent below the average reading (arithmetic mean) and 2 percent below the geometric mean. The current index level is at the 40th percentile of the 436 monthly data points in this series.The Michigan average since its inception is 85.1. During non-recessionary years the average is 87.4. The average during the five recessions is 69.3. So the latest sentiment number puts us 13.3 points above the average recession mindset and 4.8 points below the non-recession average. It's important to understand that this indicator is somewhat volatile with a 3.1 point absolute average monthly change. For a visual sense of the volatility here is a chart with the monthly data and a three-month moving average.
Consumer Spending "Recovery" Stalls As Pent-Up Demand Fails To Appear - For the first time since the 'recovery' began, Gallup reports that consumer's average daily spending flatlined year-over-year. As Gallup concludes, at a daily rate of $87, Americans' average daily spending in March looks positive by comparison to spending over the past five years. But the stall in spending, both month-over-month and compared with a year ago, most likely signals a continuation of the lackluster retail sales seen so far in 2014. While government data suggested that retail sales rebounded in February (though still the weakest YoY since Nov 2009), the Gallup data appears to confirm the post-weather pent-up-demand has failed to arrive.
Survey: Nearly 40 Percent Of Americans Can’t Come Up With $2,000 For Emergency -- A survey has found that roughly 40 percent of Americans can’t come up with $2,000 if an emergency arises. In the 2012 National Financial Capability Study by FINRA, 25,000 individuals were asked a series of questions about their finances and the amounts of debt they had.Nearly 40 percent of survey participants answered that they weren’t “confident” about coming up with $2,000 if an unexpected need arose within the next month.The survey also found that almost 60 percent of individuals in the country did not have three months of emergency funds that they could access to cover an emergency.Only 20 percent of individuals surveyed reported that they strongly agreed to having too much debt when they answered a question about how much debt they have. The survey was put into the field roughly three years after the Great Recession, House of Debt noted.
The Financial Vulnerability of Americans - Excessive household debt was crucial in explaining the severity of the Great Recession. So where are we now? Have households strengthened their financial position since 2009? Are household balance sheets strong enough to prevent another massive pull back in spending if there are significant job losses? To answer to these questions, we look at evidence from the 2012 National Financial Capability Study by FINRA. (We are grateful to Annamaria Lusardi, an expert on financial literacy, for pointing us to the data used in this post.) This survey is a representative sample of 25,000 individuals who were asked mostly qualitative questions about their finances. The survey was put into the field three years after the worst of the Great Recession.The survey responses are shocking, and should put fear into all of us about the financial vulnerability of U.S. households. The survey asks the following question: “How confident are you that you could come up with $2000 if an unexpected need arose within the next month?” Here are the answers: Almost 40% of individuals in the United States either could not or probably could not come up with even $2000 if an unexpected need arose.
Biggest Credit Bubble in History Flashes Warning – ‘Seek Cover’ - Yves Smith - Gillian Tett of the Financial Times has also been taking up the credit mania theme of late. For instance, from today’s newspaper:A few short years ago, “subprime” was almost an expletive..But the financial world has a short memory…In recent months subprime lending has quietly staged a surprisingly powerful return, not in relation to real estate, but another American passion – cars…The historical echoes are uncanny. During most of the past decade the amount of car-related debt grew only modestly. Yet outstanding car loans, which totalled $700bn in 2010, have jumped by a quarter in the past three years… Even more notable is that this has occurred amid a sharp deterioration in loan quality. Five years ago, subprime loans represented barely a 10th of the total; today they account for a third. A particularly high proportion of GM cars sales are financed by subprime loans. Meanwhile, a 10th of new loans are now going to so-called “deep subprime”, or consumers who would previously have had little chance of getting funding – particularly given that incomes for poorer households have stayed flat or declined, even as car prices jumped. The problem is that the authorities’ solution to the credit bubble that led to the crisis was to reinflate it rather than restructure the debt (although they got more liquidations via foreclosures than they probably wanted as a result of the failure to rein in bank servicers). Unfortunately, it appears that they’ve succeeded all too well in this strategy.
Auto Sales: Example of How U.S. Growth Is a Mirage -- Growth in the U.S. economy, as it stands, can be explained with one word. That word is "mirage." The Merriam-Webster dictionary explains the word mirage as "something that is seen and appears to be real but that is not actually there." (Source: Merriam-Webster online, last accessed April 3, 2014.) It's a story that is getting old. On the surface, economic data looks rosy, but when you look closer, you find a picture that is completely distorted. In fact, the fundamentals suggest the U.S. economy is deteriorating. Take auto sales in the U.S. economy as one example. In the month of March, auto sales reached an annual level of 16.4 million units, up from 15.24 million units in January. On the surface, the increase in auto sales looks good for the U.S. economy. Automaker stocks are going up. And the politicians can say, "Look, Americans are spending money once again!" But when we look closer, we discover auto sales in the U.S. economy have reached a new six-year high—with the help of subprime lending. Cars are being sold to those with poor credit ratings. You remember subprime lending? It was a big thing in 2004–2006, when consumers with very bad credit were getting loans to buy houses in the U.S. economy that they really couldn't afford to buy. The same thing is happening in the auto market today. And the bubble in auto subprime lending is getting close to bursting. In the first nine months of 2013, the 31+ day delinquency rate was up 23% from the same period in 2013. On average, 7.59% of all subprime loans at the subprime finance companies were 31 or more days delinquent through to September of 2013. In the S&P's own words, "In our opinion, we're at a turning point with respect to subprime auto loan performance… The increased competition has led to lengthening loan terms and rising loan-to-value ratios, both of which generally result in higher losses."
Weekly Gasoline Update: Ninth Week of Price Increases - It’s time again for my weekly gasoline update based on data from the Energy Information Administration (EIA). Rounded to the penny, Regular and Premium are both up two cents, the ninth week of increases. According to GasBuddy.com, California has jointed Hawaii in having regular above $4.00 per gallon, with Hawaii now at $4.26 and California at 4.04. The next highest state average is Illinois at $3.85. Montana has the cheapest regular at $3.25, up a penny from last week.
Producer Price Index: Final Demand Hotter than Forecast - Today's release of the March Producer Price Index (PPI) for Final Demand rose 0.5% month-over-month seasonally adjusted for Headline inflation. Today's data point was higher than the 0.1% Investing.com forecast. Core Final Demand rose 0.6% from last month, topping the Investing.com forecast of 0.2%. Year-over-year both Headline and Core are up 1.4%. Here is the essence of the news release on Finished Goods:The Producer Price Index for final demand advanced 0.5 percent in March, seasonally adjusted, the U.S. Bureau of Labor Statistics reported today. This increase followed a decline of 0.1 percent in February and a rise of 0.2 percent in January. On an unadjusted basis, the index for final demand moved up 1.4 percent for the 12 months ended in March, the largest 12-month advance since a 1.7-percent increase in August 2013. (See table A.) In March, the 0.5-percent increase in final demand prices can be traced to the index for final demand services, which rose 0.7 percent. Prices for final demand goods were unchanged. More... The BLS shifted its focus to its new "Final Demand" series earlier this year. I fully endorse this shift. However, the data for these series are only constructed back to November 2009 for Headline and April 2010 for Core. Since my focus is on longer term trends, I continue to track the legacy Producer Price Index for Finished Goods, which the BLS also includes in their monthly updates. The March Headline Finished Goods was down 0.1% MoM but up 1.73% YoY. Core Finished Goods rose 0.1% MoM and is up 1.68% YoY. Now let's visualize the numbers with an overlay of the Headline and Core (ex food and energy) PPI for finished goods since 2000, seasonally adjusted. As we can see, the YoY trend in Core PPI (the blue line) declined significantly during 2009 and stabilized in 2010, increased in 2011 and then eased during 2012 and most of 2013. This small rise in recent months still has this indicator below the common 2% benchmark.
US Inflation Jumps To Highest In 7 Months - Producer Price Inflation data soared higher than expectations across the board this morning with Final Demand up 1.4% YoY (against 1.1% expectation) to its highest since Aug 2013. The main driver was food and apparel prices (rather unexpectedly) but we also note that ex-Food-and-Energy was a 0.6% rise (vs 0.2% exp.) which is the biggest month over month jump since March 2011. Final demand services: The index for final demand services rose 0.7 percent in March, the largest advance since a 0.8-percent jump in January 2010. In March, over 60 percent of the broad-based increase can be traced to margins for final demand trade services, which climbed 1.4 percent. (Trade indexes measure changes in margins received by wholesalers and retailers.) Prices for final demand services less trade, transportation, and warehousing increased 0.4 percent, and the index for final demand transportation and warehousing services rose 0.5 percent. In March, MoM Ex Food and Energy surged (well above expectations) thanks to a 3.3-percent increase in margins for apparel, jewelry, footwear, and accessories retailing led the advance in prices for final demand services.
No Baloney: Sausage, Deli Meat Prices Surge - It’s a bad time to pig out on a capicola sub or sausage pizza. The prices businesses receive for sausage, deli meat and boxed meats rose a seasonally adjusted 4.9% in March, the fastest pace in nearly 34 years, the Labor Department said Friday. The jump reflects surging prices for a key ingredient: pork. The producer price index for pork is up 16.5% from a year ago. A category that includes beef and veal is 9.3% higher. (The overall price index rose 1.4% in March from a year earlier, the largest annual increase since last August.) Bloomberg NewsA. Litteri, an Italian grocery and deli in Washington, just last week raised the price of its Italian sausage — all made in-house — by a dollar to $4.99 a pound, said owner Michael DeFrancisci. That was the first price increase in roughly a decade. The price of Boston butt, which the store uses to make its hot and mild sausages, has climbed about a dollar a pound in the last three weeks, Mr. DeFrancisci said.According to the U.S. Department of Agriculture, which uses different metrics, hog prices surged in the second half of February and landed about 13% higher than a year earlier. USDA analysts say prices are rising in anticipation of shortages. The porcine epidemic diarrhea virus was first confirmed in the U.S. last May at an Iowa farm. The disease has since spread to 28 states and killed millions of young pigs, rapidly increasing costs for major hog-farm operators and threatening to curb U.S. pork supplies.
Wholesale Inventory Build Slows As Sales Miss 3rd Month In A Row - Wholesale inventory growth slowed to 0.5% (for Feb) from a revised 0.8% pick up in January but met expectations as it seems the much-hoped for weather recovery remains missing in action. This is the 2nd slowest rate of inventory increase in 7 months. Wholesale Sales did bounce back from the utter collapse last month but not as much as expected - rising 0.7% vs 1.0% expectations - missing for the 3rd month in a row. The combination leaves inventory/sales overall at its highest in 16 months.
Vital Signs: Wholesalers Are Keeping an Eye on Inventories - The bump-up in the inventory-sales ratio among wholesalers so far this year would look worrisome, until you take a longer-run perspective. In February, wholesalers had enough goods on hand to cover 1.19 months of sales. That was the same inventory-sales ratio as in January but up from a 1.16 average in the second half of 2013. A combination of rising inventories and volatile sales pushed up the most recent numbers. Looking longer term, though, the ratio is not too high. After all, the ratio has been bouncing between 1.16 and 1.2 for most of this recovery, and that’s the same range that prevailed in the years before the last recession caused distributors to be stuck with a massive overhang of inventory. As with so many other economic data, weather may have played a role in the increase in the January and February ratios. Sales of lumber and construction products dropped sharply in each month as inventories rose, pushing that sector’s ratio to its highest reading in three years. Snowed-in contractors probably held back in buying materials, waiting for the ground to thaw.
Is Short-Term Unemployment a Better Predictor of Inflation? - Alan B. Krueger, Judd Cramer, and David Cho of Princeton recently released a Brookings paper on the state of the labor market titled "Are the Long-Term Unemployed on the Margins of the Labor Market?" Their big headline result is that the long-term unemployed are going to have trouble finding steady work, both as a historical matter and from what we've seen in the Great Recession. It's fascinating work we'll revisit here. But what does that mean for the job market right now, with its mix of short-term and long-term unemployed? The second takeaway is that if we only look at short-term unemployment, the economy makes more sense than if we look at total unemployment. As Tim Hartford wrote, this research shows that if "we replotted the Phillips curve['s mix of inflation and unemployment]... using statistics on short-term unemployment... it turns out that the old statistical relationships would work just fine." Some are arguing that we should just focus on short-term unemployment for the moment as an indicator of how the economy is doing. Is that the case? Not really. We should be careful with this argument now, because this is really a matter of 2009-2012. Back then, the question was why inflation was as steady as it was given very high unemployment. In 2014 the question is very different: why is inflation so low given high unemployment and the relationship of the past several years? We need to explain a different problem. Let's look at a key chart from the Krueger paper (green boxes my addition):
Corporate Profits Grow and Wages Slide - CORPORATE profits are at their highest level in at least 85 years. Employee compensation is at the lowest level in 65 years. The Commerce Department last week estimated that corporations earned $2.1 trillion during 2013, and paid $419 billion in corporate taxes. The after-tax profit of $1.7 trillion amounted to 10 percent of gross domestic product during the year, the first full year it has been that high. In 2012, it was 9.7 percent, itself a record. Until 2010, the highest level of after-tax profits ever recorded was 9.1 percent, in 1929, the first year that the government began calculating the number. Before taxes, corporate profits accounted for 12.5 percent of the total economy, tying the previous record that was set in 1942, when World War II pushed up profits for many companies. But in 1942, most of those profits were taxed away. The effective corporate tax rate was nearly 55 percent, in sharp contrast to last year’s figure of under 20 percent. The statutory top corporate tax rate in the United States is 35 percent, and corporations have been vigorously lobbying to reduce that, saying it puts them at a competitive disadvantage against companies based in other countries, where rates are lower. But there are myriad tax credits, deductions and preferences available, particularly to multinational companies, and the result is that effective tax rates have fallen for many companies. The Commerce Department also said total wages and salaries last year amounted to $7.1 trillion, or 42.5 percent of the entire economy. That was down from 42.6 percent in 2012 and was lower than in any year previously measured.
Why Surging Profits Aren't Leading To CapEx And Jobs - Employment is a function of demand by customers on businesses. As opposed to many economists and politicians, businesses do not hire employees to be "good samaritans." While such a utopian concept is fine in theory, the reality is that businesses operate from a "profit motive." The problem is quite clear. With the consumer heavily leveraged, the inability to "spend and borrow" is reducing aggregate demand. As stated, the current level of aggregate demand simply isn't strong enough to offset the rising costs of taxes, benefits and healthcare (a significant consideration due to the onset of the Affordable Care Act) associated with hiring full-time employees. Therefore, businesses initially opt for cost efficient productivity increases, and only hire as necessary to meet marginal increases in customer demand which has come from population growth.
NFIB: Small Business Optimism Index increases in March - From the National Federation of Independent Business (NFIB): Small Business Rollercoaster Continues The latest Small Business Optimism Index rose 2 points to 93.4, mostly reversing the February decline ... NFIB owners increased employment by an average of 0.18 workers per firm in March (seasonally adjusted), an improvement over February’s 0.11 reading and the sixth positive month in a row. This graph shows the small business optimism index since 1986. The index increased to 93.4 in March from 91.4 in February.
Small Business Sentiment Improved in March - The latest issue of the NFIB Small Business Economic Trends is out today. The April update for March came in at 93.4, up 2 points from the previous month's 91.4. Today's headline number is at the 19.7 percentile in this series. Since its initial recovery following its Great Recession trough, this index has been stuck in an extremely volatile range for the past three years. Since January of 2011, it has repeatedly bumped a ceiling around the 94.5 level and then retreated.The Investing.com forecast was for 92.3.Here is the opening summary of the news release."Overall, the March gain more or less reversed the February decline. While the Index still can't seem to get above 95, we can be encouraged that the economy is at least crawling forward and not heading in reverse," said NFIB chief economist Bill Dunkelberg. The outlook for real sales gains accounted for about half of the improvement with inventory satisfaction and inventory investment plans accounting for most of the rest. However, throughout this recovery we've seen these types of increases only to have them go nowhere. As long as Washington continues to ignore policies that could restore the middle class, job creation will continue to be sub-par." (Link to news release). The first chart below highlights the 1986 baseline level of 100 and includes some labels to help us visualize that dramatic change in small-business sentiment that accompanied the Great Financial Crisis. Compare, for example the relative resilience of the index during the 2000-2003 collapse of the Tech Bubble with the far weaker readings of the past four years. The NBER declared June 2009 as the official end of the last recession.
Small Business Hiring Plans Plunge To 11-Month Lows - Having hit their most hopeful levels in seven years in January, small business hiring plans have collapsed at the fastest rate since Lehman in the ensuring 2 months. Despite the headlines proclaiming the modest rise and beat in the headline NFIB data, capex spending plans dropped and hiring expectations dropped to lows seen 11 months ago. We can only assume the small businesses are expecting more winter storms through the spring...Charts: Bloomberg
4 key reasons for CAPEX accelerating - - We've received a number of e-mails regarding the recent post on the possibility that rising CAPEX spending in the US is driving corporations to tap their credit facilities, thus increasing loan growth (see post). Most were highly critical of this line of thinking in their comments, using words such as "bogus", "propaganda", "head fake", "delusional", etc. Thanks for all the feedback. The argument that "things are different this time" understandably meets a great deal of skepticism, especially after a number of false starts and years of uncertainty. But evidence for a significant rise in corporate CAPEX spending continues to build. One could write a dissertation on this topic, but let's just look at 4 key data points:
1. Diminishing uncertainty. As discussed earlier (see post) federal government policy uncertainty (fiscal and monetary) that has been hounding corporate CEOs and investors for years has finally subsided, at least in the nearterm. Even the politically charged uncertainty around the implementation of Obamacare has been receding (more on this later). We can debate about the merits of the various policies but it is often the uncertainty more than the policy itself that spooks corporate decision makers.
2. Corporate infrastructure is aging. From software to planes to telecommunications equipment, companies have severely underinvested in recent years, and it's time to start upgrading. Consider the fact that the average age of fixed assets such as factories, storage facilities, etc. is at levels not seen in nearly 50 years.
3. CEO confidence. Based on the analysis done by Charles Schwab, CEO confidence tends to lead key CAPEX expenditures. And CEO confidence has risen sharply in recent months.
4. Investors. Shareholders are demanding that companies begin using more of their massive cash balances toward CAPEX. The chart below from Merrill Lynch is quite compelling.
Unbelievable Jobs Trend, Depression, and Bernanke's Legacy -- A couple of things struck me about today’s jobs report. One was the regularity of the straight line trend in non farm payrolls. I mean, even casual observers know that markets and the economy move in trends, (which are your friends) but come on! This steady state 1.6% annual gain for the past 4 years is a bit ridiculous, even for a normally credulous guy like me who is willing to believe almost any statistic the government publishes. But now… NOW… they have just gone too far. The Straight Line Trend In Nonfarm Payrolls is getting to be a bit much- The headline, seasonally adjusted payrolls number was reported higher by 192,000 which was a little less than conomists’ consensus guess of 195,000. That’s a fake number, a smoothed and stylized attempt to represent the trend. It will get a big revision next month, the month after, and then when the data is benchmarked to the tax data once a year. Whether the data represents reality is certainly arguable. For example, take the birth/death adjustment. Please. I track the real time Federal withholding tax data, and based on tremendous strength in that data in March, I have no quarrel with this jobs data as reported. It might even be too low, to be revised upward next month. But even if so, it won’t be enough. Which brings me to the other thing I noticed in the data, which is that in spite of the steady trend of improvement for the past 4 years, in terms of a truer measure of employment, the US is still in a Depression. That’s right, not a recession, a Depression.There has been virtually no recovery in the percentage of Americans with full time jobs since the pits of the crash in 2008. Bernanke’s policy of financial repression was designed to prop up the very bankers and speculators who, along with the Fed, caused the housing/credit bubble and ensuing crash. In that regard, the policy has succeeded. But Bernanke continues to protest that his real purpose was to save jobs. Either he’s an idiot who believes that ZIRP and money printing will accomplish that, or he’s a criminal liar, simply lining up for his ultimate payoff.
After the Jobs Report, a Look at Three Critical Labor Market Trends - In the aftermath of last week’s jobs report, there are three critical labor market trends that need to be examined more closely.Reversing the Shrinking Labor Force. To my mind, the most important labor market question is how much can stronger growth repair the damage to the labor force participation rate.Today’s EconomistPerspectives from expert contributors.There are two reasons that I give this question such primacy. The first one is micro: most people depend on their paycheck, not their portfolio, so absent a job or enough hours of work, their living standards will take a hit.The second is macro. Overall economic growth is the sum of productivity growth and labor force growth. Less of the latter makes it harder to grow faster, creating a vicious cycle of weak GDP growth, weak job growth, and low labor force participation.Some of the decline in the labor force, maybe a third to as much as half — is driven by older workers dropping out, but even that is not as benign as it sounds. As some people are healthier for longer, they’ve been extending their work force tenure in recent decades and thus it’s a mistake to assume that every older labor force dropout is happy to leave (though many surely are — let’s not fetishize work!).Here, however, is an interesting and favorable trend. It’s from the labor force flows data, which tracks people’s monthly movements in and out of employment, unemployment, and not in-the-labor-force (or NILF; remember, if you’re looking for work, you’re unemployed; if you give up the search, you’re NILF). This line shows the share of the population moving from unemployment to NILF, and is thus a driver of the decline in the labor force.
Beveridge Curve Starting to Look a Little More Normal - For much of the past five years, economists have debated whether the unemployment facing the economy was cyclical — the result of an economy weakened by a particularly vicious business cycle — or structural — the result of rapid shifts in the structure of the economy that make workers no longer suited for the needs of employers. The debate was especially important for Federal Reserve policy makers, who have greater ability to fix cyclical unemployment, than structural. A key piece of evidence has been the so-called Beveridge Curve, named after the economist William Henry Beveridge, that tracks the relationship between the job openings rate and the unemployment rate. Before the Great Recession that began in December 2007, the relationship between job openings and unemployment held steady. If job openings climbed, the unemployment rate tended to fall, as one would expect (the blue line in the accompanying chart). During the recession, the unemployment rate soared toward 10 percent, and the availability of job openings plummeted (the red line). Then, in the recovery, something strange happened. The openings rate began to climb, yet unemployment remained stubbornly high. The new job listings were not being filled by the vast number of unemployed workers (the green line). The curve isn’t yet back to normal, but it’s getting closer. And every inch closer implies the structural damage to the economy was less than many had feared, and the problem was a vicious business cycle all along.
BLS: Jobs Openings increase to 4.2 million in February - From the BLS: Job Openings and Labor Turnover Summary There were 4.2 million job openings on the last business day of February, up from January, the U.S. Bureau of Labor Statistics reported today. ...Quits are generally voluntary separations initiated by the employee. Therefore, the quits rate can serve as a measure of workers’ willingness or ability to leave jobs. ... The number of quits (not seasonally adjusted) was little changed over the 12 months ending in February for total nonfarm, total private, and government. The following graph shows job openings (yellow line), hires (dark blue), Layoff, Discharges and other (red column), and Quits (light blue column) from the JOLTS. The difference between JOLTS hires and separations is similar to the CES (payroll survey) net jobs headline numbers. This report is for February, the most recent employment report was for March. Note that hires (dark blue) and total separations (red and light blue columns stacked) are pretty close each month. This is a measure of labor market turnover. When the blue line is above the two stacked columns, the economy is adding net jobs - when it is below the columns, the economy is losing jobs. Jobs openings increased in February to 4.173 million from 3.874 million in January. The number of job openings (yellow) is up 4% year-over-year compared to February 2013. Quits increased in February and are up about 5% year-over-year. These are voluntary separations. (see light blue columns at bottom of graph for trend for "quits"). Not much changes month-to-month in this report - and the data is noisy month-to-month, but the general trend suggests a gradually improving labor market.
Job Openings in U.S. Climbed in February to a Six-Year High - Job openings in the U.S. rose more than forecast in February to a six-year high as employers moved to boost hiring in response to rising consumer demand. The number of positions waiting to be filled in the U.S. climbed by 299,000 to 4.17 million in February, the most since January 2008, from a revised 3.87 million the month before, the Labor Department reported today in Washington. The rate of hiring and the number of Americans quitting their jobs were little changed. The figures, which are among nine labor-market barometers closely watched by Federal Reserve Chair Janet Yellen, reinforce other data showing steady improvement. Accelerated hiring would help provide bigger wage gains needed to boost consumer spending, which accounts for almost 70 percent of the economy. “Everything is pointing to an improving labor market, which the Fed obviously wants to see,” said Jennifer Lee, a senior economist at BMO Capital Markets in Toronto. “But they want to see much more improvement in the labor markets before they consider the economy is healthy again.”
More People Are Quitting Their Jobs, but Not Enough - Americans are slowly regaining the confidence to quit their jobs and move to new ones — but not enough to signal a healthy jobs market. Economists and policymakers, including Janet Yellen, the new Federal Reserve Chairwoman, are looking carefully at how willing U.S. workers are to change their jobs to gauge the health of the labor market. When workers are confident, they’re more likely to change jobs, or quit one to find another. When they’re not moving out of jobs, it’s often because they’re nervous about their job security. That insecurity, across the whole economy, means fewer job opportunities for other people, from fresh college graduates to the long-term unemployed. The latest data on the nation’s “quits rate,” out Tuesday from the Labor Department, are a bit of a downer: While they show how much the job market has improved, they don’t really signal any substantial pickup. The share of U.S. workers who voluntarily resigned from their jobs stayed at 1.7% in February, the same rate as in January, and down from the post-recession high of 1.8% in December, the Labor Department said. February’s level is far above the historical low of 1.3% in 2009 — a good sign — but it’s also well below its long-term average, which is roughly 2.1%. (The Bureau of Labor Statistics started tracking this data in late 2000.) The figures support Ms. Yellen’s latest read of the labor market’s health — that it’s continually improving, but too slowly.
Vital Signs: 2.5 Unemployed People for Each Job Opening -- The number of job openings in the U.S. jumped to 4.2 million in February, putting the number of unemployed per open position at 2.5 — the lowest level since July 2008, according to Labor Department data. The number of job openings in the U.S. jumped to 4.2 million in February, putting the number of unemployed per open position at 2.5 — the lowest level since July 2008, according to Labor Department data. The ranks of the unemployed have been steady so far this year, as some discouraged workers have come back into the labor force. The rising number of openings indicates that there may be more jobs available for them, as employers had the most open positions since February 2008. There is one caveat, though. Just because there are more openings, doesn’t mean there are more people getting jobs. Bosses may be being picky about their open positions. Indeed, even though there were 158,000 more openings in February than a year earlier, there were only 36,000 more hires.
February JOLTS and March Labor Flows - JOLTS data continue to portray steady recovery. Hires are still below the 2003 trough, which puts the hires indicator at about the same relative place as the current unemployment rate. Job openings continues to grow and is back to the levels of 2005 when unemployment was down to 5%. Quits continue to grow and are back to where they were in 2003 when unemployment was at 6%. The slopes of all the series continue to be reliably positive, even if not particularly steep. Flows have been updated through March, and they also continue to show positive trends. Flows between Employment and Not-in-Labor-Force (NLF) are at a level similar to previous economic peaks, believe it or not. Flows between Employment and Unemployment are also back to levels associated with unemployment rates at 6% or less, and with a strong bias for flows back into Employment. The flows between unemployment and NLF are the set of flows that remain elevated. This is a sign, I believe, of the large pool of long-term unemployed. Trends in the unemployment rate and other indicators of economic strength over the near term will depend on the outcomes of this group of workers. I have suspected that we would see a normalization of this group of workers after the end of EUI. While long-duration unemployment hasn't accelerated downward since the beginning of the year, there does appear to be some downward acceleration in these flows. In fact, over the last two months, as many unemployed workers became employed as left the labor force. That's the first time that has happened since 2008. But, generally, the long term unemployed/NLF group remains a bit of a mystery.
Weekly Initial Unemployment Claims decline to 300,000 - The DOL reports: In the week ending April 5, the advance figure for seasonally adjusted initial claims was 300,000, a decrease of 32,000 from the previous week's revised level. The last time intial claims were this low was May 12, 2007 when they were 297,000. The previous week's level was revised up by 6,000 from 326,000 to 332,000. The 4-week moving average was 316,250, a decrease of 4,750 from the previous week's revised average.The previous week was revised up from 326,000. The following graph shows the 4-week moving average of weekly claims since January 2000.The dashed line on the graph is the current 4-week average. The four-week average of weekly unemployment claims decreased to 316,250. This was lower than the consensus forecast of 320,000. The 4-week average is close to normal levels during an expansion.
New Jobless Claims Plunge to 300K, Much Better Than Forecast - The Unemployment Insurance Weekly Claims Report was released this morning for last week. The 300,000 new claims number was a dramatic decline of 32,000 from the previous week's 332,000 (revised from 326,000). The less volatile and closely watched four-week moving average, which is usually a better indicator of the trend, fell by 4,750, now at 316,250. Here is the opening of the official statement from the Department of Labor: In the week ending April 5, the advance figure for seasonally adjusted initial claims was 300,000, a decrease of 32,000 from the previous week's revised level. The last time initial claims were this low was May 12, 2007 when they were 297,000. The previous week's level was revised up by 6,000 from 326,000 to 332,000. The 4-week moving average was 316,250, a decrease of 4,750 from the previous week's revised average. The previous week's average was revised up by 1,500 from 319,500 to 321,000. Today's seasonally adjusted number at 300K came in well below the Investing.com forecast of 320K. Here is a close look at the data over the past few years (with a callout for the past year), which gives a clearer sense of the overall trend in relation to the last recession and the volatility in recent months.
I Looked Up The Fastest-Growing Jobs In America, And Boy Was It Depressing - Each year, the U.S. Bureau of Labor Statistics projects which occupations it expects will see the greatest growth in the next few years. The results you get depend on whether you're looking at absolute or percentage growth. But, as I discovered, both tell depressing stories. First, on a rate basis, there's basically only one sector in the economy in which labor demand is growing at a steady clip: health and medical (21 out of 30 of the occupations listed in the table below are in this field). Besides that, you can maybe get away with some construction stuff. But the apparent demand for both physical and mental therapy in the U.S. is enormous: On an absolute basis, the data is miserable: The table consists of stuff like secretaries, food workers, and caretakers. The median salary for the fastest-growing raw-numbers occupations, shown in the table below, is $30,000. Compare that with the average first-year-out-of-college salary of $45,000.
Glenn Hubbard Says We Have a Shortage of Workers - Glenn Hubbard, the dean of Columbia Business School and former chief economist to President George W. Bush, argued that we have a shortage of workers in a Wall Street Journal column. Hubbard noted the sharp fall in labor force participation since the downturn. He attributed it to a lack of incentive for people to work. This is in striking contrast to the more obvious logic, that when people have been trying unsuccessfully to find jobs for 6 months or a year, they eventually give up. (This explanation seems especially plausible since we know that employers generally will not even consider hiring a person who has been unemployed for a long period of time.) The problem with Hubbard's story is that he doesn't have a good explanation for why people suddenly decided that they didn't want to work. He points to an increase in the length of unemployment benefits, but this happens in every downturn. Furthermore, the maximum duration of benefits has been cut back sharply from its peak of 99 weeks in the first years of the recession with no corresponding surge in employment. The Affordable Care Act will make it possible for many people to get health care insurance without working or without working full time, but that should only have begun affecting the data in the last few months as the health care exchanges came into existence. It would not explain the drop in labor force participation that was already quite evident by the summer of last year. If the problem is really on the supply side then we should be seeing a surge in vacancies. In fact, the vacancy rate is still more than 10 percent below the pre-recession level and more than 20 percent below the 2000 level. We should also see an increase in the length of the average workweek. While this is more or less back to its pre-recession level (slightly above in manufacturing), it certainly is not unusually high. And we should be seeing rapid wage growth as firms compete for workers. Wages are now just moderately outpacing inflation.
Vital Signs: A Basket of Labor Data Suggests Job Gains Will Continue -- On the heels of a decent employment report comes news that the pace of hiring should hold up in coming months. The Conference Board’s employment trend index increased in March for the third consecutive month. Now back to 117.52, the index is up 5.1% above its year-ago reading and has re-captured almost all of the ground lost during the last recession. The index is a compilation of economic indicators that are designed to foreshadow changes in the labor markets. The board aggregates the indicators to filter out “noise” that could send false signals about the labor markets. “The increase in the employment trends index in the first quarter is signaling solid job growth in the coming months,” . “With [the economy] forecasted to average 2.5% to 3.0% through the end of this year, there is little reason to expect employment growth to slow any time soon.”
Winter Wrapup: Where Was the Hiring and Firing This Year? - The economy’s winter of discontent wasn’t that bad for construction workers and oil drillers. From November to March, unusually cold weather in much of the country slowed economic growth and was largely blamed for a lackluster overall employment gain of 0.4% during the four-month span. But a few sectors actually picked up the pace of hiring during the winter. Residential building might be the most surprising category — seasonally adjusted employment grew 3.1% since November. The average monthly gain of almost 5,000 jobs over the winter was slightly stronger than the 12-month average. That bucks conventional wisdom that colder-than-normal weather would slow hiring for the largely outdoor jobs. The increased hiring could suggest home builders are ramping up in anticipation of stronger demand later this year. Other data point to similar optimism. The pace of newly started homes declined each month from November to February. But permits, an indication future demand, rebounded to November’s level in February, according to Commerce Department data. The fastest job growth this winter came in the temporary help services category. That might not send such a positive signal. Hiring temp workers suggests employers remain hesitant about committing to a permanent job. Temp worker employment increased 3.5% since November. The category has also been the strongest job creators over the past 12 months, up almost 10%. Nearly anything related to oil production also added jobs this winter. Employment in oil-and-gas extraction and in support for mining activates both increased 2.5% since November. Meanwhile, employment in coal mining has fallen 3.2% since November. Employment in motion picture and sound recording declined 6.9% since November. That is the largest percentage drop among sectors employing more than 100,000 workers. Other losers included apparel manufacturing jobs (down 2.6% since November), employment at sporting goods and hobby stores (falling 2.5%) and semiconductor production jobs (down 1.4%). The federal government shed 35,000 jobs since November, a 1.3% decline. Federal employment is down 3% from a year ago.
Employment Diffusion Indexes - These diffusion indexes are a measure of how widespread job gains are across industries. The further from 50 (above or below), the more widespread the job losses or gains reported by the BLS. From the BLS: Figures are the percent of industries with employment increasing plus one-half of the industries with unchanged employment, where 50 percent indicates an equal balance between industries with increasing and decreasing employment. The BLS diffusion index for total private employment was at 58.5 in March, down from 59.1 in February. For manufacturing, the diffusion index decreased to 50.0, down from 51.9 in March. Job growth was fairly widespread for private employment in March.
Women Have Recovered Jobs Lost in Recession, Men Haven’t - U.S. businesses last month recouped the jobs lost during the deep recession and grinding five-year recovery. But the story looks different when you break down job creation between the sexes.“Although the job losses experienced by both women and men during the most recent recession were severe, the resilience of women’s employment and its long-term growth are historic,” Catherine Wood, an economist at the Bureau of Labor Statistics, breaks down payroll survey data to show job losses and gains by sex during the recession and recovery. Both men and women were hit hard by the downturn, though job losses among men outnumbered those among women by 2.6 to 1. The lopsided layoffs pushed women’s employment to 50% of nonfarm payrolls during parts of 2009 and 2010. The figure stood at 49.4% last month, compared with 48.8% just before the recession started.The reason? “Men hold the overwhelming share of jobs in a group of goods-producing industries that are considerably more sensitive to changes in the business cycle, while women hold the majority of positions in the less cyclical service-providing industries,” Since the labor market bottomed out, men’s employment has outpaced women’s, but not by enough to repair the damage from the recession.Overall employment among women last month reached an all-time high when payrolls topped 68.1 million. In fact, the number of women in payroll jobs surpassed its previous peak—67.6 million in March 2008—way back in September.Women’s employment in the private sector reached almost 55.7 million last month, also a new high. The jobs recovery doesn’t account for population growth. When accounting for the rise in the number of entrants to the workforce, the economy is still lagging for both sexes.
Unemployment Shows Why We’re Getting Worse at Economic Recoveries - In an interactive report on the labor market, released Monday, Fed researchers noted that recovery from each of the last three recessions, measured by the amount of time it takes to restore all the jobs lost during the recession, has taken increasingly more time. From 1950 to 1989, the U.S. suffered seven different economic recessions, and the average amount of time required to replace the lost jobs was 10 months. But the recession of 1990-1991 took 23 months, the 2001 recession took 38 months, and the Great Recession of 2007-2009 has been ongoing for 57 months, and still isn’t complete. “The nation's labor market has recovered far more slowly after the Great Recession than it did following every other economic downturn since World War II,” the report found. “The compensation to workers—including benefits and adjusted for inflation—has barely risen above its prerecession level,” it says. “At year's end, almost 38 percent of unemployed people had been jobless for at least 27 weeks, by far the highest percentage of long-term unemployment since World War II. Moreover, 12.6 million people left the labor force in the six years through December 2013.” One of the differences between this recovery and those in the past was the austerity measures the government adopted to reduce spending. The study notes that public sector employment has historically weathered economic downturns well. But this time around, with officials at all levels of government citing the need to slash spending, government employment dropped precipitously, creating more unemployed workers with little spending power.
Why We Need Long-term Unemployment Insurance - Treasury Blog - Yesterday, in a bipartisan vote, the Senate passed a bill that would restore Emergency Unemployment Compensation, a supplemental, long-term unemployment insurance program that provides financial support to unemployed American workers whose standard unemployment insurance has run out as they search for employment. This program was allowed to lapse in December, despite the fact that long-term unemployment spans all ages, all industries, and all states. By allowing job seekers to pay for basic necessities like housing and food while they continue their job search, the long-term unemployment insurance program also provides a boost to private-sector spending. Indeed, the non-partisan Congressional Budget Office has called the long-term unemployment insurance program a cost-effective means of spurring growth and creating jobs. As the economy continues to recover from the worst economic recession since the Great Depression, long-term unemployment insurance should be part of our economic policy strategy. This legislation has now passed the Senate and awaits action by the House before it can go to the President to be signed into law.
Bill to restore US unemployment insurance likely to deadlock in Congress - A bipartisan attempt to restore unemployment insurance to more than two million out-of-work Americans appeared likely to fall victim to deadlock in Congress on Tuesday.. The Senate passed legislation on Monday night that would temporarily extend lapsed emergency assistance measures that were first introduced after the banking crash, in exchange for reforms designed to curb fraud and claims by the very rich. But the Republican speaker of the House of Representatives, John Boehner, said on Tuesday that he would not allow a vote on the bill without additional measures to stimulate job growth. The bill, which passed the Senate by 59-38 with the support of six Republicans, seeks to address earlier concerns raised by House leaders by including proposals to pay for the extension through a separate reform of employee pension obligations. But on Tuesday, Boehner's spokesman Michael Steel told the Associated Press that the House leadership was only “willing to look at extending emergency unemployment insurance as long as it includes provisions to help create more private sector jobs", something he said Senate Democrats were refusing to do. At a press conference on Tuesday morning led by House majority leader Eric Cantor, the issue was not even addressed, and Congress will shortly break for Easter. Moderate Republicans in the Senate have not given up on hopes of passing some form of unemployment insurance, but concede privately that they face a constantly shifting set of concerns from colleagues in the House.
WSJ Employment Graph ignores Demographics, Needs Correction - I have to comment on the graph below. From the WSJ: U.S. Reaches a Milestone on Lost Jobs. And the article had the following graph for private employment: To create this graph, the WSJ used the ratio of private employment in January 2008 (115.977 million) to the total civilian noninstitutional population. The dashed line assumes that this ratio stayed constant since January 2008 - and seems to suggest that there should be 7.2 million more private sector jobs today. This is nonsense. This ignores the decline in the participation rate due to demographics. I've been discussing the decline in the participation rate for several years, and this has attracted significant attention recently. There are several key demographics trends, the two most obvious being the large cohort (baby boomers) moving into lower participation age (over 55), and the long term trend of more younger people (16 to 24) staying in school. The cyclical decline is due to the lingering effects of the housing bust and financial crisis on the labor market. There is an ongoing discussion about how much of the decline has been due to demographics, and how due to the effects of the great recession. I think more than half is demographics (other research suggests about half, some suggests less). If we just looked at demographics, the civilian noninstitutional population for the prime working age group (25 to 54) has declined by 1.5 million people since Jan 2008! So ignoring the young and the old, we'd expect fewer workers today - not more. That would be incorrect too since many people continue to work past 55 (and many young Americans still work). Here is a table of some of the demographic changes over the last 6 years:
Research: Labor Force Participation Rate - Projecting the labor force participation rate is very complicated. There are many conflicting trends that must be considered ...For those interested in the numbers, I recommend this recent article from BLS economist Mitra Toossi: Labor force projections to 2022: the labor force participation rate continues to fall . In the first 12 years of the 21st century, the growth of the population has slowed and labor force participation rates generally have declined. As a result, labor force growth also has slowed. The Bureau of Labor Statistics (BLS) projects that the next 10 years will bring about an aging labor force that is growing slowly, a declining overall labor force participation rate, and more diversity in the racial and ethnic composition of the labor force. The U.S. labor force is projected to reach 163.5 million in 2022. The labor force is anticipated to grow by 8.5 million, an annual growth rate of 0.5 percent, over the 2012–2022 period. The growth in the labor force during 2012–2022 is projected to be smaller than in the previous 10-year period, 2002–2012, when the labor force grew by 10.1 million, a 0.7-percent annual growth rate. There are a number of tables in the article showing the trends for various cohorts. An excellent resource!
Possible Reasons for the Decline in Prime-Working Age Men Labor Force Participation - An interesting topic is why there has been a steady decline in the labor force participation rate for prime-working age men (ages 25 to 54). In the previous post I wrote: "The participation rate for [prime-working age] men decreased from the high 90s decades ago, to 88.5% in March. This is just above the lowest level recorded for prime working age men. This declining participation is a long term trend, and the reasons for this decline in working age men participation are varied and need more research, however some analysts incorrectly blame this trend solely on more social benefits." First here is a repeat of the of the graph I posted earlier today: This graph shows the changes in the participation rates for men and women and combined since 1960 (in the 25 to 54 age group - the prime working years). So why the long term decline? Here are some possible reasons:
1) Cultural changes. As a larger percentage of women entered the labor force (pink line in first graph), this allowed men some more options, such as: a) take some time off between jobs, b) go back to school to improve skills or be able to change careers, c) be a "Mr. Mom".
2) Demographics. It is possible that the changing ethnicity of the prime working-age population is contributing to the decline in the participation rate for prime-working age men.
3) Underground Economy. It is also possible that the underground economy (cash economy) is growing, and some of these men are actually working "off the books" for cash.
4) Increased benefits for disability and illness. Note: Everyone opposes fraud, but that is probably only a small problem. Overall most Americans would consider it good news that people with serious illnesses or disabilities receive benefits - even if that has contributed a little to the decline in the participation rate.
5) Inheritance and lower estate taxes. Although the impact has probably been small, the decline in the participation rate for working-age men has tracked the decline in the inheritance tax over the last 50 years. I'm guessing there are more working-age men not working today because they are living off their inheritance
A Closer Look at Post-2007 Labor Force Participation Trends -- Atlanta Fed's macroblog -- The rate of labor force participation (the share of the civilian noninstitutionalized population aged 16 and older in the labor force) has declined significantly since 2007. To what extent were the Great Recession and tepid recovery responsible? In this post and one that will follow, we offer a series of charts using data from the Current Population Survey to explore some of the possible reasons behind the 2007–13 drop in participation. This first post describes the impact of the changing-age composition of the population and changes in labor force participation within specific age cohorts—see Calculated Risk posts here and here for a related treatment, and also this recent BLS study. The next post will look at the issue of potential cyclical impacts on participation by examining the behavior of the prime-age population.
Reasons for the Decline in Prime-Age Labor Force Participation - Atlanta Fed's macroblog -- As a follow up to this post on recent trends in labor force participation, we look specifically at the prime-age group of 25- to 54-year-olds. The participation decisions of this age cohort are less affected by the aging population and the longer-term trend toward lower participation of youths because of rising school enrollment rates. In that sense, they give us a cleaner window on responses of participation to changing business cycle conditions. The labor force participation rate of the prime-age group fell from 83 percent just before the Great Recession to 81 percent in 2013. The participation rate of prime-age males has been trending down since the 1960s. The participation rate of women, which had been rising for most of the post-World War II period, appears to have plateaued in the 1990s and has more recently shared the declining pattern of participation for prime-age men. But the decline in participation for both groups appears to have accelerated between 2007 and 2013 (see chart 1). We look at the various reasons people cite for not participating in the labor force from the monthly Current Population Survey. These reasons give us some insight into the impact of changes in employment conditions since 2007 on labor force participation. The data on those not in the official labor force can be broken into two broad categories: those who say they don't currently want a job and those who say they do want a job but don't satisfy the active search criteria for being in the official labor force. Of the prime-age population not in the labor force, most say they don't currently want a job. At the end of 2007, about 15 percent of 25- to 54-year-olds said they didn't want a job, and slightly fewer than 2 percent said they did want a job.
Demographic Trends in the 50-and-Older Work Force: Monthly Update - In my earlier update on demographic trends in employment, I included a chart illustrating the growth (or shrinkage) in six age cohorts since the turn of the century. In this commentary we'll zoom in on the age 50 and older Labor Force Participation Rate (LFPR). But first, let's review the big picture. The overall LFPR is a simple computation: You take the Civilian Labor Force (people age 16 and over employed or seeking employment) and divide it by the Civilian Noninstitutional Population (those 16 and over not in the military and or committed to an institution). The result is the participation rate expressed as a percent. For the larger context, here is a snapshot of the monthly LFPR for age 16 and over stretching back to the Bureau of Labor Statistics' starting point in 1948, the blue line in the chart below, along with the unemployment rate. The overall LFPR peaked in February 2000 at 67.3% and gradually began falling. The rate leveled out from 2004 to 2007, but in 2008, with onset of the Great Recession, the rate began to accelerate. The latest rate is 63.0%, back to a level first seen in 1978. The demography of our aging workforce has been a major contributor to this trend. The oldest Baby Boomers, those born between 1946 and 1964, began becoming eligible for reduced Social Security benefits in 2008 and full benefits in 2012. Job cuts during the Great Recession certainly strengthened the trend. It might seem intuitive that the participation rate for the older workers would have declined the fastest. But exactly the opposite has been the case. The chart below illustrates the growth of the LFPR for six age 50-plus cohorts since the turn of the century. I've divided them into five-year cohorts from ages 50 through 74 and an open-ended age 75 and older. The pattern is clear: The older the cohort, the greater the growth.
Long-Term Unemployment and Older Workers - The plague of long-run unemployment is one of the worst consequences of the aftermath of the Great Recession, as I have noted here, here, and here. David Neumark and Patrick Button present evidence that this burden is shouldered primarily by older workers in "Age Discrimination and the Great Recession," discussed in the Economic Letter of the Federal Reserve Bank of San Francisco for April 7, 2014. One way to measure long-run unemployment is to look at the average length of time that an unemployed worker is out of a job. From 1990 up to the start of the Great Depression, men and women aged 55 and over tended to be out of work longer than unemployed workers in the 25-54 age bracket, but the difference typically wasn't very large. But after the Great Recession, the duration of unemployment rose to over 20 weeks for those in the 25-54 age bracket, but to about 35 weeks for the unemployed in the 55 and over age bracket. Of course, discrimination by age is illegal in the United States under the Age Discrimination in Employment Act originally passed in 1967 and then amended and strengthened several times since then. However, states are allowed, if they wish, to enact age discrimination rules that are stronger than the federal standard. For example, the federal law only applied to employers with 20 or more employees, but 34 states have set lower size minimums. Similarly, federal age discrimination law only allows for "liquidated damages," which means wage losses that actually occurred, while 29 states also allow for compensatory or punitive damages
Labor Secretary: Long-term Unemployment Keeps Me up at Night - The plodding recovery in the U.S. job market isn’t doing much to help the long-term unemployed. But Labor Secretary Tom Perez says that doesn’t mean we should stop trying.Last month, I reported on mounting evidence that even a stronger economic recovery wouldn’t create jobs for workers who have been jobless for more than six months. Only about 10 percent of the long-term unemployed find work each month, and even those lucky few mostly end up in temporary, part-time or informal jobs. What’s worse, their luck has barely improved even as the overall economy has gotten stronger. On Friday, I had the chance to speak with Perez shortly after his agency released its monthly jobs report, which estimated there are still 3.8 million Americans who have been out of work for more than six months, down from 7 million in 2010 but still nearly three times as many as when the recession began in December 2007. Perez called the number “unacceptably high.”“Long-term unemployment is what really keeps me up the most at night,” Perez said. “We’re making some progress but we continue to be at near-record highs.”Some of the most troubling research on long-term unemployment comes from a former Obama administration official, Princeton University economist Alan Krueger, who in a paper published last month found that the long-term jobless aren’t doing meaningfully better even in states where the recovery has been stronger.
America’s Structural Unemployment Crisis in Two Charts - Wolf Richter -- The enormous number of people who work only part-time for economic reasons is one the tragedies of the unemployment crisis in this country. It didn’t even start with the financial crisis. Before the 2001 recession, there were a little above 3 million of them. By September 2003, as the economy recovered, there were 4.84 million. Gradually, part-timers got fulltime work, and their number zigzagged back down. In April 2006 dropped, it below 4 million, but only briefly, then edged up again. It never returned to the “normal” that was before the 2001 recession. Then came the financial crisis, and as layoffs soared, some of the lucky ones who got to stay on were cut to part time. Many of the unemployed, once they found jobs, found part-time jobs. And the number of involuntary part-timers just exploded. It’s as if companies had been using the last two recessions as an excuse to make their workforce more flexible, using people only when absolutely needed, on irregular schedules, and keeping them on stand-by the rest of the time. This is a powerful tool in bringing payroll expenses down. It makes the company look awesome on paper. It wreaks havoc on the lives and incomes of workers and is terrible for the overall economy. The same structural unemployment drivers are at work with temporary full-time workers. In September 2003, as hiring finally kicked off, there were 2.26 million temps of 130.3 million total nonfarm employees. By summer of 2006, the number of temps had jumped 17.8% to 2.66 million while total nonfarm employment had risen 4.9% to 136.6 million. Then the number of temporary workers began to decline, which was seen as a good sign as the total number of employees was rising; businesses were shifting to regular hires. Or so the story went. But businesses were already having demand issues. The housing construction bubble had started to implode. And for whatever reason, companies started to shed temporary workers. And look what happened:
Is the temp economy permanent? -- If the US job market were undergoing some sort of major, long-lasting transformation, how would we know? Well, the data might start looking kind of weird. Maybe the labor force participation would collapse, or wages would stagnate, or job creation would shrivel. Or we might see something like a big rise in temporary workers. Indeed, Wall Street Journal reporter Damian Paletta points out, “More than 2.8 million workers were categorized as having temp jobs in March—about 2.5% of the workforce—up from 1.7 million in August 2009.” Of course a rise in short-term jobs is typical after a downturn, and a big increase often comes right before an upturn in permanent hiring. But maybe not this time. Paletta:The boost is fueled by companies that reduced hiring amid the recession and learned they can save money in wages and benefits, as well as increase their flexibility, by using fewer permanent workers—even as the economy grows. Technology advances, particularly in manufacturing, have led companies to rethink how many permanent workers they need at a time when temp jobs have become increasingly long term. So are we are headed to where Japan already is? A third of its workers are temps who are paid less, receive fewer benefits, and have less job security. Not surprisingly, all this takes a toll on family formation, the last thing a nation with a shrinking population needs. If this trend is longer-term, it argues for better education and training so workers can do the high-value things machines can’t. Government should also be careful of polices that raise hiring costs like mandating benefits or wage floors. In fact, policymakers should take a deep look at wage subsidies for lower-skilled workers. Above all, lawmakers at all levels need to take seriously the impact of technology on labor markets.
Stagnation Without End, Amen - Paul Krugman - The suggestion that only the short-term unemployed matter for wage determination, that the long-term unemployed have been written off, is rapidly congealing into orthodoxy. And it might be true. But I’m with Mike Konczal here: it’s far from being a well-established fact. Mike argues that to the extent it was true at all, it was a temporary phenomenon, and that more recent data don’t support the claim. I’d make a different (although not necessarily conflicting) argument: a lot of the supposed evidence comes from applying Phillips curves estimated over periods of moderate to high inflation, and there are good reasons to believe that such estimates misbehave at low inflation. If you look at the figures Mike extracts from Krueger et al (pdf), they show “accelerationist” Phillips curves: unemployment determines not the rate of change of prices or wages, but the change in the rate of change. The idea is that recent inflation gets built into expectations and hence establishes a new baseline for each year’s short-run tradeoff. But we know that there is strong evidence for downward nominal wage rigidity, which is binding for many workers at low inflation; we are constantly told that these days inflation expectations are “anchored”; and we know from historical experience with prolonged large output gaps (PLOGs) that countries very rarely go into actual deflation. All of this suggests that using a wage or price equation estimated over the 70s and early 80s could be very misleading if applied to today’s environment.
The Continuing Saga of Sustained Secular Stagnation - Dean Baker - Paul Krugman continues to delve into the depths of sustained secular stagnation asking about the possibility of a prolonged period where the economy does not self-correct to full employment. In the process he takes a sidestep to tell readers that this is not the secular stagnation story of Bill Greider from the 1990s. This one is worth a moment's thought. (Just to be clear, I consider both Krugman and Greider friends, so I don't have a particular ax to grind in this story.) Greider hit on a number of themes in this book, but at least part of the story was one of the U.S. trade deficit creating a deficiency in aggregate demand. In properly behaved macro models, trade deficits are supposed to be self-correcting as the value of the deficit nation's currency falls and the values of the surplus nations' currencies rise. This makes imports more expensive to the deficit nation and their exports cheaper to people living in other countries. This leads to fewer imports and more exports and therefore more balanced trade. But this adjustment has not happened, or certainly has not happened quickly. We can blame evil doers at central banks in other countries who are manipulating their currencies or frightened foreigner investors who think dollar denominated assets are the only safe place to store their wealth. The actual cause does not matter, the point is that the dollar has not fallen to correct the imbalance.
Automation Alone Isn’t Killing Jobs, by Tyler Cowen - Back in the 19th century, steam power and machinery took away many traditional jobs, though they also created new ones. This time around, computers, smart software and robots are seen as the culprits. They seem to be replacing many of the remaining manufacturing jobs and encroaching on service-sector jobs, too. Driverless vehicles and drone aircraft are no longer science fiction, and over time, they may eliminate millions of transportation jobs. Many other examples of automatable jobs are discussed in “The Second Machine Age,” a book by Erik Brynjolfsson and Andrew McAfee, and in my own book, “Average Is Over.” The upshot is that machines are often filling in for our smarts, not just for our brawn — and this trend is likely to grow. How afraid should workers be of these new technologies? There is reason to be skeptical of the assumption that machines will leave humanity without jobs. After all, history has seen many waves of innovation and automation, and yet as recently as 2000, the rate of unemployment was a mere 4 percent. There are unlimited human wants, so there is always more work to be done. The economic theory of comparative advantage suggests that even unskilled workers can gain from selling their services, thereby liberating the more skilled workers for more productive tasks.Nonetheless, technologically related unemployment — or, even worse, the phenomenon of people falling out of the labor force altogether because of technology — may prove a tougher problem this time around.
If Technology Has Increased Unemployment Among the Less Educated, Someone Forgot to Tell the Data - Dean Baker - Tyler Cowen warns us that technology may be making it much harder for less educated workers to get jobs. He highlights a series of changes in the economy then tells readers: "All of these developments mean a disadvantage for people who don’t like formal education, even if they are otherwise very talented. It’s no surprise that current unemployment has been concentrated among those with lower education levels." Actually, the data show unemployment has been less concentrated among the less educated in this recovery than was the case twenty years ago. Over the first three months of 2014 the unemployment rate for people over age 25 with at least a college degree averaged 3.3 percent. This is slightly higher than the 3.1 percent average in the first quarter of 1992. While the unemployment rate for college grads was higher in the most recent period than in 1992, it was lower for both people with just high school degrees and for people who did not graduate high school. For high school grads the unemployment rate averaged 6.4 percent in the most recent quarter, half a percentage point below the 6.9 percent average in the first quarter of 1992. For those without college degrees the unemployment rate was 9.7 percent in the first quarter of 2014 more than a percentage point lower than the 11.0 percent average in the first quarter of 1992. There are other measures that may support Cowen's case, but a simple comparison of unemployment rates by education levels shows the opposite.
America Can Attain Full Employment with a Bold Approach to the Jobs Emergency -- After five long years, the economy has at last produced enough new jobs to compensate for the 8 million lost in the Great Recession of 2009. But in that same period some 7 million more Americans reached employment age, and we have only produced about half the jobs we need to keep up with population growth. To make matters worse, the jobs created during the recovery pay on average much less than those lost. Yet rather than pulling out all the stops to create more and better jobs, too many politicians and economists tell us we can’t move too quickly. They cite limitation after limitation: inflation fears, budget deficits, skills mismatches, and so on. Americans deserve better than this defeatism. We deserve bold action. In a new report, A Bold Approach to the Jobs Emergency, the Bernard L. Schwartz Rediscovering Government Initiative offers fifteen ideas that could get us back to true full employment and at the same time build a foundation for rapid economic growth in the future. We are demanding a full-court press to recreate the economic opportunity that America once offered. We emphasize some ideas that have been heard before, but many that are forced to the back seat or are hardly talked about at all.
Capitalize Workers! - NYTimes.com: There is a vast difference in the way the wealthy and the rest of Americans earn their money. In 2010, 60 cents of every dollar earned by those in the top 1 percent came from investments and businesses they owned. For the middle class, it was 6 cents.For decades, the returns to capital have far outstripped the returns to labor. Before the mid-1980s, worker salaries constituted 65 percent of national income. In 2012, they were 58 percent. Economists rightly fret over how this contributes to wealth inequality. Well, if you can’t beat ’em, join ’em. If all working people, whatever their wage, could get a piece of these gains, it would improve their financial well-being exponentially. This is where the minimum pension comes in.We are proposing a Savings Plan for Universal Retirement account, the centerpiece of which is a 50-cent-per-hour minimum retirement contribution from all employers to virtually all employees. This is not what President George W. Bush proposed when he sought to privatize Social Security in 2005. Under our plan, Social Security remains as is, but every worker would also have his or her own private Individual Retirement Account, the way many white-collar workers do now.Contributions placed in this account would automatically go into a privately run low-fee life-cycle fund. (Life-cycle funds comprise a mix of stock and bond investments tailored to how far the owner is from retirement.) Recipients could switch investment options to say, an S&P 500 index fund. A government board like the one that now manages the retirement accounts of federal employees would sanction the investment options.
Obamacare Increased Voluntary Part-Time, Involuntary Is Down - Dean Baker - Paul Solman seems determined to make me an optimist on the state of the economy, at least by comparison. Following the comments of Kristin Butcher, chair of Wellesley's economic department, his blogpost on the March jobs report dismisses the 192,000 job growth reported for March: "That’s because, according to the survey of 60,000 households, roughly 170,000 more Americans of working age were added to the population in March, consistent with the number we add just about every month, and also consistent with the Census Bureau’s report that the U.S. population is growing at slightly more than 2 million people a year.But that would mean that the number of jobs added — 192,000 — just kept pace with the number of new people who needed them." This comment misses the fact that not everyone works. The employment to population ratio (EPOP) is just below 60 percent. This means that for the EPOP to stay constant we need roughly 100,000 new jobs a month. In this context, the March numbers implied that we reduced the number of unemployed by roughly 90,000. The other item on which I am more optimistic than Solman is part-time employment. He emphasized the rise in involuntary part-time as bad news. I looked to the rise in voluntary part-time as good news. While the number of people working part-time involuntarily did rise in March, it is still 240,000 (@ 3.0 percent) below the year ago level, and is fact well below the level for any month in 2013. These numbers are erratic and the March rise partly reverses a drop of 580,000 reported between December and February. In other words, there is no evidence in this series that the Affordable Care Act (ACA) is increasing the number of people involuntarily working part-time as the post suggests.
Five Years of Declining Unemployment Doing Little to Close Race Gaps -- Race matters in America’s labor market. The unemployment rate has been dropping steadily since October 2009, but this progress is doing little to close the gap between black, Hispanic and white workers. -Yet even as unemployment has declined to 6.7% from 10%, the disparity between workers of different races remains wide. In Friday’s jobs report from the Bureau of Labor Statistics, the unemployment rate among black workers was 12.4% compared to 7.9% among Hispanics workers, 5.8% among white workers 5.8% and 5% among Asian workers. (The accompanying chart is not-seasonally adjusted, because the Labor Department does not seasonally adjust the unemployment rate for Asians.) Although every group has made progress, nearly five years into the recovery, the gap between black and white workers is barely closing, if at all. A year ago, the black unemployment rate was 7.4 percentage points higher than for whites. In today’s report, it was 7.5 percentage points higher. For both black and Hispanic workers, the disparity remains significantly wider than before the recession began in December 2007. In mid-2006, the gap between Hispanic and white workers had closed almost entirely, with Hispanic employment only half a percentage point above white employment. Today the gap is 2.3 percentage points. Many factors could account for the disparity, but one thing that doesn’t explain it is educational attainment. Blacks and Hispanics with college degrees are more likely to be unemployed than whites with college degrees.
The Long-Term Unemployment Trap - As has become apparent, the recovery in the American job market since the end of the Great Recession has been much different than in the past. One of the key differences this time has been the elevated numbers of Americans that have been unemployed for the long-term (over six months) as shown on this graph: The economy is nearly five years out of the last recession and the number of long-term unemployed workers is still nearly twice the level seen after the end of the 1991 and 2001 recessions. The continuing level of high long-term unemployment is puzzling, particularly given that, as shown here, the number of job openings has increased substantially and is nearly at the same level that it was at before the glutinous brown matter hit the rotating cooling device: Obviously, the elevated level of long-term unemployment has long outlived its original causes. A paper, "The JoblessTrap" by Rand Ghayad examines what it is like to be one of America's long-term unemployed undertaking a job search. The author uses a resume audit study in which he explores the extent to which employers forgive long periods of unemployment even when the applicant's merits appear to be strong because they've worked in the same type of firm as the prospective employer according to their resume. Here are the findings of his study. The number of interview requests per month drops as the months of unemployment pass, particularly sharply after six months of non-employment for both matching and non-relevant experience as shown on this graph:
Long-Term Unemployment Is Elevated Across All Education, Age, Occupation, Industry, Gender, And Racial And Ethnic Groups -- Today’s Economic Snapshot shows that long-term unemployment is elevated for workers at every education level. The table below provides additional breakdowns of long-term unemployment by age, gender, race/ethnicity, occupation, and industry. For each category, the table shows the long-term unemployment rate in 2007, the long-term unemployment rate in 2013, and ratio of the two. It demonstrates that while there is considerable variation in long-term unemployment rates across groups—which is always true, in good times and bad—the long-term unemployment rate is substantially higher now than it was before the recession started for all groups. The long-term unemployment rate is between 2.9 and 4.3 times as high now as it was six years ago for all age, education, occupation, industry, gender, and racial and ethnic groups. Today’s long-term unemployment crisis is not at all confined to unlucky or inflexible workers who happen to be looking for work in specific occupations or industries where jobs aren’t available. Long-term unemployment is elevated in every group, in every occupation, in every industry, at all levels of education. Elevated long-term unemployment for all groups, like we see today, means that today’s long-term unemployment crisis is not due to something wrong with these workers, it is due to the fact that businesses across the board simply haven’t needed to significantly increase hiring because they haven’t seen demand for their goods and services pick up enough to warrant it.
The safety net catches the middle class more than the poor - Catherine Rampell - In the past few decades, the federal social safety net has gotten lusher and, on its face, more generous. Spending on the major safety-net programs nearly quadrupled between 1970 and 2010, and that’s after adjusting for inflation and population growth, according to calculations by Robert A. Moffitt, an economics professor at Johns Hopkins University. He included both “means-tested” programs that are explicitly intended to combat poverty (such as food stamps, Medicaid, housing aid, Head Start, Temporary Assistance for Needy Families and the earned-income tax credit) and social insurance programs (Medicare, Social Security, disability insurance, workers’ compensation and unemployment insurance). There have been, however, winners and losers during that massive expansion.Since the mid-1990s, the biggest increases in spending have gone to those who were middle class or hovering around the poverty line. Meanwhile, Americans in deep poverty — that is, with household earnings of less than 50 percent of the official poverty line — saw no change in their benefits in the decade leading up to the housing bubble. In fact, if you strip out Medicare and Medicaid, federal social spending on those in extreme poverty fell between 1993 and 2004. Then, during the Great Recession and not-so-great recovery, automatic stabilizers kicked in and Congress passed new, mostly temporary, stimulus measures (such as unemployment-insurance benefit extensions). As a result, spending on the social safety net increased sharply and this time for a broader swath of Americans, including the very poor, “near-poor” and middle class. But it still rose more for people above the poverty line than it did for the very poor, Moffitt found.
Workers on the Edge: One of the most significant contributing causes of the widening inequality and insecurity in the American workforce is the accelerating shift to what economists call contingent employment. That means any form of employment that is not a standard payroll job with a regular paycheck. It can take the form of temps, contract workers, part time jobs, or jobs with irregular hours. A study by the GAO found that fully one-third of the U.S. workforce, or 42.6 million workers, was contingent, meaning in a work arrangement that is “not long-term, year-round, full-time employment with a single employer. “ It is a common myth that the shift to precarious, irregular employment reflects either the structure of the new, digital economy or the preferences of workers themselves. But in reality, most contingent work is the result of efforts by employers to undermine wages, job protections and worker bargaining power. Work that could be (and once was) standard payroll employment is turned into substandard jobs, because corporations prefer it that way. And much of this shift is illegal, even though the laws are weakly enforced. At heart of contingent work is the misclassification of regular workers as independent contractors, a practices that deprives workers of income, benefits such as workers compensation, and rights to form bargaining units—and deprives government of tax revenues. While some contractors are truly independent high-paid professionals, working in Silicon Valley, Hollywood, and the New York financial industry while enjoying the flexibility of their various relationships with the companies that give them assignments, many more are low-paid workers who are misclassified. A Fiscal Policy Institute study of the New York state workforce in 2005 found that 10.6 percent of the private sector workforce was misclassified. Similarly, a study done for the U.S. Department of Labor in 2000 reported that as many as thirty percent of employers misclassified some of their employees.
Hoping for Asylum, Migrants Strain U.S. Border - After six years of steep declines across the Southwest, illegal crossings have soared in South Texas while remaining low elsewhere. The Border Patrol made more than 90,700 apprehensions in the Rio Grande Valley in the past six months, a 69 percent increase over last year.The migrants are no longer primarily Mexican laborers. Instead they are Central Americans, including many families with small children and youngsters without their parents, who risk a danger-filled journey across Mexico. Driven out by deepening poverty but also by rampant gang violence, increasing numbers of migrants caught here seek asylum, setting off lengthy legal procedures to determine whether they qualify. The new migrant flow, largely from El Salvador, Guatemala and Honduras, is straining resources and confounding Obama administration security strategies that work effectively in other regions. It is further complicating President Obama’s uphill push on immigration, fueling Republican arguments for more border security before any overhaul.With detention facilities, asylum offices and immigration courts overwhelmed, enough migrants have been released temporarily in the United States that back home in Central America people have heard that those who make it to American soil have a good chance of staying.
In New Tack, I.M.F. Aims at Income Inequality - What happened to the I.M.F.? Stay with me. Don’t go. This is not another column about global financial bureaucracy.To suffering government officials from developing countries who have knocked on its door seeking cash over the years, the abbreviation for the International Monetary Fund has long been understood to mean “It’s Mostly Fiscal” — a play on the lending institution’s single-minded focus on spending cuts. As guarantor of global economic stability, the I.M.F. long defined success narrowly: sustained growth, low inflation and a balanced budget. The distribution of income, its many critics charged, ranked far too low on its list of interests, if it appeared at all.But lately the fund’s definition of success has broadened. Last week I interviewed the I.M.F.’s managing director, Christine Lagarde, ahead of its spring meetings in Washington this week, which are held in conjunction with the World Bank.“I hear people say, ‘Why do you bother about inequality? It is not the core mandate.’ Well, sorry, it is also part of the mandate,” Ms. Lagarde told me. “Our mandate is financial stability. Anything that is likely to rock the boat financially and macroeconomically is within our mandate.”
What do average Americans think about inequality? - Here is what McCall found (updated a bit with new surveys):
- * First, surveys show that Americans are aware that inequality has grown.
- * Second, Americans do not like high income inequality
- * Third, most Americans find widening inequality objectionable because it seems to undercut opportunities for economic advancement.
- * Fourth, a growing percentage of Americans want something done about inequality.
- * Fifth, what Americans have not increasingly endorsed is having the government redistribute income.
- * Sixth, what Americans do want the government to do – and there is increasing support for this – is to increase opportunity, notably by funding more education.
Family Structure and Inequality -- What are the determinants of inequality? The first step in answering this question is defining exactly what we mean by inequality. A working paper by Chetty, Hendren, Kline, and Saez takes an interesting approach: it measures inequality based on the likelihood that a child born into a poor family will rise in the overall income distribution. They call this measure “absolute upward mobility.” If absolute upward mobility is high, it means a child born into a poor family has a good chance of rising in the overall income distribution. If it is low, that means the poor child will likely be poor when she grows up. The authors construct upward mobility for different cities. A city with a high score is considered more equal; a child born to a relatively poor family in the city has a good chance of rising in the income distribution. A city with a low score is more unequal, as a poor child is likely to remain poor as an adult. The part of the study that interests us most is the correlation between their measure of inequality and other variables at the city level. In other words, what characterizes the most “unequal” cities? It turns out that one variable is far more statistically powerful than any other variable: the fraction of mothers that are single. Here is the correlation across cities between upward mobility and the fraction of mothers that are single.
The Politics Around Welfare Show Why the Poor Need a Real Break, Not Just a Tax Break - A brainchild of the Nixon administration, the Earned Income Tax Credit has long been held up as an “incentive to work,” presumably in contrast to public assistance programs that support the unemployed. And so the EITC, along with the parallel Child Tax Credit (CTC) aimed directly at supporting children within a household, are key pillars of both the White House budget proposal as well as the far-right counter-proposal of Representative Paul Ryan. While he rails against public assistance in general for supposedly destroying a “culture of work,” Ryan has praised the EITC as part of a conservative anti-poverty agenda, in which “federal assistance should not be a way station [but] an onramp—a quick drive back into the hustle and bustle of life.” However, Ryan’s budget would revamp the EITC in a way that steepens the onramp out of poverty. Back in 2009, Congress expanded the tax break for lower-income families, helping to lift 1.5 million people above the poverty line. But Ryan is proposing to let this measure expire, along with other draconian welfare cuts and, in addition, to make “massive unspecified cuts amounting to hundreds of billions of dollars” from the section of the budget containing the tax credits. The White House budget would specifically expand the EITC for childless workers, which would, according to CBPP, provide a much-needed boost in income stability and workforce participation among the poorest childless adults.
Minimum Wages and Women’s Wage Inequality: They’re Intimately Related -- I think this is a pretty remarkable picture that hasn’t gotten enough attention, perhaps because it’s a touch complex. It shows the relationship between wage inequality among women workers and the minimum wage, and the fit is very tight. The blue line shows the gap in pay between middle- and low-wage women, i.e., the 50-10 gap, where 50 means the median wage and 10 means the 10th percentile. Over the course of the 1980s, the median female real wage grew 8% while the 10th percent wage fell 17%. The red line is the real minimum wage, inverted on the right side axis, so you can clearly see the negative correlation. Note that the real minimum fell 30% over the 1980s. Basically, for many years, the pay of the lowest paid women workers was in no small part set by the minimum wage, and it remains a key labor market support for low-earning women. As we document here, 58% of the beneficiaries of the proposed increase in the federal minimum wage are women. What happened at the end of the slide, when the real minimum goes up (down in the inverted graph) but the 50-10 wage gap stays flat? That’s good old macro, folks: over the period where the inequality index has been flat, real wages fell for both median and low-wage women (e.g., from 2004-13, down 3% for low-wage and 2% for median).
Maryland set to increase its minimum wage to $10.10 by 2018 - Legislation to increase Maryland’s minimum wage to $10.10 by 2018 is now ready for Gov. Martin O’Malley (D) to sign into law following a final vote by the Maryland House of Delegates on Monday. Increasing the minimum wage has been O’Malley’s top priority in his final legislative session, although he has seen his original proposal dragged out and loaded with exemptions. The House voted 87 to 47 on Monday to accept additional changes to the legislation made by the Senate over the weekend. President Obama has encouraged state and local lawmakers to increase their minimum wage to $10.10, and Connecticut was the first state to do so by passing legislation last month that will increase the minimum wage to $10.10 by Jan. 1, 2017. Maryland will take a year and a half longer, getting to $10.10 by July 1, 2018. The delay is aimed at giving businesses more time to adjust.
What Happened to Fast-Food Workers When San Jose Raised the Minimum Wage? - A 25% minimum-wage increase in San Jose, Calif., didn’t cause the region’s fast-food franchises to stop hiring. But it might have caused some heartburn. A 2012 ballot initiative, started by San Jose State University students, resulted in a $2 increase to the city’s minimum wage. Opponents of the increase said it would lead to job losses. Initial data suggests that isn’t the case. The pace of hiring at fast-food joints and other quick-service restaurants in the metro San Jose area slowed in December 2012 and January 2013. That was after San Jose voters approved the measure in November 2012 but before the increase took effect in March 2013. Fast-food hiring in the region accelerated once the higher wage was in place. By early this year, the pace of employment gains in the San Jose area beat the improvement in the entire state of California. Nearly half of all minimum-wage workers are employed in food service.
What if Walmart paid employees enough to avoid food stamps? -- I enjoyed this video for sharp writing, clarity of data presentation, and measured tone. While still relying on economic markets for a thriving food economy, we nonetheless can expect our major grocery chains to do better on wages. No matter what one thinks of the proposed federal minimum wage increase, it is clear that the nation's leading employers should face binding social norms that constrain them to pay wages that reach a certain threshold. What should the threshold be? It is possible that some threshold would be too high, counter-productively putting grocery companies out of business. But, this video focuses on a much more humble and minimal threshold. At the very least, major grocery chains should pay wages sufficiently high to keep workers off the Supplemental Nutrition Assistance Program (SNAP) rolls.
New Alabama food truck regulations prevent local churches from feeding the homeless - Food truck regulations that went into effect on January 1, 2014 are preventing churches in Birmingham, Alabama from feeding the homeless. Minister Rick Wood of the Lords House of Prayer told ABC 3340 that police informed him that he would not be able to provide food for the homeless in Linn Park unless he owned a food truck and possessed a permit from the health department. “That makes me so mad,” Wood said. “These people are hungry. They’re starving. They need help from people. They can’t afford to buy something from a food truck.” Wood attempted to argue with the officers, claiming that the regulations only apply to trucks from which food is sold, but was told that the ordinances apply to all food vehicles, even ones which sport Matthew 25, 35-40 on their sides.
States Pursuing Cash That U.S. Companies Stash Overseas: Taxes - U.S. states are trying to capture corporate income taxes lost to offshore havens, wary of companies exploiting rules that let them channel cash abroad and weary of congressional inaction. Oregon enacted a bill for the 2014 tax year identifying 39 countries and territories as corporate shelters a decade after Montana passed the first such law. The Democrat-controlled Maine legislature gave initial approval this week to similar legislation over Republican objections that it was “anti-business,” and states including Minnesota and Rhode Island are considering or studying such measures. States have taken the lead on issues that a paralyzed Congress can’t or won’t address, such as raising the minimum wage and restricting guns. Now, they’re tackling international tax rules. Supporters say that besides generating additional money for public services, laws targeting tax havens help small businesses that can’t avoid the levies as multinationals can.
Common Core standards widen the opportunity gap - Elementary and middle schoolers in New York state sat for the second round of Common Core tests this week amid boycotts and protests from parents, teachers and principals. The Common Core is a set of academic standards in mathematics and English Language Arts (ELA) meant to prepare students for college and career success. Its advocates argue that such standards are crucial for establishing equal opportunity for all students. Its opponents worry that the Common Core gives early-grade students minimal exposure to subjects other than math and ELA. The key problem, however, is that the Common Core has the opposite effect of that intended — it widens the opportunity gap rather than narrowing it. Proponents of the Common Core standards consider its implementation a civil rights issue. In her book “The Flat World and Education,” Linda Darling-Hammond presents a powerful version of this view. America is founded on the principle of educational equality. In practice, however, there is an opportunity gap between the predominantly white wealthiest school districts and poorer districts with a sizable percentage of racial and ethnic minorities. National education standards, according to Darling-Hammond, increase the likelihood that children of every racial, ethnic and economic background will have access to a high-quality education.
Exclusive: Special Ed. Student Records Audio Proof of Bullying, Threatened With Charges of Warrentless Wiretapping - A South Fayette High School sophomore claims to have been bullied all year at his new school located in McDonald, Pennsylvania. In February, the student made an audio recording of one bullying incident during his special education math class. Instead of questioning the students whose voices were recorded, school administrators threatened to charge him with felony wiretapping before eventually agreeing to reduce the charge to disorderly conduct. On Wednesday, March 19, the student, who’s name we have agreed to not include in this story, was found guilty of disorderly conduct by District Judge Maureen McGraw-Desmet. Before the defendant was able to give a statement, McGraw said, “Normally, if there is — I certainly have a big problem with any kind of bullying at school. But normally, you know, I would expect a parent would let the school know about it, because it’s not tolerated. I know that, and that you guys [school administrators] would handle that, you know. To go to this extreme, you know, it was the only alternative or something like that, but you weren’t made aware of that and that was kind of what I was curious about. Because it’s not tolerated, but you need to go through — let the school handle it.
Tennessee teacher out of a job after taking sick student to ER and paying the bill - “No good deed goes unpunished.” Wait a minute, that doesn’t sound right. However, this was the reality for a Tennessee teacher named Jennifer Mitts, who says she was forced to resign from her post at Red Bank High School after she took an ill student to the emergency room and paid for the bill. Mitts footed the bill because the 20-year-old student did not have health insurance, according to an online petition supporting the teacher. Even though officials at the school say that they were only threatening to suspend the teacher for her caring deed, Mitts told WTVC-TV that school officials “dictated to (me) what (I) should write in the resignation letter, including forcing (me) to waive (my) right to a hearing.” Assistant superintendent of human resources for the district, Stacey Stewart, said that Mitts resigned on her own accord and that she was never forced to waive her rights. She also said that Mitts had been in trouble for a similar situation in the past. “It’s a liability issue,” said Stewart. “It’s an issue of insubordination after doing something you were officially warned not to do and doing it again.” HR officials state that a tenured teacher such as Mitts could only be fired for five reasons: insubordination, inefficiency, incompetence, neglect of duty and conduct unbecoming of a teacher. Stewart claims Mitts violated three of these policies.
Paid-For Legislature Takes Teacher Tenure From Thousands In Kansas -- Weekend, overnight exploits by purchased ideologues and rank amateurs in the Kansas State legislature stripped KS public school teachers of due process rights. This will require all teachers to renegotiate their contracts without any union or other support and make them subject to termination if they don’t. Or if administrators randomly feel like it, or are pressured to do so by rank amateurs, apparently. Local papers talked about it airily in distant terms, couching the breaking of thousands of teacher contracts in dismissive, second-hand terms. The Kansas City Star characterizes it as a solution to long intractable problems but still gives some substance of this evisceration, just farther down the column. More substance of the bill being sent to Governor’s desk came from Topeka Capitol Journal on Sunday. This article has Tim Carpenter managing to point out that the state supreme court had showed that the state legislature had failed to provide enough school funds to areas with a lower taxbase. So this bill is how the legislature responded. A rallying cry in the chamber apparently went up by the bill’s proponents of ‘What was so bad about state education before ‘Brown v Board of Education?’ as it was prepared for vote. This bill will take the state’s education system to a point prior to 1957 when teachers did not have tenure rights.
Alaska House adds money for education while issuing dire warnings about the future - After hours of debate, Alaska state representatives grudgingly voted for more money for Alaska schools, but also issued dire warnings about the future. In a session that ended Monday after midnight, the Alaska House voted 29-11 to pass House Bill 278, Gov. Sean Parnell's omnibus education bill. But now it bears only a passing resemblance to the bill he proposed at the session's start, when he dubbed 2014 the "education session.” But the bill could have been even more radical -- before passage, the full House stripped two last-minute additions from the House Finance Committee out of the bill -- but other controversial provisions remain. The first deleted provision would have slashed state spending on pension costs now, but shift huge costs to uncertain later years. The other would have given extra funding to big city schools with well-placed legislators.
Serious reading takes a hit from online scanning and skimming, researchers say - Claire Handscombe has a commitment problem online. Like a lot of Web surfers, she clicks on links posted on social networks, reads a few sentences, looks for exciting words, and then grows restless, scampering off to the next page she probably won’t commit to.But it’s not just online anymore. She finds herself behaving the same way with a novel. “It’s like your eyes are passing over the words but you’re not taking in what they say,” she confessed. “When I realize what’s happening, I have to go back and read again and again.” To cognitive neuroscientists, Handscombe’s experience is the subject of great fascination and growing alarm. Humans, they warn, seem to be developing digital brains with new circuits for skimming through the torrent of information online. This alternative way of reading is competing with traditional deep reading circuitry developed over several millennia. “I worry that the superficial way we read during the day is affecting us when we have to read with more in-depth processing,” said Maryanne Wolf, a Tufts University cognitive neuroscientist and the author of “Proust and the Squid: The Story and Science of the Reading Brain.” If the rise of nonstop cable TV news gave the world a culture of sound bites, the Internet, Wolf said, is bringing about an eye byte culture. Time spent online — on desktop and mobile devices — was expected to top five hours per day in 2013 for U.S. adults, according to eMarketer, which tracks digital behavior. That’s up from three hours in 2010.
Something To Keep An Eye On: College Enrollment Has Dropped Substantially Since 2012 --Here is some surprising and unpleasant news: enrollment rates have dropped in each of the last two years, a sharp divergence from several decades of growth. The figure below shows enrollment rates in the first quarter of every year since 1985 for people age 20-24. (Note: enrollment here is technically for college, university, or high school enrollment, but very few people age 20-24 are enrolled in high school.) Enrollment was on a general upward trend since 1985, but peaked in 2012 and has since dropped in each of the last two years. The fact that this is a two-year drop suggests that it isn’t just a one-year fluke in a volatile series. The dotted line shows the linear trend based on 1989-2007 data (the trend line since 2007 thus shows what enrollment rates would have been in the last seven years if they had simply continued on their long-run path over this period). The data are somewhat variable year-to-year, but this shows that between 2007 and 2013, there was no meaningful departure from the long term trend, but that by 2014, enrollment was substantially below the long-run trend. This drop in enrollment rates is worrisome, particularly to the extent that it is due to students being forced to drop out of school, or never enter, either because the lack of decent work in the weak recovery meant they could not put themselves through school or because their parents were unable to help them pay for school due to their own income or wealth losses during the Great Recession and its aftermath.
Higher education is spending more on athletics - From 2004 to 2011, community colleges’ inflation-adjusted educational spending — on instruction, public service and academic support — declined, while their athletic spending increased 35 percent per athlete, the report said. Overall spending per student grew 2.6 percent. Inflation-adjusted athletic spending also increased, by 24.8 percent, at public four-year colleges in all divisions in those years, while spending on instruction and academic support remained nearly flat, and public service and research expenditures declined, the report said. Their overall spending per student grew 1.6 percent. The fastest growth in athletic spending was at Division III schools without football programs, where median inflation-adjusted spending for each student-athlete more than doubled from 2004 to 2012. There is more here, by Tamar Lewin, interesting throughout.
Graduate Students on Strike -- This week, our union, United Auto Workers Local 2865, has called a system-wide strike in protest of unfair labor practices (ULPs) by the university. Although particular grievances differ from campus to campus, in aggregate, they concern the university’s unwillingness to bargain over key aspects of our employment, including class size and the number of terms (quarters, semesters) students are able to work. Also at issue is the university’s history of illegal intimidation of student workers. For example, this past November, an administrator at UCLA threatened overseas students with the loss of their visas for participating in a sympathy strike — a claim as insulting as it was untrue. The reasons for striking are serious, but also banal. By any measure, our labor is appallingly undervalued by the managers of the UC, its remuneration calibrated neither to the ballooning costs of living in present-day California nor to the wages of our peers at equivalent out-of-state universities. Nonetheless, many of us persist in believing that, no matter how untenable or degrading, our working conditions can always be tolerated, since they are only temporary, lasting no longer than our apprenticeships.
University students will be repaying loans into their 50s, say researchers -- The majority of undergraduates now at university will be paying off their student loans well into their 40s and 50s, with three-quarters of them unable to clear the debt before it is written off after 30 years, according to an analysis published on Thursday. The report by the Institute for Fiscal Studies and the Sutton Trust estimates that the average student will leave university more than £44,000 in debt. A middle-earning graduate will still owe about £39,000 at today's prices by the age of 40, and will still owe about £32,000 by 50. "For many professionals, such as teachers, this will mean having to find up to £2,500 extra a year to service loans at a time when their children are still at school and family and mortgage costs are at their most pressing," "We believe that the government needs to look again at fees, loans and teaching grants to get a fairer balance." In cash terms, the researchers estimate that graduates will now repay a total of £66,897 on average, equating in real terms to £35,446 on average in 2014 prices. Claire Crawford, one of the report's authors, said a perverse effect of the repayment scheme was that graduates who do less well in the labour market will end up paying back less than before, while middle and high earners will pay back much more. "The new higher education finance system will leave graduates with much more debt than before. But the effects of the changes will be quite different for different people and at different parts of their lives," she said.
Illinois’ next pension issue: Police, fire funds – After addressing Illinois’ own employee pension crisis, lawmakers now face an equally challenging task with the state’s cities, as mayors demand help with underfunded police and firefighter pensions before the growing cost “chokes” budgets and forces local tax increases. The nine largest cities in Illinois after Chicago have a combined $1.5 billion in unfunded debt to public safety workers’ pension systems. Police and fire retirement funds for cities statewide have an average of just 55 percent of the money needed to meet current obligations to workers and retirees. A bi-partisan legislative report in 2013 showed that funding levels for police and fire pensions outside Chicago dropped 20 percent between 1990 and 2010, although many are improving since the worst of the recent economic downturn. The problems – a history of underfunding, the expansion of job benefits and the prospect of crushing future payments – mirror those that Chicago Mayor Rahm Emanuel warned about when he asked the Legislature for relief last week.
Illinois Legislature OKs Chicago pension overhaul - State lawmakers on Tuesday approved Chicago Mayor Rahm Emanuel's proposal for overhauling two city pension programs that officials say could otherwise be out of money in little more than a decade.The Senate voted 31-23 in favor of the Democratic mayor's initiative shortly after the House backed it 73-41. The measure, which hinges on a $750 million property-tax increase over five years, now goes to Gov. Pat Quinn, who has been noncommittal.Resistance to the plan dissolved Monday night after House Speaker Michael Madigan, also a Chicago Democrat, removed language that mentioned the property-tax increase. Madigan's spokesman said his intent was to ensure that in the future, the earmarked revenue would not be diverted from paying down a $9.4 billion deficit over 40 years in the two funds, which cover 57,000 employees and retirees in the municipal workers and laborers' retirement accounts.The original wording had made lawmakers skittish, fearing that a vote for a bill that even mentioned the tax hike would point fingers of blame at them. Excising that phrasing brought "aye" votes from 23 House Republicans, who noted the distasteful vote but said it was necessary.Senate Republicans remained stubborn, asking why the city isn't presenting solutions for all five of its underfunded pension programs.
Rampant overtime spikes city employees’ pensions in Philadelphia: The City of Philadelphia has spent nearly $900 million in overtime during the past five years, partly as a strategy to keep costs down by hiring fewer full-time workers. But a Philly.com analysis shows the strategy is driving up pension payments to thousands of employees. Overtime has allowed unionized municipal employees to boost their yearly pay and to inflate, or “spike,” their pensions at a time when the city pension fund is less than half funded, according to the examination of 167,000 payroll records from the calendar years 2009 through 2013. The records were obtained from the city through a request using Pennsylvania's Right to Know law. Through overtime pay, a single employee can bring in hundreds of thousands of dollars in additional retirement income. Pensions are based on an employee’s three highest years of pay, excluding workers in the police and fire departments. Many city employees are logging almost superhuman amounts of hours, year after year, the analysis found. City officials say they look at departments’ overall overtime spending, though there appears to be little or no study of its short- or long-term effects on municipal finances.
Report: 85% of pensions could fail in 30 years: You might have thought your public pension was on shaky ground, but you're likely still being too kind. Influential and well-regarded hedge fund Bridgewater Associates Wednesday warns public pensions are likely to achieve 4% returns on their assets, or worse. If Bridgewater is right, that means 85% of public pension funds will be going bankrupt in three decades. Bridgewater came to these conclusions by stress testing the nation's public pension plans, much the way banks need to be evaluated on what could happen given a wide range out outcomes. Public pensions have just $3 trillion in assets to invest to cover future retirement payments of $10 trillion over the next many decades, Bridgewater says. An investment return of roughly 9% a year is needed to meet those onerous obligations. Many pension observers make the claim pensions will achieve 7% to 8% returns. But even if that assumption is correct, which is unlikely, public pensions are looking at a 20% shortfall, Bridgewater says. A 4% return is much more likely, the firm says.
85% of Pension Funds to Fail in Three Decades -- Bridgewater Associates did an analysis of pension funds recently and concluded 85% of them will fail if returns average 4%. Bridgewater notes that public pensions have just $3 trillion in assets to invest to cover future retirement payments of $10 trillion over the next many decades. It would take an investment return of roughly 9% a year to meet those obligations. With the 30-Year long bond yielding a mere 3.5% and with stock valuation through the roof, I expect negative returns for 7-10 years. Stretched out over 30 years, 4% seems about right. 9% is out of the question. CNBC has further analysis in Report: 85% of pensions could fail in 30 years Bridgewater Associates Wednesday warns public pensions are likely to achieve 4% returns on their assets, or worse. If Bridgewater is right, that means 85% of public pension funds will be going bankrupt in three decades. Bridgewater came to these conclusions by stress testing the nation's public pension plans, much the way banks need to be evaluated on what could happen given a wide range out outcomes. Many pension observers make the claim pensions will achieve 7% to 8% returns. But even if that assumption is correct, which is unlikely, public pensions are looking at a 20% shortfall, Bridgewater says. A 4% return is much more likely, the firm says. Bridgewater set up a sophisticated model to simulate many of the possible market environments to see how they would affect public pension's resources. In 20% of those scenarios, public pensions run out of money in 20 years. And in 80% of the scenarios, public pensions run out of money within 50 years, Bridgewater says.
Correcting the Record on Another Misleading CalPERS Press Release - Yves Smith -- An alert reader sent me a link to a CalPERS press release, dated March 14, before the one we rebutted in the post CalPERS Tries Ineffective Mudslinging in Response to Our Ongoing Private Equity Investigation This earlier press release was not as consequential, so we decided to wait till the weekend to address it. This press release, Naked Capitalism Gets it Wrong and Should Choose Words Wisely, is in response to our post, Has CalPERS’ General Counsel Lied to Its Board About Our Suit? It’s worth noting that the intended audience for this press release was likely to be CalPERS board, and not the general public. We had sent letters to board members on February 28 outlining multiple procedural irregularities in the handling of our Public Records Act request (California’s version of FOIA) that should concern them. But it was presumably also intended for me, since the headline’s “Should Chose Its Words Wisely” is a not-too-thinly veiled threat of litigation. The press release claims that they received service on my suit too late to have included it in the mailing to the board for its meeting March 19. CalPERS was served on March 4. A CalPERS employee has told us that it is likely that they did not mail the materials to the board until March 7, so our belief that CalPERS could have informed its board in writing but chose not to is thus credible.
1% Of US Doctors Account For Over $10 Billion Of Medicare Billings - The top 1% of 825,000 individual medical providers accounted for 14% of the $77 billion in medicare billing in 2012, according to new federal data reported by the WSJ. The data shows a very small number of doctors and medical providers account for a huge amount of the costs for treating the elderly and, as WSJ notes, suggest in some cases, may be enriching themselves in the process. As Bloomberg notes, one doctor, who treats degenerative eye disease in seniors, was paid $21 million (twice the 2nd highest paid doctor on the list) with some top earners making 100 times the average for their respective fields. One researcher summed it up, "There's all sorts of services that are low-value for patients, high-revenue to providers," and leaves us wondering, once again, how the government will manage as Obamacare's "success" washes ashore.
Political Ties of Top Billers for Medicare - Two Florida doctors who received the nation’s highest Medicare reimbursements in 2012 are both major contributors to Democratic Party causes, and they have turned to the political system in recent years to defend themselves against suspicions that they may have submitted fraudulent or excessive charges to the federal government.The pattern of large Medicare payments and six-figure political donations shows up among several of the doctors whose payment records were released for the first time this week by the Department of Health and Human Services. For years, the department refused to make the data public, and finally did so only after being sued by The Wall Street Journal. Topping the list is Dr. Salomon E. Melgen, 59, an ophthalmologist from North Palm Beach, Fla., who received $21 million in Medicare reimbursements in 2012 alone. The doctor billed a bulk of his reimbursements for Lucentis, a medication used to treat macular degeneration made by a company that pays generous to its doctors. Dr. Melgen’s firm donated more than $700,000 to Majority PAC, a super PAC run by former aides to the Senate majority leader, Harry Reid, Democrat of Nevada. The super PAC then spent $600,000 to help re-elect Senator Robert Menendez, Democrat of New Jersey, who is a close friend of Dr. Melgen’s. Last year, Mr. Menendez himself became a target of investigation after the senator intervened on behalf of Dr. Melgen with federal officials and took flights on his private jet. Another physician, Dr. Asad Qamar, an interventional cardiologist in Ocala, Fla., has sent at least $250,000 in donations over the last decade to the political campaigns of President Obama and other prominent Democrats; Dr. Qamar was paid more than $18 million in 2012, making him and Dr. Melgen by far the largest payment recipients nationwide, according to the data.
The top 10 Medicare billers explain why they charged $121M in one year - Looking at the top Medicare billers in today's massive data dump, the big dollar amounts are hard to ignore. (Full data here). The top 10 doctors alone received a combined $121.4 million for Medicare Part B payments in 2012. But not all of these doctors are pocketing millions. A clear trend emerges from the data and from interviews with these physicians: The high cost of drugs is a huge driver of the robust Medicare payouts. Indeed, slightly more than half of the Medicare payments to these 10 doctors — $61.9 million in total — went toward drugs and "other costs." Some doctors said they were just passing through the payment to drug companies. But the Medicare payment system also incentivizes physicians to choose more expensive drugs, since they’re reimbursed for the average price of the drug plus 6 percent. In the interviews, the doctors also said there was much more behind the numbers. Some said they were unfairly singled out even though they were billing for an entire practice. Others disputed the accuracy of Medicare data. To be sure, there appears to be fraud going on as well. As the Washington Post reported Wednesday morning, federal investigators have scrutinized payment to three of the top 10 earners. One faces federal fraud charges.
Obamacare Enrollment Heads for 17 million - Charles Gaba, who has become the “Nate Silver” for Obamacare enrollment numbers; now predicts that by April 15, 17 million Americans will have purchased their own healthcare coverage. His back-of-the-envelope estimate includes “a nice round 8 million” who buy policies in the government marketplaces. In parentheses, he suggests: Perhaps a little higher (1M even?) and then strikes that thought; “As always,” he notes, “I’ll be more than happy to be proven wrong, as long as I’ve undershot the mark.” Gaba then adds roughly 9 million who, (according to a Rand Corp. survey), have bought their own policies directly from insurers, instead of using the Exchanges. Nine million plus 8 million brings us to an astounding number: 17 million. Rand shared its analysis with the LA. Times, though it has not yet released its report. Obamcare’s skeptics scoff at Rand’s number; but, Gaba points out the Blue Cross and Blue Shield Association alone have confirmed its member plans have enrolled at least 1.7 million people in plans that meet the ACA’s requirements outside the exchange system. Gaba acknowledges “Rand didn’t come out and say that the 9M figure was absolute; they just based it on a survey with percentages. Surveys include margins of error, so it could be only 8M, or perhaps 10M, or maybe a bit higher or lower.” Gaba has gained his reputation by being meticulous—and cautious. Typically, his estimates have been conservative. Given that track record, my guess is that by April 15, we will find that at least 17 million Americans have bought their own policies. At this point, you may be wondering: But don’t we need the roughly 9 million Americans who are purchasing policies directly from insurers to join the state marketplaces in order to spread the cost of Exchange coverage among as many people as possible? The answer is “No.”
Three Legs Good, One Leg Bad - Paul Krugman - Gaba, the Rand Survey — which was the subject of a report in the LA Times, but which wasn’t publicly available — is now in. And it says that as of mid-March — that is, before the final enrollment surge — the Affordable Care Act had already produced a net gain of 9.3 million insured adults. Again, that’s a net gain; so much for claims that more people are losing insurance than gaining it. At least some Republicans are realizing that (a) the ACA is not going to collapse and (b) they can’t simply take away insurance from millions of Americans. So they have to come up with an alternative. And as Sahil Kapur reports, at least a few of them are coming to a terrible realization: there is no alternative. You can’t just support the popular pieces of reform, in particular coverage for preexisting conditions, and scrap the rest. As Jonathan Gruber taught me, and I and others have said many times, reform is a three-legged stool that requires community rating, the individual mandate, and subsidies; take away any leg and it collapses. And Kapur finds a GOP aide who admits to the awful truth: any workable GOP plan would look pretty much the same as Obamacare. I don’t know how many GOP leaders, as opposed to aides, understand this. And even those who do won’t dare to admit it. The party line, literally, has been that Obamacare is an unworkable monstrosity, and the base will destroy anyone who points out, this late in the game, that it’s both workable and pretty much the only doable alternative to single-payer.
Obamacare: 9.3 million & counting — Thom discusses the new Obamacare numbers with the Roosevelt Institute’s Richard Kirsch and The Franklin Forum’s Sarah Studley and tonight’s Lone Liberal Rumble discusses the Comcast-Time Warner merger, the filibustering of equal pay legislation by Senate Republicans and why Washington and the mainstream media are ignoring the progressive caucus’ budget. In Daily Take, Thom discusses what global warming deniers and the tobacco industry have in common.
RAND Comes Clean: Obamacare’s Exchanges Enrolled Only 1.4 Million Previously Uninsured Individuals -- Last week, I wrote about an article in the Los Angeles Times, on a then-as-yet unpublished report from the RAND Corporation. The report indicated that only one-third of Obamacare’s purported 7.1 million exchange sign-ups were from the previously uninsured. But Noam Levey, the author of the Times article, didn’t disclose RAND’s actual findings as to the actual number of previously uninsured exchange enrollees. Well, now we know why. RAND published the full report yesterday; it indicates that Obamacare’s exchanges only enrolled 1.4 million previously uninsured individuals. That 1.4 million is out of a total of 3.9 million exchange enrollees overall. That is to say, a little over a third of enrollees—36 percent—were previously uninsured. RAND’s figures don’t take into account the last few weeks of the Obamacare open enrollment period, and they contain a substantial margin of error, due to the study’s small sample size. (RAND surveyed 2,425 individuals aged 18 to 64; the 1.4 million figure has a margin of error of 700,000, meaning that there is a 95 percent probability that the actual number is between 700,000 and 2.1 million previously uninsured enrollees.)
How Many of Obamacare’s New Enrollees Were Uninsured Last Year? Why It Doesn’t Matter - As I explain in an earlier post, Charles Gaba, the enrollment guru who has been tracking Obamacare sign-ups since October, now estimates that by April 15, some 17 million Americans will have purchased their own insurance policies either in the Obamacare Exchanges (8 million) or off-Exchange (9 million) But how many of them were uninsured and how many were simply replacing policies that the Affordable Care Act (ACA) had forced insurers to cancel? This is the question conservatives ask. After all they argue, if most of these folks already had coverage, we have just wasted a great deal of time and money moving them from a policy they chose to one that President Obama prefers. There are two answers to their question. The first is that while we don’t have an exact number as to how many of the new enrollees were uninsured, we do know (thanks to Obamcare), the percent of Americans who are “going naked” has declined. Gaba offers a second, even better, answer: “It doesn’t really matter.” I agree. As he explains: “It doesn’t matter because every one of those new policies–whether on-exchange or off-exchange; whether it went to someone who didn’t have insurance before, someone who had their old policy cancelled or went to someone who voluntarily made the switch to a new one…which . . is a LOT of people, by the way…is still a fully ACA-compliant, full-coverage healthcare plan.”
The Power of Sebelius - In setting the 2015 calendar parameters for health plans and employers, Kathleen Sebelius, the secretary of health and human services, quietly did some creative but questionable arithmetic that forced taxpayers to give still more help to businesses and people who buy health insurance. Specifically, the Affordable Care Act says that in each year after 2014, the employer penalty and cost-sharing parameters will exceed the value they have in 2014 by a percentage equal to the “premium adjustment percentage,” which is “the percentage (if any) by which the average per capita premium for health insurance coverage in the United States for the preceding calendar year (as estimated by the secretary no later than Oct. 1 of such preceding calendar year) exceeds such average per capita premium for 2013 (as determined by the secretary).” The “secretary” refers to the secretary of the Department of Health and Human Services, currently Ms. Sebelius. But a political problem arises in that a premium increase that averages, say, 40 percent would require a 40 percent increase in the caps on what individuals with coverage can be asked to pay for their own medical expenses and increase the employer penalty by 40 percent (above what it would have been had it been enforced in 2014). Among other things, the salary equivalent of the employer penalty next year, with a 40 percent premium adjustment percentage, would be almost $4,300 per employee per year. To make matters (politically) worse, the increase in premiums from 2013 to 2014 is likely to be permanent, because the new rules on minimum benefits are permanent (as the law now stands). In other words, an increase in caps and penalties next year would be likely to last long into the future. The Department of Health and Human Services needed a way to measure the average premium for health insurance without acknowledging what is actually happening to health insurance premiums.
Obamacare Is Widening the Gap Between “Red” and “Blue” America - The fact that the citizens of “red” and “blue” states live in what are essentially two countries with very different governments has largely flown under the radar, but it may become the defining story of our time. The two major parties are not only highly polarized ideologically, but as Dan Balz noted in The Washington Post, “polarization has ushered in a new era in state government, where single-party control of the levers of power has produced competing Americas.” Three-quarters of US states are now controlled by one of the two major parties — the most in 60 years — and “officials in these states are moving unencumbered to enact their party’s agenda.”When the Supreme Court ruled that states could decline Obamacare’s Medicaid expansion without facing a penalty, the justices set in motion a process that’s now pushing our two countries even further apart as about half of the states passed on the opportunity to insure their poorer residents.The overall numbers are in, and for all its warts, Obamacare appears to have extended insurance coverage to about ten million people who didn’t have it before. (The precise number varies from study to study, but as Josh Marshall of Talking Points Memo points out, they’re all in the same ballpark.) According to Gallup, the share of Americans who lack health insurance has fallen to the lowest level since before the Great Recession began. But the Urban Institute offers a fascinating finding: The rate of uninsured is now almost 50 percent higher in states that refused the Affordable Care Act’s (ACA) Medicaid expansion (18.1 percent) than in those that embraced the policy (12.4 percent). This chart tells the story:
Affordable Care Act Making Health Insurance Less Affordable -- Contrary to its name and the arguments made by its proponents both when the bill was being debated in 2009 and 2010 and in the time since then, the President’s signature piece of legislation appears to be making health insurance more expensive for a wide swath of the population: Health insurance premiums are showing the sharpest increases perhaps ever according to a survey of brokers who sell coverage in the individual and small group market. Morgan Stanley’s healthcare analysts conducted the proprietary survey of 148 brokers. The April survey shows the largest acceleration in small and individual group rates in any of the 12 prior quarterly periods when it has been conducted.The average increases are in excess of 11% in the small group market and 12% in the individual market. Some state show increases 10 to 50 times that amount. The analysts conclude that the “increases are largely due to changes under the ACA.”The analysts conducting the survey attribute the rate increases largely to a combination of four factors set in motion by Obamacare: Commercial underwriting restrictions, the age bands that don’t allow insurers to vary premiums between young and old beneficiaries based on the actual costs of providing the coverage, the new excise taxes being levied on insurance plans, and new benefit designs.The prior survey conducted in January also showed rates rising during the fall of 2013, but the new increases will come on top of those hikes and are even sharper. That prior survey of 131 brokers found that December 2013 rates were rising in excess of 6% in the small group market, and 9% in the individual market.
Because Of ObamaCare, Uninsured People Won’t Be Able To Buy Health Insurance Until November -- The Associated Press reports on another unanticipated consequence of the Affordable Care Act, the fact that you probably won’t be able to buy health insurance until November if you don’t have it already: Americans thinking about buying health insurance on their own later this year, or maybe switching to a different insurer, are probably out of luck. The policies are going off the market as a little-noticed consequence of President Barack Obama’s health care overhaul.With limited exceptions, insurance companies have stopped selling until next year the sorts of individual plans that used to be available year-round. That locks out many of the young and healthy as well as the sick and injured, even those who can afford to buy without government subsidies. “Now they’re stuck,” said Bonnie Milani, an independent insurance broker in Los Angeles, who says she warned her customers last year that the change was coming. “It just closes everything down.”
Fully Raw Cannibals and My Obamacare Nightmare - riverdaughter - I am not a Republican. I don’t hate Obamacare because it is a government program that saps “freedom” (aka tax money) from Jahb Creaturz. No, I am in favor of a national health care policy that uses the best practices that other industrialized countries have put in place. You know, universal mandates for individuals AND employers, cost controls on the medical industry, public options. I was brought up on military medicine and if it was good enough for my sister with chronic severe asthma, by golly, it’s good enough for me. I don’t need frills.Anyway…I recently attended a younger cousin’s birthday party. My relatives sat around and compared plans. This group was a mix of ages, employment situations, number of dependents, personal wealth. The bad news for the Democrats is that no one likes Obamacare. Not one of them. In Pittsburgh, the effect of Obamacare is pronounced because two major insurance carriers in the region are battling and one of them, UPMC, refuses to contract with Highmark BC/BS. That leaves Highmark customers scrambling to find new doctors and praying that if they do have an emergency, they don’t get carted off to one of the ubiquitous UPMC hospitals where they will get socked with a massive out of network price structure. They played nicely before Obamacare but no more. The problem of insurance plans is particularly acute for those of us who fall into the precariat class and Obamacare falls severely short there. Let me explain from my own experience.
Obamacare's next obstacle: Confusion as people use it - Obama administration officials hoping to exhale after the big finish to Obamacare’s first enrollment season may need to hold their breath a while longer. All the confusion and mixed messages out there are bound to combust if people decide they were misled — an echo of the “you can keep your plan if you like it” fiasco. Some of the missed points and mixed-up details could bite the administration almost immediately as people start using their new plans and blame surprises on the White House. Other lingering public misconceptions could feed Republican attacks through the November midterm elections. Here are six big danger points. Coverage of pre-existing conditions was a big selling point of the law, but not everyone realizes that they can’t just sign up the minute a condition is diagnosed. The regular dates and deadlines for enrolling still apply, no matter when you get appendicitis. Yet 6 in 10 uninsured Americans didn’t know March 31 was the cutoff for getting 2014 coverage, according to a Kaiser Family Foundation poll last month. They didn’t know that missing the deadline meant they’d be locked out until November (unless they’re eligible for Medicaid, which has no such restriction.) “Since they don’t even know that there’s a deadline, I don’t think that they could know the next step, which is that they can’t enroll for the rest of the year,” said Mollyann Brodie, executive director of public opinion and survey research at Kaiser. “It’s going to be a shock, and we are going to be fielding a lot of calls,” said Michael Mahoney, a senior vice president with the online insurance broker GoHealth. “But there’s not much you can do to help.”
FDA Approves At-Home Heroin Overdose Kit - With deaths from heroin and prescription painkiller overdoses now a full-swing American epidemic, the federal government has taken steps towards preventing drug fatalities by approving an at home overdose antidote. Earlier this week, the Food and Drug Administration approved a device called Evzio, which reverses the effects of an opioid overdose and revives drug users before they drift off into the eternal nod. Evzio works by allowing a person to inject the drug “naloxone” into an unresponsive opioid abuser in order to counteract the slowed-down breathing that often leads to death. Medical personnel have used naloxone for years, but now family members, friends and even junkies themselves will be able to keep the life-saving medication on hand in case of an overdose emergency. Administering the drug is not quite a traumatic as having to give someone an adrenalin shot through his or her breastplate and into the heart; Evzio is simply injected under the skin or into the muscle. But a prescription will be required, according to the FDA. Recent statistics from the Centers of Disease Control and Prevention indicate there were over 16,000 deaths in 2010 as the result of opioid overdoses, with prescription painkillers being the primary culprit. So, it stands to reason that a large percentage of overdose fatalities could quite possibly be starved off with the advent of this medication in homes across the country.
US jury hits Takeda, Eli Lilly with $9B penalty - A U.S. jury ordered Japanese drugmaker Takeda Pharmaceutical Co. and its U.S. counterpart, Eli Lilly and Co., to pay $9 billion in punitive damages over a diabetes medicine linked to cancer. The drug companies said Tuesday they will "vigorously challenge" the decision. The U.S District Court in western Louisiana ordered a $6 billion penalty for Takeda and $3 billion for its business partner and co-defendant Eli Lilly. It also ordered $1.5 million in compensatory damages in favor of the plaintiff. The legal fight turned on whether Actos, which is a drug used to treat type-two diabetes, caused a patient's bladder cancer and by implication was responsible for other cases of the cancer. Takeda and Eli Lilly are facing numerous other lawsuits over the drug, which allege failure to warn about side effects and concealment of its health risks.
Tamiflu: Millions wasted on flu drug, claims major report: Hundreds of millions of pounds may have been wasted on a drug for flu that works no better than paracetamol, a landmark analysis has said. The UK has spent £473m on Tamiflu, which is stockpiled by governments globally to prepare for flu pandemics. The Cochrane Collaboration claimed the drug did not prevent the spread of flu or reduce dangerous complications, and only slightly helped symptoms. The manufacturers Roche and other experts say the analysis is flawed. Tamiflu was stockpiled from 2006 in the UK when some agencies were predicting that a pandemic of bird flu could kill up to 750,000 people in Britain. Similar decisions were made in other countries. Hidden data The drug was widely prescribed during the swine flu outbreak in 2009. Drug companies do not publish all their research data. This report is the result of a colossal fight for the previously hidden data into the effectiveness and side-effects of Tamiflu. It concluded that the drug reduced the persistence of flu symptoms from seven days to 6.3 days in adults and to 5.8 days in children. But the report's authors said drugs such as paracetamol could have a similar impact. On claims that the drug prevented complications such as pneumonia developing, Cochrane suggested the trials were so poor there was "no visible effect".
Tamiflu: drugs given for swine flu 'were waste of £500m' - The drug Tamiflu, given to tens of thousands of people during the swine flu pandemic, does nothing to halt the spread of influenza and the Government wasted nearly £500 million stockpiling it, a major study has found. The review, authored by Oxford University, claims that Roche, the drug’s Swiss manufacturer, gave a “false impression” of its effectiveness and accuses the company of “sloppy science”. The study found that Tamiflu, which was given to 240,000 people in the UK at a rate of 1,000 a week, has been linked to suicides of children in Japan and suggested that, far from easing flu symptoms, it could actually worsen them. Roche claimed at the time of the 2009 swine flu outbreak that trials had shown that it would reduce hospital admissions and complications such as pneumonia, bronchitis or sinusitis. Based on the results, the Department of Health bought around 40 million doses of Tamiflu at a cost of £424 million and prescribed it to around 240,000 people. In 2009, 0.5 per cent of the entire NHS budget was spent on the drug.
Idea of New Attention Disorder Spurs Research, and Debate - With more than six million American children having received a diagnosis of attention deficit hyperactivity disorder, concern has been rising that the condition is being significantly misdiagnosed and overtreated with prescription medications.Yet now some powerful figures in mental health are claiming to have identified a new disorder that could vastly expand the ranks of young people treated for attention problems. Called sluggish cognitive tempo, the condition is said to be characterized by lethargy, daydreaming and slow mental processing. By some researchers’ estimates, it is present in perhaps two million children.Experts pushing for more research into sluggish cognitive tempo say it is gaining momentum toward recognition as a legitimate disorder — and, as such, a candidate for pharmacological treatment. Some of the condition’s researchers have helped Eli Lilly investigate how its flagship A.D.H.D. drug might treat it. The Journal of Abnormal Child Psychology devoted 136 pages of its January issue to papers describing the illness, with the lead paper claiming that the question of its existence “seems to be laid to rest as of this issue.” The psychologist Russell Barkley of the Medical University of South Carolina, for 30 years one of A.D.H.D.’s most influential and visible proponents, has claimed in research papers and lectures that sluggish cognitive tempo “has become the new attention disorder.”
Scientists Grow Human Brain From Stem Cells -- Ear, eye, liver, windpipe, bladder and even a heart. The list of body parts grown from stem cells is getting longer and longer. Now add to it one of the most complex organs: the brain. A team of European scientists has grown parts of a human brain in tissue culture from stem cells. Their work could help scientists understand the origins of schizophrenia or autism and lead to drugs to treat them, said Juergen Knoblich, deputy scientific director at the Institute of Molecular Biotechnology of the Austrian Academy of Sciences and one of the paper's co-authors. The advance could also eliminate the need for conducting experiments on animals, whose brains are not a perfect model for humans. To grow the brain structures, called organoids, the scientists used stem cells, which can develop into any other kind of cell in the body. They put the stem cells into a special solution designed to promote the growth of neural cells. Bits of gel interspersed throughout the solution gave the cells a three-dimensional structure to grow upon. In eight to 10 days, the stem cells turned into brain cells. After 20 days to a month, the cells matured into a size between three and four millimeters, representing specific brain regions such as the cortex and the hindbrain.
U.S. Bacon Prices Rise After Virus Kills Baby Pigs — A virus never before seen in the U.S. has killed millions of baby pigs in less than a year, and with little known about how it spreads or how to stop it, it’s threatening pork production and pushing up prices by 10 percent or more. Estimates vary, but one economist believes case data indicate more than 6 million piglets in 27 states have died since porcine epidemic diarrhea showed up in the U.S. last May. A more conservative estimate from the U.S. Department of Agriculture shows the nation’s pig herd has shrunk at least 3 percent to about 63 million pigs since the disease appeared. Scientists think the virus, which does not infect humans or other animals, came from China, but they don’t know how it got into the country. The federal government is looking into how such viruses might spread, while the pork industry, wary of future outbreaks, has committed $1.7 million to research the disease. The U.S. is both a top producer and exporter of pork, but production could decline about 7 percent this year compared to last — the biggest drop in more than 30 years, according to a recent report from Rabobank, which focuses on the food, beverage and agribusiness industries. Already, prices have shot up: A pound of bacon averaged $5.46 in February, 13 percent more than a year ago, according to the U.S. Bureau of Labor Statistics. Ham and chops have gone up too, although not as much.
Corporate Clout Chips Away at Organic Standards: The Organic Consumers Association has a long history of defending the integrity of organic standards. Last September, the U.S. Department of Agriculture (USDA), under pressure from corporate interests represented by the Organic Trade Association, made our job harder. They also made it more important than ever for consumers to do their homework, even when buying USDA certified organic products. Without any input from the public, the USDA changed the way the National Organic Standards Board (NOSB) decides which non-organic materials are allowed in certified organic. The change all but guarantees that when the NOSB meets every six months, the list of non-organic and synthetic materials allowed in organic will get longer and longer. The USDA’s new rule plays to the cabal of the self-appointed organic elite who want to degrade organic standards and undermine organic integrity. For consumers, farmers, co-ops and businesses committed to high organic standards, the USDA’s latest industry-friendly move is a clarion call to fight back against the corporate-led, government-sanctioned attack on organic standards.
Legislation would ban state GMO labeling measures: A bill introduced Wednesday would put the federal government in charge of overseeing the labeling of foods with genetically modified ingredients, preventing states from enacting their own requirements to regulate the controversial ingredients. The legislation, known as the Safe and Accurate Food Labeling Act, would require the Food and Drug Administration to review the safety of a product before it enters the marketplace, putting into law a process that is currently voluntary but widely used by food companies. The health agency would require mandatory labeling on food with genetically modified ingredients if they are found to be unsafe or materially different from foods produced without biotech ingredients. Manufacturers could still label their foods as being made without these specially engineered crops. This bill "prevents a mishmash of labeling standards and allows farmers to continue to produce higher yields of healthy crops in smaller spaces with less water and fewer pesticides," said Rep. G.K. Butterfield, D-N.C., who drafted the measure along with Rep. Mike Pompeo, a Kansas Republican. "If passed, this will be a big win for farmers nationwide." But consumer groups vowed to fight the legislation, which they see as an attempt to undermine efforts to pass state ballot initiatives mandating labeling of most products with genetically modified ingredients. In the United States, up to 80% of packaged foods contain ingredients that have been genetically modified. Agricultural and food producers praised the legislation and said it would provide certainty to their members by establishing a uniform set of food labeling guidelines.
World’s #1 Herbicide Discovered in U.S. Mothers’ Breast Milk - In the first ever testing on glyphosate herbicide in the breast milk of American women, Moms Across America and Sustainable Pulse have found 'high' levels in 3 out of the 10 samples tested. The shocking results point to glyphosate levels building up in women's bodies over a period of time, which has until now been refuted by both global regulatory authorities and the biotech industry.The levels found in the breast milk testing of 76 ug/l to 166 ug/l are 760 to 1600 times higher than the European Drinking Water Directive allows for individual pesticides. They are however less than the 700 ug/l maximum contaminant level (MCL) for glyphosate in the U.S., which was decided upon by the U.S. Environmental Protection Agency (EPA) based on the now seemingly false premise that glyphosate was not bio-accumulative. Glyphosate-containing herbicides are the top-selling herbicides in the world and are sold under trademarks such as Monsanto's 'Roundup'. Monsanto's sales of Roundup jumped 73 percent to $371 million in 2013 because of its increasing use on genetically engineered crops (GE Crops). The glyphosate testing (1) commissioned by Moms Across America and Sustainable Pulse also analyzed 35 urine samples and 21 drinking water samples from across the US and found levels in urine that were over 10 times higher than those found in a similar survey done in the EU by Friends of the Earth Europe in 2013.
China’s Milk Demand Squeezes Global Supply - China’s voracious appetite for dairy products has pushed prices for milk up worldwide, impacting importers as far away as North Africa and Latin America. Countries like Algeria and Venezuela have cut back on dairy imports as prices have risen, raising the possibility of shortages. “Markets outside of China just can’t afford to pay the price that the Chinese economy can absorb,” said Michael Harvey, a dairy analyst at Rabobank. High prices “have been an issue for nearly 12 months now…a number of markets are getting squeezed out. China’s appetite for milk creates a global shortage.” For Algeria, a nation of almost 40 million people, the issue is politically sensitive ahead of presidential elections on April 17. Algeria is one of the largest powdered milk importers in the world. Last year, it spent $1 billion on milk powder imports, a business largely controlled by the government. The state heavily subsidizes the sale of reconstituted milk, which is sold in lower-cost plastic bags, rather than cartons and bottles used more commonly in the rest of the world. As the government has pared its buying on global markets, less cheap milk is available for Algerians. Rabobank says the decreased imports have contributed to milk shortages. U.S. Dairy Export Council data shows the volume of Algerian dairy product imports has fallen for two consecutive years, decreasing 10.9% in 2013 from 2012. Venezuela cut its dairy imports by 19% on year in the period through November. The situation could improve in the months ahead. Dairy prices have fallen to year lows recently due to increased supply from New Zealand, bringing some relief.
USDA estimates that 31% of the food supply is lost and uneaten - A new report from USDA's Economic Research Service finds: In the United States, 31 percent—or 133 billion pounds—of the 430 billion pounds of the available food supply at the retail and consumer levels in 2010 went uneaten. The estimated value of this food loss was $161.6 billion using retail prices. For the first time, ERS estimated the calories associated with food loss: 141 trillion in 2010, or 1,249 calories per capita per day.
Northern Europe hit by most bee deaths - A new study covering 17 EU countries says that far more honeybees are dying in the UK and other parts of northern Europe than in Mediterranean countries. The European Commission says it is Europe's most comprehensive study so far of bee colony deaths. Winter mortality was especially high for bees in Belgium (33.6%) and the UK (29%) in 2012-13. But in spring-summer 2013 France was highest with 13.6%. Bumblebees and other wild bees were not studied, nor were pesticide impacts. The study, called Epilobee, described 10% as an acceptable threshold for bee colony mortality - and Greece, Italy and Spain were among the countries with rates below that threshold. The mortality percentages are national estimates based on representative samples. All 17 countries applied the same data collection standards, the report says. The survey covered almost 32,000 bee colonies. But there is also much concern about death rates among wild bees, which are vital pollinators too. Last year the EU introduced a ban on four chemicals called neonicotinoids which are used in pesticides. They are believed to be linked to the collapse of bee colonies across Europe, though there is a heated scientific debate over the chemicals' impact and many experts say further studies are needed.
Central California is Sinking as Groundwater is Depleted - Parts of California's central valley are sinking, the Sacramento Bee reports, as farmers faced with drought and water sources cut off to protect the Delta smelt are pumping out deep groundwater to save their crops. The situation is serious enough that even some farmers are calling for new regulations on groundwater usage. It's called subsidence, and it happens when farmers desperate for water dig deep wells into clay aquifers. As the water is pumped out the press of earth above compresses the clay. The land sinks and the compressed clay can not hold as much water as it once did. Once subsidence happens there is no way to undo it. Michelle Sneed, who studies subsidence for the U.S. Geological Survey, authored a study in 2013 which found that 1,200 square miles of the Central Valley were sinking half-an-inch per year. But the rate is not consistent everywhere. The town of El Nido, CA just south of Merced sank almost a foot a year between 2008 and 2010. "A foot a year is not sustainable. You can’t really mitigate against a foot a year," Sneed told the Bee. Sneed's job is made more difficult by the fact that the state does not collect information on the amount of water being pumped out of California's deep aquifers. Counties do approve wells but do not monitor them. Tim Parker of the Groundwater Resources Association of California (GRAC), an associations of scientists in the field, told the Bee: "You have to require that these big pumpers measure and report to the local agencies."
Inflation Watch: Global Food Disruptions, Commodity Prices Soar --According to the latest monthly report issued by the Organization for Economic Cooperation and Development, global inflation has been relatively tame, with consumer prices rising just 1.4 percent in its 34 member countries through February. That’s a slight moderation from January’s reading of 1.7 percent and essentially mirrors the situation here in the U.S., where inflation ticked up by just 1.1 percent last month. But while the overall global inflation trend is currently flat to down, if you drill into specific inflationary components you’ll see a very different picture. The graph below shows the CRB/BLS Foodstuffs Index which tracks the spot price of 10 agricultural commodities; butter, cocoa, corn, hogs, lard, soybean oil, sugar, Minneapolis wheat and Kansas City Wheat. Since touching a 1-year low on December 19, the index has shot up by nearly 21 percent to a new 1-year high. A separate foodstuffs index tracked by the American Farm Bureau Federation showed a 3.5 percent year-over-year increase in March, largely thanks to double-digit increases in the price of bacon and ground chuck while basics such as bread, milk and eggs also posted gains in the high single-digits. According to the Department of Agriculture, food prices here in the U.S. are expected to increase by between 2.5 percent to 3.5 percent this year. If they do break the 3 percent mark, it will likely be the largest increase since 2011 and more than double last year’s 1.4 percent rise. The rising cost of food isn’t an isolated U.S. problem. The United Nation’s Food and Agriculture Organization’s global food price index showed a big 2.3 percent year-over-year swing in March, hitting the highest level in nearly a year. If you drill down, the price of grains alone soared 5.2 percent to their highest cost since August. Sugar posted the largest increase of 7.9 percent with dairy prices being the only one to show a decrease in the month.
How Climate Change Can Make Food Less Nutritious - A new field test by researchers in California appears to confirm that humanity’s carbon dioxide emissions could decrease the nutritional value of crops, further threatening future food security. Over the last two decades, agricultural research facilities in the United States and around the world have been running experiments in which a set up of pipes in a crop field pumps out carbon dioxide. . The new study — done by researchers out of the University of California at Davis — took preserved wheat samples from those experiments and ran chemical tests on them that weren’t available at the time. It showed that the protein content of the wheat grown with increased atmospheric CO2 was lower than that of wheat grown under normal conditions. Protein, in turn, is a crucial part of a food crop’s nutritional value to humans. Wheat alone provides one-fourth of all the protein consumed in the global human diet. In other words, if we were all living off crops grown under the higher CO2 levels, we’d have to eat more of them to get the same nutritional value we’re getting now. “When this decline is factored into the respective portion of dietary protein that humans derive from these various crops, it becomes clear that the overall amount of protein available for human consumption may drop by about 3 percent as atmospheric carbon dioxide reaches the levels anticipated to occur during the next few decades,” Previous laboratory experiments, many also conducted by Bloom and his team, gave the same result. But the new test is the first one carried on on crops actually grown in the field.
UN Predicts 30% Rise in Agriculture’s Greenhouse Gas Emissions by 2050 (w/ infographic) New Food and Agriculture Organization (FAO) estimates of greenhouse gas data show that emissions from agriculture, forestry and fisheries have nearly doubled over the past fifty years and could increase an additional 30 percent by 2050, without greater efforts to reduce them. This is the first time that FAO has released its own global estimates of greenhouse gas (GHG) emissions from agriculture, forestry and other land use contributing to the Fifth Assessment Report of the Intergovernmental Panel on Climate Change (IPCC). Agricultural emissions from crop and livestock production grew from 4.7 billion tons of carbon dioxide equivalents (CO2 eq)—a metric used to compare emissions from different greenhouse gases based on their global warming potential—in 2001 to more than 5.3 billion tons in 2011, a 14 percent increase. The increase occurred mainly in developing countries, due to an expansion of total agricultural outputs. Meanwhile, net GHG emissions due to land use change and deforestation registered a nearly 10 percent decrease over the 2001-2010 period, averaging some 3 billion tons CO2 eq/yr over the decade. This was the result of reduced levels of deforestation and increases in the amount of atmospheric carbon being sequestered in many countries.
Global Warming Scare Tactics - IF you were looking for ways to increase public skepticism about global warming, you could hardly do better than the forthcoming nine-part series on climate change and natural disasters, starting this Sunday on Showtime. A trailer for “Years of Living Dangerously” is terrifying, replete with images of melting glaciers, raging wildfires and rampaging floods. “I don’t think scary is the right word,” intones one voice. “Dangerous, definitely.” Showtime’s producers undoubtedly have the best of intentions. There are serious long-term risks associated with rising greenhouse gas emissions, ranging from ocean acidification to sea-level rise to decreasing agricultural output. But there is every reason to believe that efforts to raise public concern about climate change by linking it to natural disasters will backfire. More than a decade’s worth of research suggests that fear-based appeals about climate change inspire denial, fatalism and polarization.
Carbon Dioxide Levels Just Hit Their Highest Point In 800,000 Years - The concentration of carbon dioxide, the greenhouse gas that drives climate change, hit 402 parts per million this week — the highest level recorded in at least 800,000 years. The recordings came from the National Oceanic and Atmospheric Association’s Mauna Loa Observatory in Hawaii, which marked another ominous milestone last May when the 400 ppm threshold was crossed for the first time in recorded history. Carbon dioxide (CO2) levels spike every spring but this year the threshold was crossed in March, two months earlier than last year. In fact, it’s happening “at faster rates virtually every decade,” according to James Butler, Director of NOAA’s Global Monitoring Division, a trend that “is consistent with rising fossil fuel emissions.” 400 ppm was long considered a very serious measurement but it isn’t the end — it’s just a marker on the road to ever-increasing carbon pollution levels, Butler explained in an interview on NOAA’s website. “It is a milestone, marking the fact that humans have caused carbon dioxide concentrations to rise 120 ppm since pre-industrial times, with over 90 percent of that in the past century alone. We don’t know where the tipping points are.”When asked if the 400 ppm will be reached even earlier next year, Butler responded simply, “Yes. Every year going forward for a long time.”
Cars Become Biggest Driver of Greenhouse-Gas Increases - The greatest emerging threat to the global climate may rest in the side pocket of your trousers -- or wherever you keep the car keys. Emissions from transportation may rise at the fastest rate of all major sources through 2050, the United Nations will say in a report due April 13. Heat-trapping gases from vehicles may surge 71 percent from 2010 levels, mainly from emerging economies, according to a leaked draft of the most comprehensive UN study to date on the causes of climate change. Rising incomes in nations like China, India and Brazil have produced explosive demand for cars and for consumer goods that must be delivered by highway, rail, ship or air. The new pollution, measured in millions of tons of greenhouse gases, may exceed all of the savings achieved through initiatives like subsidies for public transport and fuel efficiency. Cutting back on transportation gases “will be challenging, since the continuing growth in passenger and freight activity could outweigh all mitigation measures unless transport emissions can be strongly decoupled from GDP growth,” the report’s authors wrote. The warning in the 2,061-page report forms the third part of the UN’s study into global warming. Hundreds of scientists and government officials are meeting through at least April 11 in Berlin to finalize the wording of a smaller document summarizing their findings. It will guide UN envoys as they try to devise a plan to fight climate change and stop temperatures from rising to dangerous levels.
Climate change: Time is running out, UN report warns: At least half the world's energy supply will need to come from low-carbon sources such as wind, solar and nuclear by 2050, as part of the drastic action needed to cut greenhouse gases to relatively safe levels, a United Nations climate change assessment will say. A leaked draft of the next report by the Intergovernmental Panel on Climate Change also warns the world is fast running out of time to make the deep cuts to emissions required to keep global warming to an average of 2 degrees - a goal that countries, including Australia, have pledged to meet through the UN. Lord Nicholas Stern, the author of a 2006 review of the economics of climate change, has chastised Australia for being ''flaky'' on global warming. In an interview, he said each country had to be ambitious in its approach to cutting emissions and developing a low-carbon economy because climate change was a serious global problem. Advertisement Lord Stern said Australia's target of cutting emissions by 5 per cent of 2000 levels by 2020 ''looks very small'' and the Abbott government's policy changes such as scrapping the carbon tax and its ''tone of discussion'' suggested it was not very serious about climate change. The final version of the latest IPCC report - the third part of its fifth assessment of climate change - will be released in Berlin on Sunday. The report focuses on ways emissions caused by humans can be mitigated.
Climate Scientist Michael Mann – If We Don’t Stop Now, We’ll Surpass 2°C Global Warming - Yves here. I suggest skeptics listen to the video at the end of this post and ponder the implication of Mann’s discussion of plankton. When will the global warming process, and all the damage it does, get out of control? This question is obviously the focus of considerable debate.Lately the writing and thought of Guy McPherson is causing some controversy among climate thinkers and writers. McPherson’s predictions are at the extreme edge of cataclysm. For some of what McPherson is saying, scroll to the bottom of this piece and listen to the interview. The interviewer is Thom Hartmann, on his nightly TV show “The Big Picture”. McPherson sees runaway global warming in this century due to a massive methane emission from the Arctic, especially Siberia, with warming even greater and faster (both degree and speed) far beyond what even I’ve been talking about. (For some background on methane as a greenhouse gas, go here.)
Shell, Adidas, And 70 Other Companies Call On Governments To Cap Carbon At 1 Trillion Tons -- Royal Dutch Shell, Adidas, Unilever, and some 70 other companies released a communiqué urging world governments to keep carbon emissions since the industrial revolution to a cumulative of 1 trillion metric tons. This is the emissions cap needed to keep warming below two degrees Celsius and avoid catastrophic impacts of climate change, according to the latest Intergovernmental Panel on Climate Change (IPCC) report, which for the first time calls for a trillion ton cap. We have already surpassed the halfway mark and are somewhere around 578,935,750,000 tonnes of carbon at the moment. If the current rate of emissions keeps up, the limit will be passed within three decades. . If the current rate of emissions keeps up, the limit will be passed within three decades. The statement was released by the Prince Charles’s Corporate Leaders Group on Climate Change, a group of companies brought together by the heir to the British throne and managed by the University of Cambridge. The statement is asking for a timeline to reduce emissions to net zero by 2100. It also states that “we will have to reformulate our relationship with energy and completely transform our energy system, including energy used in transport and heavy industrial processes.” They cite President Obama’s call to end U.S. public financing for new coal-fired power plants overseas and the World Bank and the European Investment Bank similar announcements as evidence of a growing international effort to limit emissions.
Sorry, Kyoto Signatories, Emissions Traders, Carbon Taxers, Homo Oeconomicus Won’t Save the Climate – Part 2 -- [Part I] Existing Climate Policy Is Lacking a “Drive Axle” Between Ethical Impulse and Policy Implementation. The decision in the 1990’s to turn over climate policy to market mechanisms, in particular emissions trading, was framed by supposedly “objective” economic assumptions based as outlined above on the idea that people are essentially, Homo oeconomicus, i.e. act in practice as if they do not consider, among other things, the moral dimension of life, are “utility” maximizers and are essentially divorced from their community of context or the community of all human beings more generally. The Kyoto Protocol and its various progeny including the European Union Emissions Trading Scheme (EU-ETS), the Northeastern US Regional Greenhouse Gas Initiative (RGGI) and California’s AB 32 cap-and-trade system, all “hand off” implementation of the intention to reduce climate change to a constructed carbon permit market, layered above the real markets for goods and services.
U.K.’s Leading Political Party To Pledge Ban On New Onshore Wind Farms - The United Kingdom’s largest political party will soon promise to indefinitely ban new onshore wind farms after the year 2020, according to a report in the Guardian. The Conservative Party, led by Prime Minister David Cameron, will pledge to halt approvals of new onshore wind farms in exchange for a larger focus on more solar power and offshore wind, the Guardian reported. The positions will be released in the party’s official manifesto, a document which lays out key issues and views of the party’s leader. The main argument against onshore wind — held by some, but not all members of the Conservative party — is that they are unsightly, a “blot” in an otherwise pristine countryside. Opponents also argue that government subsidies for onshore wind farms increase household bills. Increased support for solar power and offshore wind investments will reportedly be included in the manifesto as well, as “an attempt to show that David Cameron is not abandoning the green agenda,” the Guardian reported.
Australian network operators ready to ditch poles and wires -- Network operators in at least two Australian states are likely to ditch parts of their extensive poles and wire networks in regional areas as they realise that the costs of delivering centralised generation to remote areas is no longer economically feasible. The decisions are likely to be a foretaste of a sweeping change across electricity markets in Australia, and overseas, as generation moves increasingly to a decentralised model – including rooftops, community and small local generation and storage – instead of the long-standing centralised, hub and spoke model. The falling cost of solar, and the anticipated falls in the cost of storage is making this possible. Australia is expected to be at the forefront because of the huge geographic areas covered by its networks, its sky-high electricity prices, and its excellent solar resources. The question for many is how far this new model will extend into cities and other heavily populated areas. John Bradley, the head of the Energy Networks Association – the industry group that represents the distribution and transmission network operators across the country – says network operators in at least two states, Queensland and Western Australia, are likely to shrink their asset base to allow new competitors in the market.
Threat of Imminent Kariba Dam Wall Collapse Denied - Following on the heels of the reported near collapse of the incomplete Tokwe Mukorsi dam in Zimbabwe, a certain degree of confusion surrounds the condition of the Kariba Dam on the Zambezi River, the largest river in southern Africa. It has been estimated that at least 3.5 million people in the countries of Zimbabwe, Zambia, Malawi and Mozambique are in danger should the Kariba Dam wall collapse, given that ‘serious structural weaknesses’ have reportedly developed in the wall. Should the Kariba Dam collapse, this will reportedly lead to the destruction of the Cahora Bassa Dam, a large hydroelectric dam in Mozambique, further downstream on the Zambezi, with most of the overall casualties being in Mozambique and Malawi.Zimbabwe and Zambia largely depend on hydro-electric power from Kariba Dam, while Cahora Bassa in Mozambique supplies 40% of the power demands in the Southern Africa region. The Kariba Dam was constructed on the Zambezi River between Zimbabwe and Zambia in the 1950’s by the then ‘Federation of Northern and Southern Rhodesia and Nyasaland’ (Zambia, Zimbabwe and Malawi). At the time it was one of the world’s largest dams, with a wall measuring 128m (420ft) tall and 579m (633 yards) long, and a surface area of 5,400km² (2,085sqmi). Construction of the dam resulted in the resettlement of 57,000 people and many thousands of livestock and wild animals.
How Long Until It's Gone? (infographic) Estimated decomposition rates of common marine debris items.
America’s Homegrown Terror -- The United States plays host to thousands of nuclear weapons, toxic chemical dumps, radioactive waste storage facilities, complex pipelines and refineries, offshore oil rigs, and many other potentially dangerous facilities that require constant maintenance and highly trained and motivated experts to keep them running safely. The United States currently lacks safety protocols and effective inspection regimes for the dangerous materials it has amassed over the last 60 years. We don’t have enough inspectors and regulators to engage in the work of assessing the safety and security of ports, bridges, pipelines, power plants, and railways. The rapid decline in the financial, educational, and institutional infrastructure of the United States represents the greatest threat to the safety of Americans today. And it’s getting worse. The current round of cutbacks in federal spending for low-visibility budgets for maintainence and inspection, combined with draconian cuts in public education, makes it even more difficult to find properly trained people and pay them the necessary wages to maintain infrastructure. As Bruce Katz of the Brookings Foundation points out, the 2015 budget fresh off the press includes a chart indicating that non-defense discretionary spending—including critical investments in infrastructure, education, and innovation—will continue to drop severely, from 3.1 percent of gross domestic product (GDP) in 2013 to just 2.2 percent in 2024. This decision has been made even though the average rate for the last 40 years has been 3.8 percent and the United States will require massive infrastructure upgrades over the next 50 years.
As Japan weighs energy options, costs mount for idled reactors (Reuters) - Since March 2011, Japan's government has focused on the cost of cleaning up after Fukushima, the worst nuclear accident since Chernobyl. Now, the bill is coming due for another unbudgeted consequence of that disaster - shutting down the nation's 48 remaining nuclear reactors for costly safety reviews that could see many of them mothballed. While their reactors have been idled, Japan's nuclear plant operators have had to spend around $87 billion to burn replacement fossil fuels. This, in part, explains the utilities' estimated combined losses of around $47 billion as of March, and the $60 billion wiped off the companies' market value. That pain is beginning to tell. Last week, Kyushu Electric Power Co was confirmed to be seeking a near $1 billion bailout in the form of equity financing from the government-affiliated Development Bank of Japan because of the cost of idling its reactors, joining Hokkaido Electric Power Co which has also asked the bank for financial backing. Even as Prime Minister Shinzo Abe's government hammers out the final terms of a delayed energy policy, the bill for a reduced role for nuclear power in the world's third-largest economy is becoming clearer. One way or another, Japan's taxpayers are going to be saddled with the cost of throttling back on nuclear power through taxes and higher electricity bills, analysts say, just as the government has had to provide funding for those who lost their homes and livelihoods after the Fukushima disaster.
Japan Replaced Half Its Nuclear Power With Energy Efficiency. Could The U.S. Do Something Similar? - Before the disaster Japan got about 30 percent of its electricity from nuclear power and had plans to raise that to about half by 2050. To replace that energy, Japan had to look elsewhere, both domestically and abroad. Japan To help offset this, Japan also established a lucrative feed-in tariff for solar power that lead to a rapid growth in installations. But replacing nearly one-third of their energy supply — especially going into peak summer demand — was not a realistic option, and the population braced for rolling blackouts to accompany the crippling impacts of the tsunami and earthquake. The government and the people also turned to another option, energy efficiency and conservation. A campaign called ‘setsuden’ (power saving) was established to generate support. It worked, and by allowing dressed-down outfits and rotating air-conditioning schedules, the country averted blackouts. But many worried that this short-term effort would prove to be just that, and that in the long-term an elevated demand for electricity would return, once again taxing the system. However, it turns out these worries were unwarranted — Japan has managed to replace half its missing nuclear power capacity through energy efficiency and conservation measures that endure three years later.
Obama Administration Committed to U.S. Nuclear Energy Exports - Despite the March 2011 destruction by a tsunami of Tokyo Electric Power Co.’s six reactor Fukushima Daiichi nuclear power and its ongoing pollution problems, the nuclear energy in the U.S. has weathered the storm, so to speak. The U.S. Department of Commerce estimates the international marketplace for civil nuclear technology at $500 to $740 billion over the next ten years, with the potential to generate more than $100 billion in U.S. exports and thousands of new jobs. The International Atomic Energy Agency Nuclear Technology Review projects significant growth in the use of nuclear energy worldwide, between 35% and 100% by 2030. The International Energy Agency has reached similar conclusions. In its “World Energy Outlook 2012,” the IEA concluded that while nuclear power would expand more slowly due to Fukushima and lower prices for fossil fuels, by 2035 nuclear generating capacity could increase to 580 gigawatts of electricity, compared to 371 gigawatts in 2010. Driving this is the undeniable fact that worldwide electricity demand is surging, particularly in emerging economies. By 2035, as much as 80 percent of this growth will take place in China, India and other non-OECD countries. Assuming that the above predictions are correct, then the U.S. has certain market advantages, with top-performing companies all along the nuclear value chain. According to the World Nuclear Association, 12 of the world’s 25 highest-performing reactors are in the United States.
What Is Liquefied Petroleum Gas And Why Are We Shipping It To China? - China’s top petrochemical refiner, Sinopec Corp, will soon be importing about 34,000 barrels-per-day (bpd) of liquefied petroleum gas (LPG) from the United States. In a major deal with Phillips 66 implicating the growing importance of LPG, starting in 2016 around $850-million-per-day of this compressed mix of propane and butane will make its way across the world to Sinopec, the world’s fifth biggest company by revenue. Refining companies in China are looking to use LPG as a replacement petrochemical feedstock that could be cheaper than the alternatives. Petrochemicals are used in manufacturing everything from plastics to cosmetics to solar panels. “The U.S. shale boom could lead to a fresh way of developing China’s petrochemical sector,” Mao Jiaxiang, deputy head of Sinopec’s research arm, China Petrochemical Consulting Corp, told Reuters. LPG is produced during the fossil fuel refining process or extracted from oil or natural gas flows as they emerge from the ground. The shale oil and gas boom in the U.S., brought on by advances in hydraulic fracturing, has led to a surge in LPG production that is bringing down global prices. While U.S. exports of crude oil are restricted and liquefied natural gas shipments are subject to intense debate around energy security issues and economic value, there are no limits on LPG sales. “Propane produced from gas fractionation is of a higher purity than that produced from refining, and is a better chemical feedstock,” And this is what Sinopec is likely after.”
Shale Gas Boom Leaves Wind Companies Seeking More Subsidy - Wind power in the U.S. is on a respirator. The $14 billion industry, the world’s second-largest buyer of wind turbines, is reeling from a double blow -- cheap natural gas unleashed by the hydraulic fracturing revolution and the death last year of federal subsidies that made wind the most competitive of all renewable energy sources in the U.S. Without restoration of subsidies, worth $23 per megawatt hour to turbine owners, the industry may not recover, and the U.S. may lose ground in its race to reduce dependence on the fossil fuels driving global warming, say wind-power advocates. They place the subsidy argument in the context of fairness, pointing out that wind’s chief fossil-fuel rival, the gas industry, is aided by the ability to form master limited partnerships that allow pipeline operators to avoid paying income tax. This helps drive down the cost of natural gas. “If gas prices weren’t so cheap, then wind might be able to compete on its own,” said South Dakota’s Republican Governor Dennis Daugaard. Consider that gas averaged $8.90 a million British thermal units in 2008 and plunged to $3.73 last year, making the fuel a cheaper source of electricity for utilities. Congress allowed the wind Production Tax Credit to expire last year, and wind farm construction plunged 92 percent. The shift in fortunes for the two fuels arrives at the moment when wind was beginning to rival gas on price alone, according to data compiled by Bloomberg. That means the industry’s future will be shaped by the debate over what counts as support from the government and when, or if, Congress moves to rethink the credit.
Fonterra 'confident' that fracking waste no threat to product safety: New Zealand-based dairy exporter, Fonterra, is “confident” that oil industry and fracking waste spread beneath land used by grazing milk cows poses no threat to the safety of its milk products. DairyReporter.com approached Fonterra following calls from the New Zealand Green Party to suspend the taking of milk from land in the Taranaki region of the country, where waste from oil drilling and fracking has been spread and covered. Hydraulic fracturing, which is more commonly known as fracking, is the process of drilling and injecting a combination of water, sand and chemicals into the ground at high pressure to fracture shale rocks to release trapped natural gas. In a statement issued yesterday, Green Party co-leader Dr Russel Norman claimed that consumers will be “concerned to know that milk from cows grazed on land spread with oil industry and fracking waste is in our milk supply.” “Consumers can get dirty milk from any number of countries. Our brand advantage is that our milk is clean and green. We need to take all steps to ensure our milk stays that way,” he said.
Ohio cracks down on methane pollution from fracking - - Drillers in the heavily fracked Buckeye State will now have to do more to find and fix leaks in their systems, part of the latest initiative to crack down on climate-changing methane pollution. The Akron Beacon Journal reports:Ohio on Friday tightened its rules on air emissions from natural gas-oil drilling at horizontal wells. …Drilling companies now are required to perform regular inspections to pinpoint any equipment leaks and seal them quickly.Such leaks can contribute to air pollution with unhealthy ozone, add to global warming and represent lost or wasted energy. Fugitive emissions can account for 1 to 8 percent of methane from an individual well, according to some studies. …The revised rules — in development for more than a year — were released by the Ohio Environmental Protection Agency and go into effect immediately, officials said. Environmentalists cheered the new rules, which closely followed a crackdown on fugitive methane emissions in Colorado, and a similar proposal from the Obama administration. And Wyoming recently introduced methane pollution rules for new or expanded fracking and other natural gas-related operations.
What a Ban on Fracking in Denton Could Mean For the Rest of Texas | StateImpact Texas: The Denton Drilling Awareness Group (DAG) recently got enough signatures on a petition to place an ordinance banning fracking within city limits on local ballots. Though other communities in Texas have passed restrictions on fracking, a moratorium on drilling activity within Denton could spur the rise of similar legislation across the state. If the ban passes it will likely provoke a precedent-setting legal battle that would help clarify the authority of local governments over oil and gas operations in Texas. The DAG petition against hydraulic fracking, the drilling method of using water, sand and chemical injections to extract oil and gas from shale formations, cites that fracking operations “impact the City’s environment, infrastructure and related public health, welfare and safety matters.” Aside from concerns over groundwater contamination, noise pollution and air quality, drilling disposal wells that store waste from fracking have also been heavily linked with low-magnitude earthquakes. But, according to the group, an all-out ban was a last solution in a long, unsuccessful effort to restrict hydraulic fracking through less extreme means. There are over a dozen wells within city limits, and a previous ordinance failed to prevent drilling activity near neighborhoods and residential areas.
Fracking and earthquakes: Scientists link rise in seismic activity in Oklahoma to increased oil and gas exploration - Between 1975 and 2008, Oklahoma recorded an average of no more than six earthquakes per year, yet now it is the second most seismically active of the contiguous United States, beaten only by California. Scientists have linked this surge in seismic activity to a parallel increase in oil and gas exploration, including fracking. In 2009, there were almost 50 quakes in Oklahoma. The following year, that number leapt to more than 1,000. Most were not “felt” earthquakes – those of magnitude 2.5 and above, which can be detected by humans. However, the state’s annual record of 222 felt quakes, set in 2013, has already been broken this year, with 253 so far. Seismologist Austin Holland of the Oklahoma Geological Survey told Reuters: “We have had almost as many magnitude 3 and greater already in 2014 than we did for all of 2013… We have already crushed last year’s record for number of earthquakes.” Earthquakes rarely cause damage unless they are of magnitude 4 or higher. A 4.3-magnitude temblor struck the same area near Oklahoma City on 30 March. In November 2011, the state suffered a 5.6-magnitude quake – the largest ever recorded in Oklahoma – which destroyed 14 homes. Scientists have connected a sharp rise in small earthquakes in several states to the boom in underground oil and gas exploration, notably the controversial practice of hydraulic fracturing, or fracking. Waste water from fracking and oil drilling is pumped back into the earth to be stored in so-called “injection wells”. Several studies have shown that the water, forced deep underground in layers of porous rock, can trigger seismic activity.
Series of small earthquakes rock Oklahoma in record seismic activity - (Reuters) - Earthquakes rattled residents in Oklahoma on Saturday, the latest in a series that have put the state on track for record quake activity this year, which some seismologists say may be tied to oil and gas exploration. One earthquake recorded at 3.8 magnitude by the U.S. Geological Survey rocked houses in several communities around central Oklahoma at 7:42 a.m. local time. Another about two hours earlier in the same part of the state, north of Oklahoma City, was recorded at 2.9 magnitude, USGS said. Those two were preceded by two more, at 2.6 magnitude, and 2.5 magnitude, that also rolled the landscape in central Oklahoma early Saturday morning. A 3.0 magnitude tremor struck late Friday night in that area as well, following a 3.4 magnitude hit Friday afternoon. Austin Holland, a seismologist with the Oklahoma Geological Survey who tracks earthquake activity for the USGS, said the earthquake activity in the state is soaring. "We have had almost as many magnitude 3 and greater already in 2014 than we did for all of 2013," Holland said. Last year's number of "felt" earthquakes - those strong enough to rattle items on a shelf - hit a record 222 in the state. This year, less than four months into the year, the state has recorded 253 such tremors, according to state seismic data. "We have already crushed last year's record for number of earthquakes," Holland said.
Oklahoma Swamped by Surge in Earthquakes Near Fracking - Bloomberg: There have been more earthquakes strong enough to be felt in Oklahoma this year than in all of 2013, overwhelming state officials who are trying to determine if the temblors are linked to oil and natural gas production. The state on April 6 experienced its 109th earthquake of a magnitude 3 or higher, matching the total for all of 2013, according to Austin Holland, a research seismologist with the Oklahoma Geological Survey. More quakes followed, including a magnitude 4 near Langston about 40 miles (64 kilometers) north of Oklahoma City. A surge in U.S. oil and gas production by fracturing, or fracking, in which drillers use a mix of water and chemicals to coax liquids from rock formations, has generated large volumes of wastewater. As fracking expanded to more fields, reports have become more frequent from Texas to Ohio of earthquakes linked to wells that drillers use to pump wastewater underground. “We certainly likely have cases of earthquakes being caused by different oil and gas activity,” Holland said in an interview. “Evaluating those carefully can take significant amounts of time, especially when we’re swamped.” Within the past year, earthquakes thought to be tied to wastewater disposal wells were recorded in Azle, Texas; Jones, Oklahoma; and northeastern Ohio, according to Art McGarr, a geophysicist with the U.S. Geological Survey. The ability to inject drilling wastewater underground is critical to the state’s oil and gas producers, according to Chad Warmington, president of the Oklahoma Oil and Gas Association, an industry group previously known as the Mid-Continent Oil and Gas Association of Oklahoma. So far the link between injection wells and earthquakes isn’t conclusive, Warmington said.
Oklahoma Suffering From Huge Increase in Earthquakes Near Drilling: Oklahoma is dealing with a significant increase in earthquakes near drilling sites, suggesting a link between hydraulic fracturing and seismic activity. Oklahoma has already experienced as many earthquakes this year to date than all of last year combined. There have been 109 earthquakes with a magnitude 3 or higher through April 6, the total number of earthquakes for all of 2013. The incidents pose a conundrum for regulators in a state that has fully embraced oil and gas drilling. “We certainly likely have cases of earthquakes being caused by different oil and gas activity,” Austin Holland, a seismologist with the Oklahoma Geological Survey, said in an interview with Bloomberg. “Evaluating those carefully can take significant amounts of time, especially when we’re swamped.” The state ordered the closure of two injection wells in Love County last year after several earthquakes occurred in the area. Evidence of a link between earthquakes and fracking have cropped up in other places around the country before. Research on earthquakes in Ohio in particular has indicated a correlation. The research suggests that seismic activity is not necessarily linked to the fracking job, but to the injection wells where producers dispose of wastewater. In fact, research from the U.S. Geological Survey shows that fracking wastewater may have contributed to a six fold increase in earthquakes in the U.S. between 2000 and 2011. The Oklahoma Oil and Gas Association denies the link, and says the jury is still out. “We’re trying to make sure we understand what data the state needs in order to start making some determinations on cause and effect” said Chad Warmington, the trade association’s President. “We don’t want anybody to jump to conclusions.” The group doesn’t want Oklahoma regulators to halt drilling operations.
Oklahoma Has Already Had More Magnitude 3 Earthquakes This Year Than All Of Last Year - Oklahoma has had more magnitude 3 or higher earthquakes so far this year than in all of 2013, a statistic that’s led some to fear that the uptick in quakes is related to fracking in the state. In 2013, according to Bloomberg News, Oklahoma experienced 109 earthquakes of magnitude 3 or higher. That number was reached again just a little over three months into 2014. The state experienced its 109th magnitude 3 earthquake of 2014 on April 6, followed by a magnitude 4 earthquake on April 7. In the last 30 days alone, Oklahoma has had 133 earthquakes of magnitude 2.5 or higher — the base level at which seismologists say earthquakes can be felt — and the April 7 quake was the fifth of that magnitude felt by the state since March 30. Before 2009, Oklahoma experienced few 3.0 or higher earthquakes — no more than three a year from 1991 to 2008. But in 2009, the amount of fracking wastewater injected deep into the ground has risen, and so has the number of earthquakes in the state. Since 2009, earthquake activity in Oklahoma has consistently been about 40 times higher than the average of the previous 30 years. Some of these earthquakes — particularly the series that hit near Langston, Oklahoma — are occurring close to injection wells, so state officials are working to determine whether the injection of wastewater played a role in causing these earthquakes.
Fracking Fingered: 100 Earthquakes In Oklahoma The jury is still out on this one, but when Oklahoma gets more than 100 earthquakes in less than three months, attention naturally turns to fracking, the natural gas and oil drilling method that involves pumping a vast amounts of chemical brine underground, with the resulting wastewater often disposed by injecting that underground, too. It all makes for a messy, water-intensive operation, but a Bush/Cheney-era exemption from the Clean Water Act has enabled the fracking industry to largely evade the grasp of federal regulators. That leaves states like Oklahoma struggling to deploy scant oversight resources in the middle of a drilling boom. According to a report yesterday in Bloomberg, as the first week of April came to a close the state experienced had already experienced 109 earthquakes at or above magnitude 3.0, with more to follow. That’s more 3.0-and-greater earthquakes than in all of last year, overwhelming the capacity of the Oklahoma Geological Survey to investigate the causes. Bloomberg cites OGS seismologist Austin Holland: We certainly likely have cases of earthquakes being caused by different oil and gas activity. Evaluating those carefully can take significant amounts of time, especially when we’re swamped
Frackquakes Make Oklahoma Earthquake Champ - Oklahoma, which had previously been seismically inert for the last million years or so, now outranks California as the state with the most earthquakes. (Reuters) – Earthquakes rattled residents in Oklahoma on Saturday, the latest in a series that have put the state on track for record quake activity this year, which some seismologists say may be tied to oil and gas exploration. One earthquake recorded at 3.8 magnitude by the U.S. Geological Survey rocked houses in several communities around central Oklahoma at 7:42 a.m. local time. Another about two hours earlier in the same part of the state, north of Oklahoma City, was recorded at 2.9 magnitude, USGS said. Frackquake Anyone ? Those two were preceded by two more, at 2.6 magnitude, and 2.5 magnitude, that also rolled the landscape in central Oklahoma early Saturday morning. A 3.0 magnitude tremor struck late Friday night in that area as well, following a 3.4 magnitude hit Friday afternoon. Austin Holland, a seismologist with the Oklahoma Geological Survey who tracks earthquake activity for the USGS, said the earthquake activity in the state is soaring. “We have had almost as many magnitude 3 and greater already in 2014 than we did for all of 2013,” Holland said. Last year’s number of “felt” earthquakes – those strong enough to rattle items on a shelf – hit a record 222 in the state. This year, less than four months into the year, the state has recorded 253 such tremors, according to state seismic data.
Oklahoma Frackquake Capital of the World ! --In this map of earthquakes recorded by the US Geological Survey in the past thirty days (each quake is marked by a dot on the map), Oklahoma is a clear hot spot. (USGS) A dramatic uptick in earthquakes has been shaking central Oklahoma this year, continuing a recent trend of unusually high earthquake activity in the state and leading scientists to speculate about a possible link to oil and gas production there.The US Geological Survey found that from 1975 to 2008, central Oklahoma experienced one to three 3.0-magnitude earthquakes a year, compared with an average of forty per year from 2009 to 2013. And it looks like that number is going to get bigger. It’s only February, and the state has already logged more than twenty-five quakes of 3.0-magnitude or larger this year, and more than 150 total quakes in the past week alone. This startling graphic, from The Rachel Maddow Show Tuesday, shows a massive spike of 2.5-magnitude or larger earthquakes, starting last year (the yellow portion of the last bar represents earthquakes that took place between Maddow’s shows on Monday and Tuesday) ; An earlier version of this post stated that there have already been more than 150 earthquakes in Oklahoma this year. In fact, there have been more than 500 earthquakes in Oklahoma this year and 150 last week.
Seismic tests go lacking in fracking: The Ohio Department of Natural Resources is studying seismic data from wells near last month’s Poland Township earthquakes, but no such review occurred prior to drilling. That’s because the agency responsible for regulating the state’s oil and gas industry does not require oil and gas companies to obtain or to submit seismic reflection data when applying for a permit to drill fracking wells. Fracking extracts natural gas from shale under pressure. “An application to drill a horizontal well does not contain seismic requirements,” said ODNR spokesman Mark Bruce. “ODNR has and continues to work with partners to gather as much seismic information about the state as we can, and that general knowledge is used by our permitting staff when reviewing applications.” But according to the state’s top geologist, seismic data is not necessarily easy to come by. “Seismic reflection data are limited because the information is expensive to obtain,” Tom Serenko, chief of ODNR’s geological survey division, told The Vindicator last month in an email. “Many geophysical companies hold this as proprietary and sell it to oil companies who look for oil and gas.” “There is no public seismic reflection information available for Mahoning County,” he wrote.
Ohio geologists link seismic activity to hydraulic fracturing, issue new permit conditions: State geologists in Ohio believe they have for the first time linked earthquake activity in the Utica shale to hydraulic fracturing, and the state says it is issuing new permit conditions in seismic-sensitive areas. State Oil & Gas Chief Rick Simmers told The Associated Press on Friday that a state investigation of five small tremors in the Youngstown area last month has found a probable link. He said Ohio is setting new permitting conditions in earthquake-sensitive areas and has halted drilling indefinitely at the site of the March quakes. A seismologist with the U.S. Department of Interior says it's the first time a link has been drawn between seismic activity and fracking taking place in the Marcellus-Utica shale across the northeastern United States.
Ohio links fracking to earthquakes, announces tougher rules (Reuters) - Recent small earthquakes in Ohio were likely triggered by fracking, state regulators said on Friday, a new link that could have implications for oil and gas drilling in the Buckeye State and beyond. In the strongest wording yet from the state linking energy drilling and quakes, the Ohio Department of Natural Resources (ODNR) said that injecting sand, water and chemicals deep underground to help release oil and gas may have produced tremors in Poland Township last month. The statement, in which the department announced stricter rules for oil and gas exploration in areas where seismic activity has occurred, comes after a steep rise in earthquakes in Ohio and other areas where intense drilling has taken place. Most earthquakes occur naturally, but scientists have long linked some smaller tremors to oil and gas work underground, which can alter pressure points and cause shifts in the earth. Last month, drilling and fracking was suspended near the site of two earthquakes in Poland Township in the northeast of the state, 70 miles southeast of Cleveland, the first of which was magnitude 3.0, enough to be felt for miles around. Earthquakes rattled residents in Oklahoma last weekend, the latest in a series that have put the state on track for record quake activity this year, which some seismologists say may be tied to oil and gas exploration. "Regarding the seismic events in Poland Township, ODNR geologists believe the sand and water injected into the well during the hydraulic fracturing process may have increased pressure on an unknown microfault in the area," ODNR said in a statement.
Ohio finds ‘probable connection’ between earthquakes in Mahoning County and hydraulic fracturing - The Ohio Department of Natural Resources on Friday announced that recent earthquakes in Mahoning County were likely caused by hydraulic fracturing or fracking. The state ordered an indefinite moratorium on fracking natural gas wells within three miles of the epicenter of earthquakes on March 10 and 11 in Poland Township southeast of Youngstown. There were five quakes of 2.0 or greater. The report marks the first probable connection between earthquakes and hydraulic fracturing or fracking in Ohio. It also creates a new problem for drillers and the drilling industry. The order halts fracking of wells on two pads by Texas-based Hilcorp Energy Co. that was fracturing the wells on the Carbon Limestone Landfill on the Ohio-Pennsylvania border. Hilcorp said it is reviewing the ODNR action. In a related move, Ohio said it is changing its permit conditions for drilling in Ohio near faults or earthquake sites. New permits for drilling within three miles of a known underground geologic fault or area of seismic activity greater than 2.0 magnitude will require companies to install seismic monitors. The order would affect any quakes since 1999 that were recorded at magnitude 2.0 or greater. If those monitors detect a quake of 1.0 magnitude or greater, drilling activities would be halted while the cause is investigated. If that investigation reveals a probable connection to hydraulic fracturing, all well completion operations will be suspended. That requirement went into effect on Friday.
Authorities in Ohio first in the world to link earthquake to fracking - Independent.ie: State regulators have for the first time have linked earthquake activity in eastern Ohio to hydraulic fracturing, confirming the suspicions of activists pushing unsuccessfully for a drilling ban. State Oil & Gas chief Rick Simmers said the state has halted drilling indefinitely at the site near Youngstown where five minor tremors occurred in March following investigative findings of a probable link to fracking. A deep-injection well for fracking wastewater was tied to earthquakes in the region in 2012. Mr Simmers says Ohio will require sensitive seismic monitoring as a condition of all new drilling permits within three miles of a known fault or existing seismic activity of 2.0 or greater. Drilling will pause for evaluation with any tremor of 1.0 magnitude and will be halted if a link is found. A seismologist with the US Department of Interior said it is the first time seismic activity has been linked to Marcellus shale exploration which has swept the north-eastern United States over the past few years.
Youngstown News, ODNR links fracking to Poland earthquakes: For the first time, a team of state regulators and geologists on Friday identified hydraulic fracturing as a “probable” trigger for earthquakes, confirming suspicions that a series of tremors in Poland Township were the result of fracking operations. “ODNR geologists believe the sand and water injected into the well during the hydraulic fracturing process may have increased pressure on an unknown microfault in the area,” the agency responsible for regulating the state’s oil and gas industry said in a statement. On March 23, The Vindicator reported that geologists outside of an Ohio Department of Natural Resources investigation were considering the theory that fluid from a fracking well at the Carbon Limestone Landfill could have seeped into an unknown fault extending upward from the Precambrian basement, causing the ground to shake March 10. ODNR’s investigation turned up no link to the Precambrian formation, but it did indicate that fracking aggravated a small, previously undetected fault in the overlying Paleozoic rock. Rick Simmers, chief of ODNR’s oil and gas division, said it wasn’t clear whether the fluid leaked into the fault or whether it created pressure that caused the fault to move.
Fracking Linked to Earthquakes in Ohio - from NRDC: The Ohio Department of Natural Resources (ODNR) announced today that recent earthquakes in northeastern Ohio were likely caused by hydraulic fracturing. A series of earthquakes up to magnitude 3.0 struck on March 10th and 11th in Mahoning County near the Ohio-Pennsylvania border. A nearby Utica oil well was being hydraulically fractured at the time of the quakes, leading ODNR shut down the operation until a possible link could be investigated further.This is now the fourth documented case of induced seismicity linked to hydraulic fracturing, and the latest in a series of earthquakes in Ohio caused by oil and gas production activities. The earlier quakes resulted from disposal of waste water into underground injection wells. Scientists have long known that injecting fluids underground can cause earthquakes. Despite this fact, neither state nor federal regulations require operators of hydraulically fractured wells or disposal wells to evaluate the risk of induced earthquakes when deciding where to site wells or how to operate them. Ohio will now be the first state to require companies to monitor for seismic activity during hydraulic fracturing and shut down operations if earthquakes occur.
State creates tougher fracking rules to reduce risk of earthquakes - State regulators have announced new rules for fracking near known faults and areas of past seismic activity in wake of a series of earthquakes in Mahoning County about a month ago. Drilling within 3 miles of “a known fault or area of seismic activity greater than a 2.0 magnitude” will have to be monitored with “sensitive seismic monitors” by companies, according to Ohio Department of Natural Resources. The agency said in a release that the new policy is in response to recent earthquakes in Poland Township “that show a probable connection to hydraulic-fracturing near a previously unknown micro-fault.” “While we can never be 100 percent sure that drilling activities are connected to a seismic event, caution dictates that we take these new steps to protect human health, safety and the environment,” ODNR Director James Zehringer said in the release. At least 12 earthquakes occurred in early March near an active fracking operation, prompting Natural Resources to shut down the process. Initially, the state said there was no evidence linking fracking and the temblors. The largest registered at magnitude-3.0. “ODNR geologists believe the sand and water injected into the well during the hydraulic fracturing process may have increased pressure on an unknown micro-fault in the area,” according to the release. The link is one of the first in the U.S. between fracking and earthquakes; injection wells have been linked to quakes for some time.
Fracking Linked To Earthquakes In Ohio, New Permit Conditions Issued - - State geologists in Ohio have for the first time linked earthquakes in a geologic formation deep under the Appalachians to gas drilling, leading the state to issue new permit conditions in certain areas that are among the nation's strictest. A state investigation of five small tremors in the Youngstown area, in the Appalachian foothills, last month has found the high-pressure injection of sand and water that accompanies hydraulic fracturing, or fracking, in the Utica Shale may have increased pressure on a small, unknown fault, said State Oil & Gas Chief Rick Simmers. He called the link "probable." While earlier studies had linked earthquakes in the same region to deep-injection wells used for disposal of fracking wastewater, this marks the first time tremors have been tied directly to fracking, Simmers said. Five seismic events in March were all part of what was considered a single event and couldn't be easily felt by people.The state's new permit conditions are perhaps the most cautious yet put in place in the nation, he said. Glenda Besana-Ostman, a seismologist with the U.S. Department of the Interior's Bureau of Reclamation, confirmed the finding is the first in the region to suggest a connection between the quakes and the actual extraction of oil and gas, as opposed to wastewater disposal. A deep-injection well in the same region of Ohio was found to be the likely cause of a series of quakes in the same region of Ohio in 2012.
Ohio acknowledges connection between hydraulic fracturing and Youngstown quakes, will require seismic testing near known fault lines -- State regulators are about to put the brakes on hydraulic fracturing by requiring seismic monitoring of wells being drilled near known fault lines. The Ohio Department of Natural Resources on Friday said that it will require companies seeking horizontal well drilling permits within 3 miles of known fault lines or where quakes have already been recorded will first have install a network of seismic monitors. If the monitors detect a "seismic event" larger than a magnitude of 1.0, the fracturing would have to pause. State seismologists would then try to pinpoint exactly where the quake had occurred, and at what depth. If they determine what the ODNR is calling a "probable connection" to the fracturing, the state will not allow the well to be completed. "The seismic testing will be done in real-time," said Mark Bruce, ODNR spokesman. "If we see anything above 1, the (policy) will require them to stop. "We can then look at the data. If the seismic monitors show that it is down at the bedrock (below the fracturing), then it has nothing to do with the well and they can continue." But if the disturbance is originating closer to the level of the well bore, operations will be suspended, he said.
Ohio links fracking with earthquakes, announces tougher rules: (Reuters) - Ohio regulators announced new rules for oil and gas drilling on Friday after evidence emerged linking the hydraulic fracturing extraction method, known as fracking, to recent earthquakes. In the strongest wording yet from the state, the Ohio Department of Natural Resources (ODNR) said that injecting sand, water and chemicals deep underground to help release oil and gas could be inducing tremors. Last month, drilling was suspended at the site of two earthquakes in Poland Township in the northeast of the state, 70 miles southeast of Cleveland, the first of which was magnitude 3.0, enough to be felt for miles around. "Regarding the seismic events in Poland Township, ODNR geologists believe the sand and water injected into the well during the hydraulic fracturing process may have increased pressure on an unknown microfault in the area," the deparment said in a statement. The rules announced Friday require companies to install seismic monitors if fracking occurs within three miles of a known fault or an area which has recently experienced quakes, the ODNR said. Friday's statement could have wide implications not just for a state where a drilling boom is underway, but in other regions where concerns have emerged about the impact of fracking on fault lines.
In Unprecedented Move, Ohio Sets Permit Conditions for Fracking Near Faults | 2014-04-11 | Natural Gas Intelligence -- The Ohio Department of Natural Resources (ODNR) on Friday took an unprecedented step to establish what is believed to be the country's first set of permitting conditions for hydraulic fracturing (fracking) in horizontal wells near fault lines or areas of previous seismic activity. The move comes after a month of investigation into what caused a 3.0-magnitude earthquake on March 10 near a well-pad operated by Hilcorp Energy Co. in Mahoning County's Poland Township, about eight miles southeast of Youngstown (see Shale Daily, March 11). In a press release announcing the new regulations, ODNR said its geologists believe that sand and water injected into one of the six wells on the pad during stimulation operations in the days leading up to the earthquake (see Shale Daily, March 12) increased pressure on an unknown micro-fault in the area, triggering the seismic activity. ODNR shut down operations at that well pad the day of the earthquake and allowed natural gas to continue flowing at a nearby producing well. Another 10 earthquakes, smaller than the first, were recorded in the area by the U.S. Geological Survey and researchers at Columbia University in the following days (see Shale Daily, March 19). Despite a number of private studies (see Shale Daily, April 11, 2013; Jan. 18, 2013; June 18, 2012 ;Oct. 11, 2011), ODNR's announcement marks one of the first times that a state agency has gone beyond suggestions and provided an explanation about the link between stimulation operations and fracking.As other states, such as Oklahoma and Kansas (see Shale Daily, March 20; April 8), mull similar regulations for exploration and production companies and injection well operators, ODNR's move is also one of the first significant steps in establishing conditions aimed at limiting the possibility of seismic events related to unconventional oil and gas development.
Can Fracking Solve the Nuclear Waste Problem? -- U.S. scientists are proposing that the source of one controversial energy program could provide a solution to the problems of another. Nuclear waste—that embarrassing by-product of two generations of uranium-fueled power stations—could be stored indefinitely in the shale rock that right now provides a highly contentious source of natural gas for utility companies. An estimated 77,000 tons of spent nuclear fuel is stored in temporary, above-ground facilities. For decades, governments, anti-nuclear campaigners and nuclear generating companies have all agreed that such a solution is unsafe in the long-term, and unsatisfactory even in the short term.Nuclear fuel remains hazardous for tens of thousands of years. Everyone would like to see it safely tucked out of harm’s way. But for decades, there has been disagreement and uncertainty about what might constitute long-term safety. But Chris Neuzil of the U.S. Geological Survey told the American Chemical Society annual meeting in Dallas, TX, that the unique properties of the sedimentary rock and clay-rich strata that make up the shale beds could be ideal. France, Switzerland and Belgium already planned to use shale repositories as a long-term home. For decades, U.S. authorities planned to bury American waste under Yucca Mountain in Nevada, but abandoned the scheme in 2009.
Under Revised Quake Estimates, Dozens of Nuclear Reactors Face Costly Safety Analyses - Owners of at least two dozen nuclear reactors across the United States, including the operator of Indian Point 2, in Buchanan, N.Y., have told the Nuclear Regulatory Commission that they cannot show that their reactors would withstand the most severe earthquake that revised estimates say they might face, according to industry experts. As a result, the reactors’ owners will be required to undertake extensive analyses of their structures and components. Those are generally sturdier than assumed in licensing documents, but owners of some plants may be forced to make physical changes, and are likely to spend about $5 million each just for the analysis. Richard S. Drake, a structural engineer with Entergy, which owns Indian Point 2 and 3, north of New York City, said the plants had far thicker concrete and steel than the minimum required. Thus, he said, they could probably withstand far bigger challenges than their licenses specified. But on the basis of engineering analyses already in hand, Mr. Drake said, “I just can’t say, ‘It looks good from here.’ We’ll have to crunch the numbers.” The Nuclear Regulatory Commission is presuming, for the time being at least, that plants built to the old standard do not present any immediate risk. But critics say that contradicts one of the recommendations made by a task force of commission senior staff members after the earthquake and tsunami in Japan three years ago, which caused three reactors to melt down at Fukushima Daiichi.
Oil Consultant Turned Whistleblower Exposes Fracking Crimes in Alberta -- This You Tube is a compilation of segments from a 90 minute talk. Jessica Ernst worked for more than three decades as an environmental biologist doing research and independent consulting for the Alberta, Canada petroleum industry. One of her main clients was the EnCana Company, which began large-scale fracking in the region of her home community of Rosebud Alberta in the early years of the 21st century. In 2007, Jessica Ernst the scientist became Jessica Ernst the whistleblower. Bringing forward evidence that her own water well and those of her neighbors had been severely contaminated, Ernst sued the EnCanada Corporation. She also sued the forerunner of the Alberta Energy Regulator as well as the Alberta government itself. Ernst is especially intent on getting some accountability from the Alberta Energy Regulator (AER), which is 100 percent industry-funded. She accuses the AER of violating her freedom of association under the Canadian Charter of Rights and Freedoms. Ernst made this allegation based on a directive issued by the oil and gas regulator, Jim Reid. Rather than doing a credible investigation of Ernst's complaints, Reid ordered his staff to cease all communications with Ernst in 2005.
Chevron blocked access to DEP after fatal well fire in southwest Pa. | StateImpact Pennsylvania - When a Chevron natural gas well exploded in Greene County, killing a worker, the company blocked personnel with the state Department of Environmental Protection from accessing the site for nearly two days. The DEP acquiesced, despite its regulatory authority. Now, that issue is one of nine violations the DEP outlined in a letter to Chevron last month. The fire started early on Feb. 11 and continued to burn for five days. When a DEP emergency crew first arrived on the scene in Dunkard Township, Chevron told them to stay away from the site and not to drive their vehicle on the access road. The crew was also blocked from parking an emergency vehicle at a nearby command center. “They were not allowing anybody close to that well pad and I think that our feeling though was, as a regulatory agency, we want to be there, we want to see it, we want to know what Chevron is saying,” DEP spokesman John Poister said. Drilling companies are always required to grant access to DEP officials, regardless of the circumstances, according to their state-issued permits. When asked why the agency did not enforce its right to access the site, Poister told StateImpact Pennsylvania the agency did “strongly” express its concerns to Chevron and that the relationship between the company and the DEP improved over time.
No Eminent Domain For Gas Gathering System - A fracker tried to pretend that their gas gathering system was a “utility” and get the power of eminent domain to condemn right of way. Silly fracker. Court Blocks Use of Eminent Domain on Pipeline York County landowners affected by the same proposed Marcellus Shale pipeline that would run through Clay and West Cocalico townships in Lancaster County have won a court battle blocking Sunoco Logistics from condemning their land. In a March 25 ruling in York County Common Pleas Court, Judge Stephen Linebaugh reaffirmed his previous ruling that Sunoco was a pipeline carrier, and not a public utility, and therefore had no eminent domain powers. Officials for Williams Partners, which wants to build a 35-mile Marcellus Shale natural gas line the length of Lancaster County, north to south, said Wednesday that the court case has no bearing on their project. “It is not an apples to apples comparison. This decision does not apply…,” said Chris Stockton, spokesman for Tulsa-based Williams. Stockton said Williams is under the jurisdiction of the Natural Gas Act, not the Interstate Commerce Act like Sunoco, and would need to get its power of eminent domain if the project is approved by the Federal Energy Regulatory Commission.
Arms of a Behemoth: Interesting Video on LNG Distribution - Here is an interesting video on liquid Natural Gas distribution that came my way courtesy of New Zealand reader Hugh Pavletich.
ANR Pipeline: Introducing TransCanada’s Keystone XL for Fracking --When most environmentalists and folks who follow pipeline markets think of TransCanada, they think of the proposed northern half of its KeystoneXL tar sands pipeline. Flying beneath the public radar, though, is another TransCanada-proposed pipeline with a similar function as Keystone XL. But rather than for carrying tar sands bitumen to the Gulf Coast, this pipeline would bring to market shale gas obtained via hydraulic fracturing (“fracking”).Meet TransCanada's ANR Pipeline System. Although not actually a new pipeline system, TransCanada wants ANR retooled to serve domestic and export markets for gas fracked from the Marcellus Shale basin and the Utica Shale basin via its Southeast Main Line. “The [current Southeast Main Line] moves gas from south Louisiana (including offshore) to Michigan where it has a strong market presence,” explains a March 27 article appearing in industry publication RBN Energy. Because of the immense amount of shale gas being produced in the Marcellus and Utica, TransCanada seeks a flow reversal in the Southeast Main Line of itsANR Pipeline System. TransCanada has already drawn significant interest from customers in the open seasons and negotiations held to date, so much so it expects to begin the flow reversal in 2015.
Industry Pays Pipeline Safety Regulators -- To not regulate. Almost 100% of national pipeline regulations are paid for by the pipeline industry – who get what they paid for. Jeffrey Wiese, the nation’s top oil and gas pipeline safety official, recently strode to a dais beneath crystal chandeliers at a New Orleans hotel to let his audience in on an open secret: the regulatory process he oversees is “kind of dying.” Wiese told several hundred oil and gas pipeline compliance officers that his agency, the Pipeline and Hazardous Materials Administration [2] (PHMSA), has “very few tools to work with” in enforcing safety rules even after Congress in 2011 allowed it to impose higher fines on companies that cause major accidents. “Do I think I can hurt a major international corporation with a $2 million civil penalty? No,” he said. Because generating a new pipeline rule can take as long as three years, Wiese said PHMSA is creating a YouTube channel to persuade the industry to voluntarily improve its safety operations. “We’ll be trying to socialize these concepts long before we get to regulations.” Wiese’s pessimism about the viability of the pipeline regulatory system is at odds with the Obama administration’s insistence [3] that the nation’s pipeline infrastructure is safe and its regulatory regime robust. In a speech last year [4], President Obama ordered regulatory agencies like PHMSA to help expedite the building of new pipelines “in a way that protects the health and safety of the American people.”
Company That Spilled 20,000 Barrels Of Oil Into A Michigan River Is Reopening Its Pipeline -- An oil pipeline that spilled over 20,000 barrels into a Michigan river has been rebuilt and will re-open for business on May 1, InsideClimate News reports. The pipeline, owned by Enbridge Inc., goes from Griffith to Ortonville in Michigan, cutting across over 100 wetlands, streams and rivers in its 235-mile path. It will be able to carry up to 500,000 barrels of crude oil a day, including the heavy crude from Canada’s oil sands. Another 50-mile segment is scheduled to be opened in early fall. The pipeline is a $1.3 billion replacement for a 46-year-old pipe that followed the same path. In 2010, a rupture in that original pipe dumped over 834,000 gallons (or more than 20,000 barrels) of heavy Canadian crude into Michigan’s Kalamazoo River. The spill spread through 40 miles of the river, and leached into the surrounding wetlands. At $800 million, it was the costliest on-shore spill in United States history at the time. The Department of Transportation wound up imposing a record-setting $3.7 million civil penalty on Enbridge for the Kalamazoo spill, and the National Transportation Safety Board (NTSB) faulted the company for “pervasive organizational failures” and a “complete breakdown of safety.” The NTSB said the company noticed cracks in the pipe due to corrosion and fatigue as early as 2010, but failed to report them — and it faulted the Pipeline and Hazardous Materials Safety Administration (PHMSA), the agency charged with overseeing the safety and integrity of the nation’s pipelines, for “weak federal regulations.”
NC commission appeals ruling giving it authority to halt coal ash pollution - The state’s Environmental Management Commission on Monday appealed a judge’s ruling that gave it the authority to force Duke Energy to immediately stop pollution at its coal ash ponds.It was an unexpected move by the state — and an unusual one — and put the commission on the same side of the ruling as Duke Energy, which last week also appealed the judge’s decision. The March 6 ruling by Wake Superior Court Judge Paul Ridgeway reversed a state Environmental Management Commission decision that was reached in December.The state EMC for several years has interpreted a groundwater pollution rule to mean that it didn’t have to require a polluter to immediately stop the source of pollution, which gave regulators more options to work toward a cleanup. Environmental groups sued to force the commission to return to the way it had imposed the rule before that, but the commission decided it had interpreted the rule correctly.Environmentalists then sued to appeal the EMC ruling. Ridgeway agreed with them, and said the state had the authority to require an immediate halt to pollution. The EMC adopts and oversees rules for the state Department of Environment and Natural Resources, and is represented by the attorney general’s office.
200,000 Pounds Of Oiled Sand Found Along Texas Coastline After Spill - The March 22 collision between a ship and a barge carrying up to 4,000 barrels of “sticky, gooey, thick, tarry” bunker fuel oil in Galveston Bay, Texas has resulted in more than 200,000 pounds of oiled sand and debris accumulating along some 22 miles of shoreline on the Texas coast. The spill, which shut down the busy Houston Ship Channel for three days, has had wide-ranging economic and ecological impacts. Areas surrounding the spill are environmentally sensitive and provide crucial stopover points for a number of migrating bird species. These include whooping cranes, one of North America’s rarest birds, which winter on the nearby Matagorda Island. Parts of the island have been contaminated by oil from the spill. Fewer than half of the whooping cranes have started this year’s migration north, and officials are taking extra precaution not to disturb them during cleanup efforts. As of Thursday, the Coast Guard had recovered 329 oiled birds from Galveston Bay to North Padre Island, most of them dead. According to the Texas Tribune, birds affected by the spill include ducks, herrings, herons, brown and white pelicans, sanderlings, loons, willets, black-bellied plover and the piping plover.
Oil Imports Seen Falling to Zero as Soon as 2037 by U.S. - Bloomberg: Net oil imports to the U.S. could fall to zero by 2037 because of robust production in areas including North Dakota’s Bakken field and Texas’s Eagle Ford formation, according to a government projection released today. The Energy Information Administration, the branch of the Energy Department that collects and analyzes energy data, said the once-chimerical goal of U.S. energy independence could be within reach in 23 years under a “high-production” estimate contained in an update of its periodic energy forecast. “This is the first time that a case in the Annual Energy Outlook has projected that net imports’ share of liquid fuels consumption could reach zero,” said John Krohn, a spokesman for the EIA, in an e-mail. Estimating oil production is a tricky business, particularly for the length of time in EIA’s analysis. Forecasters must make a number of guesses, including the size of oil reserves lying thousands of feet underground, how quickly technology advances, and whether a rise in oil prices can make resources once too costly to produce suddenly economic.
Shifting bottlenecks in US energy markets - With the startup of TransCanada's Cushing Marketlink pipeline and increased rail shipping of crude directly to the US Gulf Coast (bypassing Cushing, Oklahoma), a new dynamic in the US energy markets is taking shape. The glut of crude at Cushing (see post form 2012) that used to put downward pressure on WTI is over. With the transport backlog to the Gulf Coast diminishing, crude supplies at Cushing (the delivery point for WTI futures) fell significantly, once again contributing to tighter Brent-WTI spread. Lower supplies at Cushing raised WTI prices while Libya resuming crude exports lowered Brent prices. This development however created another bottleneck. The oversupply of crude has shifted from Oklahoma to the US Gulf Coast. >Bloomberg: - Houston and the rest of the U.S. Gulf Coast have more crude oil than the region can handle. Stockpiles in the region centered on Houston and stretching to New Mexico in the west and Alabama in the east rose to 202 million barrels in the week ended April 4, the most on record, Energy Information Administration data released yesterday show. One of the key issues is the US crude oil export restriction. Back in the 70s, the US Congress made it illegal to export domestically produced crude oil without a permit. And permits are tough to get these days, given how unpopular the notion of US oil exports seems to be. The Jones Act which restricts shipping among US ports is also adding to the bottleneck. Bloomberg: - Storage tanks are filling as new pipelines carry light, sweet oil found in shale formations to the coast and U.S. law keeps companies from moving it out. Most crude exports are banned and the 13 ships that can legally move oil between U.S. ports are booked solid. The federal Jones Act restricts domestic seaborne trade to vessels owned, flagged and built in the U.S. and crewed by citizens.Now it's the refineries who will need to clear this inventory and ultimately export the excess product. And that's exactly what is taking place currently, as idle US refining capacity hits a multi-year low.
Crude oil is displacing other commodities on trains, critics charge — Grain producers, manufacturers and coal shippers told federal regulators Thursday that rail service has deteriorated drastically in the nation’s midsection in recent months, leaving crops in piles on the ground and fuel stocks low at electric power plants as resources go undelivered. Railroad representatives told the federal Surface Transportation Board that a brutal winter, combined with a record grain harvest, was to blame for the delays, but the industry’s critics charge that their shipments are taking a side track to crude oil. Railroads moved virtually no crude oil just a few years ago, but a surge in production in North Dakota’s Bakken shale region has strained rail capacity in the Midwest. It’s putting the squeeze on farmers who rely on rail to turn their crops into cash and delaying passengers on Amtrak’s Empire Builder between Chicago and the Northwest, several witnesses testified.“The extreme delays to Amtrak and other users of the network are a symptom of a fragile network that is strained and struggling to react,” Federal Railroad Administrator Joseph Szabo told the board, which mediates disputes between railroads and their customers. Bob Wisness, the president of the North Dakota Grain Growers Association, said the rail snarls had put his state’s farmers in jeopardy. Millions of bushels of wheat, barley and corn are “unmarketable” because of rail deliveries that are weeks and months late. Bob Kahn, the general manager of the Texas Municipal Power Agency, testified that the service problems began almost a year ago. The state depends on coal deliveries by rail to generate a third of its electricity, and lately railroads have not kept up, Texas plants only have a 10-day supply and could run out by the summer, when electricity demand reaches its peak in the state.
North American Oil Glut to Keep Prices Low, IMF says: The International Monetary Fund said global crude oil prices have been relatively lower because of the growth in oil supply from North America. With U.S. oil production on pace to eclipse 9 million barrels per day near term, the trend should continue through next year. Nearly all of the growth in global oil production is coming from the United States and Canada. Combined, North American production growth is around 1.2 million barrels per day from U.S. shale oil and Canadian oil sands. IMF said this growth was spilling over to the global marketplace. "Crude oil prices have edged lower, mainly as a result of the continued supply surge in North America," it said. The U.S. Energy Information Administration said in its market report for April it expected the price for Brent crude, the global benchmark, to average $105 per barrel this year, but fall to $101 in 2014. For West Texas Intermediate, the U.S. benchmark, prices should average $96 per barrel. That's $1 per barrel higher than EIA reported last month, although the administration expects WTI to dip to $90 per barrel next year. WTI is less than the Brent equivalent because of the increase in production in the United States.
Chris Martenson: “Oil’s not cheap anymore, and it will never be cheap again” -- Click Here to Listen to the Interview “Social unrest is merely a sign. It’s a hallmark of what happens when you have an energy dependent economy, when we’ve grown our population to absolute bursting limits and we’ve all become accustomed to having lots and lots and lots of cheap energy—and guess what? Oil’s not cheap anymore, and it will never be cheap again unless the world economy completely collapses.” “[The collapse of the credit bubble] is going to be sold to us as though it was this unavoidable, awful thing that happened, and we’re going to be sold this idea that it was massive wealth destruction—like when the stock market from 2008 to 2010 lost 50% of its value. … The better way to talk about this is the coming wealth transfer.” “Our debt markets hate expensive oil. The whole model from 1980 to 2008 of growing our debts at 8% per year compounded was predicated on $20 a barrel oil. It doesn’t work on $100 a barrel oil.” “The winners are going to be those who see this coming and who start … skating to where the puck is going to be… I see where the puck is going and we’re going to have to be far more efficient, we’re going to have to use a lot less energy in the near future.” Click Here to Listen to the Interview
How the West Looks to Carve Up the Ukraine - In this Real News Network interview, Michael Hudson gives an update on the West’s resource grab in the Ukraine, as well as how the new Ukrainian leaders are imposting an apartheid state.
Stand-off over $2.2bn Ukraine gas bill - FT.com: Ukraine and Gazprom were locked in a tense stand-off over a $2.2bn gas bill, with a fresh payment deadline falling due on Monday, intensifying fears that the Russian energy giant would cut off supplies. As the deadline for payment loomed, the two sides remained far apart over outstanding debts and a new pricing regime, with no fresh negotiations over the weekend. “There has been no progress,” said Sergei Kupriyanov, Gazprom’s spokesman in Kiev. “They are not paying anything, zero.” Adding to tensions between Kiev and Moscow, authorities in the eastern city of Lugansk said on Monday that pro-Russian separatists who broke into the city’s security headquarters the previous day had seized weapons. Police have closed entrances to the city, news agencies said. Pro-Russians also seized government buildings in the eastern cities of Donetsk and Kharkiv on Sunday. The interior ministry said on Monday that the protesters had been cleared from the Kharkiv buildings. The Ukrainian government says it is willing to pay the $2.2bn bill, but reacted angrily to a move by Gazprom last week to raise the price it charges Ukraine from $268 per 1,000 cubic metres of gas to $485 and to claw back previous discounts. “We cannot deliver gas for free, so they need to pay off the debt,” said Alexei Miller, Gazprom chief executive. “They also need to pay for 100 per cent of current supplies,” he said, adding that the situation “cannot continue indefinitely”.
Fears of gas war as Ukraine refuses to pay increased prices set by Russian firm - The prospect of a new gas war between Russia and Ukraine drew closer at the weekend as the government in Kiev said it would refuse to pay for gas at a new, inflated price set by Gazprom last week. The dispute comes as tensions in eastern Ukraine remain high, with pro-Russian protesters in two cities storming government buildings on Sunday. In Kiev, interim prime minister Arseniy Yatsenyuk told the cabinet over the weekend that the new price for gas was unfair and Ukraine would not pay it. "Russia has not managed to grab Ukraine through military aggression, so now they are pursuing a plan to pressure and grab Ukraine through gas and economic aggression," said Yatsenyuk. He said that Ukraine would continue buying gas at the "acceptable market price" of $268 (£162) per 1,000 cubic metres. Last week, Russia announced two successive price hikes in gas for Ukraine, taking it up to $485.50. It is unclear what Russia will do if Ukraine refuses to pay the new price, but in the past it has shut off the supply. Last week, Gazprom's CEO, Alexei Miller, gave televised comments explaining why Russia was raising the gas price, noting that part of the discount had come when Russia extended credit to Ukraine last December as part of a package that was given to the former president, Viktor Yanukovych, for turning his back on an association agreement with the European Union. "The discount was given on the condition that Ukraine would pay all its gas debts and pay 100% for the current deliveries, and it was clearly indicated that if this did not happen, the discount would be annulled in the second quarter of 2014,"
Gazprom says no payments from Ukraine as Monday deadline looms -- Ukraine has made no payments to Gazprom despite a midnight (2000 GMT) deadline to reduce its $2.2 billion debt for natural gas supplies, the Russian gas producer said on Monday. The Ukrainian government says Russia has increased the gas price for Kiev for political reasons in a crisis over Moscow's annexation of Crimea that has fuelled East-West tensions. A Gazprom spokesman declined to say what action, if any, the company would take if Kiev did not meet the deadline - which falls on the seventh day of each month - for settling its monthly bill. "There have been zero payments from Ukraine," he said. Ukraine has missed deadlines in the past without punishment but Gazprom has suggested it might ask Kiev to pay in advance for gas if it does not meet the monthly deadline. Gazprom cut off gas supplies to Ukraine in price disputes in the winters of 2005/2006 and 2008/2009, actions which also disrupted supplies of Russian gas to Europe carried via Ukraine. Gazprom last week increased the gas price for Ukraine by 80 percent, to $485 per 1,000 cubic metres while it charges European clients $370-$380.
Ukraine fails to pay for gas on time, debt stands at $2.2-billion: Russia’s Gazprom - Russian natural gas producer Gazprom said on Tuesday Ukraine had failed to pay for its March gas supplies on time but did not say whether the company would take any action against Kiev. “They haven’t paid for March,” a spokesman said, confirming that Ukraine’s total debt of $2.2 billion had not been reduced by the deadline of midnight on Monday.Gazprom has often in the past not taken any action when Kiev failed to pay its bills on time. But it cut off gas supplies to Ukraine during price disputes in the winters of 2008/2009 and 2005/2006, disrupting supplies of Russian gas to Europe that are carried via Ukraine. Gazprom said Russian gas transit via Ukraine to Europe remained stable on Tuesday. Ukraine’s energy company, Naftogaz, declined immediate comment. Later on Tuesday, EU officials were due to meet Ukraine’s energy minister in Brussels. Relations between Kiev and Moscow have deteriorated since parliament ousted Ukraine’s Moscow-backed president on Feb. 22 following months of protests. Russian forces took over the Crimea region and Moscow then annexed it on March 21. Gazprom has almost doubled the gas price for Ukraine to $485 per 1,000 cubic metres, compared to the $370-$380 it charges Europe on average. Ukraine says the new price is unacceptable and is politically motivated.
Putin warns Ukraine on gas supplies -- President Vladimir Putin has warned Russia may begin requiring advance payment for gas supplies unless Ukraine comes to the negotiating table over its unpaid energy bills. Russia's state-controlled natural gas company "Gazprom will only send gas in the amounts that the Ukrainian side has paid for a month in advance" under the changed sale terms being contemplated, Putin said at a government meeting according to televised excerpts on Wednesday. "They will receive as much as they have paid for," he said. Russia says Ukraine now owes it $US2.2 billion ($A2.4 billion) for natural gas supplies, and Gazprom last week demanded that Ukraine "take immediate measures" to settle the debt. Prime Minister Dmitry Medvedev insisted during the meeting that the situation was "critical" and urged the government to switch to a system of advance payments. Putin, however, said that for now Russia would refrain from doing so, citing Ukraine's economic difficulties and Moscow's ongoing talks with the European Union.
Putin Warns Europe To Expect Gas Shortages If Ukraine Doesn’t Pay Debts - Russian President Vladimir Putin sent a letter to 18 European leaders Thursday saying that a dispute over Ukraine’s gas debt to Russia could impact gas distribution throughout the continent, urging them to offer financial assistance to the indebted country. “The situation in urgent,” Putin’s press secretary, Dmitry Peskov, said of Ukraine’s debt. Putin’s letter stated that Ukraine’s failure to make payments to Gazprom, Russia’s gas extractor, will “completely or partially cease gas deliveries,” exacerbating tensions between the feuding countries. Although the International Monetary Fund has already agreed to provide Ukraine with between $14 and $18 billion to avoid a default, that figure is far smaller than what Putin claims the country owes. In his letter, Putin says that Ukraine owes Russia $17 billion in gas discounts on top of a potential $18.4 billion debt due to a 2009 fine. He said that this debt grows by billions every day. “No other country provided such support except Russia,” he said, according to Russian state media, adding that European partners offer Ukraine no real support, “only promises that are not backed up by real actions.”
Putin Aims His Energy Weapon At Ukraine - Secretary of State John Kerry has accused Moscow of using ham-handed covert operations to destabilize eastern Ukraine. Russia is making no attempt to hide its latest assault on Ukraine: a sharp spike in natural gas prices designed to bring the cash-strapped country to its knees. Russian President Vladimir Putin raised the prospect Wednesday of making Ukraine pay in advance for the natural gas that it buys from Russia, a potentially ruinous move for the credit-challenged Ukrainian government. Ukraine's total gas debt to Russia now totals more than $16 billion, Russian officials said. While Putin reportedly ordered Gazprom, the big energy giant, to wait until another round of talks with Ukraine before implementing the move, the threat of making Ukraine pay upfront for its gas will become Moscow's default stance if the talks fail. Some U.S. lawmakers, such as Rep. Michael Turner (R.-Ohio.) seized on Russia's latest saber rattling to reiterate calls for the United States to expedite the export of natural gas to countries such as Ukraine. Kiev, meanwhile, took the pre-emptive move of halting its imports of Russian natural gas until the two countries can resolve a contentious dispute over prices. Moscow has jacked up the price it charges Ukraine twice in recent days by a total of more than 80 percent, making gas sold to Ukraine among the priciest in Europe.
Putin warns Europe of gas shortages over Ukraine debts: Russian President Vladimir Putin has warned European leaders that Ukraine's delays in paying for Russian gas have created a "critical situation". Pipelines transiting Ukraine deliver Russian gas to several EU countries and there are fears that the current tensions could trigger gas shortages. Russian state gas giant Gazprom says Ukraine's debt for supplies of Russian gas has risen above $2bn (£1.2bn; 1.4bn euros).Gazprom said on Wednesday it could demand advance payments from Kiev for gas but President Putin said the company should hold off, pending talks with "our partners" - widely believed to mean the EU. In a letter to European leaders, President Putin warned that the "critical" situation could affect deliveries of gas to Europe, his spokesman Dmitry Peskov said. The letter released by the Kremlin says that if Ukraine does not settle its energy bill, Gazprom will be "compelled" to switch over to advance payment, and if those payments are not made, it "will completely or partially cease gas deliveries". Mr Putin adds that Russia was "prepared to participate in the effort to stabilise and restore Ukraine's economy" but only on "equal terms" with the EU.
EU Responds To ‘Panic’ Over Russian Gas Cutoff With Plan To Help Ukraine Pay Debts - Energy Commissioner Guenther Oettinger is working on a plan to help Ukraine pay some of its gas bills to Russia, he told Austria's ORF radio on Friday, saying there was "no reason to panic" about Russian gas supplies to Europe. "We are in close contact with Ukraine and its gas company to ensure that Ukraine remains able to pay and the debts that the gas company has to Gazprom do not rise further," he said, adding he would meet Ukraine's energy and foreign ministers on Monday. "I am preparing a solution that is part of the aid package that the IMF, the European Union and the World Bank is giving to Ukraine and from which payment for open bills will be possible." Russian President Vladimir Putin warned on Thursday in a letter to leaders of 18 European countries that Russiawould cut natural gas supplies to Ukraine if it did not pay its bills and said this could lead to a reduction of onward deliveries to Europe. Oettinger advised against taking the threat at face vale, saying Russia wanted to deliver gas and needed the revenue. "Part of the bills is justified. Another part is unjustified. We will put together a package in the weeks ahead so that paying the justified open bills will be possible, but not according to Mr Putin's accounting but rather by what is contractually correct," he said.
Russian Sanctions And The Negative Effect On Global Energy Security - For the first time ever in the history of US-Russian relations we are seeing a public debate about a threat of economic sanctions that may have a long-range negative effect on global energy security. The Obama administration acts as if it is guided by a chapter out of an old Soviet textbook on political economy. At the moment, apparently, the sacred dogma of the free market, from Samuelson to Friedman, can be conveniently overlooked for the sake of punishing a sovereign nation. When the head of the most influential state in the world talks about manipulating market prices to punish recalcitrant players, what kind of “global free market” and fair play are we really talking about? After a series of headline-grabbing statements about the possibility of “switching” European consumers over to American gas, the US media hastened to announce the launch of Obama’s oil and gas offensive against Russia. In reality the EU is not currently prepared, neither technically nor in terms of price, to buy its energy resources from the US. It would take at least ten years to adapt even the technically advanced German energy system to work with American gas supply. In a crisis, when it is particularly urgent to see a quick return on an investment, such projects are unrealistic.
China Takes On Big Risks in Its Push for Shale Gas - NYTimes.com: — Residents of this isolated mountain valley of terraced cornfields were just going to sleep last April when they were jolted by an enormous roar, followed by a tower of flames. A shock wave rolled across the valley, rattling windows in farmhouses and village shops, and a mysterious, pungent gas swiftly pervaded homes.“It was so scary — everyone who had a car fled the village and the rest of us without cars just stayed and waited to die,” .All too quickly, residents realized the source of the midnight fireball: a shale gas drilling rig in their tiny rural hamlet.This verdant valley represents the latest frontier in the worldwide hunt for shale gas retrievable by the technology of hydraulic fracturing, or fracking. It is a drilling boom that has upended the energy industry and spurred billions of dollars of investment.Like the United States and Europe, China wants to wean itself from its dependence on energy imports — and in Jiaoshizhen, the Chinese energy giant Sinopec says it has made the country’s first commercially viable shale gas discovery. The energy industry around the world has faced criticism about the economic viability of vast shale projects and the environmental impact of the fracking process. But interviews with residents of six hamlets here where drilling is being done, as well as with executives and experts in Beijing, the United States and Europe, suggest that China’s search poses even greater challenges. In China, companies must drill two to three times as deep as in the United States, making the process significantly more expensive, noisier and potentially more dangerous. Chinese energy giants also operate in strict secrecy; they rarely engage with local communities, and accidents claim a high death toll.
China Commodity Demand Not Peaking, Says IMF - China’s economic deceleration has spooked commodity markets. But the International Monetary Fund, in its latest global economic report, said China’s demand for commodities is far from peaking. The IMF noted China’s rebalancing away from an investment-led economic model does not mean its consumption of commodities will tail off.Looking at growth trajectories in China, South Korea and Japan, the fund found that China’s per capita gross domestic product would need to double before that started to happen. (GDP per capita stood at $6,600 in 2013, the IMF estimates.) Instead, the IMF points out the composition of Chinese demand for commodities is likely to shift. As Beijing moves to shut down unprofitable steel factories, growth in demand for iron ore and copper should moderate. China is still importing iron ore at record levels but these imports are expected to grow at a slower pace from now on. Concerns over China demand partly explain why iron prices have fallen 12% since the start of 2014. (New supply is another factor.) By comparison, the fund said, Chinese demand for high-grade metals like aluminum used in consumer durables like cars and dishwashers is likely to prove more resilient in years ahead. “At incomes of $15,000 per capita and higher, consumption of copper and iron ore is predicted to fall more rapidly than consumption of aluminum,” the report said.
Desperate for credit, China importers default on soy cargoes (Reuters) - Chinese importers have defaulted on at least 500,000 tons of U.S. and Brazilian soybean cargoes worth around $300 million, the biggest in a decade, as buyers struggle to get credit amid losses in processing beans. Three companies in the eastern province of Shandong had defaulted on payments for shipments as they were unable to open letters of credit with banks, trade sources said on Thursday. A string of defaults on loans, bonds and shadow banking products in recent weeks has highlighted rising credit risks in China, partly fuelled by signs the economy is slowing. Commodity firms, along with semiconductor and software companies, are among the most at risk of credit defaults, a Reuters analysis of more than 2,600 Chinese companies showed. Up against the cooling economy and signs that authorities will not step in every time a loan goes bad, Chinese banks are becoming more hard-nosed and selective about whom they lend to. "There are five to six (panamax) cargoes which are unable to be unloaded at ports because buyers cannot open LCs (letters of credit) and there are no LCs for an additional 5-6 cargoes floating on the sea," one Beijing-based source said. Each panamax cargo is for 50,000 to 60,000 tonnes.
Deadbeat Chinese shipyards stick banks with default bill (Reuters) - Chinese banks are stuck in a lose-lose legal battle between domestic shipyards and foreign buyers over billions of dollars in refund guarantees that are supposed to be paid out if shipbuilders fail to deliver on time. One in three ships ordered from Chinese builders was behind schedule in 2013, according to data from Clarksons Research, a UK-based shipping intelligence firm. Although that was an improvement from 36 percent a year earlier, it was well behind rival South Korea, where shipyards routinely delivered ahead of schedule the same year. That means Chinese banks may be on the hook to pay large sums to buyers if the yards can't come through per contract, with little hope of recouping the cash from the yards. China is the world's biggest shipbuilder, with $37 billion in new orders received last year alone. Buyers pay as much as 80 percent of the purchase price upfront. Chinese bankers rushed to finance shipbuilding after the 2008 global financial crisis as Beijing pushed easy credit and tax incentives to lift the industry and sustain industrial employment levels in the face of collapsing exports. Fees generated by offering such guarantees looked like easy money until massive oversupply and falling demand started taking a toll on the yards around 2010. Shipyards fell behind schedule and buyers demanded their money back. But behind or not, the builders, keen to keep orders on the books and prepaid money in their pockets, have submitted injunctions against banks in Chinese courts to prevent them from paying out.
U.S. Warns China Over Currency Depreciation -- The United States warned Beijing on Monday that the recent depreciation of the Chinese currency could raise "serious concerns" if it signaled a policy shift away from allowing market-determined exchange rates. Washington has been pressing China for years to allow its currency to trade at stronger values. A weak yuan makes Chinese exports cheaper for U.S. consumers at the expense of U.S. producers. A weaker yuan also makes Chinese consumers less able to buy foreign goods. Last month, U.S. Treasury Secretary Jack Lew welcomed a decision by China to allow its currency to vary more against the dollar in daily trading. Monday's comments by a senior official from the Treasury Department suggested the United States was not completely sold on China's intention to reduce authorities' interventions in exchange markets. "If the recent currency weakness signals a change in China's policy away from allowing adjustment and moving toward a market-determined exchange rate, that would raise serious concerns," In comments that outlined U.S. positions before meetings later this week of the International Monetary Fund and between Group of 20 nations, the official noted the widening of China's currency trading band came just after a drop in the yuan's value that coincided with reports of "considerable intervention" in exchange markets by Chinese authorities. That is exactly the sort of behavior Washington wants Beijing to ditch.
US Treasury Warns China Over Yuan Depreciation; Treasury Hypocrites; What If? - In yet another case of blatant US hypocrisy, Bloomberg reports U.S. Treasury Warns Against China Reviving Yuan Controls. A backtracking by China in its commitment to move toward a market-determined exchange rate for the yuan would provoke serious concern in the Obama administration, a U.S. Treasury official said. China allowed the yuan to depreciate before widening the exchange-rate band on March 17. The changes occurred as China continued to build current-account surpluses, accumulate excessive foreign reserves and attract significant net foreign-direct investment, the official said today on condition of anonymity. Since the start of this year, the People’s Bank of China has guided a 2.5 percent loss on the yuan to help curb speculative bets on appreciation of the currency, What if China floated the yuan? Is it really clear given the massive Chinese malinvestments in housing, in SOEs, in infrastructure, and numerous other things, that anyone knows for certain which way the yuan would trade if it freely floated? Actually, no one can be certain of anything. That statement holds true even if there were no Chinese malinvestments in housing, in SOEs, in infrastructure, etc. The US wants China to widen its trading band on one and only one condition: the yuan rises vs the US dollar. US hypocrites say nothing about Japan's all-out attack on the Yen. Moreover, and more importantly, I have a simple question: Why is massive QE in the US acceptable when the sole intent is to drive the dollar lower and US asset prices higher?
China banks face rising bad loans - Caixin Online - — Bad loans have sharply increased for many Chinese banks as more companies struggle to make repayments, data from recent bank annual reports show. The total value of non-performing loans at 12 major banks was 467 billion yuan on Dec. 31, an increase of 76.3 billion yuan ($12.3 billion), or 19.5%, from the beginning of 2013. Earlier data from the regulator show the entire banking industry’s bad loans increased by 99.2 billion yuan last year to 592.1 billion yuan, with the average non-performing loan ratio reaching 1%, compared with the 0.95% a year earlier. The total amount of bad loans may have increased by another 60 billion yuan in the first two months of this year, an executive of a large bank said. More are expected to emerge in the second quarter, he said. The regulator has issued a notice to its regional offices and major financial institutions that requires them not to hide toxic assets or be in a hurry to call in loans, thus forcing more borrowers into liquidity problems, bankers with knowledge of the requirements said. “Bad loans in general are showing signs of spreading and contagion,” a senior banking analyst said. “In 2012, they were concentrated in relatively small industries such as trading companies. The next year, they spread to big ones and big enterprises.”
How much bad debt can China handle? - China is coming under close scrutiny these days, as the leadership scurries to find new sources of economic growth and control its debt. Some analysts have reassured China watchers that the Chinese government can simply write off its bad debt, at least within the major banks, and pass it on to the asset management companies that handle that resale of distressed debt (or have it later purchased by the Ministry of Finance). Others have warned that some of the debt is serious, such as that incurred by local government financing vehicles, and are dubious about the sustainability of these entities. To worry or unwind? How much debt can China really absorb? There are three general categories of bad debt that have been bailed out in recent years (there is other bad debt that has not been bailed out): bank loans, trust loans, and loans from smaller sectors such as informal finance and credit guarantee companies. Problems with trust loans and loans from smaller sectors have generally been handled by local governments, while bank loans have been bailed out via asset management companies funded through the Ministry of Finance. Trust loans bailed out by local governments have involved sums in the low billions of RMB, while non-performing bank loans amounted to about 1.5 trillion RMB between 2011 and 2013. The second step is to consider how well the central and local governments can cope with a potential increase in bad debt. While local governments are overly indebted, as revealed by a recent report by the National Audit Office, and have experienced fiscal shortfalls for some time, the central government has maintained relatively low deficits, even coming in under the projected deficit in 2013. The way in which the central government deals with non-performing loans is easy on the fiscal budget as long as the debt can be recovered; the worst impact of this process is that it may very lightly constrain lending, as non-performing loans are taken off books and bonds are issued and purchased by banks, changing the nature of capital held on the books. In reality, however, much of the distressed debt is not recovered, and in the past has been purchased by the Ministry of Finance. Both central and local governments, then, face issues with bailing out bad loans either directly or indirectly.
IMF Urges China To Rein In Credit, Even If Growth Slows -- Look out for a downgrade in China’s growth outlook if Beijing follows the International Monetary Fund‘s advice. The IMF says China’s financial problems are bad enough to warrant more aggressive action by authorities to rein in borrowing, even if it means lower growth than currently forecast. Without stronger oversight of China’s lending practices, the country risks a financial crisis that could send the economy into a nosedive. And that could wreak havoc on global growth, weighing particularly on other emerging markets that rely on demand from the world’s second-largest economy. Beijing is tightening oversight of the country’s shadow-banking services amid fears that bad loans may be building to dangerous levels. Chinese officials are moving too slowly, the IMF said in its latest Global Financial Stability Report released Wednesday. But the fund also doesn’t want Beijing to rein in loose lending too quickly, concerned that authorities might trigger financial panic. “It’s a balancing act,” said Thomas Helbling, a senior fund economist. José Viñals, the IMF’s financial counselor, said Beijing needs to ensure lending rates more accurately reflect risks by removing the government’s implicit guarantees for the financial system. Higher borrowing costs—and better transparency for investors–would help curb dicey loans, he says. “The challenge for policymakers is to manage the transition to a financial sector in which market discipline plays a larger role…without triggering systemic stress,” he said. “Pockets of stress have already begun to emerge, particularly in the trust sector, with spillovers to other parts of the financial sector,” the IMF warned.
40 Central Banks Are Betting This Will Be The Next Reserve Currency - As we have discussed numerous times, nothing lasts forever - especially reserve currencies - no matter how much one hopes that the status-quo remains so, in the end the exuberant previlege is extorted just one too many times. Headline after headlines shows nations declaring 'interest' or direct discussions in diversifying away from the US dollar... and as SCMP reports, Standard Chartered notes that at least 40 central banks have invested in the Yuan and several more are preparing to do so. The trend is occurring across both emerging markets and developed nation central banks diversifiying into 'other currencies' and "a great number of central banks are in the process of adding yuan to their portfolios." Perhaps most ominously, for king dollar, is the former-IMF manager's warning that "The Yuan may become a de facto reserve currency before it is fully convertible."
Reserve Currency: Is the Yuan Tearing Down the US Dollar? - So say the South China Morning Post: At least 40 central banks have invested in the yuan and several others are preparing to do so, putting the mainland currency on the path to reserve status even before full convertibility, Standard Chartered said. Twenty-three countries have publicly declared their holdings in yuan, in either the onshore or offshore markets, yet the real number of participating central banks could be far more than that, said Jukka Pihlman, Standard Chartered’s Singapore-based global head of central banks and sovereign wealth funds.Pihlman, who formerly worked at the International Monetary Fund advising central banks on asset-management issues, said at least 12 central banks had invested in yuan assets without declaring they had done so.The US dollar is still the world’s most widely held reserve currency, accounting for nearly 33 per cent of global foreign exchange holdings at the end of last year, according to IMF data. That ratio has been declining since 2000, when 55 per cent of the world’s reserves were denominated in US dollars. The IMF does not disclose the percentage of reserves held in yuan, but the emerging market countries’ share of reserves in “other currencies” has increased by almost 400 per cent since 2003, while that of developed nations grew 200 per cent, according to IMF data. Pihlman said “a great number of central banks are in the process of adding [yuan] to their portfolios”. “The [yuan] has effectively already become a de facto reserve currency because so many central banks have already invested in it,” he said.
Taiwan Protests Can’t Stop China Trade - Taiwan’s anti-trade protesters, fearful of more open commerce with China, appear unlikely to stop stronger economic ties between the neighbors. For three weeks, protesters have occupied Taiwan’s legislature to stop the passage of a services trade pact between the two governments. The protesters, led by student groups, are attempting to block a bill in the current parliamentary session, which runs to June. They claim the pact will hurt Taiwan’s small companies. Among their demands: more public involvement in the drafting process. While they may delay the bill, there’s a number of reasons to believe the two economies will move closer whether there is a pact or not. For one, China and Taiwan’s economies already are inextricably linked. About a third of Taiwan’s $300 billion per year in exports go to China, largely electronic components, petrochemicals and textiles. Many Taiwanese firms, including Foxconn, which assembles Apple Inc.’s iPhone, have set up factories in China to benefit from cheaper costs and a larger domestic market. Now, Taiwan’s banks, brokers and retailers are hoping to get better access to China’s market through the services pact. Business groups view China’s market as a way to boost the economy, which grew at just over 2% last year, hobbled by high costs and a small domestic market.
China Export Woes Point to Trade Distortions -- China’s exports were down 6.6% on year in March, confounding economists, many of whom expected growth of over 4%. What’s going on? First, it’s important to remember that China’s trade statistics in the first quarter are often skewed by the Chinese Lunar New Year holidays, when activity slows down in much of East Asia. But economists expected exports to show signs of a pickup in March, the first month not affected by the holidays, which this year fell in late January and early February. One explanation is the March data was warped by overinvoicing. This is a practice by which Chinese companies dodge capital controls by using fake export invoices to get money into the country to benefit from relatively high onshore interest rates. Beijing cracked down on the practice last spring, but over-invoicing was still prevalent in March 2013. Since then it has decreased because of tighter regulatory controls. The government’s efforts to guide the yuan currency lower this year also has diminished the attraction of such a carry trade. That could mean the year-ago comparison was artificially boosted, making March 2014’s numbers look poor by comparison. RBS estimates year-on-year export growth in March 2013 was inflated by 11.8 percentage points due to overinvoicing. The bank also thinks export growth on-year in March was 5.2% adjusting for overinvoicing.
China, Not the West, is Key to Asia’s Export Recovery - With the Lunar New Year out of the way and the harsh U.S. winter a fading memory, Asia is finally primed for an export-led recovery that will rekindle the heady growth of years past. Right? Not so fast. South Korea and Taiwan, export bellwethers and two of the first Asian countries to report trade data each month, both showed a pickup in exports in March, but only marginally so. China’s trade data, due out Thursday, is also expected to show a tepid recovery after February’s disastrous reading, with a Wall Street Journal poll predicting shipments rose 4.2% over a year ago.What gives? Many commentators have noted the changing nature of demand from the West — including the fact that this recovery, unlike past ones, has been driven not by consumption but by less import-intensive sectors like housing and energy. Less remarked is the impact of China’s slowing growth on the rest of Asia. As the major trading partner for most Asian countries – although, admittedly, a good portion of those goods are reprocessed and sent on to the West – China’s shift from double-digit growth rates to a much slower pace has become a major drag on Asian trade. A decade ago, export growth in South Korea leaped by nearly six percentage points, and by more than four percentage points in Taiwan, for each point that U.S. output grew — double or triple their sensitivity to changes in Chinese output. Now, both countries react more to changes in China’s output than America’s. The rest of Asia follows the same pattern, according to HSBC. In other words, over the past decade Asia’s exporters have become far more dependent on China’s fortunes than the West’s. Taiwan’s exports to both the United States and Europe grew 10% on-year in March, but fell 3.7% to China. South Korea’s exports rose 17% to the U.S. and 15.2% to Europe, but shipments to China grew only 4.5%. Given China’s weighting, total Taiwanese exports rose just 2% in March, and Korea’s grew 5.2%.
BOJ Cash Seen Catching Fed on Expanded Stimulus: Japan Credit - The Bank of Japan will probably boost currency in circulation by more than 50 percent by the end of 2015, catching up with the Federal Reserve, amid forecasts for extra stimulus. The monetary base will increase to 340 trillion yen ($3.27 trillion) at the end of next year, from 220 trillion yen last month, the median estimate of nine economists in a Bloomberg News survey shows. That would close the gap with the $3.91 trillion in the U.S. as of March. Reserve Bank of Australia Governor Glenn Stevens said last month the BOJ may soon outpace the Fed if it adds to so-called quantitative easing. Pressure is building on BOJ Governor Haruhiko Kuroda as the first sales-tax increase in 17 years wrecks consumer confidence in the world’s third-largest economy, while sentiment among large manufacturers trails forecasts. Forty-four percent of economists in a separate survey say policy makers, starting a two-day meeting today, will add to easing in July. “The BOJ will continue with QE and actually increase the pace of expansion of the monetary base,” . “Each component of its current package will be increased proportionately. The Fed may raise rates a bit more aggressively than what the market is expecting.” Capital Economics expects Japan’s monetary base to expand to 370 trillion yen by the end of next year, or $3.56 trillion at current exchange rates, while that of the U.S. will be at $4 trillion. The BOJ is currently conducting money market operations so that the balance will increase at an annual pace of 60-70 trillion yen.
BOJ to Markets: Don’t Hold Your Breath - The Bank of Japan sent a clear message Tuesday to markets looking for an imminent new round of stimulus from Tokyo: Don’t hold your breath. Despite softening growth, stalled markets, and the hit from an April 1 tax hike, BOJ Gov. Haruhiko Kuroda gave a consistently glass-half-full assessment of the Japanese economy and his year-long campaign to end deflation. The labor market was improving faster than expected, and was nearing his assessment of full-employment, he said at a news conference following the central bank’s monthly policy meeting. He saw no surprising post-tax slump, and that he expected any negative effects would wane by summer. While most private economists remain skeptical that he can hit his goal of 2% inflation in two years, Mr. Kuroda said he remained “as convinced as before” that he was on track, and noted that surveys show business executives more bullish than market naysayers. The lack of action this time was no surprise. After all, the sales tax increase — to 8% from 5% — has been in effect for less than a week. But Mr. Kuroda’s sunny outlook seemed to damp anticipation of more BOJ easing later this spring. One sign of shifting expectations: Shortly after Mr. Kuroda started talking — the first time the BOJ allowed live coverage of a press conference, scrapping the old time-delay embargo rules — the yen gained steadily against the dollar. BOJ easing policy has generally been associated with the yen’s sharp drop over the past year. The more yen the BOJ is expected to inject into the economy, the cheaper the yen gets. So does that mean a new round of BOJ stimulus is off the table? No. Most BOJ watchers still expect Mr. Kuroda to decide at some point this year to expand further the bank’s purchase of assets like bonds and stocks — its chief policy tool, with interest rates already at zero. Officials have made clear they’re on heightened vigilance this month for any sharp post-tax deterioration, and won’t blindly wait for a full quarter’s worth of data before they feel free to act.
The Anti-Abenomics Argument, in Full - WSJ - Last week, Kunio Okina, a former Bank of Japan official widely considered Japan’s most influential monetary economist in the 1990s and 2000s, delivered a speech warning of the long-term risks from Abenomics.Mr. Okina, now an economics professor at Kyoto University, recently has stepped up the pressure against Prime Minister Shinzo Abe’s one-year-old policy of extraordinary monetary easing and fiscal spending.His argument revolves around the dangers of exiting the monetary stimulus. When inflation starts to climb, the BOJ could curb its bond buying to steer interest rates higher. But that would raise the cost of Japan’s huge public borrowing and hurt the value of government bonds in the BOJ’s portfolio. To see Mr. Okina’s full presentation from last week, click here.
Hope in Deflation Fight as Japan Prices Rise After Tax Increase - Those skeptical that prices can climb any higher in the land of deflation may be surprised, Japan-watchers say. An index that uses data from supermarkets to track daily prices across Japan shows that prices of everyday items from bread to batteries are still climbing, despite the sales tax rising to 8% from 5% on April 1. That could suggest an upside for prices in coming months, economists say. Private economists expect inflation, stripping out the effect of the tax rise, clock in at about 1% for the year ended next March. But they also had forecast a big fall in consumer demand immediately after the higher tax took effect. That prices are still rising in the early days after the tax increase shows businesses may think household spending will hold firm enough that they can raise prices a little extra. Prices of grocery items have risen from a year earlier for six days since April 1, excluding the effects of the sales tax, according to the UTokyo Daily Price Project. On April 1, prices rose 0.8% on year. “This shows that stores are passing on price increases to customers,” said University of Tokyo professor Tsutomu Watanabe, who helps run the price index project. He said he was initially surprised at the increase, after prices slumped in March as stores pushed pre-tax-rise sales. The University of Tokyo’s system uses data from a list of more than 200,000 items scanned at about 300 supermarkets across Japan.
Japan consumers shun shops after tax hike -- Japanese consumers are keeping their wallets firmly closed after the first sales tax rise in 17 years, with luxury items and appliances suffering as one major department store reported a 25 per cent drop in sales. The precipitous plunge comes after millions of shoppers made a last-minute dash to stores before the national levy rose to 8.0 per cent from 5.0 per cent on April 1, a rise that sparked fears of a drop in consumer spending in turn derailing Japan's nascent economic recovery. Like many retailers, department store Takashimaya had seen a big jump in sales last month, with demand particularly brisk for handbags and other luxury items ahead of the rate hike - seen as critical for containing Japan's spiralling national debt. On Wednesday, it said sales were down about one-quarter in the first week of April compared with a year ago. Other major department stores including Mitsukoshi and Sogo have seen sales drop off between 10 per cent and 20 per cent, while Bic Camera - Japan's biggest consumer electronics and appliance chain - said demand was stronger than expected, although sales were still down as much as one-fifth in some cases.
Japanese Exporters Keeping Overseas Prices Steady, Despite Yen’s Drop - The value of Japan’s exports in yen terms rose at its fastest pace in 33 years last year, but Japanese companies avoided reducing the prices of products overseas, to take profits instead of seeking a bigger slice of the market, a study by the Nikkei major business daily found. Japan’s yen-denominated export prices rose 9.3% last year, the sharpest rise since 1980, according to the study, which looked at a broad measure of prices on shipped products. A major factor behind the sharp rise was the approximately 20% decline in the yen’s value against the dollar from November 2012 through the end of 2013. In similar past situations, Japanese companies have often slashed the prices of goods they sell overseas, looking to pick up greater market share. In the past, a 20% weakening of the yen might have translated into a 17% reduction in overseas prices, the study showed. But this time, the cut has only been about 6%. Companies have been trying to maximize profits by not cutting prices, the Nikkei said, quoting an official at the Cabinet Office, which issues various economic data, including gross domestic product figures. This decision by manufacturers also reflects their current survival strategy. As cheaper rivals from lower-cost manufacturing centers like South Korea and Taiwan force them out of markets for mainstream consumer products like TVs, they are focusing more on making value-added products in Japan, like smart phone displays and carbon fiber for aircraft and vehicles, which are then aggressively shipped overseas. In fact, Ministry of Finance data show companies’ profits rose 4.9% during the October-December period last year, a testament to the improving earnings. The Nikkei concludes this was behind companies’ decision to increase workers’ wages in response to a request from Prime Minister Shinzo Abe, who saw this as key to pulling the economy out of deflation.
Japan Trade Situation Remains Shaky - Japan’s current account swung back to surplus in February for the first time in five months. But it remains unclear whether the nation will continue to post surpluses as it has done for decades. Japan’s import bill has skyrocketed due to large fuel import needs in the wake of the Fukushima nuclear disaster and a weak yen. Japan’s income on overseas investment has remained larger than interest and dividend payments to foreigners. But this surfeit on the investment account hasn’t been enough in recent months to counterbalance the trade shortfall, creating a string of current-account deficits late last year and breaking a decades-long run of surpluses. Why does this matter? Japanese public debt, at more than twice the size of the economy, is manageable because the government doesn’t rely on foreigners to fund these borrowings. If the current account deficit widens, that would make the nation dependent on foreign funding, potentially pushing up interest rates and making a fiscal crisis a possibility. The figures for February offer some comfort to those that say Japan’s current account can return to positive territory. The current account swung to a surplus of Y612.7 billion, the first time it’s been in the black since September. The trade balance remained in deficit, but it narrowed. (On a seasonally-adjusted basis, the current account remained in a small deficit.) Exports picked up, likely because of increased demand following the end of the Chinese Lunar New Year holidays. Income earned by Japanese companies overseas and from foreign portfolio investments by Japanese investors also rose significantly. The trade deficit should narrow further in the months ahead as the government’s sales tax increase, which took effect April 1, constrains consumer demand for imported goods.
USTR Froman’s Attack on Japan Set TransPacific Partnership Negotiations Back Further - In case you missed it, on Wednesday the US Trade Representative (USTR) Michael Froman attacked Japan in front of Congress for undermining the TransPacific Partnership via refusing to give much ground on protection of its agricultural sector. Not to pat myself on the back, but I’d told you that this was how it was likely to play out based on various accounts in the Japanese press. So how are the Japanese responding to this US sniping? while it’s getting mentions in all the usual suspect news outlets (Asahi Shimbun, Yomiuri, the JP Reuters wire and so on), because it is contemporaneous reporting the Japanese media are doing their usual routine of simply trotting out the undisputable facts and not adding any editorial. They’ll get round to writing a bit of opinion in a week or two when they’ve collectively worked out what their opinion should be. But there is one pretty remarkable thing in the Japanese coverage – certainly that which has gone to press in the past couple of days since the Congressional hearing – and it isn’t so much as what is being reported as what isn’t. Reading the Financial Times’ version of events, we get the pleasure of the full version of Froman’s throwing his toys out of the pram. Not so in the Japanese media’s reporting. Here is the Yomiuri Shimbun’s take on the story (translated):At the 3rd hearing of the U.S. House of Representatives Ways and Means Committee, US Trade Representative Michael Froman testified about the current situation and the outlook for the Trans-Pacific Economic Partnership Agreement (TPP) negotiations. For trade talks between Japan and the United States, Froman said the US “is dedicated to bridging the gap (between Japan and the US) in agricultural products and in the automotive field” and said he was minded to speed up the negotiation process. Clive here: Having read an awful lot of coverage, both in the US and Japanese media, of the TransPacific Partnership negotiations, one thing which is becoming a consistent theme is USTR Froman’s seemingly unshakable belief that he is entitled to secure an agreement on the TPP and that the role of the other countries participating in the negotiations rounds is simply to roll over and have their tummies tickled by the US. Which may account for the lack of progress… back to the original piece..
Japan, US trade talks fail to close gap -- Intensive talks between Japan and the US aimed at breaking the deadlock over a huge pan-Pacific trade deal has ended without agreement, as hopes faded of progress before Barack Obama arrives in Tokyo this month. US Trade Representative Michael Froman and his Japanese counterpart Akira Amari said 18 hours of discussions had done little to reduce the distance between them, especially on farm and auto products. "We made some progress over the last two days but still considerable differences in positions and key issues remain", Froman told reporters on Thursday. "We agreed today that our negotiators will continue until the end of the week (with) the discussion on agriculture and autos," he said. Amari separately told reporters the two sides, already major trade partners, had made some progress. "We still don't see where we will find common ground on each sector," he added.
India Central Bank Gov. Rajan Criticizes Fed Officials - - India’s central bank chief Thursday criticized U.S. Federal Reserve officials for not expressing more concern about the financial turmoil their low-interest rate policies have unleashed in emerging market economies. Reserve Bank of India Governor Raghuram RajanAssociated PressRaghuram Rajan criticized the Fed for failing to include in its January policy statement any mention of the volatility in emerging markets at the time, saying that it seemed to suggest that the Fed would go its own way without paying much attention to what was happening abroad. Yet in private discussions, Fed officials made clear to him that “the Fed is sensitive,” he said, speaking on a panel at the International Monetary Fund’s spring meetings in Washington. He said it would be good if these private assurances were included in the Fed’s public communication about how it is thinking about policy decisions. In addition, it would be useful for the Fed to articulate how its decisions might change based on developments outside of the U.S., he said. Mr. Rajan’s comments appeared to ratchet up complaints he has made in recent months about the effects on emerging markets caused by the Fed and other central banks in advanced economies.
RBI’s Raghuram Rajan Takes His Campaign to Washington - India’s inflation-fighting crusader, Reserve Bank of India Governor Raghuram Rajan, brought his campaign to Washington D.C. on Thursday, warning people that the world’s central bankers need to be more aware of the international spillover effects of their easing policies. In a long-winded speech–which ran for 12 pages with extensive foot notes and references—at the Brookings Institution in the U.S. capital, Mr. Rajan outlined the dangers of what he called “competitive monetary easing.” He criticized the U.S. Federal Reserve officials for not expressing more public concern about the financial turmoil their low-interest rate policies have unleashed in emerging market economies“Such competitive easing occurs both simultaneously and sequentially, as I will argue, and both advanced economies and emerging economies engage in it. Aggregate world demand may be weaker and more distorted than it should be, and financial risks higher,” he said. “To ensure stable and sustainable growth, the international rules of the game need to be revisited. Both advanced economies and emerging economies need to adapt, else I fear we are about to embark on the next leg of a wearisome cycle.” His conclusion was that central banks needed to be more aware of other countries and had to try to coordinate when possible. “A first step to prescribing the right medicine is to recognize the cause of the sickness. Extreme monetary easing, in my view, is more cause than medicine. The sooner we recognize that, the more sustainable world growth we will have.” For the full text of the speech as it was released from the Reserve Bank of India click here.
Global Monetary Policy: A View from Emerging Markets - Brookings - Webcast - The Federal Reserve’s moves to scale back its purchases of long-term bonds, a first step towards the exit from more than five years of unconventional monetary policy, has contributed to recent turmoil in financial markets around the world and provoked complaints from some emerging markets. Are the Fed and its counterparts in Europe and Japan insufficiently sensitive to the impact their moves have on emerging markets? Are emerging markets blaming the Fed for their own policy sins? Are financial markets overreacting? Can global economic-policy coordination be strengthened? Should it be? On April 10, the Hutchins Center on Fiscal and Monetary Policy at Brookings hosted Raghuram Rajan, India’s central banker to discuss emerging markets’ perspective on advanced-economy monetary policies, a subject on which he has been very outspoken lately. Responding to Gov. Rajan’s remarks was Charles Evans, president of the Federal Reserve Bank of Chicago; Vitor Constancio, vice president of the European Central Bank; Alexandre Tombini, governor of the Central Bank of Brazil; and Eswar Prasad, the New Century Chair in International Trade and Economics and a senior fellow in Brookings’ Global Economy and Development program. The discussion was moderated by David Wessel, director of the Hutchins Center on Fiscal and Monetary Policy and a senior fellow in Economic Studies.
World Bank: Developing Asia to Grow 7.1% This Year - The World Bank is betting a recovery in industrialized-nation demand will help bolster growth this year in export-dependent Asia. The bank, in a twice yearly report on the state of East Asia’s economy, said it expects developing Asia’s economies to expand by an average 7.1% this year, largely unchanged from 2013. China will grow 7.6%, down from 7.7% in 2013, the bank said. The report noted the U.S. reductions this year to its bond-buying program, which should push U.S. yields higher over time, hasn’t led to big losses for Asian markets so far in 2014. “Stronger global growth this year will help the region expand at a relatively steady pace while adjusting to tighter global financial conditions,” Axel van Trotsenburg, a World Bank vice president for East Asia. Still, developing Asia is growing much slower than an average rate of 8% between 2009 and 2013.Many economists say the rebound in the global economy so far this year hasn’t lifted Asia as much as expected. It is unclear whether stronger growth in the U.S.–and Europe’s exit from recession last year–are feeding through into stronger demand for Asia’s exports. Exports from South Korea, a major exporter of technology and electronic equipment, were up only 2.2% from a year earlier in the first quarter, for instance. Some sectors, such as exports of smartphone parts, have performed better. Taiwan’s overall exports were up only 0.4% from a year earlier in the first two months of 2014, while electronic product exports rose 12.7%, according to CLSA. Taiwan is a major exporter of parts for smartphones. Taiwan will report March trade figures later Monday.
Australia's House Prices 'Flashing Red', Debt to Income at Record Level - Australia's housing bubble is back in full swing. Prices rose almost 11 percent over the past year to record levels in absolute terms and near-record levels as a share of household income. Prices in Sydney rose 15 percent. Household debt as a percent of income surpassed the previous record. WAtoday reports Australia's house prices 'flashing red', debt to income ratio at record levels. Australian household debt has hit a record 177 per cent of annual disposable income while housing valuations are "flashing red", according to Barclay's chief economist, Kieran Davies. "House prices now equate to 4.3 times annual income and 28 times annual rent, both within a fraction of their historic highs," Mr Davies said.
Death knell sounds for Brazil’s economic strategy - FT.com: Until recently, the government of Brazil’s President Dilma Rousseff talked glowingly about a “new matrix” of economic policies that would revive the country’s faltering growth story. This strategy, consisting of historically low interest rates, a weakened exchange rate engineered partly through currency controls and temporary tax breaks for industry, was meant to restore Brazil to a 4 per cent growth rate. This month, however, the death knell seemed to sound on the new economic matrix. Persistent inflationary pressures have forced Brazil’s central bank to jack interest rates back up from a record low of 7.25 per cent in 2012 to 11 per cent last week, with the possibility of more increases to come. With growth still fragile and the government’s credibility on the line following a credit rating downgrade last month by Standard & Poor’s, the question facing investors in Brazil now is how quickly can policy makers unwind the new economic matrix and return to more orthodox ways, assuming they have the political will to do it. Most economists believe Ms Rousseff’s government began to stumble in 2012 after the start of the eurozone crisis. With the global economy still weak and the US Federal Reserve still pumping liquidity via its quantitative easing programme, the government began a campaign to reduce interest rates to what were for Brazil unprecedented lows. At the same time, the government unleashed unorthodox measures to curb inflation which threatened to upset its strategy of low interest rates. The most prominent was to unofficially force Petrobras, the state-owned oil company, to sell fuel imported at international prices for subsidised rates in Brazil. The government also intervened to reduce electricity tariffs, and city and state governments public transport fares following street protests last year. However, policy makers also introduced contradictory policies that stimulated inflation, such as supporting a weaker currency against the dollar, and stimulating industry and consumer demand through temporary tax breaks.
Venezuela rationing food to combat shortages - Due to a severe shortage of basic food supplies in Venezuela, people are hoarding what they can. It has forced the government to begin a food rationing, seeing many Venezuelans queuing up to register for this new programme. Al Jazeera's Mariana Sanchez in Caracas reports on the looming crisis.
Baltic Dry Collapses To Worst Start To A Year On Record - (charts) If you listen very carefully, you will still hear absolutely nothing from any talking-heads of the utter collapse that the last few weeks have witnessed in the Baltic Dry shipping index. The Baltic Dry has dropped 12 days in a row and plunged back to $1061 - its lowest since August 2013. This is the worst start to a year on record... must be the weather.
Shipbuilding Orders Evaporate As Baltic Dry Collapses -- The silence is deafening still about the ongoing collapse in the Baltic Dry Index among mainstream media types (as it just might challenge the hope/hype that growth is coming back). At the dismal level of 1002, BDIY is at 8-month lows and has fallen 14 days in a row... but now it is having a real world impact. . As Sea News reports, Korean shipping companies are failing to place orders for large vessels and anxiety over the future is forcing some local companies to dispose of their assets despite the relatively low shipbuilding costs as of late. The Baltic Dry is down 14 days in a row at $1002 - its lowest in 8 months (and worst start to a year on record)
Global Growth Threatened in $693 Trillion Derivatives Review -- Global regulators’ failure to align efforts to reform the $693 trillion derivatives market threatens to undermine economic growth, according to the International Swaps & Derivatives Association. . In the U.S. traders have been reporting derivatives transactions to data repositories and have been required to have central clearinghouses back their contracts since last year, while European regulators are still defining the requirements. Rules introduced after the collapse of Lehman Brothers Holdings Inc. to reduce systemic risk have increased transparency, though they’ve also made hedging more expensive, according to an ISDA survey published yesterday. Legislators say the changes will enhance their ability to monitor risk taking, curb market abuse and make it easier to identify holdings when a financial institution fails. “People who need to conform to the rules are without a doubt incurring increasing costs and complexity,” “As an international company working with international counterparties, we want regulation to be pretty consistent worldwide.” In the wake of the financial crisis, G-20 leaders agreed to seek to push trading as much as possible through central clearinghouses and onto regulated platforms. The U.S. Dodd-Frank Act mandated that most swaps be backed with a clearinghouse and traded on swap execution facilities, or SEFs, and that all trades be reported to central repositories. The clearing and reporting mandates went into effect last year. Measures are already in place in several other nations including Brazil and Japan.
IMF Sees Rising Risks for Emerging Markets’ Corporate Debt - Years of cheap credit have inflated corporate and sovereign debt in emerging markets that now find themselves at greater risk of capital flight if global interest rates rise further, the International Monetary Fund said. While the IMF predicts a smooth withdrawal of monetary stimulus by the Federal Reserve, a “bumpy exit” is possible, Jose Vinals, the head of the IMF’s capital markets department, said in prepared remarks. The result could be a faster-than-anticipated increase in interest rates, widening credit spreads and greater financial volatility, he said. “Emerging markets are especially vulnerable to a tightening in the external financial environment, after a prolonged period of capital inflows, easy access to international markets, and low interest rates,” Vinals said in remarks accompanying the release of the IMF’s Global Financial Stability Report. Years of low interest rates in advanced economies have encouraged global investors to seek higher yields in fast-growing developing countries. Investment from advanced economies into emerging-market bonds reached an estimated $1.5 trillion by the end of 2013, the IMF said. Emerging-market corporate debt tripled from 2009 to 2013, with debt levels in countries such as China, Hungary and Malaysia reaching or exceeding 100 percent of gross domestic product.
IMF trims global growth forecast on Russia, Brazil - The International Monetary Fund on Tuesday trimmed its global economic growth forecast for this year and next, after slashing estimates of Russian and Brazilian growth. The IMF took down its estimate of global growth for 2014 and 2015 by 0.1 percentage point in each year, to 3.6% in 2014 and 3.7% in 2015, after 3.3% growth in 2013. The IMF's Russian forecast was lowered to 1.6% in 2014 and 2.5% in 2015, drops of 0.6 percentage points and 0.2 points respectively, and the IMF's Brazilian forecast was pared to 2% in 2014 and 2.9% in 2015, a drop of half a point this year and 0.2 points in 2015. The IMF still sees U.S. growth of 2.7% in 2015 and 3% in 2015.
As Demand Improves, Time to Focus More on Supply - Olivier Blanchard - In our recent World Economic Outlook, we forecast world growth to be 3.6 percent this year and 3.9 percent next year, up from 3.0 percent last year. In advanced economies, we forecast growth to reach 2.2 percent in 2014, up from 1.3 percent in 2013.The recovery which was starting to take hold in October is becoming not only stronger, but also broader. The various brakes that hampered growth are being slowly loosened. Fiscal consolidation is slowing, and investors are less worried about debt sustainability. Banks are gradually becoming stronger. Although we are far short of a full recovery, the normalization of monetary policy—both conventional and unconventional—is now on the agenda. Brakes are loosened at different paces however, and the recovery remains uneven. It is strongest in the United States, where growth is forecast to be 2.8 percent in 2014. It is also strong in the United Kingdom and Germany, where some imbalances persist, but where we forecast growth to be 2.9 percent and 1.7 percent respectively. In Japan, where we forecast 1.4 percent growth in 2014, fiscal stimulus has played a large role, and the strength of the recovery depends on private demand taking the relay. And, going back to the Euro area, the good news is that, for the first time in two years, Southern periphery countries are forecast to have positive, if admittedly still low, growth. But, while their exports are generally strong, internal demand is still weak, and it has to become stronger for the recovery to be sustained. Emerging and developing economies continue to have strong growth, lower than before the crisis, but high nevertheless. We forecast their growth to reach 4.9 percent this year, slightly up from 4.7 percent last year. In particular, we forecast growth of 7.5 percent for China, and 5.4 percent for India. Of particular note is the performance of sub Saharan Africa, where we forecast growth of 5.4 percent
IMF Chief Economist Blanchard: Global Recovery Strengthening Despite Risks From Europe, Japan -- The International Monetary Fund on Tuesday trimmed its forecast for world economic growth as weak recoveries in Europe and Japan, alongside continued emerging-market struggles, restrain the global recovery. Despite the downward revision, IMF chief economist Olivier Blanchard remained upbeat in an interview about the global outlook. Here are excerpts:
- On the world outlook: “The recovery is strengthening. It’s becoming broader in advanced economies. … Fundamentally, I think the economy is in good shape.”
- On threats to growth: “I don’t see any acute risks like there were in the past. … In general, risks have decreased. The main risks are the next stage of the Japanese recovery and the strength of the recovery in the euro area.”
- On U.S. prospects: “The recovery in the U.S. is very strong. There are no brakes on U.S. growth. It’s an economy that is fundamentally robust.”
- On the euro zone: “While there is growth, there is still tension. Exports are doing quite well, but internal demand is weak. It’s a fight between these two forces.”
IMF: World economy gains but faces threats from too-low inflation -- The global economy is strengthening but faces threats from super-low inflation and outflows of capital from emerging economies, the International Monetary Fund warned Tuesday. The lending organization expects the global economy to grow 3.6 per cent this year and 3.9 per cent in 2015, up from 3 per cent last year. Those figures are just one-tenth of a percentage point below the IMF's previous forecasts in January. The acceleration is being driven mostly by strong growth in advanced economies, including the United States and the United Kingdom, and a modest recovery in the 18 nations that use the euro currency. By contrast, developing nations, particularly Russia, Brazil and South Africa, are now expected to grow much more slowly than the IMF forecast three months ago. Russia's economy will likely suffer as a result of its fight with the U.S. and Europe over the Ukraine. Others face high interest rates, which are intended to fight inflation but could slow growth. The IMF, in its World Economic Outlook report, sharply upgraded its growth forecasts for the U.K., Germany and Spain. It expects the eurozone to grow 1.2 per cent in 2014 and 1.5 per cent in 2015 after shrinking 0.5 per cent last year. Both estimates are one-tenth of a percentage point higher than the IMF's January forecasts. The IMF made no changes to its forecasts for U.S. growth, which it estimates at 2.8 per cent this year and 3 per cent in 2015.
Will Real Interest Rates Bounce Back? The world economy has been going through a period with extremely low real interest rates in the last few years, and the IMF examines the causes and likely future patterns in Chapter 3 of the most recent World Economic Outlook report: "Perspectives on Global Real Interest Rates." Here's a figure to get a sense of real interest rates in the last few decades. The blue line shows the nominal interest rate paid on 10-year government bonds: it's an average for the United States, Germany, France, and the United Kingdom. The red line shows average annual inflation across these countries. The spike in global inflation in the 1970s meant that real interest rates were near-zero for a few years. But after inflation dropped in the mid-1980s, real interest rates were positive until the global financial crisis; for example, around 2000 real interest rates were typically in the range of 3-4%. But in the aftermath of the global financial crisis, real interest rates have been near-zero.a rise in the supply of savings going into the low-risk government bonds or a fall in the demand for borrowing, or both, could result in a lower real interest rate. Increases in the supply of saving at the global level can come from higher private saving, higher government saving (that is, lower budget deficits or budget surpluses), or monetary policy. The demand for borrowing can come from private-sector investment demand or from a shift in portfolios in which many investors looking for lower risk decide to shift some of their funds toward government bonds and away from other assets. After looking at the data, the IMF lays out the main patterns over time this way:
Lawrence Summers: An agenda for the IMF - The world’s finance ministers and central bank governors will gather in Washington this week for the twice-yearly meetings of the International Monetary Fund. While there will certainly not be the sense of alarm that dominated these meetings for a number of years after the financial crisis, the unfortunate reality is that the medium-term prospects for the global economy have not been so problematic for a long time. In its current World Economic Outlook , the IMF essentially endorses the secular stagnation hypothesis — noting that the real interest rate necessary to bring about enough demand for full employment has declined significantly and is likely to remain depressed for a substantial period. Without robust growth in industrial world markets, growth in emerging economies is likely to subside eve In the face of inadequate demand, the world’s primary strategy is easy money. Base interest rates remain at essentially floor levels throughout most of the industrial world. While the United States is tapering quantitative easing, Japan continues to ease on a large scale and Europe seems to be moving closer to taking such a step. All this is better than the kind of tight money that in the 1930s made the Depression great. But it is highly problematic as a dominant growth strategy. We do not have a strong basis for supposing that reductions in interest rates from very low levels have a large impact on spending decisions. We do know that they strongly encourage leverage, that they place pressure on return-seeking investors to take increased risk, that they inflate asset values and reward financial activity. The spending they induce tends to come at the expense of future demand. We cannot confidently predict the ultimate impacts of the unwinding of massive central bank balance sheets on markets or on the confidence of investors. Finally, a strategy of indefinitely sustained easy money leaves central banks dangerously short of response capacity when and if the next recession comes. A proper growth strategy would recognize that an era of low real interest rates presents opportunities as well as risks and would focus on the promotion of high-return investmentsn without considering the political challenges facing countries as diverse as Brazil, China, South Africa, Russia and Turkey.
US slams Europe’s plan to build anti-snooping system - US officials on Friday blasted plans to construct an EU-centric communication system, designed to prevent emails and phone calls from being tapped by the NSA, warning that such a move is a violation of trade laws. Calling Europe’s proposal to build its own integrated communication system “draconian,” the office of the US Trade Representative (USTR) said American tech companies, which are worth an estimated $8 trillion per year, would take a financial hit if Brussels gives the initiative the green light. European countries – notably Germany and France - are desperate to get a handle on their own networks without relying on a meddlesome middleman in the aftermath of Edward Snowden’s whistle-blowing activities at the National Security Agency, which proved that much of the world’s telecommunication meta-data is being stored away in the United States. Germany’s outrage over the revelations hit full stride last month when Der Spiegel, the popular daily newspaper, asked if it is time for the country to open a formal espionage investigation following yet more disclosures that Britain's GCHQ infiltrated German internet companies and the NSA collected information about German Chancellor Angela Merkel in a special database. Now, US trade officials are up in arms over proposals by Germany's Deutsche Telekom (in which the German government owns less than 30 percent), to avoid passing communications to the United States, saying the move would give European companies an unfair advantage over their US colleagues.
Ukraine, a Fascist Coup? - Ukraine is burning, it is going to the dogs; it has been taken over by an illegitimate government engorged with fascists, neo-Nazis and simple pro-Western opportunists, as well as countless EU and US-sponsored members of various NGO’s. The West has destabilized an entire nation, supporting right-wingers and fascists. Then it began spreading anti-Russian propaganda, even before Crimea had voted to join its historic homeland. Everything was well planned, with Machiavellian precision. The EU was hoping to get its hands on the abundant natural resources, heavy industry and a well-educated and cheap labor force. In exchange, it was willing to give… nothing. No sane government would be willing to accept such a deal. Therefore, the only way to push through its agenda, the West began supporting violence and terror, as well as the fascist, neo-Nazi groups. A similar approach is being used by the US and EU in Venezuela, Syria and even Thailand. Just a few days ago, I concluded my 2,000-kilometer drive, from Kiev to Odessa, and then to the border with Transnistria and Kharkov. I visited destroyed and abandoned villages – a result of the ‘collapse of the Soviet Union’ and Ukrainian flirtation with the market economy, its obedience to the IMF and World Bank. I spoke to workers at an enormous steel plant in Krivoi Rog, located in the country’s industrial heartland. I met several leading intellectuals at the university city of Kharkiv, and I stood on the Ukrainian-Russian border, observing and photographing several Ukrainian tanks and armored vehicles. All that I witnessed will be included in my in-depth report, which will be published, next week, in CounterPunch. But right now, I would like to share some images with our readers. Those that I took, and those taken by two brave Ukrainian reporters: Andriy Manchuk and Andrey Nedzelnitsky.
The Kamikaze Economics and Politics of Forcing Austerity on the Ukraine -- William K. Black -- We all understand why Russia is waging economic war on the Ukraine, but why is Obama doing so? The New York Time’ web site has posted a remarkable Reuters story entitled “Ukraine PM Says Will Stick to Austerity Despite Moscow Pressure.”“The Kiev government will stick to unpopular austerity measures ‘as the price of independence’ as Russia steps up pressure on Ukraine to destabilise it, including by raising the price of gas, Prime Minister Arseny Yatseniuk told Reuters.” “Unpopular austerity measures” are, of course, among the best things Ukraine can do to aid Russia’s effort to “destabilize” the Ukraine. Indeed, Yatseniuk admits this point later in the article.“The subtext of Russia’s message to Ukraine’s Russian-speaking population, he said, was that they would enjoy higher living standards in Russia, with higher wages and better pensions and without the austerity that the Kiev government was now offering. ‘They’re saying: if you go to Russia, you’ll be happy, smiling, and not living in a Western hell,’ he said. ‘They (the Russians) are trying to compensate (for the Western sanctions). But we can pay the price of independence,’ he said, with financial support from the West.” So, our strategy is to play into Putin’s hands by inflicting austerity and turning the Ukraine into “a Western hell.” Not to worry says our man in Kiev, because he’s sure that ten million ethnically-Russian citizens of Ukraine will gladly “pay the price of independence” to live in “a Western hell.” That strategy seems suicidal. Indeed, Yatseiuk emphasizes that he knows the strategy he is following is suicidal.
French Socialists Revolt Against Prime Minister, Threaten Vote of No Confidence - Further compounding president Francois Hollande's problem with the European Commission Rejection of France's Proposal for Deficit Target Leniency, the socialists are in open revolt against new Prime Minister Manuel Valls. The socialists consider Valls as too pro-business. They want less austerity and a reduction in personal taxes, not corporate taxes. And they are against Hollande's "responsibility pact" proposal that would reduce labor costs and cut government spending. Via translation from Les Echos, please consider Socialist MPs Threaten a Vote of No Confidence on Account of Valls Nearly a hundred of Socialist deputies signed a document calling for political change of course and threaten a vote of no confidence in the government on Tuesday. The members of parliament (MPs), groggy out of defeat in local elections, gain momentum to contest the elements of "pact of responsibility." Jean-Marc Germain, leader of "rebuilders" and very close to the mayor of Lille Martine Aubry, warned Friday that 65 members wanted to get "insurance", including a stronger role for Parliament. Ranks have swelled with the release of a "contract of majority" launched by Pouria Amirshahi among others, Jean-Marc Germain or Laurence Dumont, Vice-President of the Assembly. This text calls for the Government to consult further their majority and to reorient its policy and that of Europe to fight austerity, investing directly for employment and to favor a "demand shock" through measures favor of purchasing power.
Pressure on France to reduce deficit in line with EU target - German finance minister Wolfgang Schäuble has warned his new French counterpart, Michel Sapin, that the rest of Europe expects Paris to stick to its agreed timetable to reduce its deficit. After French president François Hollande appointed him last week, Mr Sapin called for more time to bring France’s deficit – 4.3 per cent of national output last year – in line with the EU’s 3 per cent ceiling. Yesterday, on his first visit to Berlin, he was less outspoken, calling for “a balance between the necessary respect for commitments and growth”. “We all know the way out of the crisis will be, first of all, for us to stick to our commitments and secondly through higher economic growth,” he said at a joint press conference with Mr Schäuble. “France knows its responsibility,” said the German finance minister, adding that sustainable growth and stable finances were “not alternatives but two sides of the same coin”.
Spanish Yields Below America’s as Rally Breaks New Ground - The next time Spain sells five-year debt, it may borrow the cash at a lower rate than the U.S. pays. Yields on the Spanish notes fell below those of their U.S. equivalents today for the first time since 2007, the latest milestone in this year’s rally among the bonds of Europe’s most indebted nations. The Iberian country’s rate was more than 7 percentage points above its U.S. counterpart in 2012, before European Central Bank President Mario Draghi pledged to protect the euro, allaying concern the currency bloc would splinter. Government bond yields from Ireland to Italy fell to records today on speculation that inflation at a four-year low will push the ECB to expand stimulus measures. Draghi said yesterday officials have discussed further options, including asset purchases, or quantitative easing. By contrast, Federal Reserve policy makers are slowing their bond purchases and debating when interest rates will rise. “Spain trading through the U.S. is just emphasizing the divergence” between the ECB and the Fed, “It was pretty startling, Draghi’s emphasis on QE being considered. The momentum behind spread-narrowing is just incredible.” Yield Levels Spain’s five-year note yield fell nine basis points, or 0.09 percentage point, to 1.72 percent at 4:56 p.m. London time after reaching 1.69 percent, the lowest since Bloomberg started tracking the data in 1993. The 2.75 percent security due April 2019 climbed 0.435, or 4.35 euros per 1,000-euro ($1,371) face amount, to 104.965. The yield was lower than that on five-year Treasuries before a report showing U.S. employers added fewer jobs than economists forecast in March boosted the U.S. notes.
Greenish Shootlets in Southern Europe (Implicitly Wonkish) - Paul Krugman -- There are hints of recovery in some of Europe’s austerity-stricken economies. Even Greece is finally showing some signs of an uptick. And you know one thing is going to happen: some people will say, “See — growth despite austerity! Krugman and the Keynesians were wrong!” What’s interesting is that at the very same time other people (or in some cases, I think, the same people) are pointing to the lack of recovery in the United States and declaring “This has gone on so long that it can’t be cyclical. Krugman and the Keynesians are wrong!” So whatever happens, I’m proved wrong. So it goes. But what we should really be doing, of course, is asking what the models (not the person) predicts. And I want to enlarge on some points I made last fall. Back then I pointed out that textbook macroeconomics says that economies will eventually self-correct from adverse demand shocks, including those created by fiscal austerity. And I do mean textbook:
Europe’s Many Jobless See Little Light Yet From Glimmers of a Recovery - Even as signs of an economic recovery emerge in the euro zone, the human cost of the five-year downturn continues to rise. For tens of millions of Europeans, the comeback from nearly five years of economic privation and Depression-scale joblessness will not be easy. A growing number of people, in Greece and other battered euro zone economies, are caught in the trap of long-term unemployment, drained of savings and living on the economic and social edge.Greece, of course, has been hit the hardest: Its unemployment rate stills hovers above 27 percent. But the social challenges are not its alone. In the 28-nation European Union, 25.9 million people remain jobless, out of a potential labor force of about 244 million. Data released last week showed no change in the euro zone’s 11.9 percent unemployment rate in February. Spain’s jobless figure was 25.6 percent, and Italy’s was 13 percent, a new high. Now, in a cascade of recent reports, the European Commission, research institutes and economists are warning that rising long-term joblessness and declining incomes are straining government safety nets and swelling the ranks of people excluded from the labor market and mainstream society. “There is a silent crisis in which a growing number of people are being left behind,” said Jens Bastian, an economist who was a member of the European Commission’s task force for Greece until this year. “People who one or two years ago thought the financial crisis was something that happened only to others are themselves out of a job, or increasingly pushed to the margins.”
Greece: debt laden, but looking to borrow again - International financial markets are watching closely as Greece’s government tests the water by borrowing up to 2.5 billion euros. It does not need that money to do things like pay civil servants’ wages or old age pensions, as currently European Union and International Monetary Fund bailout loans are covering those outgoings. But Athens wants to prove that investors have enough confidence in the country’s future to loan it money. Greece currently owes 321.5 billion euros – a whacking 175 percent of its annual gross domestic product. Rating agencies’ rank it deep in junk territory and way below the AAA level So the return to the bond market impresses investors, like William De Vijlder, Chief Investment Officer, BNP Paribas: “It is a genuine achievement, and that cannot be emphasised enough. The turnabout that the country has seen, let’s not forget that. We will now see positive growth after having seen five or six years of contraction and inactivity.” There may be some green shoots, but it is too early to talk about long-term economic stability.EU deal on bank failures risks unravelling - FT.com: A landmark EU agreement on a common rulebook for handling bank failures is in danger of unravelling over the fine print restricting when a state can intervene to rescue a struggling bank. Britain is facing objections from several other member states as it scrambles to revise a political deal, reached in December, in an attempt to protect the Bank of England’s emergency role as covert lender of last resort. The political stand-off over the bank recovery and resolution directive – a centrepiece of post-crisis financial reforms – is extremely unusual because it comes days before the European parliament is supposed to adopt the agreed text of the legislation. While London insists it is belatedly rectifying a technical discrepancy, other diplomats suspect it is revisiting a fundamental element of the reforms, which aim to spare taxpayers from the costs of bank failure. “This is a complete mess, a nightmare and we have to decide what to do fast,” said one person involved. At issue is what form of support a state can provide to a lender in difficulty without triggering a so-called bail-in, where losses are imposed on private investors who lent money to a bank. The British want to clarify that central banks can extend liquidity even when relying on a specific government guarantee, without triggering haircuts on bondholders. The position is acceptable to parliament but, since Friday, has prompted several member states to raise concerns. At this late stage any revisions to the text require unanimity. According to people involved in the talks, the Czech Republic is objecting in principle to making such substantial changes after a political agreement was reached, while Denmark is raising more substantial concerns about the specific British proposal. Copenhagen has taken a hard line against loopholes which could permit disguised governmental bailouts.
Heard (but not understood) On the Street: The WSJ and Deflation -- William K. Black -- A brief update is in order after my three part series on how the troika (the ECB, EU, and the IMF) was acting contrary to its stated policies on deflation, Mario Draghi’s (the head of the ECB) confession that he favored deflation in the eurozone periphery because he wanted these nations to have lower prices and wages so that they could increase exports, and the disgraceful reporting of the subject in the New York Times and the Wall Street Journal. The WSJ’s “Heard on the Street” feature is out with an April 3, 20014 story on deflation that epitomizes each of these defects. The title of the article foreshadows the analytical black hole that follows: “Inflation, Euro Test Draghi’s Resolve at ECB.” The first sentence of the article floats the meme that Draghi is trying to follow the famous British slogan during the blitz: “Keep Calm and Carry On.”“The European Central Bank stuck with plan A Thursday: hold steady and wait for inflation to gradually pick up. .”The far better metaphor is that the troika does not simply fiddle while Rome, Madrid, and Athens burn, but that the troika-trolls fiddle with these economies through austerity – pouring accelerants on the flames of massive unemployment. During the blitz, the firefighters and rescue workers fought the flames and risked their lives to save the victims. “Keep Calm and Carry On” did not mean “ignore the victims” and it certainly did not mean blame the victims. The WSJ confuses the troika-trolls’ “indifference to the plight of the victims of austerity” with “resolute” and “calm.” People who are indifferent to the suffering that they cause are sociopaths – not “resolute.”
Disinflationary pressures beyond the euro area - According to the Conference Board, disinflationary pressures are not limited to the Eurozone and can be seen across a large number of the "developed economies". The so-called "Harmonized Indexes of Consumer Prices" or HICP (a measure of inflation that has been standardized based on the EU definition) seems to show consumer prices weakening broadly, with only a couple of exceptions. The Conference Board: - “While the Euro Area has been nearing the deflationary boundary over the past several months, countries outside the monetary union are not spared that same concern,” said Elizabeth Crofoot, Senior Economist with the International Labor Comparisons program at The Conference Board. “Price growth is nearly zero in Denmark and Sweden, and has once again reached deflationary territory in Switzerland, last seen in May 2013. In contrast, after years of having the lowest inflation rate, Japan—together with Norway—is experiencing the highest inflation among the countries compared.” In the US the TIPS market seems to agree with this assessment as the breakeven rates remain subdued (see chart). The HICP trend in the next two months will be critical. It will drive the monetary policy trajectory across key economies, particularly in the Eurozone which is now coming to terms with the possibility of QE (see story).
Mario Draghi’s ‘whatever it takes’ may not be enough for the euro - FT.com: “Whatever it takes.” Mario Draghi’s declaration that he would save the euro could well go down as the most effective three-word statement by a Roman since Julius Caesar’s veni, vidi, vici. The European Central Bank president’s statement, followed up with a portentous and vaguely threatening – “and believe me it will be enough” – was made in July 2012. Almost two years later, Mr Draghi’s intervention is widely regarded as the turning point in the euro crisis. Investors who were running screaming from the eurozone in the summer of 2012 are now rushing back in. But whatever the thundering herd of investors may think, it is too soon to declare that Mr Draghi has won the war for the euro. The eurozone still faces deep underlying economic and political problems that are beyond the control of the president of the ECB and his colleagues. What Mr Draghi has managed to do is to buy the euro some time. The borrowing costs of Spain, Italy and even Greece have fallen sharply – easing the pressure on their economies and government finances. But the underlying economic situation in many eurozone countries is still grim. And the political consequences of prolonged slumps are only just beginning to emerge. When I asked one of Europe’s most influential economic policy makers recently whether the euro crisis really is over, he replied: “No, it’s just moving from the periphery to the core.” The argument is that while worries about Portugal, Greece, Ireland and Spain have become less acute, concerns about Italy and even France should actually be rising. The statistics for Italy, in particular, are shocking. Since the onset of the crisis in 2008, Italy has lost 25 per cent of its industrial capacity and the real level of unemployment is now, according to senior Italian officials, about 15 per cent. Italy’s scope for economic stimulus is limited by EU rules and by the fact that the country’s ratio of debt to gross domestic product is now more than 130 per cent. France’s economic statistics are less bleak but unemployment is still in double digits and the national debt is creeping up to the symbolic level of 100 per cent of GDP.
Renewed pressure on the ECB - Pressure continues to build on the ECB to act. As discussed earlier (see post), the central bank may continue to stay on the sidelines for some time, but the latest developments (listed below) make this inaction increasingly difficult.
1. Declining Liquidity: The area banks' excess reserves are now at the lows not seen in years.
2. French inflation numbers that came out today continue to show price increases that are materially below the central bank's target (see chart). Disinflationary risks remain.
3. The euro is grinding higher, which is not great for the area's exporters and will put further downward pressure on prices.
4. China's slowdown will have a material impact on the area's economy as well because China is the Eurozone's third largest export market outside of the EU. The fact that China's imports unexpectedly fell by 11% is not great news for the euro area's recovery.
So What Exactly Can The ECB Do, Anyway? -The ECB is not going to do QE, or indeed any other form of monetary easing at the moment. But they are talking about it. And for the moment, it seems, talk is enough. The Euro is up and bond yields are down, even for Greece (which is bravely attempting to return to the capital markets this week). European stock markets are worrying about the Ukraine crisis. It’s back to business as usual. But as Andrew Clare caustically remarks, “markets won’t be satisfied forever with hot air”. Unless Euro area inflation somehow reverses its current downward trend – which seems unlikely, since the world is on a general disinflationary trend at the moment and the Euro area is hardly a stellar performer – the ECB will eventually be forced to do more than talk. I argued in my previous piece that the ECB would wait until the AQR and stress tests are substantially complete before doing anything significant. But core weakness, and particularly a German slowdown, might compel them to act sooner. The question is what they can realistically do.The problem with doing standard QE is that unlike the US, most corporate finance in the Euro area comes from banks rather than capital markets. The Euro area’s banks are damaged and undercapitalized. The UK’s experience shows that monetary easing via a standard QE program when banks are damaged and undercapitalized blows up asset bubbles rather than increasing productive lending to companies. So the ECB is looking at ways of getting banks to lend. Central bank intervention to increase bank lending is known as “credit easing” rather than quantitative easing. The distinction is a fine one, but it is important. Quantitative easing bypasses banks and directly influences the flow of funding to companies via the capital markets. It is therefore a useful tool in economies with deep liquid capital markets, such as the US. But in economies that have relatively undeveloped capital markets and rely far more on bank lending, quantitative easing may have limited effectiveness and credit easing may be more appropriate. This certainly seems to be the direction of ECB thinking.
The real reasons why Draghi flirts with QE - The European Central Bank took no decisive action last Thursday, neither to lower eurozone interest rates nor launch its own programme of “quantitative easing”. It was made clear, though, that the ECB may soon follow the US Federal Reserve and Bank of England by firing up Frankfurt’s virtual printing press and creating, ex nihilo, hundreds of billions of euros. The council was “unanimous”, said ECB boss Mario Draghi, a hint of steel entering his voice, in its commitment to “unconventional instruments”. In case that wasn’t crystal, he spelt it out. “All instruments within our mandate are part of this statement,” he told the world. “There was, in fact, during the discussion we had today, a discussion of QE”. The official line is that the ECB is considering joining the mass money-printing club because of fears about deflation. In March, eurozone inflation was indeed just 0.5pc, on official measures. The underlying motivation for euro-QE, though, is rather different. Financial markets denizens know this, but few are prepared to say it. Massive losses continue to smoulder on European bank balance sheets. It was the acute danger of clapped-out banks dragging their host governments into bankruptcy that caused systemic panic across eurozone sovereign bonds markets, threatening the entire single currency project, during the summer of both 2011 and, particularly, 2012. Despite the OMT bluster, the underlying problem remains. Numerous eurozone banks are busted, not only in profligate “Club Med” nations such as France and Italy, but Germany, too. Such banks, though, are too politically-connected to be allowed to fail.
Draghi welcomes unconventional easing as IMF pushes for action - “I would like to focus on the euro-area economic outlook, the ECB’s monetary policy and current policy challenges,” ECB President Mario Draghi said in comments prepared for a speech to the International Monetary and Financial Committee Saturday. Well, here’s a policy challenge for you, Draghi: Fix the super-low inflation level in the euro zone that keeps getting you those nasty comments from the IMF. The IMF lashed out at the ECB again on Thursday and said the central bank needs to further expand its balance sheet to stave off the risk of deflation that, alas, could derail the tenuous economic recovery. So far, “Super Mario” seems unfazed by the calls for action, sarcastically thanking the IMF for being “extremely generous” in offering advice on how to tackle the disinflation daemon at his monthly press conference in early April.Because it’s not like Draghi hasn’t thought about expanding the ECB’s balance sheet himself. In the prepared statement for his speech to the IMF panel this Saturday, the ECB boss said he doesn’t rule out further monetary easing and confirmed that the Governing Council is unanimous in its support for using unconventional instruments.“Looking ahead, the ECB is resolute in its determination to maintain a high degree of monetary accommodation and to act swiftly if required,” he said. He then went on to promise that the main lending rate will stay at the present record-low level of 0.25% — or go even lower — for an extended period of time.
ECB’s Nowotny: Additional ECB Easing Steps ‘Clearly Possible’ - Fresh stimulus measures from the European Central Bank are “clearly possible” to guard against the risks of excessively low inflation, but the bank should wait until its June meeting to consider whether to take them, Austrian central bank governor Ewald Nowotny said in an interview. Mr. Nowotny, who is a member of the ECB’s governing council, signaled that his preference would be for any ECB stimulus to be geared toward Europe’s asset-backed securities market, which may in turn boost the flow of credit to the economy. He said he is open to setting a negative rate on bank deposits parked at the ECB, but raised doubts about the effectiveness of such a move. “We are preparing all the technical aspects of a range of possible interventions,” Mr. Nowotny told The Wall Street Journal on the sidelines of meetings of the International Monetary Fund. Last week, the ECB kept its key interest rates unchanged despite a recent report showing annual inflation slid in March to 0.5%, far below the ECB’s target of just under 2%. However, the ECB strengthened its commitment to reduce rates or take other easing steps if necessary, saying the 24-member board was unanimous in its willingness to consider unconventional tools. The ECB has come under pressure from the IMF in recent weeks to ease policy further. But Mr. Nowotny signaled that he would prefer to hold fire again when the ECB meets in May and wait until the June meeting, when the ECB will have fresh economic and inflation forecasts through 2016, to consider its next move.
German Finance Minister Wolfgang Schaeuble 'can't bear hearing' austerity versus growth debate - German Finance Minister Wolfgang Schaeuble has reacted to IMF advice to boost investment by saying he "can't bear hearing" the debate over fiscal austerity versus pro-growth policies anymore. He was speaking a day after the International Monetary Fund (IMF) again encouraged export power Germany to invest more to boost domestic demand, and after Mr Schaeuble promised a balanced budget from next year. "I can't bear hearing any longer this debate" on whether fiscal discipline and stimulating growth are two contradictory goals, Mr Schaeuble told a banking conference in Berlin. "The way I see it, the countries that have their budgets in order are also the ones with the best growth figures." Mr Schaeuble said that the IMF indicated "that we have some leeway" for public spending, adding however that "we have decided on the measures that we think we can afford, and we can't afford more".
Cost of alleged bank wrongdoing exceeds bad-loan provisions - FT.com: The cost of alleged misconduct at banks has in recent years overtaken the provisions to cover bad loans in what is described as an “extraordinary change” by Sir Win Bischoff, the former Lloyds Banking Group chairman. Sir Win, who stepped down from the UK lender’s board last week, questioned whether the regulator could have cracked down on some of the misconduct earlier, such as the mis-selling of payment protection insurance. Lloyds has set aside almost £10bn to cover the cost of PPI mis-selling, by far the most in the banking sector, which has provisioned more than £20bn as a whole – underlining the scandal’s role as an unexpected economic stimulus. “There is an element of why didn’t the regulator spot it earlier – it would have been wonderful for Lloyds,” said Sir Win, addressing a conference on bank governance at Cass Business School. “Obviously it is not the regulator’s responsibility, it is management’s responsibility, but at the time it was not seen as so egregious as it is now.” “However painful it might be for Lloyds, it must be dealt with,” he added.


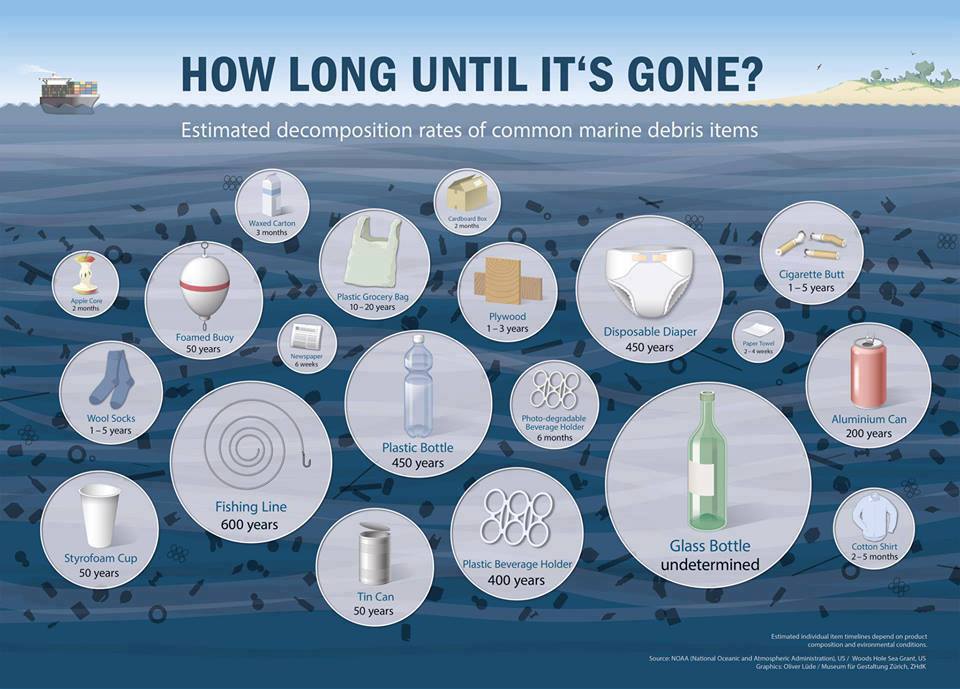
No comments:
Post a Comment