FRB: H.4.1 Release--Factors Affecting Reserve Balances--July 10, 2014 - Federal Reserve Statistical Release: Factors Affecting Reserve Balances of Depository Institutions and Condition Statement of Federal Reserve Banks
FOMC Minutes: QE3 Expected to End in October - From the Fed: Minutes of the Federal Open Market Committee, June 17-18, 2014. Excerpt: Some committee members had been asked by members of the public whether, if tapering in the pace of purchases continues as expected, the final reduction would come in a single $15 billion per month reduction or in a $10 billion reduction followed by a $5 billion reduction. Most participants viewed this as a technical issue with no substantive macroeconomic consequences and no consequences for the eventual decision about the timing of the first increase in the federal funds rate--a decision that will depend on the Committee's evolving assessments of actual and expected progress toward its objectives. In light of these considerations, participants generally agreed that if incoming information continued to support its expectation of improvement in labor market conditions and a return of inflation toward its longer-run objective, it would be appropriate to complete asset purchases with a $15 billion reduction in the pace of purchases in order to avoid having the small, remaining level of purchases receive undue focus among investors. If the economy progresses about as the Committee expects, warranting reductions in the pace of purchases at each upcoming meeting, this final reduction would occur following the October meeting.
Fed Sets October End for Bond Buying - WSJ - Federal Reserve officials agreed at their June policy meeting to end the central bank's bond-buying program by October, closing a chapter on a controversial experiment in central-banking annals with results still the subject of immense debate. Officials have been winding down their purchases of Treasury bonds and mortgage-backed securities in incremental steps since January and have said they expect to end the program later this year, but until now haven't been explicit about the end date. "If the economy progresses about as the [Fed] expects, warranting reductions in the pace of purchases at each upcoming meeting, this final reduction would occur following the October meeting," the Fed said in minutes released Wednesday from its June policy meeting. The bond program aims to hold down long-term interest rates and drive investors into riskier holdings like stocks or corporate debt. That in turn is meant to stimulate borrowing, lending, spending, investing and hiring. Critics have long argued the program risks causing another financial bubble or excessive inflation, without giving an obvious boost to hiring. Fed officials and other supporters of the program argue it has helped the economy grow faster than it would otherwise grow, with limited risk.
Fed Watch: QEInfinity Not - The Federal Reserve released the minutes of the June FOMC meeting today, but the contents had little in the way of groundbreaking news. Most interesting was that Fed officials tired of being pestered about the "October or December" question regarding the end of the QE and decided to more or less commit to the earlier date:Some committee members had been asked by members of the public whether, if tapering in the pace of purchases continues as expected, the final reduction would come in a single $15 billion per month reduction or in a $10 billion reduction followed by a $5 billion reduction. Most participants viewed this as a technical issue with no substantive macroeconomic consequences and no consequences for the eventual decision about the timing of the first increase in the federal funds rate--a decision that will depend on the Committee's evolving assessments of actual and expected progress toward its objectives.In other words, who cares about that last $5 billion? The Fed's answer was to take away the mystery:In light of these considerations, participants generally agreed that if incoming information continued to support its expectation of improvement in labor market conditions and a return of inflation toward its longer-run objective, it would be appropriate to complete asset purchases with a $15 billion reduction in the pace of purchases in order to avoid having the small, remaining level of purchases receive undue focus among investors. with, of course, the usual "data dependent" caveat. Thus the predictions of QE Infinity come to an end.
The Federal Reserve is Not Ending Its Stimulus - Yesterday, the Federal Reserve confirmed that it would end new purchases of Treasury bonds and mortgage-backed securities (MBS)—what’s known as quantitative easing—in October. In response, the media are heralding the end of the Fed’s stimulus:“Fed Stimulus is Really Going to End and Nobody Cares,” says the Wall Street Journal.“Federal Reserve Plans to End Stimulus in October,” reports the BBC. This is utterly wrong.What the Fed is about to do is stop increasing the amount of stimulus it provides. For the mathematically inclined, it’s the first derivative of stimulus that is going to zero, not stimulus itself. For the analogy-inclined, it’s as though the Fed had announced (in more normal times) that it would stop cutting interest rates. New stimulus is ending, not the stimulus that’s already in place. The Federal Reserve has piled up more than $4 trillion in long-term Treasuries and MBS, thus forcing investors to move into other assets. There’s great debate about how much stimulus that provides. But whatever it is, it will persist after the Fed stops adding to its holdings.
Divide on Inflation Views Growing at the Federal Reserve, Minutes Show - Minutes from the Federal Reserve’s June meeting suggest there is a growing gap between officials who believe U.S. inflation could remain too low for the Fed’s comfort and those who believe a spike in consumer prices could be closer than forecasters think. Some policy makers “expressed concern about the persistence of below-trend inflation,” the minutes said. Indeed, a couple even suggested the central bank might have to let unemployment fall below its long-term normal rate in order to ensure inflation moves back toward the 2% target. That sentiment was far from unanimous, however. “Some others expected a faster pickup in inflation or saw upside risks to inflation expectations because they anticipated a more rapid decline in economic slack.” The divergence may help explain why Fed officials are concerned the historically low volatility seen in financial markets of late suggests investors may be underpricing risk. “Low implied volatility in equity, currency and fixed-income markets, as well as signs of increased risk-taking, were viewed as an indication that market participants were not factoring in sufficient uncertainty about the path of the economy and monetary policy,” the minutes said. That’s like the Fed telling markets: “We don’t know what we’re doing so how can you be so sure?”
Fed Has Little Uncertainty, Despite Forecasting Misses - - Federal Reserve policy makers have been consistently too optimistic about economic growth and too pessimistic about the falling unemployment rate. But ask them if they’re uncertain about their forecasts and this is their answer: no more than usual. In 2012, Fed officials said they were more uncertain than usual about their forecasts for growth, unemployment and inflation. But over the course of 2013 their uncertainty has declined, and now almost all Fed officials are confident in their forecasts, according to the Fed’s self-assessment of uncertainty which was released Wednesday as part of Fed’s June meeting minutes. Fed officials have recently been concerned that markets have grown too complacent. Yet even at the Fed, only three officials rank their uncertainty about growth as high, and only two are more certain than usual about their unemployment forecasts. (The minutes do not identify by name which Fed official makes which forecast.) For the record, most Fed officials see growth of 2.1% to 2.3% this year and unemployment at the end of 2014 between 6% and 6.1%. Those forecasts were made in advance of their June 17-18 policy meeting, and already they’re beginning to look a little suspect.
Fed, Confident in Economy, Details End of Bond-Buying Program - The Federal Reserve said on Wednesday that it planned to stop adding to its bond holdings in October, in a sign of its confidence that the economy is gaining strength even as the central bank gradually withdraws its support. The decision, described in an account of the Fed’s most recent policy-making meeting in June, signals the end of one of the central bank’s most aggressive efforts to stimulate the economy. The Fed, which started reducing its monthly purchases in January, said it planned to add a final $100 billion to its holdings of Treasuries and mortgage-backed securities over the next four months, for a total of $1.5 trillion. But the account underscored that many Fed officials remained guarded in their optimism about the economy. It also suggested that they had not yet decided when to take an even more important step in their retreat: raising short-term interest rates for the first time since December 2008. Investors generally expect the Fed to start raising interest rates next summer. The Fed said the decision to end bond purchases in October, rather than continuing purchases at a nominal level until the end of the year, should not be interpreted as evidence that rate increases were likely to begin sooner. “Most participants viewed this as a technical issue with no substantive macroeconomic consequences and no consequences for the eventual decision about the timing of the first increase in the federal funds rate,” the minutes said, referring to the benchmark interest rate that the Fed uses to influence borrowing costs for consumers and businesses.
Do We Have Liftoff? -- (13 graphs) The minutes for the June 17-18 meeting of the FOMC revealed a discussion about the end of bond purchases in October but only a vague notion of when liftoff might occur. Many believe that “slack” labor market conditions are still a concern: In assessing labor market conditions, participants again offered a range of views on how far conditions in the labor market were from those associated with maximum employment. Many judged that slack remained elevated, and a number of them thought it was greater than measured by the official unemployment rate, citing, in particular, the still-high level of workers employed part time for economic reasons or the depressed labor force participation rate. The first estimate from the BLS establishment survey reports total non-farm employment increased by 288,000 in the month of June and the prior two months have been revised up by an additional 29,000. Here are our takeaways:All major BLS sectors (goods, services and government) added jobs in June. The next two charts illustrate these gains. The width of the bars represents the weight of each industry in total employment. For instance, employment in trade, transportation and utilities represents about one-fifth of all U.S. employment whereas industries like information or mining make up a much smaller fraction. In June, every industry with the exception of ‘other services’ added jobs. As you would expect from a healthy labor market, the largest job gains predominantly came from the largest sectors with trade, transportation and utilities and professional and business services adding a combined 139,000 jobs.
Analyst Expectations for Fed Rate Hikes are Shifting - Add Goldman Sachs to the list of Wall Street banks who see the Fed raising short-term interest rates sooner than previously thought. Goldman economist Jan Hatzius changed his Fed call after Friday’s jobs report, predicting the central bank would start raising short-term rates by the third quarter of 2015, not the first quarter of 2016 as previously thought. Mr. Hatzius pointed to three factors in a note to clients: 1) A faster-than-expected drop in the unemployment rate; 2) A pickup in inflation; 3) Easier financial conditions.“It marks the first time since the crisis that we have moved up our funds rate forecast,” Mr. Hatzius noted. “At least in part, we view this as an illustration of the substantial progress that the US economy has made in overcoming the fallout from the housing and credit bubble.” J.P. Morgan economists on Friday also moved forward to the third quarter of 2015 their forecast for the Fed’s first rate increase.
Fed’s Kocherlakota Sees No Urgency To Raise Short-Term Rates - Federal Reserve Bank of Minneapolis President Narayana Kocherlakota indicated Tuesday that any increase in short-term rates by the U.S. central bank likely lies well into the future. “I don’t make monetary policy according to a calendar,” Mr. Kocherlakota told reporters after a speech in Minneapolis. But he explained that a “necessary condition” for increasing short-term rates from near-zero-percent levels “should be that our one-to-two-year outlook” has inflation coming in at 2%, “or possibly above.” In his formal remarks, Mr. Kocherlakota said he sees very little risk of that scenario coming to pass anytime soon. “I currently see the probability of inflation averaging more than 2% over the next four years as being considerably lower than the probability of inflation averaging less than 2% over the next four years,” he said. Speaking to reporters, he said “I’d be willing to have inflation run above 2% for some time frame in order to bring employment back up more rapidly.” But for now, “there’s no reason for us to raise rates as long as inflation is running too low.”
Fed’s George Sees Room For Rate Hikes This Year - Kansas City Fed President Esther George said Thursday there are signs that the U.S. Federal Reserve should raise interest rates as early as this year, noting positive developments in the labor market and inflation rates closer to target. “As I look at some of the policy prescriptions that the Federal Reserve relies on, looking at formulas that help guide you on when it’s time to change, many of those are already pointing to lifting off of zero as early as even this year or next year,” . Ms. George, who isn’t currently a voting member of the monetary-policy setting Federal Open Market Committee, has been a consistent critic of the policies pursued by the central bank in the wake of the worst financial crisis since the Great Depression. In recent remarks Ms. George has argued that the Fed should start increasing short-term interest rates soon after its ends its bond-buying stimulus program later this year. Ms. George said that the economy appears to be back on track after a weak first quarter. She estimates economic growth will be somewhere between 2% to 2.5% for the full year. She said the labor market has improved to the point that surveys show the ability to attract qualified labor is a growing concern for employers, a situation that often leads to higher wages. Ms. George said that she expects the inflation rate to move closer to the Fed’s 2% target, adding that she’s concerned about the effect of higher food prices on low- and middle-income families.
Plosser Says Fed Must Consider Higher Rates as Policy Goals Edge Closer - Philadelphia Federal Reserve Bank President Charles Plosser said Friday the central bank is moving closer to its policy objectives, and therefore should begin thinking about the right time to raise interest rates. Mr. Plosser, a frequent critic of the Fed’s unconventional policies, told Bloomberg television U.S. interest rates have already been at rock-bottom lows for a very long time despite improvements in the economic outlook. “It’s important that we acknowledge that we are getting closer to our objectives and, for me, it’s important that we adjust monetary policy appropriately as we approach those objectives,” Mr. Plosser said. “We are moving closer to our goals and objectives. Inflation is drifting back up towards our 2% objective, the unemployment rate continues to move down.” Mr. Plosser said wages, which have been flat for much of the recovery, are a lagging indicator of inflation, not a leading one, suggesting the Fed could not wait for a pronounced pick-up before starting to tighten policy. “A lot of the guidelines that we look at, rules and things like that, that give us guidelines for where the stance of policy ought to be for any combination of inflation and unemployment — where that policy rate ought to be — many of these rules are indicating that we should be begin gradually raising interest rates,” he said.
Fed’s Plosser: Federal Reserve Must Prepare Markets for Rate Increases - Federal Reserve Bank of Philadelphia President Charles Plosser said Friday that the U.S. central bank needs to start preparing markets for increases in short-term interest rates that may come sooner than many currently expect. “We need to adjust the language in our statement to reflect that the economy really is better that it was, and that the necessity of having zero interest rates for a long time to come seems to me to be perhaps a risky or unnecessary step at this point,” Mr. Plosser said in an interview with The Wall Street Journal. “I don’t know if we need to tighten policy right now, but it’s pretty clear to me” the economy has improved in a way that central bankers need to get ready for the coming end to the Fed’s ultra-easy money stance, he said. Mr. Plosser, who currently holds a voting slot on the monetary policy-setting Federal Open Market Committee, long has been uncomfortable with the ultra-easy stance of monetary policy. He also has said in past that the Fed should contemplate raising interest rates sooner rather than later. In the interview, Mr. Plosser said that while he knows it is unlikely to happen, he would prefer for the Fed to lift rates this year and close out 2015 at a 1% short-term rate level, with rates at 3% by the close of next year.
Fed’s Lockhart: Still Sees First Fed Rate Boost Some Time in 2015 - Federal Reserve Bank of Atlanta President Dennis Lockhart said Friday he still believes the most likely timing for the central bank to raise interest rates lies well into next year. “I’m sticking to the view that conditions that would justify a liftoff decision will arrive in the second half of next year,” Mr. Lockhart said. “The potential and achievable benefits of sustaining very accommodative monetary stimulus, based on a policy rate in its current range of 0 to 25 basis points, beyond year-end 2014 and into next year continue to outweigh the possible costs.” Mr. Lockhart’s comments came from the text of remarks prepared for delivery before a gathering held by the Global Interdependence Center in Jackson Hole, Wyo. Speaking to reporters after his speech, Mr. Lockhart said “If the economy is much stronger than what I’m anticipating, and we get closer to our objectives sooner, than I would obviously reconsider my position.” Mr. Lockhart’s comments came as the outlook for central-bank policy is undergoing a shift. The Fed is in the process of steadily winding down its bond-buying stimulus program and will most likely end the effort at its October policy meeting.
Fed Watch: When The Fed Starts Raising Rates: For those that hope to use tighter monetary policy to bolster the case against equities, recall that patience may be required: For those making the bear case against long bonds, recall that initially long rates fell, and over the entire cycle rose just (roughly) 50bp: The short end of the curve suffered, and the yield curve inverted: How does this compare to now? If we consider last December's taper the beginning of this tightening cycle (the Fed does not; they prefer to think of it at reducing financial accommodation), stocks continue to power higher: The 10 year bond initially fell on the taper talk and the yield curve steepened through the 10 year. But that steepening ended when the taper began: More interesting is the flattening of the very long end after the taper began: It looks like rates are signalling that the Fed will act to contain activity such that the economy does not overheat. Which, assuming the Fed maintains its current reaction function, tends to support modest porposal's interpretation - favor the long end of the curve over the short end. I think the flattening of the yield curve should be a concern to the Fed. It suggests that while we frequently hear Janet Yellen described as a dove, the expectation is that her actual policy approach will be cautious bordering on hawkish. Not good if you think like Andy Harless: I will consider Yellen's tenure a failure if the economy does not overheat.
Is the Fed Behind the Curve? — Imagine Fed Governor Rip van Winkle started his nap at the beginning of 2007 and just woke up to find that inflation is close to the Fed’s objective and the unemployment rate is at its 30-year average. You could forgive him for expecting the federal funds rate to be close to its long-run norm of about 4%, and for his surprise upon learning that the funds rate is at 0.1% and Fed assets are five times where they were when his snooze began. Is the Fed already behind the curve? Why do policymakers emphasize their expectation that rates will stay low “for a considerable time” beyond October (when asset purchases are expected to halt)? What risks are they seeking to balance? The most common benchmark for monetary policy is the Taylor rule, which relates the central bank’s policy rate to a combination of deviations of inflation from its target and a measure of resource slack. The modified Taylor rule in the chart below shows that – even ignoring the Fed’s balance sheet expansion – the Fed’s interest rate policy is now unusually stimulative by the standard of the past three decades. [The blue line in the chart is based on the Fed’s preferred inflation measure, the price index of personal consumption expenditures, and the deviation of the unemployment rate from its equilibrium level as a measure of slack.] So, what might warrant such large stimulus? We can think of four possible reasons: (1) the Fed’s inflation objective isn’t really 2%, it’s higher; (2) the equilibrium real interest rate is well below the 1.75% implied by FOMC members’ current long-run projections; (3) resource slack far exceeds that implied by the 6.1% unemployment rate; and (4) the Fed is purchasing insurance against a negative economic shock that would – once again – force it to rely on unconventional balance sheet policies. Let’s analyze these one-by-one.
Fed explores overhaul of key rate: The US Federal Reserve is exploring an overhaul of the Federal funds rate – a benchmark that underlies almost every financial transaction in the world – as it prepares for an eventual rise in interest rates. ... According to people familiar with the discussions, the Fed could redefine its main target rate so that it takes into account a wider range of loans between banks, making it more stable and reliable. Concerns have grown about the reliability of the Fed funds rate since the Fed began buying trillions of dollars of assets during three rounds of quantitative easing. US banks now have huge amounts of cash and have stopped borrowing or lending Fed funds, making the market highly illiquid. With the Fed targeting rates close to zero, the reliability of Fed funds has been less important, but when the Fed starts raising rates – something markets expect it to do in the middle of next year – it needs to be sure that it is targeting a real benchmark. In particular, the Fed is looking at redefining the Fed funds rate to include eurodollar transactions – dollar loans between banks outside the US markets – as well as traditional onshore loans between US banks.
Fed vice chairman suggests including financial stability among chief goals - Federal Reserve Vice Chairman Stanley Fischer on Thursday suggested banking regulators should seriously consider broadening their goals to include financial stability as policymakers around the world debate strategies for preventing another global crisis. Fischer argued that an explicit stability mandate could give regulators more firepower to combat risks as they emerge. The issue of how central bankers should address nascent bubbles has become a flashpoint in economics, with some worrying that years of ultralow interest rates and easy monetary policy could be fueling hidden excesses. In a speech in Cambridge for the National Bureau of Economic Research -- his first as vice chairman -- Fischer warned that the U.S. structure for overseeing the financial system may not be up to its task. “It may well be that adding a financial stability mandate to the overall mandates of all financial regulatory bodies … would contribute to increasing financial and economic stability,” he said, according to prepared remarks. Fischer did not weigh in on whether central banks should use monetary policy - namely, interest rates -- to combat bubbles. But he did point out that policymakers do not have a strong understanding of how well their regulatory toolkit might work.
New Legislation Requires Fed to Adopt Policy Rule -- John Taylor --A lot of research and experience shows that more predictable rules-based monetary policy leads to better economic performance—both in terms of price stability and steadier-stronger employment and output growth. But in practice there have been big swings in Fed policy between rules and discretion, with damaging results as in the 1970s and the past decade of a financial crisis, great recession and slow recovery. This experience—especially the swing from rules to discretion in the past decade—demonstrates the need for legislation requiring the Fed to adopt rules for setting its policy instruments. So it is good news that today the ‘‘Federal Reserve Accountability and Transparency Act of 2014” was introduced into Congress. It requires that the Fed adopt a rules-based policy. In particular, Section 2, the first main section of the Act, titled “Requirements for Policy Rules for the Federal Open Market Committee,” would require that the Fed “submit to the appropriate congressional committees a Directive Policy Rule… which shall describe the strategy or rule of the Federal Open Market Committee for the systematic quantitative adjustment of the Policy Instrument Target to respond to a change in the Intermediate Policy Inputs.” Thus the rule would describe how the Fed’s policy instrument, such as the federal funds rate, would change in a systematic way in response to changes in the intermediate policy inputs, such as inflation or real GDP. The rule would also have to be consistent with the setting of the actual federal funds rate at the time of the submission.
A Legislated Taylor Rule? - John Cochrane -- John Taylor announces in his blog post, "New Legislation Requires Fed to Adopt Policy Rule'' that today .. the ‘‘Federal Reserve Accountability and Transparency Act of 2014” was introduced into Congress. It requires that the Fed adopt a rules-based policy. Basically, the Fed would have to report to Congress and explain any deviation from a "Reference policy rule," Wow. John will testify at a hearing at the House Financial Service Committee on Thursday, along with Mark Calabria, Hester Peirce and Simon Johnson. This should be very interesting. What is most interesting about a rule is what it leaves out. Notably absent here is "macroprudential" policy, "financial stability" goals, i.e. raising rates to prick perceived asset price "bubbles" and so forth. Janet Yellen's remarkable recent speech foreswore a lot of that. Of course, the Fed could always add it as a "temporary" need to deviate from the rule. Still, many people might think that should be part of the rule not part of the exception. It also leaves out housing, exchange rates, and all the other things that central banks like to pay attention to. A rule really is a list of things that the Fed shall not react to without explanation.
Should Congress legislate so that the Fed is forced to follow policy rules? - No. But, as John Taylor alerted us in his blog, a new bill has been introduced that would have this effect, if passed. I presume that this is one of those bills that no-one expects to pass, but is put before it to stimulate debate. Debate is always a good idea, but even a tiny chance that it might actually pass is a cause for concern. Why? Even before the financial crisis, I would have said that the ‘Science of monetary policy’, to borrow a phrase from the elegant survey of modern sticky-price-monetary policy macro by Clarida, Gali and Gertler, had not progressed to the point where anything could be gained by attempting to legislate for such a rule. Why not? Because even then there was too much disagreement encoded in the controversies about the transmission mechanism of policy to produce a consensus about what such a rule would look like. Even if such a rule were chosen by the Fed, and reported to Congress, everyone would rightly expect that the necessity to deviate from it practically every period would dominate the benefit from generating further predictability in policy. And hence little or no further predictability would result. If, by some strange quirk, the Fed found itself forced or tempted to follow such a rule, macroeconomic policy would surely suffer, and uncertainty would soon return as everyone speculated about the point at which a consensus would build to cast of the shackles of this legislation.
House Republicans Want Fed to Adopt Policy-Making Rules - Several House Republicans are embracing Stanford University economist John B. Taylor’s call for the Federal Reserve to adopt a mathematical rule for determining interest rates, stepping into a long-running debate among central bankers about how to set monetary policy. The House Financial Services Committee will hold a hearing Thursday “Legislation to Reform the Federal Reserve on Its 100-year Anniversary,” at which Mr. Taylor and other Fed critics are scheduled to testify. The hearing will focus on a bill—introduced Tuesday by Republican Reps. Scott Garrett of New Jersey and Bill Huizenga of Michigan–that would, among other things, require the Fed to provide Congress with “a clear rule to describe the course of monetary policy,” according to a committee announcement. Such a rule would be an equation showing how the Fed would adjust interest rates in response to changes in certain economic variables. One well-known example is the Taylor rule, named for Mr. Taylor. Mr. Taylor told The Wall Street Journal last month that under his rule, the Fed should be setting its benchmark short-term rate above 1%, rather than near zero. Economists have been debating for years the relative merits of basing interest rate policy on rules vs. discretion—that is, whether they should adhere to a mathematical formula or maintain some wiggle room based on circumstances and judgment. Mr. Taylor and some Fed officials are in the first camp, saying rules-based policymaking creates more predictability and transparency, leading to better economic outcomes. He praised the legislation on his blog Monday. Others, including Fed Chairwoman Janet Yellen and most top Fed officials, say they need flexibility to veer from the rules when appropriate. In 2012, Ms. Yellen, then the central bank’s vice chairwoman, said Fed officials were using a modified version of the Taylor rule intended to give greater weight to employment, which fell sharply during the recession.
House panel sets hearing to reform Federal Reserve (Reuters) – Republicans in the U.S. House of Representatives, who have proposed bills to audit the Federal Reserve and to limit its policy mandate, on Monday set a hearing to discuss measures aimed at the U.S. central bank. The title of the hearing is “Legislation to Reform the Federal Reserve on Its 100-year Anniversary,” according to a memo from the U.S. House Financial Services Committee. The notice did not cite any specific legislation to be discussed at the hearing, set for Thursday. A spokesman for the committee did not return a call from Reuters seeking more details about the hearing. Committee Chairman Jeb Hensarling has pledged to demand more transparency from the Fed. Some politicians have criticized the central bank for its aggressive actions after the financial crisis to lower unemployment and stimulate the economy using unconventional tools such as a monthly bond-buying program and building a balance sheet that now exceeds $4.5 trillion.
Lawmakers Seek Disclosure of High Earners at Federal Reserve Banks -- Two GOP lawmakers, Reps. Bill Huizenga of Michigan and Scott Garrett of New Jersey, have introduced a bill known as the Federal Reserve Accountability and Transparency Act (FRAT Act), which includes a provision that would require disclosure of Fed officials with high salaries. The main goal of the bill is to require the Fed to use a monetary policy rule in setting its policy. The Republican legislation, which will be the subject of a House hearing Thursday, would need to clear the full House and garner support in the Senate — a step that will be challenging given that chamber’s control by Democrats.One interesting provision of the bill would require the Fed’s Board of Governors to disclose, with a searchable database, the names of all employees in the Fed system who earn more than a GS-15, the top of the federal pay scale for government bureaucrats. The basic GS-15 salary begins at $100,624 a year and climbs to $130,810, according to the U.S. Office of Personnel Management. Cost-of-living adjustments push this scale higher in more expensive cities. In Washington, D.C., and New York, for example, GS-15 can climb up to $157,100. Requiring disclosure of employees earning above the GS-15 scale would require a lot of work at the Fed for one simple reason: The 12 regional Federal Reserve Banks are not subject to the GS system and many of their employees earn higher salaries. The Fed already discloses the salaries of the 12 regional presidents, ranging from $281,300 a year for St. Louis Fed President James Bullard to $410,780 a year for New York Fed President William Dudley. The reserve bank president salaries are far higher than those for the Fed’s Washington-based Board of Governors. Chairwoman Janet Yellen earns $201,700 a year and the other governors earn $181,500. The Fed declined to comment on the bill.
Central Bank Smackdown - The opening riposte came from the Bank for International Settlements, the “bank for central banks.” In their annual report, released this week, they talked about “euphoric” financial markets that have become detached from reality. They clearly – clearly in central banker-speak, that is – fingered the culprit as the ultralow monetary policies being pursued around the world. These are creating capital markets that are “extraordinarily buoyant.”The report opens with this line: “A new policy compass is needed to help the global economy step out of the shadow of the Great Financial Crisis. This will involve adjustments to the current policy mix and to policy frameworks with the aim of restoring sustainable and balanced economic growth.”The Financial Times weighed in with this summary: “Leading central banks should not fall into the trap of raising rates ‘too slowly and too late,’ the BIS said, calling for policy makers to halt the steady rise in debt burdens around the world and embark on reforms to boost productivity. In its annual report, the BIS also warned of the risks brewing in emerging markets, setting out early warning indicators of possible banking crises in a number of jurisdictions, including most notably China.” “The risk of normalizing too late and too gradually should not be underestimated,” On July 2, two days after the release of the BIS report, Janet Yellen took the stage at the IMF conference and basically said (translated into my local Texas patois), “Kiss my grits.” She was having nothing to do with risk and productivity and spent her time defending the low-rate environment she has been fostering in the US. With just a brief hat tip to the fact that monetary policy can contribute to risk-taking by going “too far, thereby contributing to fragility in the financial system,” she proceeded to maintain that monetary policy should “focus primarily on price stability in full employment because the cost to society in terms of deviations from price stability in full employment that would arise would likely be significant.” (You can read the speech here if you have nothing else to do and your recent entertainment options have been limited to watching the microwave cook.)
How Prophets Get Lonely -- Paul Krugman - At Bloomberg View, Leonid Bershinksy weeps over the cruel world that for some reason isn’t listening to Jaime Caruana of the BIS, who warns that we must raise interest rates now now now. Why is this prophet so lonely? Well, it might have something to do with the fact that three years ago Caruana and the BIS warned that interest rates must rise to avert a surge of inflation. That didn’t happen — in fact, low inflation and the threat of deflation came instead. Now, everyone gets things wrong sometimes. But when that happens, you’re supposed to think about why you were wrong, and reconsider your policy views. If the BIS did any soul-searching, nobody else noticed — and it’s still calling for higher rates, with a new justification (and where it used to warn about inflation, now it’s arguing that deflation isn’t so bad.) Why, exactly, should anyone take its views seriously at this point?But being a hard-money guy seems to mean never having to reconsider. I missed my chance to mark the anniversary, but it’s now five years plus since the WSJ warned that wildly inflationary monetary and fiscal policies were bringing on the bond vigilantes. And to read their opinion pages, you’d think they were right all along.
"This Is The Worst Of All Possible Worlds," The Fed "Is Borrowing Returns From The Future" -- Felix Zulauf, James Montier and David Iben: Three legendary investors share their views on financial markets. Everything is pricey ("we will continue to swim in a sea of liquidity; but there might be other events and developments that may not be camouflaged by liquidity which could cause a change of investor expectations.") the European periphery is a bubble ("The Euro crisis is not over...the European economies are not going to change for the better for years to come despite all the cheating and breaking of laws"), Value investors need to venture to Russia ("when you look at today’s opportunity set, you’re left with a set of assets where nothing looks attractive from a valuation point of view") or buy gold mining stocks (" The down cycle could be much bigger than anybody believes if the market realizes that all the actions taken in recent years do not work.") Summing it all up, "there is no question that [sovereigns] lack the fundamental economic base to finally service their debts,"
Yellen Is Flat-Out Wrong: Financial Bubbles Are Caused By The Fed, Not The Market - The selloff last year was a desperate warning about the lack of resilience in credit and funding. That repo markets persist in that is, again, the opposite of the picture Janet Yellen is trying to clumsily fashion. Central banks cannot create that because their intrusion axiomatically alters the state of financial affairs, and they know this. It has always been the idea (“extend and pretend” among others) to do so with the expectation that economic growth would allow enough margin for error to go back and clean up these central bank alterations. That has never happened, and the modifications persist. Resilience is the last word we would use to describe markets right now, with very recent history declaring as much
Central Bank Battles Against Bubbles - Dean Baker - In a Wonkblog post Matt O'Brien discusses central bank efforts to deal with bubbles. . A bubble that threatens the economy is a bubble that moves the economy. If there is a bubble in Uber stock or the price of hops, there is little consequence to the economy when the bubbles burst. The crashes of the stock bubble and the housing bubble led to recessions because these bubbles were driving the economy. This was easy to see in the data in both cases. In the first case, the investment share of GDP hit the highest level in more than two decades as people were able to raise billions in IPOs for utterly nonsense dot.coms. Consumption surged to then record shares of income as the stock wealth effect caused spending to surge. This boost to the economy disappeared when the bubble burst.There was a similar story with the housing bubble. Residential construction hit a record share of GDP, roughly 50 percent above its average over the prior two decades. Consumption surged to an even higher share of income, driven by the housing wealth effect. And, when this bubble burst we got the Great Recession.The other point is that central banks do have many tools other than interest rates to attack bubbles. My favorite is talk. I know it doesn't sound sophisticated and it's not terribly mathematical, but I suspect it would have a very large impact on the housing market if Janet Yellen were to say that she thought house prices were over-valued and that the Fed would be prepared to take steps to bring prices in line with fundamentals. Note that I am referring to an explicit warning backed up by Fed research, not a mumbled "irrational exuberance" subsequently qualified by incoherent gibberish. I would certainly take such a warning seriously if I was thinking of buying a house.
If All Else Fails, You Eat Your Kids - The global financial system owns our societies, banks, politicians, the whole lot. It therefore owns us too, which includes you, and it’s very counterproductive to deny that. It can do what it wants and what it pleases with impunity. It took the finance wizards surprisingly long to figure that out, but they have. This has enabled them to buy everything and everyone they wanted to buy. Yet, as with so many things in life, if and when introduced sufficiently slow and sneaky, people don’t even notice and when they do, they simply see it as a given. “You get used to anything, sooner or later it becomes your life”. This kind of slow and sneaky scheme gets far more persuasive if the perpetrators manage to convince people that it is actually to their benefit. That the scheme is meant to, for instance, lift them out of a crisis. “It’s very complicated, but lucky you, we know much more about this than you do, and you can trust us, since after all, we’re all in this together, we all want and need growth”. Or else, we have armageddon. Or seven plagues. So an insane amount of money has been spent, and pledged, on all sorts of sub-schemes – QE – that ostensibly will solve our problems, and theirs. Only, theirs have to be solved first, because if they’re not, it’s still seven plagues for everyone. There is a man in the street “consumer” base consisting of many hundreds of millions of people in the west that can be drawn on to “finance” the rescue schemes. And if that is not enough, there are hundreds of millions more of their children. Who will all be forced to put in their labor to try and survive.What the perpetrators know, and neither the people nor their children do, is that a recovery is not possible, because as things stand it would have to be built on a pile of debt so large that it makes any recovery impossible. Record stock markets, higher home prices and a tidal wave of good news stories about equal in size to the debt tidal wave, have kept the public in the dark about this painfully simple fact. Meanwhile, not only is the bankrupt financial system being kept alive, it’s made much richer.
Charting The Death Of The Saver -- Euthanasia of the rentier appears to be increasingly the modus operandi of the central planning caste of the world. As we noted previously, Bernanke's (and now Yellen's) plan to exterminate savers is wholly unsustainable, The Fed's insistence that "our savers collectively have to hold all the assets of the economy and a strong economy produces much better returns in general" must be juxtaposed with comments from a money manager that "I don't think that's a fair-trade" for money intended to be invested safely." By removing the last shred of hope for a rise in savings rates anytime soon, the Fed is once again creating the potential for major unintended consequences as the collapse in interest income for US savers from the 2008 peak forces them to extend duration (TSYs), lower quality (corporate bonds), and/or increase leverage/risk (equities).
On Losing Interest - Krugman -- No, it’s not about boredom. Instead, a further thought on the question of who might be upset about low-interest-rate policies. Low policy rates plus quantitative easing have indeed meant much lower interest earnings across the board, and this is a serious hit to the incomes of those who own interest-bearing assets. So who are we talking about? Yes, there are some middle-class retirees collecting interest on their CDs. But the big losers are people with very high incomes. Again from the Piketty-Saez data, we can track the decline in interest incomes from 2007 to 2011 (measured in 2012 dollars) and compare it with income in 2007 at different percentiles. Here’s what it looks like:Photo Credit It’s not a big deal for people in the bottom half of the top 10 percent, who might well consider themselves middle class. But among the top 0.01 percent, low interest rates have actually been a bigger income hit than Obama’s tax hikes (partial reversal of Bush cuts plus the ACA surcharge).You’re living in a fantasy world if you don’t think this has something to do with the diatribes against currency debasement and all that.
More on Class and Monetary Policy - Paul Krugman - A bit more on the question of whose interests are served by hard-money ideology: One way to identify what you might call the creditor class is to look at who derives a lot of income from interest. The Piketty-Saez tables calculate interest income as a share of total income for various percentiles of the income distribution; I looked at the numbers from 2007, when the crisis had not yet struck and returns were “normal”. It looks like this: So interest is a significant source of income only for people high in the distribution; it gets really big for people with very high incomes. These are the people who have a lot to lose if inflation erodes the values of their assets, and a lot to gain if inflation comes in below expectations or there is actual deflation. So hard-money ideology is, to an important extent, a reflection of class interests — not so much the one percent as the 0.01 percent.
Fellow Travelers of the Depression Lobby - Dean Baker -- Paul Krugman took off the gloves in his column today. He said that much of the opposition to the Fed's low interest rate policy stems from the narrow interest of very rich people who earn lots of interest on their money. Krugman argues that the reason the argument against low interest rates continually reappears in different forms is the money that the 0.01 percent have at stake in protecting their interest income. While we are on the topic of interests determining views on monetary policy, let's take a step over to a different, but arguably more important issue: dollar policy. The key point here is that the value of the dollar is the main determinant of the trade deficit. The basic point is simple. When the dollar is highly valued in terms of foreign currency (i.e. it takes a lot of euros, yen, or yuan to buy a dollar) our goods and services become more expensive relative to the goods and services produced by other countries. This means we will import lots of items from other countries, because they are cheap to us, and they will buy few of our exports, because they are expensive to them. In other words, we will have a large trade deficit. If we have a trade deficit of $500 billion (@ 3 percent of GDP), which we do, this is demand that we are generating in other countries rather than here. We have no simple mechanism for replacing this demand. We could have large budget deficits, but that route is prohibited by the bi-partisan cult of balanced budget worshiping. We can try to have the Fed boost the economy with low interest rates, quantitative easing, and other such policies, but these paths have a limited impact on growth, at least as we have seen to date. This means that we have no good route for filling the demand gap created by the trade deficit. This might lead us to believe that a lower valued dollar should be item number one, two, and three on everyone's economic agenda. Yet, it rarely appears on anyone's to-do list.
Fed Watch: Inflation Hysteria Redux -- I am in general agreement with Calculated Risk on this point:I also think the economy is picking up, and I agree that as slack diminishes, we will probably see real wage growth and an uptick in inflation. Moreover, note that this is largely consistent with the Federal Reserve's outlook as well. Recall St. Louis Federal Reserve President John Williams from April, via Bloomberg: Williams, who forecast the Fed will start raising interest rates in the second half of next year, said inflation has “bottomed out” and will gradually accelerate to the central bank’s 2 percent target. He said prices have been held down by temporary forces such as a slowdown in health care costs. The Federal Reserve has consistently predicted higher inflation, and consistently been surprised that that inflation has not yet arrived despite rapidly falling unemployment rates. It would appear, however, that their forecasts are finally coming true. Hence, I also agree with Calculated Risk when he says: I'm sympathetic to people like Joe Weisenthal at Business Insider who is looking for signs of inflation increasing; I'm starting to look for signs of real wage increases and inflation too. I just think inflation isn't a concern right now. It is enough to simply say that inflation is coming. That in and of itself is insufficient. Any inflation call needs to be placed in the context of magnitude and expected monetary policy response. Regarding both, follow Calculated Risk's warning: Monetary policy can't halt the violence in Iraq or make it rain in California - and this is why it is important to track various core measures of inflation. The Fed doesn't target core inflation. They target headline inflation. But they also believe that headline inflation will revert to core, and as such tend to be more concerned with core inflation in excess of 2%. Consider the history of core inflation since 1985:
Fed's Kocherlakota downplays recent inflation rise One of the Federal Reserve's leading doves downplayed recent higher readings on inflation on Tuesday, saying he expects the price level to stay below the central bank's target for several more years, possibly even until 2018.While inflation has climbed over the past three months and is now up 1.8% over the past year, "many large fluctuations in [the personal consumption expenditure index] inflation end up being purely transitory," said Narayana Kocherlakota, the president of the Minneapolis Fed, in a speech to the Minnesota Business Partnership . "I currently see the probability of inflation's averaging more than 2% over the next four years as being considerably lower than the probability of inflation's averaging less than 2% over the next four years," he said. Low inflation means that resources are being wasted, Kocherlakota added, notably in the form of unemployed workers. "There is still significant underutilization of our country's most important resource - its people," he said. The unemployment rate, which fell to 6.1% in June "could well overstate the degree of improvement in the U.S. labor market," he added. As a result, the Fed is undershooting its price stability objective and underperforming its maximum employment objective, he said. Kocherlakota is a voting member of the Fed policy committee this year.
Fed’s Lockhart Isn’t Convinced of Firmer Inflation Trend - A top Federal Reserve official said on Friday that policy makers needed more time to determine whether a recent pickup in inflation from levels regarded as undesirably low is likely to persist. Dennis Lockhart, president of the Atlanta Fed, repeated his view that the central bank should keep interest rates near zero at least until the middle of next year. Other officials have been hinting that firmer economic growth may warrant a move sooner than that. Mr. Lockhart told Bloomberg Television some of the factors pushing up inflation, such as energy prices, could be transitory. “I welcome the firming of [inflation] rates that we’ve seen in the last very few months. Whether those numbers make a trend—and it’s a trend that we want, the sustainability of inflation around 2%—remains to be seen,” he said. “I’m not sure yet, I want to watch the numbers for a while to determine whether it is going to hold. It’s a little early to make such a call.” Mr. Lockhart emphasized inflation had been running well below the Fed’s target for several years. “I am still in the camp of wanting to see a test of time to prove that we, in fact, are going to see rates near or at our target of 2%,” he said.
Fed’s Kocherlakota: It Could Take 4 Years to Get Back to 2% Inflation -- Federal Reserve Bank of Minneapolis President Narayana Kocherlakota said Tuesday it could take nearly half a decade for inflation to get back to levels central bankers deem appropriate. The Fed is “undershooting its price stability goal” of 2% inflation and will likely continue to do so for some time to come. Mr. Kocherlakota says that he sees the probability of inflation averaging more than 2% over the next four years as being “considerably lower” than the probability of inflation coming in less than 2% over the same time period. “We need to do better,” the official said. Mr. Kocherlakota’s remarks largely the same as an address he gave in late May. The official did not make any forward-looking comments about the monetary-policy outlook in his formal remarks, but he was due to take questions from the audience and reporters. Mr. Kocherlakota has been among the Fed’s strongest supporters of using monetary policy aggressively to help drive up growth and lower unemployment. In the spring, he offered a formal dissent against the monetary-policy setting Federal Open Market Committee’s decision to move toward vaguer guidance regarding the factors that will eventually cause it to raise interest rates. Mr. Kocherlakota reiterated that he is skeptical that improvements in the job market are strong as they seem.
Fed’s Evans: Inflation Over 2% Not Necessarily a Catastrophe - Federal Reserve Bank of Chicago President Charles Evans said Friday it’s pretty unlikely the economy will suddenly grow fast enough to drive him to move forward his expected timing of the central bank’s first interest rate increase. Speaking to reporters, Mr. Evans said he could envisions a scenario where economic growth accelerated very sharply relative to expectations, inflation moved back toward the Fed’s target and wage gains returned to their historic levels. “I could see that happen, but it’s not my highest likelihood,” and as a result, it’s possible, but pretty unlikely, that the Fed would move forward the time in which it would raise short-term interest rates off their current near zero percent levels, he said. Mr. Evans comments came from an appearance before an event held by the Global Interdependence Center in Jackson Hole, Wyo. Mr. Evans is one of the Fed’s strongest defenders of taking aggressive action to spur growth. In his formal speech, he said the central bank faces little pressure to raise rates given that the job market is still showing weakness and inflation is under the Fed’s official 2% target.
Waiting for inflation - The Economist - OVER the last six months, America's labour market seems to have strengthened meaningfully, if not exactly dramatically. At the same time, the long trend toward steady disinflation seems to have come to a halt, or at least paused. Inflation as measured by both the consumer price index and the price index for personal consumption expenditures (the Fed's preferred gauge) has ticked back up toward the Fed's 2% target. Some economic writers, like Business Insider's Joe Weisenthal, reckon there might be even more ahead. So, what are the odds of a bout of above-target inflation? Most of the time, the Fed's overriding concern is stabilisation of the inflation rate at a level a bit below 2%. What that means in practice is that headline inflation will move around a bit, thanks to swings in commodity prices or other supply-side influences that are not expected to feed through in any significant way to underlying, or core, inflation. Core PCE inflation will be much less volatile, and will, over the medium run, hover basically where the Fed wants it. As Tim Duy writes in an excellent post on the subject: If you are making a short-term bet on higher headline inflation, primarily you are making a bet on energy and food. That bet is about the Middle East and weather, not monetary policy. I don't have an opinion on that bet. If you are betting on inflation over the medium-term, primarily you are making a bet on higher core inflation. More to the point, you are betting against the Fed. Betting against the Fed? In 1981, core PCE inflation was nearly 10%. The Fed then induced a major recession, and over the next 12 years core inflation declined steadily. Since 1994, year-on-year core PCE inflation has never been as high as 2.5%. Indeed, David Beckworth argues pretty compellingly that since 2008, the Fed has essentially been targeting a corridor for core PCE inflation of between 1% and 2%.
It's All But Official: There is No 2% Inflation Target - Rather, there is a 2% upper bound to the Fed's inflation target. This is an argument that Ryan Avent, Matt Yglesias, Paul Krugman, and others have been making for some time. I am sympathetic to this view and have made the case that the Fed has been effectively targeting a core PCE inflation corridor of 1% to 2% over the past five years. The evidence continues to mount in favor of this view. First, consider the timing of the Fed's QE programs and changes in the core PCE inflation rate as seen below. The figure suggests that the FOMC iniatiates QE programs when core inflation is under 2% and has been falling for at least six months. It also indicates the FOMC tends to end QE programs when core inflation is above 1% and has been rising for at least six months. That ending of QE3 in October later this year follows this pattern. Reinforcing this point, the Fed's purchases of treasuries since the crisis started is correlated with changes in core PCE inflation. Specifically, changes in the Fed's holdings of treasuries as percent of all treasuries can explain almost half of the variation in core PCE inflation since 2007 as seen below: Second, consider the central tendency ranges of inflation forecasts provided by members of the FOMC. This information can be found in the 'projection' material. These forecasts are consistent with the observed core PCE inflation data highlighted above. They consistently show 2% as an upper bound.
Inflation Targeting: A Monetary Policy Regime Whose Time Has Come and Gone - Inflation targeting emerged in the early 1990s and soon became the dominant monetary-policy regime. It provided a much-needed nominal anchor that had been missing since the collapse of the Bretton Woods system. Its arrival coincided with a rise in macroeconomic stability for numerous countries, and this led many observers to conclude that it is the best way to do monetary policy. Some studies show, however, that inflation targeting got lucky. It is a monetary regime that has a hard time dealing with large supply shocks, and its arrival occurred during a period when they were small. Since this time, supply shocks have become larger, and inflation targeting has struggled to cope with them. Moreover, the recent crisis suggests it has also has a tough time dealing with large demand shocks, and it may even contribute to financial instability. Inflation targeting, therefore, is not a robust monetary-policy regime, and it needs to be replaced.
The Unemployment Cost of Below-Target Inflation: Recently, inflation in the United States has been consistently below its 2% target. The situation in Sweden is similar, but has lasted much longer. The Swedish Riksbank announced a 2% CPI inflation target in 1993, to apply beginning in 1995. By 1997, the target was credible in the sense that inflation expectations were consistently in line with the target. From 1997 to 2011, however, CPI inflation only averaged 1.4%. In a forthcoming paper in the AEJ: Macroeconomics, Lars Svensson uses the Swedish case to estimate the possible unemployment cost of inflation below a credible target... The unemployment rate would be about 0.8% lower if inflation averaged 2% (and presumable lower still if inflation averaged slightly above 2%). ... Svensson concludes with policy implications:"I believe the main policy conclusion to be that if one wants to avoid the average unemployment cost, it is important to keep average inflation over a longer period in line with the target, a kind of average inflation targeting (Nessén and Vestin 2005). This could also be seen as an additional argument in favor of price-level targeting...On the other hand, in Australia, Canada, and the U.K., and more recently in the euro area and the U.S., the central banks have managed to keep average inflation on or close to the target (the implicit target when it is not explicit) without an explicit price-level targeting framework.
Knutty Asset Prices - Paul Krugman - Neil Irwin has a nice piece about high asset prices that actually ties into my Wicksell discussion from earlier today. What Irwin points out is that the price of just about every asset category is now high by historical standards. Bond prices in “safe” countries are very high, which is the same thing as saying that interest rates are very low. But so are prices of risky sovereign debt — Paul De Grauwe points out that Spain’s borrowing costs are now the same as Britain’s. Corporate bond rates are low; stock prices are high; all across the board, assets are up. The proximate cause is obvious: policy interest rates are very low, and expected to remain low, so money is pouring into alternative assets, driving their yields down too. The question is what you think about this situation.Quite a few people — including a lot of people on Wall Street, at the BIS, and so on — look at this and say that it’s terrible: the Fed is keeping interest rates “artificially low” and thereby distorting asset prices across the board, and it will all end in grief. But although I hear the phrase “artificially low” all the time, I don’t think many people who use it have thought through what they mean. What would a non-artificial interest rate be?
Class and Monetary Policy - Paul Krugman - I’ve been writing a lot lately about the continuing influence of inflation hysterics despite their awesome wrongness over the past five-plus years. One question that naturally arises is whose interests are served by this unjustified influence. You don’t want to be too crude about it. I don’t think there are a lot of clear-headed hard-money types who secretly admit to themselves that their models have failed and that the policies they advocate could mire the economy in a permanent slump, but nonetheless say what will support their class interests. Instead, interests feed ideology, and the ideologues may then be sorta-kinda sincere in their beliefs. Still, it is worth asking who benefits from low inflation or deflation, and from higher interest rates. And the answer, basically, is rich old men. On the rich part: Using SIPP data, we can look at the comparison between financial assets and debt by household net worth: Only the top end have more financial assets (as opposed to real assets like housing) than they have nominal debt; so they’re much more likely to be hurt by mild inflation and be helped by deflation than the rest.
Who Wants a Depression?, by Paul Krugman -- One unhappy lesson we’ve learned in recent years is that economics is a far more political subject than we liked to imagine. ... I’ve written a number of times about the phenomenon of “sadomonetarism,” the constant demand that the Federal Reserve and other central banks stop trying to boost employment and raise interest rates instead, regardless of circumstances. I’ve suggested that the persistence of this phenomenon has a lot to do with ideology, which, in turn, has a lot to do with class interests. And I still think that’s true. But I now think that class interests also operate through a cruder, more direct channel. Quite simply, easy-money policies, while they may help the economy as a whole, are directly detrimental to people who get a lot of their income from bonds and other interest-paying assets — and this mainly means the very wealthy, in particular the top 0.01 percent. ... Complaints about low interest rates are usually framed in terms of the harm being done to retired Americans living on the interest from their CDs. But the interest receipts of older Americans go mainly to a small and relatively affluent minority..., and it surely explains a lot of the hysteria over Fed policy. The rich ensure that there are always plenty of supposed experts eager to find justifications for this attitude. Hence sadomonetarism.
High Asset Prices, the Savings Glut, Secular Stagnation, and Unemployment -- Dean Baker - Neil Irwin has an interesting piece in the NYT noting how high prices for a wide variety of assets have driven returns down to historical low levels. He notes that this is a predictable outcome, and in fact an intended result, of the low interest rate policy being pursued by the Fed and other central banks. The idea is that high asset prices make it cheap for firms to borrow to finance new investment. They also make it easier to buy a home and allow many people who had higher interest rate mortgages to refinance into lower cost ones, thereby freeing up money for other types of consumption. There is also a wealth effect whereby higher stock and house prices will translate into increased consumption. Through these channels central banks hope to provide some boost to growth. However the flip side of this policy is that investors can anticipate lower returns on their savings, unless they want to hold exceptionally risky assets. This is the idea of there being a savings glut, or as Irwin suggests today, a shortage of adequate investment opportunities. A savings glut implies an economy that is not producing at its capacity. To cut through the nonsense, savings in an economic sense means not spending. From the standpoint of the economy, it is just as much savings if you put $1,000 in the stock market, a checking account in your bank, stuff it under your mattress, or burn it in your fireplace. Anything that does not involve the purchase of a newly produced good or service means saving. Saying that we have a saving glut means we have an economy that does not generate enough demand to keep the economy at full employment. This is of course the story of secular stagnation that folks like Larry Summers have recently discovered and the problem that some of us pre-mature secular stagnationists have raised for years. The idea that the economy could be subject to an ongoing problem of inadequate demand used to be grounds for eviction from the realm of serious economists. But anyone who is willing to look at the evidence with a straight face really can't escape this conclusion.
Is The Fed Going To Attempt A Controlled Collapse? -- As most Fed watchers know, last week was interesting because Janet Yellen, speaking at IMF came out and said something quite surprising. In a nutshell, she said “It’s not the Fed’s job to pop bubbles”. While many market participants immediately took this to mean, “To the moon, Alice!” and started buying equities hand over fist, there’s another possible explanation for Mrs. Yellen’s proclamation of unwillingness: The Fed could be preparing to do exactly what it said it wouldn’t. Bringing forward the next leg of the cycle, may well be on the Fed’s agenda.
5 Years After the Great Recession, Our Economy Still Far from Recovered - This June marks the five-year anniversary of the end of the Great Recession, but champagne toasts would be distastefully premature, as the U.S. economy remains far from fully recovered. Perhaps unsurprisingly, a March NBC News/Wall Street Journal poll showed 57 percent of surveyed American adults believed the United States was still in a recession (although that is the lowest share of respondents under that impression since early 2008). The Great Recession officially began in December 2007 and ended in June 2009, according to the National Bureau of Economic Research, which determines the start and end dates of U.S. recessions based on a range of economic indicators. Now, five years after emerging from recession, the best metrics of economic health suggest the economy is only between one-third and half of the way to fully recovered. What are the key features of this continued sluggishness in the economy? Early into the recovery, roughly 11 million jobs were needed to restore the unemployment rate to pre-recession levels. Today, that number stands at an improved, but still staggering 7 million jobs needed, according to estimates by both the Economic Policy Institute and the Brookings Institution. Less than 40 percent of the employment shortfall caused by the Great Recession has been closed.
"Don't Worry, Be Happy" Fed Financial Stress Index At Record Low For 3rd Week -- Feeling stressed? Worried about the financial markets? Don't be - the Fed has an index for that. The St. Louis Fed 'financial stress index', constructed from 18 weekly data series (6 interest rates, 6 yield spreads, and 5 others) fell to a record low for the 3rd week in a row signaling all-clear... right? Just one thing, in a world entirely disintermediated by central banking largesse, just how relevant are these 'market' indications of financial stress? As Bloomberg warns, the financial stress index has now been below zero for 130 consecutive weeks, the longest period since 2008.
Current economic conditions -- I am a little slow responding to the stunning revision to the first-quarter GDP estimates that came out two weeks ago, but here are my thoughts about the new estimates. The Bureau of Economic Analysis announced on June 25 that U.S. real GDP fell at a 2.9% annual rate during the first quarter, compared with an initial estimate of 0.1% growth for the quarter that the BEA had initially put out in April. The revision sets a couple of records. For one, it makes 2014:Q1 the worst quarter for GDP since World War II that was not part of an economic recession. The next closest contenders were a drop of almost 2.9% in the second quarter of 1981 and a 2.2% drop in the third quarter of 1973. Each of those was followed by a single quarter of solid GDP growth after which the economy fell into a full-blown recession, constituting some of the evidence behind Jeremy Nalewaik’s claim that the economy often reaches a stall speed just before falling into a recession. A second record was noted by Jason Furman: the estimates of GDP growth for 2014:Q1 represent the largest revision from an advance estimate to a third estimate, as well as the largest revision from a second estimate to a third estimate, in the roughly thirty years the Bureau of Economic Analysis has done these estimates. The biggest single source of discrepancy from the earlier estimates came in health care services, which account for 1/6 of total personal consumption expenditures. Last month the BEA had claimed that health care added 1 percentage point to the Q1 GDP growth rate, whereas the new estimate is that it instead subtracted 0.2 percentage points. Jason Furman explains that the main survey that the BEA uses to track health care spending was not available until this month, and hence there was considerable guesswork in the original estimate. The second most important factor in the revision is that the Q1 deterioration of exports is now seen as even worse than originally reported, with lower exports subtracting 1.2 percentage points from the GDP growth rate. Part of this may be payback for unusually strong export numbers for 2013:Q4. But if it signals a weakening in China or other key trading partners it could be more worrisome.
In U.S. Data, a Baffling Contradiction - The first quarter of this year was the worst for the United States economy since the depths of the Great Recession in early 2009. During the same period, employers hired more people than in any quarter over the last six years, signaling gathering strength in the economy. It is hard to imagine how both of those statements could be true, but they are what government statistics indicate. While the employment numbers have been strong, the government sharply cut its estimate of first-quartergross domestic product late last month. It had previously said the economy declined at an annual rate of 1 percent during the quarter — a small dip that could be explained by severe weather in much of the country. The new figures showed a 2.9 percent rate of decline, the worst since a 5.4 percent drop in the first three months of 2009. What happened? Put simply, a single government survey produced highly dubious numbers. Those who conduct the survey say it was done normally and that nothing suspicious surfaced in the responses. The result was suspiciously low revenue estimates for companies in both health services and food retailing. In May, the Bureau of Economic Analysis of the Commerce Department, which produces the G.D.P. figures, estimated that in the first quarter such spending rose at an annual rate of 9.7 percent before adjusting for inflation. That would have been the largest quarterly increase in 13 years. But the revised estimate released in June said that spending on health care services fell at an annual rate of 0.9 percent. Instead of the largest increase in more than a decade, it was the first decline in nearly half a century, since the third quarter of 1965. That one change accounted for most of the decline in the estimate for overall first-quarter G.D.P.Behind that reversal were the results of a quarterly survey of service providers. The survey, conducted by the Census Bureau, asks 18,000 companies in 11 service industries about their revenue and expenses. Health care providers, including physicians and hospitals, reported a decline in revenue from the previous quarter. Because that survey is supposed to cover all sources of revenue, including money from patients, insurance companies and the government, it is taken as definitive in calculating spending on health care services.
Gross domestic problem - On June 25, the U.S. Bureau of Economic Analysis released its highly anticipated gross domestic product numbers and revised the negative first quarter estimates downward. Increasingly, the fate of presidents and governors as well as macroeconomic policy is tied to these numbers. But as we consider the economic challenges of the 21st century, it is increasingly clear that conventional metrics of growth are inadequate. GDP measures the economic output of a coal plant, but it doesn’t tell us how many children get asthma or tally deaths from coal-related air pollution. As Robert F. Kennedy said in 1968, “Our gross national product now is over $800 billion dollars a year, but … that gross national product counts air pollution and cigarette advertising and ambulances to clear our highways of carnage.” Economists have long known the difficulties in using production as a proxy for progress, but that arcane debate has rarely leaked into the broader public discussion. More than four decades later, the threat of climate changes forces us to confront the question of what we are sacrificing for growth. GDP is a fine measure of the goods and services produced within a country’s borders. However, it does not tell us how sustainable that growth is or at what cost it comes. As a group of social scientists argued in a January issue of Nature, “If a business used GDP-style accounting, it would aim to maximize gross revenue — even at the expense of profitability, efficiency, sustainability or flexibility.” It’s time for the United States to adopt new economic measures that better account for the environmental and social costs of growth.
GDP and the Public Sector - Lew Daly has an interesting, but unfortunately misdirected, critique of the measurement of the public sector's contribution to GDP. He notes several areas, such as infrastructure and education spending, where the government contributes to our well-being, but which are not directly picked up in GDP as contributions from the government. While the point is true, the piece fundamentally mistakes what GDP is and also grossly understates the government's role in the economy. First, GDP is a measure of economic activity. It is not a comprehensive measure of societal well-being and anyone who tries to use it as such is showing off their ignorance. GDP can be thought as being comparable to weight. It is difficult to imagine a doctor doing a medical exam and not wanting to know the patient's weight. It is useful and important information. If a person is 50 percent above or below their ideal weight, it likely means they have a serious health issue. On the other hand, someone could be right at the ideal weight for their body type and still be dying of cancer. Any doctor who ended their check-up with writing down what the scale shows has done some serious malpractice. Similarly, GDP is telling us the value of goods and services the economy produced. It is not telling us whether the pollution that results is killing us, whether it all went to produce weapons and prisons, or whether Bill Gates and his kids pocket it all. We need other measures to evaluate such things, and we have them, but they are not GDP.
US economy: The productivity puzzle -- To glimpse the miracle of productivity growth there is nowhere better to look than the US Corn Belt. A hundred years ago, an army of farmers toiled to produce 30 bushels an acre; now only a few hands are needed to produce 160 bushels from the same land. The rise of modern civilisation rested on this trend: for each person to produce ever more. For the past 120 years, as if bound by some inexorable law, output per head of population increased by about 2 per cent a year. That is, until now. There is a fear – voiced by credible economists such as Robert Gordon... – that 2 per cent is no law but a wave that has already run its course. According to Prof Gordon’s analysis, 2 per cent could easily become 1 per cent or even less, for the next 120 years. Growth in gross domestic product, the familiar statistic by which all economies are measured, can come about in several ways: more workers, with better skills; more capital such as factories, roads and machines, or new technology. Leaving aside the latter category, the consensus among economists is that most of these will not contribute as much to economic growth as they have in the past. To start with, US population growth is at its lowest since the 1930s, having fallen from about 1.2 per cent a year in the 1990s to 0.7 per cent in recent years. This does not affect growth in living standards – it means fewer consumers as well as fewer workers – but adding less extra labour will slow the headline GDP growth rate that the Fed worries about. On top of that, demographics will also slow growth in GDP per capita, which does affect living standards. Ageing will mean fewer active workers per head of population; most women have now joined the US labour force so that source of extra workers is running out.The truest measure of economic progress, though, is the growth of GDP per hour worked. For every hour of human toil, how much is created? Here too, some factors that drove growth in the past are weakening, such as skills and education.
New Tool from Atlanta Fed: GDPNow - The Atlanta Fed has introduced a nowcast of GDP called GDPNow. The model mimics the BEA's methods to estimate GDP and is updated five to six times a month as data is released. The model tends to converge to the BEA estimate just before the BEA advance estimate for GDP is released each quarter.Here is a discussion of the model: Introducing the Atlanta Fed's GDPNow Forecasting Model We will update the nowcast five to six times each month following the releases of certain key economic indicators listed in the frequently asked questions. Look for the next GDPNow update on July 15, with the release of the retail trade and business inventory reports. If you want to dig deeper, the GDPNow page includes downloadable charts and tables as well as numerical details including the model's nowcasts for GDP, its subcomponents, and how the subcomponent nowcasts are built up from both the underlying source data and the model parameters. This working paper supplies the model's technical documentation. We hope economy watchers find GDPNow to be a useful addition to their information sets. Here is the current Q2 nowcast: The GDPNow model forecast for real GDP growth (SAAR) in 2014: Q2 was 2.6 percent on July 10, unchanged from its July 3 value.
Why we suck -- This chart from the Federal Reserve Bank of Philadelphia depicts one of our central economic dilemmas. The blue line is actual Gross Domestic Product, adjusted for inflation. The black line is, or I should say was “full employment GDP” as foreseen in 2007 by the Congressional Budget Office. The vertical distance between the two lines is known as the output gap. Depending on how you calculate it, the gap runs from six to ten percent of GDP. One percent of current GDP is about $170 billion. One percent of national employment is about a million and a half people. In terms of current GDP (about $16.8 trillion), if you give up, say, five percent of GDP on a yearly basis from 2009 (the end of the recession) to 2014, you have given up $850 billion. More if you include the recession proper, defined as the peak of the business cycle to the ‘trough.’ The trough is the low point of the blue line. The economy has grown since the end of the recession in 2009, but we’re still nowhere near full employment. The unemployment rate, defined as those looking for work divided by those looking and those employed, has fallen significantly since 2009, but an appreciable portion of that decrease is due to those who have given up looking for work, sometimes described as “missing workers.” In subsequent posts I will lay out more numbers on labor force drop-outs.To make matters worse, the projections of potential GDP have been repeatedly revised downward since 2007. So the “output gap” has narrowed not because of an economic recovery, but because the longer-term outlook has worsened. Underlying the revisions are downward revisions of projected labor force participation. These revisions should not be attributed to the aging of the population. That aging has been anticipated since the 1950s. What is instead being observed are labor force drop-outs — unemployed workers who have given up looking for work — in excess of those due to aging.
The Government Just Posted Its First Four-Month Budget Surplus In Years - The U.S. government posted a net surplus over a four-month period for the first time since 2007 in the March-June, according to the latest monthly Treasury statement. For June, the surplus totaled $71 billion. That actually fell short of expectations of a surplus of $80 billion. Still, Washington is now on pace to record the lowest annual deficit since 2008, with a fiscal year to date deficit of $366 billion. That's 28% less than the shortfall recorded in the same period last year, according to Marketwatch, thanks mostly to increased revenue. “Deficits are rapidly declining,” Paul Edelstein, director of U.S. financial economics at IHS Global Insight Inc. in Lexington, Massachusetts, said before the report according to Bloomberg. “A lot of it is coming on the revenue side, mostly from taxes -- there were increases in payroll taxes last year, which are still being felt this year, corporate profits are up and they are paying more in taxes.” Here's the chart:
The Wonk That Never Was - Paul Krugman - Danny Vinik says that the “reform conservatives” may have decided to stop supporting Paul Ryan, which he says may pose a problem for the GOP’s erstwhile intellectual leader: Ryan has long had passionate supporters among conservative intellectuals. Whenever Paul Krugman called Ryan “unserious,” they were often there to defend him. But Ryan is walking into a fight where he may not have the support from a large swath of conservative wonks—and that could put his carefully crafted reputation at risk. But, you know, I didn’t just call Ryan unserious; I showed that he was unserious. It has been obvious since his first budget “plan” that he was just pretending to be a budget wonk; look even briefly at anything he has put out and it turns out to depend crucially on magic asterisks. Strip those out and he turns out to combine huge tax cuts for the rich with savage but smaller cuts in aid to the poor and the middle class, increasing inequality while worsening the deficit. So Ryan wasn’t just a fake wonk, but an obviously fake wonk. And what does that say about the supposed wonks who passionately defended him?
The US will start running out of money for roads in August. Here’s why. By the end of August, the highway portion of the Highway Trust Fund is expected to run out of money. If that happens, the federal government will have to start cutting back on the money it sends to states for transportation projects. (Once the fund is depleted, incoming revenues will be insufficient to cover all of federal spending.)As a result, many states are likely to halt or delay planned work on roads and highways across the country. (A separate fund for mass transit is scheduled to be depleted in October.) By one estimate, some $47 billion in state projects are at risk. And the Obama administration has warned that the cutbacks could imperil some 700,000 jobs. Congress could avert these cuts by simply replenishing the Highway Trust Fund. But there's a lot of disagreement about how to do so. Traditionally, revenues from the federal gas tax were enough to finance federal transportation spending. But gas-tax revenues have declined of late, and many politicians are unwilling to raise the tax to compensate. So Congress is discussing convoluted ways to scrounge up the money — from scaling back Saturday postal deliveries to fiddling with tax rules for corporations. Below is a primer on the highway funding mess — as well as some of the proposed solutions:
Whither the Highway Trust Fund? - Smoothing pensions to fund highways: A bumpy, short road. The House Ways & Means Committee will include “pension smoothing” in a $10.9 billion highway funding bill to be marked up tomorrow. In 2012 lawmakers covered two years of highway and transit funding by allowing employers to delay tax-deductible contributions to employee pension plans, raising companies’ taxable income and federal revenue. The current bill would raise $6.4 billion through pension smoothing, $3.5 billion through customs user fees and the transfer of $1 billion from a fund used to clean up leaking underground storage tanks. It would extend the life of the Highway Trust Fund through May, 31 2015. But the plan may run into trouble in the Senate, where West Virginia’s Jay Rockefeller insists that pension smoothing revenue be used to fund coal miners’ retirement, not road construction.
Coalition Prods Congress on Transportation Fund - With both the legislative calendar and the Highway Trust Fund nearly exhausted, a broad coalition of business groups and labor unions will push this week to shake Congress from its stasis and approve federal infrastructure spending before transportation projects begin to dry up in August.Fierce resistance from conservative Republicans to replenishing the Highway Trust Fund and reauthorizing the federal Export-Import Bank has yielded rare public laments from business leaders about the state of politics — especially in the Republican Party, where Tea Party-fueled populism has undermined the party’s longtime support for business.Business leaders said that inaction by Congress could imperil the economic recovery just as jobs are increasing at a rate that could presage a period of sustained growth. Jay Timmons, president of the National Association of Manufacturers, said business fealty to Republican politics allowed the pro-business wing of the Democratic Party to wither, a movement that now threatens pro-business Republicans. “Sadly, we accepted their losses, and as a result business became reliant on the benevolence of just one party,” “Now today, there are fringe elements who are using intolerant social propaganda and distorting the records of honorable men and women, driving them into the wilderness of defeat,” Thomas J. Donohue, president of the U.S. Chamber of Commerce, begged Congress to approve the first increase in the federal gas tax since 1993, although he conceded courage “seems in short supply in Washington.”
Goldman Sachs: Funding for Highway Construction Appears Likely - A few comments from Goldman Sachs economist Alec Phillips:The House and Senate both appear to be finally moving forward with plans to provide additional funding for the nearly exhausted highway trust fund and to extend the program through at least year end, though there are still several areas of disagreement that need to be worked out. Resolution of the issue by later this month should provide greater certainty to state governments that might otherwise pull back on new construction in the absence of a legislative fix. The legislation that is beginning to move through Congress is notable in two other respects. First, it makes no changes to international corporate tax rules (i.e., corporate inversions), seemingly taking the prospect for congressional intervention off the table until after the election. Second, the House plan would lower the minimum contribution that defined benefit pension plan sponsors must make for the next few years, reducing DB pension plans' demand for financial assets but increasing their tax liabilities.... Our expectation is that without a viable long-term funding mechanism a multi-year renewal of the program will be difficult. The gasoline tax that has traditionally funded most federal transportation spending has not been raised since 1993 and receipts have not kept up with the increased spending out of the fund. Unless a solution can be found--either a gasoline tax increase or a new long-term funding source--Congress may simply adopt a series of short-term renewals.
This Road Work Made Possible by Underfunding Pensions - The Federal Highway Trust Fund is expected to run out of money in August. So, naturally, Congress is debating a temporary fix that involves letting corporations underfund their pension systems. Of course, we could replenish the fund by raising the federal gasoline tax, which is its primary source of financing. That’s But increasing gas taxes is unpopular, so Congress hasn’t done so since 1993, which means that the tax on gas has actually fallen 39 percent over the last 21 years after you adjust for inflation. Instead, Congress has used a series of gimmicks and shifts to keep the fund solvent as highway construction costs have risen.The latest proposal, which passed the Republican-controlled House Ways and Means Committee on Thursday, works like this: If you change corporate pension funding rules to let companies set aside less money today to pay for future benefits, they will report higher taxable profits. And if they have higher taxable profits, they will pay more in taxes over the 10-year budget window that Congress uses to write laws. Those added taxes can be diverted to the Federal Highway Trust Fund.Unfortunately, this gimmick will also result in corporations paying less in taxes in later years, when they have to make up for the pension payments they’re missing now. But if it happens more than 10 years in the future, it doesn’t count in Congress’s method for calculating budget balance. “Fiscal responsibility,” as popularly defined in Washington, ignores anything that happens after 2024. Letting companies underfund pensions so they pay more taxes is a dumb idea, but it’s not a new one: A similar strategy was part of the last bipartisan highway bill, which passed in 2012. The new proposal would simply extend the underfunding that was already allowed in the 2012 bill for a greater number of years.
The Short- and Long-Term Impact of Infrastructure Investments on Employment and Economic Activity in the U.S. Economy In U.S. policymaking circles in recent years there have been recurrent calls to increase infrastructure investments. This is hardly a surprise, as increased infrastructure investments could go a long way to solving several pressing challenges that the American economy faces. In the near term, the most pressing economic challenge for the U.S. economy remains the depressed labor market. As of May 2014, the share of prime-age adults (age 25–54) currently employed is just 0.5 percentage points higher than it was at the official end of the Great Recession in June 2009. And it is more than 3.9 percentage points lower than during the labor market peak of the mid-2000s, and 5.4 percentage points lower than its 1999 peak. In the longer term, the most pressing economic challenges for the U.S. economy concern how to provide satisfactory living standards growth for the vast majority of people. Such growth requires two components: rapid overall productivity growth, and a stabilization (or even reversal) of the large rise in income inequality that occurred in the three decades before the Great Recession, a rise in inequality that kept overall productivity growth from translating into living standards growth for most Americans. This report examines the short- and long-term economic and employment impacts of infrastructure investment. It examines three possible scenarios for infrastructure investment and estimates their likely impact on overall economic activity, productivity, and the number and types of jobs, depending on how the investments are financed. The data show that by far the biggest near-term boost to gross domestic product and jobs comes from financing the new investment through new federal government debt rather than a progressive increase in taxation, a regressive increase in taxation, or cuts to government transfer programs.
New TPC Analysis: What Dave Camp’s Tax Reform Plan Would Really Mean -- In an extensive new analysis of House Ways & Means Committee Chair Dave Camp’s tax reform plan, my Tax Policy Center colleagues confirm his proposal would raise about the same amount of money over 10 years as current law and impose roughly the same tax burden across income groups as today’s revenue code.TPC also concluded that Camp’s proposals to eliminate many tax preferences for both individuals and businesses would simplify tax filing and eliminate many economic distortions produced by today’s law.However, TPC found that while the plan is revenue-neutral within the 10-year budget window used by Congress, its long-run effects on revenues are “highly uncertain.” The congressional Joint Committee on Taxation estimated that the plan would raise about $3 billion more than current law between 2014 and 2023. Soon after Camp released his plan last February, TPC analyzed many individual provisions but this is the first time it modeled the entire package. Camp’s plan would collapse individual income tax brackets from six to three—10 percent, 25 percent, and 35 percent–and repeal the Alternative Minimum Tax. It would boost the standard deduction but eliminate the personal exemption and repeal or limit most itemized deductions. It would substantially revise tax subsidies for low income households with children and make major changes in tax-preferred retirement savings.
GOP Should Stop Avoiding Payroll Tax Reform - A consensus is emerging that reforming the federal tax code must be among the very top priorities of a new agenda focused on restoring growth and opportunity in the United States. This is an achievement in itself. For years, economists debated the merits of broadening the tax base and lowering rates, but that debate is now largely over. Every credible analysis now indicates that a serious tax reform plan would vastly expand the U.S. economy and provide more jobs and higher incomes for U.S. workers. The Joint Tax Committee's analysis of the ambitious individual and corporate tax reform plan introduced by House Ways and Means Committee Chairman Dave Camp confirms the large gains to growth and opportunity that the right kind of reform plan would provide.The basic direction for reform is therefore clear: a tax system with lower rates, a broader base, fewer distortions in economic activity, and reduced barriers to business formation, job creation, and work. But, although there is broad agreement on the overall direction, there are still on-going debates over some important details--including how to help the middle class. Traditionalists have argued that the main benefit from tax reform for the middle class is more abundant job opportunities and higher incomes. There would be some reduction in tax liabilities for middle class households because of lower individual income tax rates. But the rate reduction would be, in relative terms, small because the current income tax system is already highly progressive.
Pretend Manufacturing In The Tax System - Public Citizen is complaining that a group of federal agencies propose to redefine manufacturing so that it would include employees and firms that are not actually bashing metal in the United States. The IRS beat the other agencies to this dubious result.The Economic Classification Policy Committee, a group of federal agencies, proposes to change the North American Industry Classification system, a classification system for data analysis by NAFTA governments, to amend the definition of manufacturing for many purposes, including labor statistics and economic indicators.The object of this exercise is to reclassify companies that have outsourced production from the United States as US manufacturers. Some federal classification systems, including standard industrial classification, already do treat offshored manufacturing as US manufacturing. Public Citizen argues that the proposal would artificially reduce the manufacturing trade deficit while artificially raising the number of jobs classified as manufacturing jobs. The tax law has been indulgently defining US-contracted offshore manufacturing in ways that benefit US companies for many years. The tax code contains a number of special benefits for manufacturing. Hardly anyone would qualify if manufacturing were strictly defined as metal bashing in the United States. So the IRS has been liberal in its interpretations, helping companies qualify for these breaks.
The Stiglitz Code: How Taxing Capital Can Counter Inequality - The American economy is at a crossroads. One of the questions that will determine which path we take is whether and how the government can use taxes to meet social needs. In recent years there have been countless calls to overhaul the tax code, but few have offered a robust set of objectives framed around providing and supporting public goods. That changes with today’s release of “Reforming Taxation to Promote Growth and Equity” by Roosevelt Institute Senior Fellow and Chief Economist Joseph Stiglitz. In this transformative new white paper, the Nobel-winning economist who foresaw the economic crisis and the rise of the Occupy movement sets out to reshape the debate around the role of taxation in our society. The ideas proposed in the paper are premised on core economic principles – taxing bads, encouraging goods – on which the vast majority of economists agree. The policy toolkit Stiglitz describes applies across the entire economic landscape. With growing wealth inequality and the political power of the top 1 percent in the spotlight thanks to the success of Thomas Piketty’s bestseller Capital in the 21st Century, Stiglitz calls for taxing capital as if it were regular income and boosting inheritance taxes. He overhauls corporate taxation for the age of globalization and international tax havens, bringing money back to where it was made. He also proposes taxes on negative externalities to ensure that those whose actions do harm, whether in the form of environmental pollution or a financial crisis, pay the price.
Swiss banks threaten freeze on US accounts over tax evasion - FT.com: Several Swiss banks have threatened to freeze American clients’ accounts unless they prove they are, or take steps to become, tax compliant, as the country’s lenders hurry to resolve a tax evasion dispute with the US. The moves – made by a number of banks, according to three people familiar with the situation who did not disclose the identity of the banks involved – come before a deadline at the end of July for banks in a programme set up by the US Department of Justice last year to show which American clients conform to US tax requirements. However, the validity of the banks’ approach has split legal experts. “Swiss banks are trying to compel customers to do something that a customer is not contractually obliged to do and by blocking accounts, they are committing an act of coercion that is problematic under Swiss penal, contractual and regulatory laws,” says one lawyer. Others disagree. “It’s legally defensible in situations where banks have been lied to by clients about their US status,” says another Swiss lawyer. “In other situations where the bank knew all along that the client was a US person, it’s more problematic.” The US has been clamping down hard on banks it believes helped US citizens dodge their fiscal responsibilities. In 2009, UBS paid a $780m fine after admitting it helped thousands of clients evade taxes. And in May, US regulators forced Credit Suisse to pay a $2.6bn fine after the bank pleaded guilty to conspiring to help clients evade taxes. About a dozen other banks, including Julius Baer and Zürcher Kantonalbank, have long been under investigation. The DoJ programme was designed to allow the rest of the Swiss banking sector, which consists of some 300 banks, to atone for any past sins by handing over information about their activities with US clients and, in cases where clients had undeclared accounts, by paying stiff fines.
Corporate Tax Behavior So Bad Even Fortune Magazine Can’t Stomach It: Fortune magazine is out with its list of of “Top American corporate tax avoiders,” members of the S&P 500 that “sure seem American—except when it comes to paying taxes.” These are companies that even a top cheerleader for the corporate class can’t bring itself to defend. What’s more, the list is accompanied by a blistering article by columnist Allan Sloan that makes the progressive case against corporate tax evasion as forcefully as anything Sens. Bernie Sanders or Elizabeth Warren might say on the Senate floor. There is “a new kind of American corporate exceptionalism,” he writes: “companies that have decided to desert our country to avoid paying taxes but expect to keep receiving the full array of benefits that being American confers, and that everyone else is paying for.” Fortune includes on the list Eaton PLC, which produces a range of mechanical and electrical components, which has its U.S. headquarters in Cleveland but its “tax residence” in Ireland. Its CEO, Alexander Cutler, Fortune helpfully notes, “also happens to be a member of the Campaign to Fix the Debt, a nonpartisan organization that advocates cutting government spending and increasing tax revenue. He wants to close tax loopholes—but he sure isn’t proposing to return his corporation to full U.S. taxpaying status.”
Pitchforks, Brainwashing And The Mathematics Of Persuasive Deceit -- We might think that Washington is as pitchfork-worthy today as France was in 1787, or Tsarist Russia in 1917; however, we are still likely a few leagues away from the igniting point that sparks a true revolution, where reality sets in and replaces the mirage created by economic-political brainwashing. .. Just in time to celebrate Independence Day, our illusionist government came out with “great ‘job numbers’” to keep the fireworks flying high, exploding in spectacular multi-colored brightness, lifting our spirits of eternal hope for a “recuperated” economy following course to a Dow Industrials that would surpass the 17,000 mark on the day 288,000 jobs were said to be added by employers. But all of this hoopla is an exercise in farce-economics, stats in Affluence Economics that have little to do with the economic condition of the have-nots, where unemployment rates, jobs created and rate of inflation need to be extracted from other data applicable to them, stats that reflect Have-nots Economics, not Washington’s generic bullshit.
The United States’ global leadership has eroded - Larry Summers - At a time when authoritarian mercantilism has emerged as the principal alternative to democratic capitalism, Congress is flirting with eliminating the Export-Import Bank, which, at no cost to the government, enables U.S. exporters to compete on a more level playing field with those of competitor nations, all of whom have similar vehicles. Only by maintaining a capacity to counter foreign subsidies can we hope to maintain a level global trading system and to avoid ceding ground to mercantilists. Eliminating the Export-Import Bank without extracting concessions from foreign governments would be the economic equivalent of unilateral disarmament.No one with any sophistication supposes that the world has seen the last major financial crisis or that we can prosper in a world in crisis. Yet the United States, having pushed successfully for major increases in International Monetary Fund resources and for important reforms in its governance, now is the lone nation blocking these measures from going into effect as Congress is unwilling to pass the relevant authorizing legislation. The IMF enables us to do in the economic area what we are unable to do in the security area: place most of the burden for supporting a functioning global system on all global stakeholders.
Congressional Panel Accused Of Leaking Insider Information, Refuses To Comply With Probe - The biggest congressional leakage scandal in the past year is the most recent one to cross the rabit hole of all-out absurdity: According to Reuters, the Ways and Means panel said on Friday it should not have to comply with a federal regulator's demand for documents sought for an insider-trading probe involving the staff director of a subcommittee and a lobbyist. The House Ways and Means Committee argued in a court filing that U.S. District Judge Paul Gardephe in New York should deny the Securities and Exchange Commission's attempt to subpoena documents from the committee and its healthcare subcommittee staff director Brian Sutter.
A Real Fix for Credit Ratings | Brookings Institution - The failure of credit ratings agencies to do their job – warn investors of the true risks entailed by the subprime mortgage securities they rated – was at the heart of the financial crisis. Policy makers since have wrestled with how to “fix” the ratings process going forward. Although the Securities and Exchange Commission has required the agencies to disclose more of their methodology, the ratings process is still less than transparent. The issuer-pay rating agency business model has been criticized as a central cause and new agencies designated by the SEC after 2008 moved away from this model, though they have since moved back. Various additional ideas to fix the system have been put forward but none has been adopted: randomizing the choice of ratings agency, or replacing private ratings with those of a public agency, such as the Securities and Exchange Commission. Faulting the issuer-pay model for the Crisis, which has been in continuous use for more than 40 years cannot explain the sudden explosion and subsequent collapse of the securitization market, which occurred over a much shorter period. We offer a different approach here: by showing how the absence of a single, numerical, public structured credit scale to serve as a yardstick of structured credit quality in the U.S. debt capital markets provides a more plausible explanation for the problems in structured finance in particular. Transparent, numerical benchmarks of credit risk relating to structured credits should not only fix structured finance going forward, and ideally help resuscitate the market but in a more sensible fashion. In addition, we will argue that such benchmarks also are a necessary component to a prudent system of capital regulation and for accurately informing investors of true credit risk, just as speed limits are a necessary component of vehicular traffic regulation.
Corporate Fraud is Up Dramatically: Has anyone told John Cochrane? -- William K. Black - John Cochrane, the U. Chicago apologist-in-chief for elite corporate criminals, might want to read what the industry says about fraud. Cochrane claims that the reason we have a modest economic recovery has nothing to do with inadequate demand, but is instead caused by government civil suits (not even prosecutions) against the financial industry’s massive frauds.Cochrane apparently knows that corporate fraud does not exist, which is why he describes the government’s civil fraud suits as a “witch hunt.” As I’ve described several times, Cochrane refuses to read the relevant criminology literature, but perhaps he’s willing to listen to the industry. The quarterly examination of fraud reporting activity for the fourth quarter of 2013 from almost 15 million employees worldwide by governance, risk and compliance services firm The Network Inc. and BDO Consulting reached a record-high of 25.83%. The survey of more than 1,400 organizations measures fraud reporting in comparison to all compliance reporting activity. ‘Fraud continues to be a huge risk in the workplace, and while it is concerning to see fraud growing as a percentage of all compliance issues, it’s reassuring that these incidents are being caught and reported,’ The underlying Network report adds these facts:“As evidenced by The Network survey, there continues to be an increase in reported fraud incidents, which is consistent with the increasing volume of notable transgressions we are seeing in our investigative practice. Common incidents include FCPA violations, Ponzi schemes, as well as financial reporting, procurement and healthcare fraud.” But there are two kickers that need discussion....
American CEOs: In a Class All by Themselves: Ask members of any American corporate board of directors why they pay their CEO so much and you’ll get some variation on this market-inevitability theme. To compete effectively in the world economy, Corporate America’s argument goes, we need world-class executive talent. And that top-notch talent costs. We’re just paying the going market rate. That argument, on its face, certainly seems credible enough, except for one inconvenient fact: Corporations elsewhere in the developed world pay their top execs far less than what U.S. corporations pay, and these corporations seem to be competing — and thriving — quite nicely in the global marketplace. The gap in corporate executive pay between U.S. firms and their foreign rivals has been the dirty little semi-secret of corporate compensation for some time now, ever since U.S. CEO pay first started soaring in the 1980s. Analysts have periodically documented that gap, nation by nation. But their data haven’t percolated into America’s public consciousness. One reason: All the annual CEO pay surveys that appear in America’s top media outlets seldom drop in any international perspective.In 2013, the Journal list shows, 186 chief execs in the United States walked off with $10 million or more in compensation, 32 of them with over $20 million. Some 41 major Japanese corporations, this new analysis notes, have so far reported their executive pay totals for last year. Only one exec from these firms pulled in over $10 million for the year, Nissan’s Carlos Ghosn, with $10.7 million.
Who Owns the U.S. Stock Market? - Serious observers of Wall Street are increasingly asking this question: could a group of trading venues with giant pools of capital, operating in the dark, using high-speed algorithms and artificial intelligence that has a massive historical database and gets smarter with each micro-second trade — effectively own the stock market. Today, we take a look at the massive trading control exercised by just five Wall Street firms.JPMorgan Chase, Bank of America and Citigroup jointly control trillions of dollars in commercial bank deposits with thousands of branch bank buildings stretching across the United States scooping up the life savings of everyday Joes who have no clue these are also the Masters of the Universe on Wall Street. Goldman Sachs and Morgan Stanley also own FDIC insured banks. Goldman Sachs Bank USA, as of March 31, 2014, has $104.7 billion in assets; Morgan Stanley Bank, N.A., as of the same date, has $108.8 billion in assets. These institutions have access to the Fed’s discount window, super cheap access to capital from FDIC insured deposits and a massive subsidy of their institutions under the too-big-to-fail doctrine. And, they also own outright or jointly a large swath of anything and everything that passes as a trading venue on Wall Street today.
Lifting the Veil on the U.S. Bilateral Repo Market -- -- The repurchase agreement (repo), a contract that closely resembles a collateralized loan, is widely used by financial institutions to lend to each other. The repo market is divided into trades that settle on the books of the two large clearing banks (that is, tri-party repo) and trades that do not (that is, bilateral repo). While there are public data about the tri-party repo segment, there is little to no information on the bilateral repo segment. In this post, we update a methodology we developed earlier to estimate the size and composition of collateral posted for bilateral repos, and find that U.S. Treasury securities are the dominant form of collateral for bilateral repos. This new finding implies that the collateral posted for bilateral repos is of higher quality than the collateral posted for tri-party repos.
New Federal Reserve No. 2 Signals Support for Bank Oversight Agenda - - Federal Reserve Vice Chairman Stanley Fischer on Thursday signaled support for the central bank’s post-crisis regulatory agenda, in his first speech since taking the Fed’s No. 2 job. Mr. Fischer praised the Fed’s stress-testing program for banks and new requirements that big banks hold higher levels of loss-absorbing capital, throwing in his lot with other Fed officials in backing two pillars of the Fed’s response to the financial crisis. He said it “may be appropriate” for the Fed to force the biggest U.S. banks to hold an extra capital buffer even beyond levels agreed to by international regulators, a move Fed Chairwoman Janet Yellen and others have suggested they’ll support. His remarks, prepared for an economics conference, focused on financial sector reform rather than monetary policy. “The United States is making significant progress in strengthening the financial system and reducing the probability of future financial crises,” Mr. Fischer, an economist and former Israeli central banker who took office in May, said in the prepared speech. He added that regulators have made “a great deal of progress” in reducing the potential for a repeat of government bailouts of large financial firms. Mr. Fischer defended the so-called Volcker rule adopted by U.S. regulators in December, dismissing an argument against the rule’s curb on bank trading. He also appeared skeptical of policies that would force the largest banks to break up, a view consistent with other senior U.S. officials who favor stricter oversight rather than directly forcing the biggest firms to shrink. “Actively breaking up the largest banks would be a very complex task, with uncertain payoff,” Mr. Fischer said.
Bankers warn over rising US business lending - FT.com: US lending to businesses is reaching record levels but banks are privately warning that the activity should not be seen as evidence of an economic recovery. Much of the corporate lending is going to fund payouts to shareholders, finance acquisitions and fuel the domestic energy boom, bankers say, rather than to support companies’ organic growth. “Loan growth doesn’t seem to be driven by the underpinning of an economic recovery in terms of new warehouses and [capital expenditure],” said one senior corporate banking executive at a large US bank. “You don’t see the foundation, the real strong demand.” Total outstanding commercial and industrial (C & I) lending, which runs the gamut of loans to sectors from energy to healthcare and excludes consumer or real estate loans, rose to a record $1.7tn in May from a post-crisis trough of $1.2tn nearly four years ago, according to data from the Federal Reserve Bank of St Louis. For the top 25 US commercial banks by assets, C & I lending grew by 10.5 per cent in the quarter to June 25 from the previous quarter, according to annualised weekly data from the Federal Reserve. This type of lending is an important source of business for the largest US banks, representing about a fifth of all loans made by the likes of Bank of America, JPMorgan Chase and Wells Fargo, according to Citigroup research.
Survey of Bankers Unintentionally Documents their Depravity - William K. Black - Makovsky is a PR group that specializes in representing banks. Because of that dual specialization they should be the most skilled shills for fraudulent bankers that money can buy. This fact makes their annual “reputation” survey delectable. Each year, the survey unintentionally documents how depraved senior bankers are as a group. They come to praise Caesar, but end up burying him in a garbage dump.Here are key findings of their 2014 survey: “The study showed that financial services firms continue to be pummeled by negative perception and regulatory overhaul and action, with the biggest drags on company reputation being negative public perception (64%) of the financial services industry and regulatory actions (55%) including investigations, lawsuits and fines. Financial marketing and communications executives report that new regulations put in place after the financial crisis have wreaked havoc on corporate image, operations and performance. ‘The 2014 study findings question how far financial services brands have advanced since the financial crisis,’ ‘The industry is walking on a tightrope with the combination of negative perception, regulator actions and greater risk sapping reputation and financial performance.’ More than three-quarters are worried (with 55% “Very Worried”) concerning executive compensation, an 18% increase over 2013 results.”
Punish bankers not banks for crimes - (Yves Smith at CNN) -- French officials exploded in outrage after BNP Paribas agreed to plea guilty to criminal charges, pay nearly $9 billion in fines, and have access to dollar clearing suspended for a year for its persistent violations of US economic sanctions against Iran, Cuba and Sudan. The international bank fell under US jurisdiction by virtue of facilitating transactions in dollars which passed through the US. Most financial commentators had little sympathy with the French position, since the giant bank's conduct was egregious. It included ongoing records-doctoring to hide the true identity of customers and stymieing the US investigation. But putting aside the international row, what does the BNP Paribas settlement say about addressing misconduct at too big to fail banks?Perversely, while banks are wards of the state and get more support and subsidies than any other type of business (for instance, ZIRP and quantitative easing are massive transfers from savers to financial players), the authorities have lacked the will to discipline them effectively. Even though the BNP Paribas fine exceeded a year of earnings, the bank's stock rose 3.6% when the deal was announced, saying that investors though BNP Paribas had done well.The conundrum is indicting a bank at the parent level is widely perceived to be a potential death blow, since many counterparties would have to stop doing business with it immediately.Removing the US banking licenses of a serial fraudster, another possible remedy, would similarly put a US firm out of business and would inflict severe, permanent damage on a big foreign bank. Hence the tendency of officials to rely on big, or at least big-sounding, fines.But it is bankers, not banks, that commit crimes. Here, the BNP Paribas deal falls short. True, 13 officers were forced to resign, including one of its chief operating officers. But he was on the verge of retirement, and more important, no one was charged criminally or fined.
Unofficial Problem Bank list declines to 465 Institutions - This is an unofficial list of Problem Banks compiled only from public sources. Here is the unofficial problem bank list for July 3, 2014. Generally a quiet week for the Unofficial Problem Bank List with three removals but none from failure as no one expected the FDIC to close on bank on the July 4th weekend. After the removals, the list count drops to 465 institutions with assets of $147.6 billion. The list is down significantly from a year ago when it included 743 institutions with assets of $271.5 billion. Next week is expected to see few changes as the OCC likely will not be providing an update on it enforcement actions until July 18th. Enjoy the holiday weekend. Note: The first unofficial problem bank list was published in August 2009 with 389 institutions. The list peaked at 1,002 institutions on June 10, 2011, and is now down to 465.
Citi nears resolution on massive mortgage fraud probe Citi [C] is said to be nearing a settlement with the Justice department in regard to a mortgage probe investigating the allegation of fraud and document mishandling according to the Wall Street Journal.The article points out this is the latest in a string of such investigations:A settlement with Citigroup next week would come on the heels of an $8.9 billion deal between federal and state officials and BNP Paribas SA that required the French bank to plead guilty to criminal charges related to the violation of U.S. sanctions.The Justice Department also has been in talks with Bank of America Corp. to resolve civil probes over its mortgage business. The Citigroup mortgage investigation is among a handful of cases relating to bank conduct ahead of the 2008 financial crisis still pending before the Justice Department. According to the report, the issue at hand is the total amount. Citigroup offered about $4 billion, while the government was seeking close to $10 billion. That is a figure the bank found "objectionable" according to people familiar with the matter, according to the article.
Fed Defends Its Approach to Punishing Banks for Improper Foreclosures - The Federal Reserve defended its approach to punishing banks for misconduct in home foreclosures and said in a report issued Monday that about 83% of borrowers have cashed checks reimbursing them for financial injury.The Fed said the settlement program, in which 13 banks agreed to compensate homeowners whose properties may have been improperly sent into foreclosure, had transferred about $3.1 billion to borrowers as of April. That agreement "provided for payments to borrowers faster" and resulted in banks paying more than they would have under an independent review that was scrapped at the end of 2012, the Fed said in the report. Lawmakers and public advocacy groups have questioned regulators' decision to halt an independent review in favor of a settlement, saying it may have allowed some banks with high error rates in their foreclosure reviews to escape without providing homeowners proper compensation. The Wall Street Journal reported last year that some banks were on track to find a high rate of mistakes when the settlement was announced. Bank regulators ordered an independent review of banks' foreclosure files in April 2011 to determine how many borrowers should be compensated for foreclosure mistakes but halted the review last year amid concerns it was taking too long and not uncovering enough mistakes. Instead, banks agreed to pay $9.3 billion, including $5.7 billion in noncash assistance and $3.6 billion in cash payments.
MERS Loses Major Case in Pennsylvania - Yves Smith - The mortgage beat has been quiet of late, but I must confess to being remiss in writing up two recent losses suffered by MERS. .Today, we’ll deal with the higher-profile one, that of a filing by the Montgomery County recorder in Pennsylvania, Nancy Becker, for herself and on behalf of all county recorders, against MERS, in Federal court. The basis of the suit was that MERS had violated a state law that required that conveyances of real property be recorded in county recorder of deeds’ offices. Becker argues, in effect, that the mortgage (the lien against the property) and the note (the borrower IOU) were inseparable, and that trying to treat the note as separate and exempt from the recording requirement was a “willful and negligent” violation of statute. She sought, among other things, that MERS be required to record mortgage transfers and that it be found to have engaged in unjust enrichment. MERS has won suits filed by recorders in other states, but the flip side is that MERS suffered a major loss in Oregon, which has a state recording statute. Even though the court accepted the premise that notes could be transferred readily, which was one of the legs of the argument MERS advanced as to why it did not need to record mortgages, it rejected the notion that it meant mortgages weren’t subject to the state recording law. The judge cited decisions from 1848 and 1850 and pointed out:These holdings remain undisturbed despite the passage of more than 150 years and thus the underlying purpose behind the Pennsylvania recording acts remains clear – to provide notice to the public of the identities of those who hold an interest in real estate as well as notice of the true nature of the transaction on record…And in 1852, it was determined that the assignment of mortgages also fell within the recording acts…in 1863, the Pennsylvania legislature first decreed that such recording be mandatory.
Maine Supreme Court Hands Major Defeat to MERS Mortgage Registry -- Yves Smith Yesterday, we wrote about a major loss by the electronic mortgage registry, MERS, in a major Federal court case in Pennsylvania. MERS suffered an additional blow via an important adverse decision in the Maine Supreme Court, against Tom Cox, the attorney who first made robosigning a national issue. MERS was created to replace the system of local recording of mortgages. While such an idea could have had merit (for instance, Australia has a national mortgage registry that by all accounts works well), MERS was designed for the convenience of banks and mortgage securitizers, with no review of how it would work with well-established real estate law in 50 states. In the case of MERS, the database protocols fall shockingly short of well-established norms for information integrity and security. It is important to remember that with over 60 million mortgages in MERS, the records that show ownership and liens against many Americans’ biggest asset are in serious doubt. Yet astonishingly, MERS has been able to maintain a facade of legitimacy, mainly by settling cases that looked to pose a threat to its operations. However, a few important challenges have crept through. One was a case filed on behalf of all Pennsylvania county recorders. If it survives appeal, it will deal a fatal blow to the use of MERS in that state, will almost certainly result in large damages, and will have serious ramifications in other so-called “title theory” states.The Maine victory by Thomas Cox is more decisive, in that MERS has no where to go in Maine after losing in the Supreme Court. Its full ramifications are not fully clear, however. We’ve embedded the ruling below.
A Potential Foreclosure Crisis Looms Over America -- Former Assistant Treasury Secretary Paul Craig Roberts wrote on June 25th that real US GDP growth for the first quarter of 2014 was a negative 2.9%, off by 5.5% from the positive 2.6% predicted by economists. If the second quarter also shows a decline, the US will officially be in recession. That means not only fiscal policy (government deficit spending) but monetary policy (unprecedented quantitative easing) will have failed. The Federal Reserve is out of bullets. Or is it? Perhaps it is just aiming at the wrong target. The Fed’s massive quantitative easing program was ostensibly designed to lower mortgage interest rates, stimulating the economy. And rates have indeed been lowered – for banks. But the form of QE the Fed has engaged in – creating money on a computer screen and trading it for assets on bank balance sheets – has not delivered money where it needs to go: into the pockets of consumers, who create the demand that drives productivity. Some ways the Fed could get money into consumer pockets with QE, discussed in earlier articles, include very-low-interest loans for students and very-low-interest loans to state and local governments. Both options would stimulate demand. But the biggest brake on the economy remains the languishing housing market. The Fed has been buying up new issues of mortgage-backed securities so fast that it now owns 12% of the mortgage market; yet housing continues to sputter, largely because of the huge inventory of underwater mortgages.
Foreclosure Inventories Set New High in Florida, But No New Wave Seen -- The volume of foreclosed properties held by Fannie Mae and Freddie Mac in the state of Florida reached a new high at the end of March, surpassing the previous peak reached at the end of 2010. So is this a sign that the foreclosure crisis is getting worse? Not really. To understand the new record, which was pointed out by housing economist Tom Lawler in a recent research note, it helps to have a handle on the ebbs and flows of the foreclosure process, which is governed by state law. Florida requires banks and mortgage companies to take back property through court. The foreclosure crisis upended few states as badly as it did Florida. Making matters rose, banks have had a terrible record moving those properties through the state’s court system. In 2010, evidence surfaced to show that banks and their attorneys were routinely trying to pass off forged assignments and other substandard loan documentation to rapidly process growing backlogs of foreclosures. The slowdowns that resulted from this so-called “robo-signing” scandal were particularly acute in states such as Florida, where the courts oversee the foreclosure process. Foreclosures dropped sharply throughout 2011 as banks withdrew cases to correct those foreclosure filings. Foreclosed property holdings at Fannie and Freddie dropped from around 28,000 as of October 2010 to less than 12,000 one year later. Inventories have grown steadily over the last three years, to surpass 30,000 at the end of March. Many of the properties going back to Fannie and Freddie today are likely mortgages that have been delinquent for a long time, as opposed to newly delinquent borrowers, which would be an arguably bigger concern for the housing market. Florida loans that completed the foreclosure process in the first quarter at Fannie hadn’t made any payments in more than 1,300 days. The level of mortgages that are 90 days or more past due or that are in the foreclosure process in Florida is still high, at around 10.7% of all mortgages at the end of last year,
Lawler: Preliminary Table of Distressed Sales and Cash buyers for Selected Cities in June - Economist Tom Lawler sent me the preliminary table below of short sales, foreclosures and cash buyers for several selected cities in June. Tom Lawler has been sending me this table every month for several years. I think it is very useful for looking at the trend for distressed sales and cash buyers in these areas. On distressed: Total "distressed" share is down in all of these markets, mostly because of a sharp decline in short sales. Short sales are down in all of these areas. Foreclosures are down in most of these areas too, although foreclosures are up a little in Nevada and Mid-Atlantic. The All Cash Share (last two columns) is mostly declining year-over-year. As investors pull back, the share of all cash buyers will probably continue to decline.
U.S. Officials Try To Rebuild Momentum In Stalling Mortgage Refinance and Modification Programs - Federal Housing Finance Agency director Mel Watt on Tuesday kicked off a new push to get eligible homeowners into the Home Affordable Refinance Program, or HARP, beginning with a town hall meeting in Chicago. The FHFA estimates there are more than 650,000 HARP-eligible borrowers nationwide who would benefit from the program. Mr. Watt’s campaign begins a couple weeks after Treasury Secretary Jack Lew announced that the Making Home Affordable program, which includes the Home Affordable Modification Program, or HAMP, would be extended for another year through 2016. HARP lets borrowers refinance their mortgages, even if they owe more than their home is worth. HAMP seeks to reduce monthly payments by extending loan terms, lowering interest rates and reducing principal. Given that both programs have been kicking around for more than five years and that the home-price recovery is well-advanced, it’s worth asking what the programs can still accomplish.
Mortgage delinquencies: Are we back to normal yet? -- In the housing shrivel inevitably following the great 21st century housing bubble, mortgage loans delinquent over 90 days shot up to their dizzying peak in the first quarter of 2010. More than four years have gone by since then; the housing and mortgage markets have recovered. But delinquencies are not back to normal yet. For all mortgage loans, the rate of 90+ day delinquencies has fallen by more than half, from 5.02% at the peak to 2.41% in the first quarter of 2014. That is definitely progress, but has taken us back only as far as the level of 2008. The striking path of 90-day delinquencies for all mortgages from 2002 to 2014– first flat for several years, then rocketing up, then partway down– is shown in Graph 1. The current rate is still 2.7 times as high as the average delinquency rate in the good old days of 2002, which was 0.89%. The next two graphs dis-aggregate the history. Graph 2 shows prime vs. sub-prime mortgage loan 90-day delinquencies. From their acrophobia-inducing peak of 15%, the sub-prime 90+ day delinquency rate has fallen by 40%, to just under 9%, bringing it back to the level of late 2008. It is still more than 3.3 times the rate of 2002. Prime loan 90-day delinquencies are down to only 1.3% — but that is 4.5 times where they were in the good old days. Graph 3 is a highly interesting comparison of two government mortgage programs: FHA (Federal Housing Administration) vs. VA (Veterans Administration) loans. The startlingly better credit performance of VA compared to FHA is obvious. This instructive difference has been insightfully explored by my AEI colleague, Ed Pinto. In both cases, once again, 90+ day delinquencies have fallen significantly from their peaks; for the FHA, back to 2008 and 1.6 times the 2002 level; the VA is the one category of loans with a 90+ day delinquency rate that is close to of pre-crisis days. So: are we there yet? Nope. The deleterious effects of a giant housing bubble linger a very long time.
The Costs of Obama’s Housing Mistakes Keep Piling Up -- Dave Dayen -- We all remember the fable of The Boy Who Cried Wolf. The moral of the story: Lie one too many times and nobody will believe you, even when you’re telling the truth. The Federal Housing Finance Agency (FHFA), which oversees mortgage giants Fannie Mae and Freddie Mac, wants to help around 676,000 homeowners it has identified as eligible for refinancing under the government’s Home Affordable Refinancing Program (HARP). These homeowners currently hold mortgages with interest rates that are at least 1.5 percent above the current market rate, and would save roughly $200 a month if they used HARP to refinance. They also have little or no equity in their homes, which means they could not get a refinancing deal from a mortgage lender without HARP. HARP refinancing reduces the potential for future defaults among borrowers with low or no equity. The approximate annual benefit if everyone eligible refinanced would be about $1.6 billion, a small but significant boost. Any money homeowners save from smaller mortgage payments could be spent on other needs, providing a modest stimulus to the economy.But these remaining homeowners appear to have no interest in the program, and Watt explained why in Chicago. “We have written to them. We have called them, and they're saying this is too good to be true,” he said.Why would homeowners exhibit so much skepticism in a government program that they feel inclined to turn down thousands of dollars in free money? You can track it back to all the promises made over the past five years to help homeowners, and the unfortunately sorry results.
How New York Real Estate Became a Dumping Ground for the World’s Dirty Money Nation - The journey of Wu Shu-jen’s ill-gotten cash illustrates one of New York’s dirty secrets: high-end real estate in the city is an alluring destination for corrupt politicians, tax dodgers and money launderers around the globe. Since 2008, roughly 30 percent of condo sales in pricey Manhattan developments have been to buyers who listed an international address—most from China, Russia and Latin America—or bought in the name of a corporate entity, a maneuver often employed by foreign purchasers. Because many buyers go to great lengths to hide their interests in New York properties, it’s impossible to put a number on the proportion laundering ill-gotten gains. But according to money-laundering experts as well as court documents and secret offshore records reviewed by the International Consortium of Investigative Journalists, New York real estate has become a magnet for dirty money. Public officials and real-estate operatives in New York have mostly applauded the city’s influx of mega-rich homesteaders from overseas, with former Mayor Michael Bloomberg leading the chorus during his time in office. “Wouldn’t it be great if we could get all the Russian billionaires to move here?” he told New York magazine in September.
Fannie-Freddie Propose Liquidity Rules for Mortgage Insurers - Radian Group and MGIC Investment Corp. are among mortgage insurers that would need to fill a financial gap under new financial-strength rules proposed by the Federal Housing Finance Agency. Radian said it would need about $850 million to meet the standard now and expects to be able to comply within a two-year transition period allowed under the rules. Milwaukee-based MGIC didn’t provide a figure and said it faced a “material shortfall.” Genworth Financial Inc. said yesterday that it may need as much as $550 million at its mortgage insurer by June 30, 2015, to meet the standards. U.S. regulators are seeking to stiffen standards for mortgage insurers that back loans sold to Fannie Mae and Freddie Mac to prevent a repeat of the losses the government-backed firms faced in the 2008 financial crisis. Radian and MGIC said the rules are too stringent and could make it more difficult for borrowers to afford homes. “These guidelines create capital requirements that have the potential of shrinking access to the very segments of borrowers that we believe the government wants to expand homeownership for,” Radian Chief Executive Officer S.A. Ibrahim said in an interview. “They are going to be worst hit from this, one way or the other.”
MBA: Mortgage Applications Increase in Latest MBA Weekly Survey - From the MBA: Mortgage Applications Increase in Latest MBA Weekly Survey Mortgage applications increased 1.9 percent from one week earlier, according to data from the Mortgage Bankers Association’s (MBA) Weekly Mortgage Applications Survey for the week ending July 4, 2014. This week’s result included an adjustment for the July 4th holiday. ...The Refinance Index increased 0.4 percent from the previous week. The seasonally adjusted Purchase Index increased 4 percent from one week earlier. ......The average contract interest rate for 30-year fixed-rate mortgages with conforming loan balances ($417,000 or less) increased to 4.32 percent from 4.28 percent, with points increasing to 0.16 from 0.14 (including the origination fee) for 80 percent loan-to-value ratio (LTV) loans.The first graph shows the refinance index. The refinance index is down 75% from the levels in May 2013. As expected, refinance activity is very low this year. The second graph shows the MBA mortgage purchase index. According to the MBA, the unadjusted purchase index is down about 10% from a year ago. Note: Mortgage rates were around 4.75% this time last year, and are down about 50 bps year-over-year.
Weekly Update: Housing Tracker Existing Home Inventory up 13.6% YoY on July 7th --Here is another weekly update on housing inventory ... There is a clear seasonal pattern for inventory, with the low point for inventory in late December or early January, and then usually peaking in mid-to-late summer. The Realtor (NAR) data is monthly and released with a lag (the most recent data released was for May). However Ben at Housing Tracker (Department of Numbers) has provided me some weekly inventory data for the last several years. This graph shows the Housing Tracker reported weekly inventory for the 54 metro areas for 2010, 2011, 2012, 2013 and 2014. In 2011 and 2012, inventory only increased slightly early in the year and then declined significantly through the end of each year. In 2013 (Blue), inventory increased for most of the year before declining seasonally during the holidays. Inventory in 2013 finished up 2.7% YoY compared to 2012. Inventory in 2014 (Red) is now 13.6% above the same week in 2013. (Note: There are differences in how the data is collected between Housing Tracker and the NAR). Inventory is slightly below the same week in 2012 (it was above last week). This increase in inventory should slow price increases, and might lead to price declines in some areas.
China Fuels Surge in Foreign Purchases of U.S. Housing - Foreign purchases of U.S. real estate jumped by 35% last year, and the Chinese led the way, according to a survey released Tuesday. Chinese buyers have become the largest source of foreign cash in the U.S. residential real estate market, accounting for nearly one in four dollars spent by foreigners on American housing last year, the National Association of Realtors said in its annual survey of international property sales. China accounted for $22 billion in international sales for the 12 month period ending March 2014, or 24% of all foreign sales, up from $12.8 billion, or 19%, during the year-earlier period. Total international property sales rebounded last year to $92.2 billion, according to the NAR’s estimates, up from $68.2 billion in 2013 and $82.5 billion in 2012. The total represented around 7% of the market for all U.S. sales of previously owned homes during the same period. In recent years, American real-estate markets have been have been viewed alternately as a safe haven and a bargain amid concerns over geopolitical instability or unsustainable asset values abroad. U.S. real-estate also continues to be popular thanks to the dollar’s weakness against some currencies, though the currency advantage has dimmed somewhat for Canadian buyers that had been particularly aggressive property buyers in the U.S. in 2011 and 2012. Some agents say that American higher education is also a top draw for some trophy-property buyers.
$22 Billion in California Homes Sold to Chinese All-Cash Buyers; "Beginning of Tidal Wave" says NAR Chief Economist -Real estate is well back in bubble territory in some places, notably California. It won't end any differently this time for the buyers, but at least banks will not be on the hook for the loans.All cash buyers from China are bidding up the price of mansions, defined as anything with two stories. Bloomberg reports Chinese Cash-Bearing Buyers Drive U.S. Foreign Sales Jump - Buyers from Greater China, including people from Hong Kong and Taiwan, spent $22 billion on U.S. homes in the year through March, up 72 percent from the same period in 2013 and more than any other nationality, the National Association of Realtors said yesterday in its annual report on foreign home purchases. That’s 24 cents of every dollar spent by international homebuyers, according to the survey of 3,547 real estate agents. Chinese buyers paid a median of $523,148 per transaction, compared with a U.S. median price of $199,575 for existing-home sales. While Canadians bought more houses than the Chinese, they spent less -- a median of $212,500 per residence, for a total of $13.8 billion. Chinese bought 32 percent of homes sold to foreign buyers in the state, double the share sold to Canadians, according to an April survey by the California Association of Realtors. About 70 percent of international buyers pay cash, the survey showed.
China's Colonization Of America's Luxury Real Estate Market In One Chart - As we first reported two years ago, one of the primary reasons, if not the main one (there is also the Fed to thank) why the US housing market, and specifically its ultra-luxury segment, has experienced a recovery in the past two years even as the other segments of US housing have languished, was due to foreign investors laundering offshore funds in the US real estate market facilitated by the NAR's exemption from anti-money laundering regulations. This topic finally made the mainstream media recently with the NY Mag's article on just this topic titled "Stash Pad", which we also covered extensively. Today, for the first time, we have definitive evidence of not only all of the above, but granular detail of just how "easy" Chinese money has been when it comes to bidding US real estate. As the WSJ reports, "foreign purchases of U.S. real estate jumped by 35% last year, and the Chinese led the way, according to a survey released Tuesday.Chinese buyers have become the largest source of foreign cash in the U.S. residential real estate market, accounting for nearly one in four dollars spent by foreigners on American housing last year, the National Association of Realtors said in its annual survey of international property sales. China accounted for $22 billion in international sales for the 12 month period ending March 2014, or 24% of all foreign sales, up from $12.8 billion, or 19%, during the year-earlier period.
Trulia: Asking House Prices up 8.1% year-over-year in June -- From Trulia chief economist Jed Kolko: Despite Home Price Slowdown, Wages Can’t Keep Up With Prices In June 2014, prices were up 8.1% year-over-year and 2.6% quarter-over-quarter, compared with 9.5% and 3.1%, respectively, in June 2013. ... But despite this national slowdown in price gains, price increases continue to be widespread, with 97 of 100 metros posting year-over-year price gains – the most since the recovery began. Furthermore, asking prices in June rose at their highest month-over-month rate (1.2%) in sixteen months. The price slowdown has been particularly sharp in the boom-and-bust markets of California and the Southwest, where the recession was severe, the recovery was dramatic, and the slowdown is now most pronounced. In Phoenix, Las Vegas, Sacramento, and Orange County, price gains have skidded to a stop or gone into reverse in the past quarter after posting gains of more than 20% year-over-year in June 2013. Rent increases outpaced wage increases in all of the 25 largest Rents rose more than 10% year-over-year in Miami, Oakland, San Francisco, San Diego, and Denver. Among these five markets with the largest rent increases, all but Denver are among the nation’s least affordable rental markets. Asking prices had been slowing down, although there was a slight increase in year-over-year prices in June ... in November 2013, year-over-year asking prices were up 12.2%, in December, the year-over-year increase slowed slightly to 11.9%. In January 11.4%, in February 10.4%, in March 10.0%, April 9.0%, May 8.0%, but now 8.1% in June.
Mortgage Bankers: ‘Unsustainable Housing Bubble Is Inflating’ -- Observations about a housing bubble being once again inflated in many areas in the US have transitioned from bloggers throwing around unpleasant party-pooper data to mortgage bankers. In a survey conducted by the Professional Risk Managers’ International Association for FICO – the same company after which the infamous and ubiquitous FICO score is named – found that industry insiders directly involved in mortgage lending are now on edge. They’re seeing from the close-up viewpoint what we have seen for over a year, and what the Fed still refuses to see – while it categorically declares that it cannot be seen by anyone in the first place. So 56% of the mortgage banker respondents fretted that “an unsustainable real estate bubble is inflating.” Andrew Jennings, chief analytics officer at FICO, which describes itself as a predictive analytics and decision management software company, explained the phenomenon this way:“The home loan environment has bifurcated. Six million homeowners in the U.S. are still underwater on their mortgages, with the average negative equity a whopping 33%. Yet with home prices soaring in many cities, total homeowner equity in the U.S. is at its highest level since late 2007. That doesn’t feel like a healthy, sustainable growth situation. No wonder many lenders in both Canada and the U.S. are concerned about the risk in residential mortgages.” For 58.8% of the mortgage bankers, consumers’ “high debt-to-income ratio” was their top concern when approving loans. Good American consumers have picked up their old habits again: the hole left behind by declining real incomes while consumption always has to rise is filled with debt. That has become the American corporate dream. And that’s what the Fed had planned for them.
Wild and Crazy Times at the Low End of the Housing Market - Dean Baker - Floyd Norris had an interesting piece on the impact of investor purchased homes on prices at the lower end of the housing market. His takeaway is that investor purchased homes have made housing less affordable for many low and moderate income households. While this is partly true, by focusing only on the last couple of years the piece misses much of the picture. While investor purchases have pushed prices to unusual levels in many markets, in some cases they essentially put a floor on the market, helping to stabilize prices at levels that are consistent with longer term trends. The chart below shows house prices in the Case-Shiller indices for the bottom third of the market for five cities. (This is the same series used for the charts in the article.) There are several features of this chart worth noting. First, it is possible to see a rise in house prices (most pronounced in Minneapolis) in the middle of 2009. This was the result of the first-time homebuyers tax credit. This policy currently ranks #1 as most boneheaded policy of the century. It encouraged millions of people to buy into a market that was still inflated by the housing bubble. As soon as the credit ended, prices began to plummet again, surprise, surprise. Many of these first-time homebuyers suddenly found themselves underwater. Of course the flip side is that many homeowners were able to dump their homes before they went underwater. And, many holders of mortgages were able to get them paid off either through a sale or refinancing. The new mortgages almost always sat with the government, either at Fannie Mae or Freddie Mac or were guaranteed by the Federal Housing Authority. In fairness, prices have mostly recovered, but those who were forced to sell in 2011 or 2012 would have taken large losses.
Watching for signs of US housing market activity -The US housing market remains sluggish, as wages, at least at the national level, have not kept up with the recent price appreciation (see post). The reason for these higher prices is that housing inventories remain tight, particularly in the more desirable areas. A great deal of this inventory has been picked up by "cash buyers" that include domestic and foreign investors (including professional investment firms). These investors accounted for over 40% of the homebuyers in the first half of 2014. The hope is that with this tight inventory levels we will see more residential construction, even if a great deal of it will go to meet rental housing demand. The recent recovery in lumber futures suggests that construction, which has stalled recently, may be improving again. Sep-14 futures (source: Barchart) Another indicator suggests that sellers are taking advantage of the tight inventory. The prepayment speeds on 30Y FNMA MBS securities with low coupon have picked up again. The 2.5% and 3% 30Y MBS contain mortgage pools of loans with interest that is significantly below current mortgage rates. Therefore prepayments in these pools mean that these homeowners are selling their homes (nobody would want to refinance into a higher rate mortgage). Sales are expected to pick up this time of the year, but some analysts have been a bit surprised at how quickly prepayment speeds recovered. Source: JPMorgan Both of these signs point to improving activity in the US housing market. It remains to be seen whether it is sustainable however or is simply a temporary response to lower mortgage rates.
Is wage stagnation keeping homebuyers away? -- Perhaps the reason buyers are staying away from the housing market is because they simply can’t afford it. At least, that’s what one report suggests. In Trulia’s Price Monitor for June, Trulia’s chief economist Jed Kolko compares the rise in asking prices with the rise (or lack thereof) of wages in the 100 largest metro areas. The results are a bit troubling for those who think they should be earning more money. According to Trulia’s data, in the ten markets where asking prices have risen the most year-over-year, wages have barely increased. In Riverside-San Bernardino, California, asking prices rose 16.9% from June 2013 to June 2014. Wages in that area only rose by 0.6% from 2012-2013, according to recently released full-year 2013 wage data from the Bureau of Labor Statistics’ Quarterly Census of Employment and Wages. In Atlanta, asking prices rose 15.7% while wages only rose 0.8%. In Bakersfield, California, asking prices rose 13.9% while wages actually dropped by 0.3%. “In fact, average wages per worker rose less than 1% in 2013 in all but one of the 10 metros with the largest price increases,” Kolko said. “Nationally, asking prices (year-over-year in June 2014) rose faster than wages per worker (year-over- year in 2013) in 95 of the 100 largest metros.”
House Prices to National Average Wage Index - One of the metrics we'd like to follow is a ratio of house prices to incomes. Unfortunately most income data is released with a significantly lag, and there is always a question on what income data to use (the average total income is skewed by the income of a few people). And for key measures of house prices - like Case-Shiller and CoreLogic - we have indexes, not actually prices.But we can construct a ratio of the house price indexes to some measure of income. For this graph I decided to look at house prices and the National Average Wage Index from Social Security. Click on graph for larger image. This graph shows the ratio of house price indexes divided by the National Average Wage Index (the Wage index is first divided by 1000). This uses the annual average CoreLogic index since 1976, and also the National Case-Shiller index since 1987. As of 2013, house prices were just above the historical ratio. Prices have increased further in 2014, but it appears house prices relative to incomes is still below the 1989 peak. Going forward, I think it would be a positive if wages outpaced, or at least kept pace with house prices increases for a few years. Notes: The national wage index for 2013 is estimated using the same increase as in 2012.
Home-Price Drop Held Back Start-Up Hiring After the Recession - The steep drop in house prices during the 2007-2009 recession likely held back hiring by start-up companies during the recovery, which could help explain why overall U.S. job growth has been so weak, according to two San Francisco Fed economists. “Our analysis suggests that between March 2010 and March 2011, lower employment growth at start-ups may have subtracted as much as 0.7 percentage point from total job growth, translating into roughly 760,000 fewer jobs,” . The link between home prices and start-up firms is “intuitive,” the economists wrote, since most businesses initially rely on personal or family assets. “Lower house prices reduce homeowners’ equity and wealth, which can restrict an important source of funding that entrepreneurs typically access to start new businesses,” they wrote. And start-ups, they wrote, are especially important to nascent economic recoveries because they generate faster employment growth than do mature firms. In the first year following the bottom of the 1981-1982 recession, employment at start-up companies – defined as firms less than five years old and fewer than 20 employees – grew 28.3%. The growth rate was 18.8% in the year following the 2007-2009 recession’s low point for jobs. “If start-ups had grown at the higher rate, and if employment at all other firms had continued to grow at its actual pace, total employment growth between March 2010 and March 2011 would have been 2.3%, compared with an actual rate of about 1.6%,” the economists wrote.
Growth in Credit-Card Balances Slows Sharply in May - The growth of Americans’ credit-card balances slowed sharply in May, a sign that many consumers remain cautious about the economy. The amount of outstanding revolving credit — mainly credit-card debt — rose at a seasonally adjusted annual rate of 2.5% to $872.2 billion in May, according to a Federal Reserve report released Tuesday. That increase is far below the 12.3% pace recorded the prior month (which was the fastest rate of growth since 2001) and instead in line with the tepid gains recorded over the past year. Overall consumer credit, including student and car loans but not home mortgages, climbed at an annual rate of 7.4% to $3.195 trillion in May. That gain was a slight deceleration from April. The data suggests April’s surge in credit-card balances could have been payback for an unusually cold winter rather than a new sign of consumer confidence. Other measures of consumer spending followed a similar trend. After declining to start the year, personal consumption expenditures rose at the fastest pace in more than two years in March, the Commerce Department said. Outlays then slowed sharply in April and May. The April accumulation of credit-card balances could be a reflection of March spending. When adjusted for inflation—the figure used to calculate economic growth—consumer spending held virtually flat in April and May after rising at just a 1% annual pace in the first quarter. That small increase to start the year, marking the slowest gain in spending since 2009, couldn’t offset declines elsewhere in the economy. That was a key factor behind the nation’s worst quarterly economic performance since the recovery began in mid-2009.
Consumer Credit Card Debt Tumbles, Non-Revolving Credit Soars Most In 15 Months - Remember that epic spending spree that took place in March when consumers cleaned out their savings account and which resulted in a surge in March retail spending in consumer outlays? Now we know that in addition to borrowing from their savings, consumers also "charged" it, because as we reported last month, the April consumer credit soared by an unprecedented $8.8 billion, the most since 2007, and a clear outlier in recent years. April, incidentally is precisely when the credit card statements for March purchases would come due so while impressive, the surge in revolving credit wasn't quite surprising. However, what is perhaps more notable now that the Fed just released the May consumer credit numbers, is that the month after the March spending spree, funding largely on credit, consumers hunkered down once more, and the May increase in revolving credit was a paltry $1.8 billion, much lower than the April surge, and the lowest since February. In other words, after the spending binge, came the credit card bills, and with them, the spending hangover.
Deadbeats No More: Americans Paying Bills on Time at a Historically High Rate - Fewer Americans are deadbeats. The share of credit-card bills being paid on time is near a two-decade high, according to new data released Thursday by the American Bankers Association. Delinquency rates on bank-issued credit cards fell to 2.44% in the first quarter from 2.6% at the end of 2013. The first-quarter figure is barely above the year-earlier reading of 2.41%, which was the lowest rate since 1990. Bank-card delinquency rates are running 36% below their 15-year average. An account is considered delinquent if the payment is 30 or more days late. The historically low delinquency rates are a double-edged sword for the economy. On one hand, it suggests most households have their finances well in order and aren’t facing the burdens of late fees and high interest rates associated with poor payment records. On the other, it shows consumers remain risk-averse and might be reluctant to significantly step up spending. “The financial crisis was a sobering event that made borrowers much more cautious about the level of debt they felt comfortable with,” . Smaller balances make it easier for borrowers to keep up with payments. Bank-card delinquency rates ran above 4% in 2006 and 2007, before the recession began. Rates peaked near 5% in 2008, before trending down. An uptick in the second half of last year coincided with stronger consumer spending, which then dissipated in the first quarter.
Consumer Spending Slides In All Important June, Gallup Finds - It appears the hopes and dreams of a resurgence in US GDP in Q2 will have to be extended-and-pretended another quarter. As Gallup notes, Americans' self-reports of daily spending fell back in June, averaging $91 for the month - down notably from a six-year high of $98 in May - and flat to the $90 average found in June 2013. Not exactly the pent-up demand 'surge' so many economists (and Fed PhDs) have been calling for... Even more concerning, Gallup notes, the drop in daily spending among all Americans can largely be attributed to upper-income Americans spending less in June. Even the 1% are cutting back?
Gallup Slams Lid On Hopes For US Economy - Consumers are “straining against rising prices on daily essentials to afford summer travel, dining out, and discretionary household purchases – the kinds of purchases that ordinarily keep an economy humming.” That’s what Gallup found when it used a new survey to dive deeper into consumer spending. Its regular monthly survey has been mixed. The average dollar amount consumers spent in June swooned to $91 per day from $98 in May, after a crummy January-April period ranging from $78 to $88 per day. The May spurt seems to have been an outlier that had given rise to a lot of speculation consumers would finally hit “escape velocity,” now obviated by events. But from 2012 until late last year, the averages had been rising.So Gallup dove deeper into the issue with its new survey conducted in mid-June to sort through what consumers are spending more or less money on. And what it found was that they’re buying a little more – “just not the things they want.” They’re spending more on things they have to buy, and in many instances they’re spending more in these categories because prices have jumped. At the top of the list: groceries.
- Groceries: 59% spent more, 10% spent less.
- Gasoline: 58% spent more, 12% spent less
- Utilities: 45% spent more, 10% spent less
- Healthcare: 42% spent, 8% spent less
- Toilet paper and other household goods: 32% spent more, 5% spent less
- Rent, the biggie: 32% spent more, 9% spent less.
These categories are household essentials. They’re on top of the priority list. And in order to meet the requirements of these items, consumers are cutting back where they can. Gallup found that “the increasing cost of essential items is further constraining family budgets already hit hard by the Great Recession and still reeling from a stagnant economy.” Hence, the less essential the expense, the more it got cut.
Hotels: Occupancy Rate up 4.4%, RevPAR up 9.0% in Latest Survey - From HotelNewsNow.com: STR: US hotel results for week ending 5 JulyIn year-over-year measurements, the industry’s occupancy rate increased 4.4 percent to 66.0 percent. Average daily rate increased 4.5 percent to finish the week at US$112.40. Revenue per available room for the week was up 9.0 percent to finish at US$74.14. Note: ADR: Average Daily Rate, RevPAR: Revenue per Available Room.The 4-week average of the occupancy rate is solidly above the median for 2000-2007, and is at the same level as in 2000. The following graph shows the seasonal pattern for the hotel occupancy rate for the last 15 years using the four week average. The red line is for 2014 and black is for 2009 - the worst year since the Great Depression for hotels. Note: 2001 was briefly worse than 2009 in September. Right now it looks like 2014 will be the best year since 2000 for hotels. A very strong year ...
Is Inflation Coming? -- Joe Weisenthal at Business Insider writes: These Three Charts Show Inflation Is Finally Right Around The Corner After this week's strong Jobs Report, it's becoming conventional wisdom that the economy is heating up for real this time. After numerous false starts and disappointments since the financial crisis, it appears we've kicked into a higher gear. A stronger economy should mean higher inflation. That's because as the economy grows, slack diminishes in the economy (both industrial slack and labor market slash) and that puts pricing pressure on existing resources. It makes sense, as the unemployed become more scarce, employed workers have greater bargaining power for wages. I also think the economy is picking up, and I agree that as slack diminishes, we will probably see real wage growth and an uptick in inflation. However, this is not convincing: These three charts from Deutsche Bank economist Torsten Slok make for a good overview of the case that inflation is coming. ... Historically, when Capacity Utilization is as high as its now (suggesting not much industrial slack) the inflation rate has been much higher.Here is the first chart. This shows capacity utilization and the year-over-year change in CPI. Capacity Utilization has been increasing, and the author write "No good reasons why this gap should persist" (gap between Capacity utilization on the chart and CPI).The second graph shows the same data, but this time starting in 1990 (instead of 2001).For most of the '90s there was a huge "gap" between capacity utilization and CPI. There were periods when capacity utilization was higher than now - and inflation lower. As an example, capacity utilization was close to 83% in 1998, and YoY inflation averaged 1.5%. So I don't think the first graph is convincing that inflation is "right around the corner". (the last two graphs are from a small survey and also not convincing).
Americans have lost out on $6.6 trillion - The unemployment rate is down to 6.1 percent, and the number of long-term unemployed has been slashed, from about 5 million people to about 3 million. The stock market is soaring, reaching a record high on July 3. The Dow Jones industrial average passed 17,000 — amazing compared with its Great Recession low of 6,627 in March 2009, just weeks after President Barack Obama took office. So what’s missing? Why did Obama acknowledge in a television interview last week that the “underlying trend for middle class families, that they don’t feel, no matter how hard they work, they’re able to get ahead in the same way that their parents were able to get ahead.” The answer lies in a very large sum of missing money — about $6.6 trillion by my count — over the first 12 years of this century. That’s as much money as everyone in the United States made from New Year’s Day 2012 through late September of that year. It may also explain Obama’s low approval ratings. How could such a gigantic sum go missing and not get noticed? I calculated that enormous figure by comparing the average income Americans reported on their 2000 tax returns with what they reported each year for 2001 through 2012, adjusting for inflation and the growing population. Add up the income for 12 years and it turns out to be $6.6 trillion less than if we had maintained the prosperity of 2000 for a growing population.
Rail Traffic Is Growing Like Crazy -- In recent days we've received plenty of evidence that the economy is accelerating.Here's the latest: Rail traffic. The American Association Of Railroads put out its latest weekly look at industrial rail traffic on Wednesday, and it showed that activity is surging.The Association of American Railroads (AAR) today reported increased U.S. rail traffic for June 2014, with both carload and intermodal volume increasing compared with June 2013. U.S. Class I railroads originated 1,177,655 carloads in June 2014, up 3.6 percent (41,310 carloads) over June 2013. Year-over-year monthly carload growth averaged 4.9 percent from March 2014 through June 2014, the highest average for any four-month period since December 2010 through March 2011. Total carloads averaged 294,414 in June, the highest weekly average for June since 2008. This table shows nicely, how in a range of industrial categories, rail traffic growth is on fire.
U.S. Wholesale Inventories Rise 0.5% In May, Slightly Less Than Expected - Wholesale inventories in the U.S. rose by slightly less than anticipated in the month of May, according to a report released by the Commerce Department on Thursday. The report said wholesale inventories increased by 0.5 percent in May after jumping by a revised 1.0 percent in April. Economists had expected inventories to climb by about 0.6 percent compared to the 1.1 percent increase originally reported for the previous month. While inventories of durable goods surged up by 1.0 percent in May, the increase was partly offset by a 0.3 percent drop in inventories of non-durable goods. Meanwhile, the Commerce Department said wholesale sales rose by 0.7 percent in May after soaring by 1.3 percent in the previous month. The report said sales of durable goods edged up by 0.2 percent, while sales of non-durable goods jumped by 1.1 percent. With inventories and sales both rising, the inventories/sales ratio for merchant wholesalers was unchanged compared to the previous month at 1.18. The Commerce Department noted that wholesale inventories in May were up by 7.9 percent compared to the same month a year ago, while wholesale sale were up by 6.6 percent year-over-year.
Q2 GDP Hopes Fade As Wholesale Inventories Miss By Most In 2014 - Another day, another uncomfortable fact about Q2 not being the epic bounce back that so many had promised. Wholesale Inventories rose only 0.5% in May - following April's +1.1%. This is the slowest growth in 2014 and biggest miss of expectations since Dec 2013. Wholesale sales also fel back, missing expectations at +0.7%, to the slowest since Feb as April hopes fade. Cue, Q2 GDP downgrades in 3...2...1...
As GM Objects To Recalling Another 1.8 Million Trucks, One (Ex) Customer Says "Enough" - After recalling over 28.5 million cars this year already, one would have thought GM has 'kitchen-sink'ed it - but no. As NY Times reports, even after receiving over 1000 complaints via NHTSA since 2010, GM has yet to recall almost 1.8 million full-size pickups and sport utility vehicles from the 1999 to 2003 model years for corrosion-related brake failures. The company claims rusted brake lines were an industrywide problem (as assertion that is not supported by complaints filed with Carcomplaints.com). So the question is - after all these recalls, who (apart from vacant dealer lots and the government) is buying GMs; because it's not this previous owner: "I will not be purchasing any further GM vehicles since GM does not stand behind vehicles when a serious malfunction occurs... My children and I could have been fatally injured due to the disintegration of the brake line."
NFIB; Small business optimism declines in June " After a promising 3 month run, June’s Optimism Index fell 1.6 points to 95.0. While job components improved ..." "NFIB owners increased employment by an average of 0.05 workers per firm in June (seasonally adjusted), the ninth positive month in a row and the best string of gains since 2006." Job creation plans continued to strengthen and rose 2 percentage points to a seasonally adjusted net 12 percent, approaching “normal” levels for a growing economy (even with no growth last quarter) and the best reading since 2007.
Small Business Sentiment: Recent Optimism Not Sustained - The latest issue of the NFIB Small Business Economic Trends is out today. The July update for June came in at 95.0, down 1.6 points from the previous month's 96.6. Today's headline number marks a reversal after three months of improvement. The index is now at the 26.0 percentile in this series, a level it first achieved in October 2007, two months before the last recession. The Investing.com forecast was for 97.3. Here is the opening summary of the news release, which takes a typically cautious view of the survey findings. After a promising 3 month run, June’s Optimism Index fell 1.6 points to 95.0. While job components improved, capital outlays and planned spending faded along with expectations for improving business conditions. Overall only two Index components improved, two were unchanged, and six fell. (Link to press release). The first chart below highlights the 1986 baseline level of 100 and includes some labels to help us visualize that dramatic change in small-business sentiment that accompanied the Great Financial Crisis. Compare, for example the relative resilience of the index during the 2000-2003 collapse of the Tech Bubble with the far weaker readings of the past four years. The NBER declared June 2009 as the official end of the last recession.
NFIB Small Business Optimism Fades; Outlook For Economy Plunges -- For a brief month of "we've been down so long, everything looks up", the NFIB Small Business survey suggested the 'recovery' was real and so serial extrapolators (throwing out the 'and small business is the engine of job growth' meme) jumped on it as 'proof' that stocks are cheap and bonds should be sold... then comes June data today (and it's a disaster). 6 of the NFIB's 10 indicators decreased, with about half of the decline in the overall index due to less confidence in future business conditions, the report said, with only 2 indicators improving. CapEx dropped, Sales expectations dropped, 'good time to expand' dropped, actual sales dropped with only hiring plans rising (which seems odd in the face of all the negativity in the rest of the survey) - we will see.
FRBSF Economic Letter: Slow Business Start-ups and the Job Recovery -- Employment growth during the current recovery has been weak compared with past recoveries. It has taken nearly five years since the beginning of the economic expansion for nonfarm employment to return to its pre-recession peak. One factor that may have contributed to this tepid job growth is slower-than-normal employment growth at new businesses, or “start-ups.” Because start-ups generate jobs at a much faster pace than older businesses during recoveries, they account for a significant proportion of job growth in the economy, even though their share of overall employment is quite small. Therefore, even modest slowdowns in start-up growth could result in significant drops in overall employment growth. Employment at start-ups was particularly hard-hit during the Great Recession, suffering a much steeper decline in growth compared with more mature businesses and compared with start-ups in previous recessions. One issue may have been financing. Because personal assets are an important source of funding for start-ups, the tumble in house prices during the downturn may have weakened start-up activity. Since house prices remained depressed early in the recovery, this Economic Letter examines whether start-up employment growth also remained depressed. We further consider whether the slower growth may have been a significant factor behind the weak job recovery. We show that, compared with the recovery from the deep downturn of 1981–82, start-up employment grew significantly less in the year following the Great Recession. Our analysis suggests that between March 2010 and March 2011, lower employment growth at start-ups may have subtracted as much as 0.7 percentage point from total job growth, translating into roughly 760,000 fewer jobs.
The Corporate Illogic of Outsourcing and Offshoring - - Yves Smith -- You must go, now, and read a critically important piece questioning the logic of sending American manufacturing jobs offshore. It’s titled Losing Sparta (hat tip Dikaios Logos) by Ester Kaplan in VQR. We have written regularly about how we have been repeatedly told by managers and executives that the case for offshoring was often not compelling, particularly when risks, such as higher financing and shipping costs, exposure to foreign exchange losses, and inventory risk were included. This makes perfect sense when you consider that for most manufactured goods, factory labor is a mere 10-15% of total wholesale cost, and any savings in factory labor will be offset by higher shipping and greater managerial costs (more coordination, performed by much more highly paid workers). It is thus more accurate to regard a lot of offshoring as not being about cost savings, but a transfer from ordinary workers to managers and executives. The article focuses on a world class manufacturing plant in Sparta, Tennessee, owned by Phillips that made florescent light bulbs. The workers were highly dedicated and strived to implement continued improvements in productivity. Factory pay was $13 to $15 an hour, which were good wages for that area, particularly since it included several weeks of vacation and excellent health care benefits. Yet Phillips decided to shutter the plant in 2010. It was impossible to get a straight answer out of Phillips and the explanations offered for moving production to Monterrey, Mexico, did not add up. And the article points to the broader mythology, that if Americans only compete better, worker will do better. Sparta, and overall statistics show that to be a myth. One of the most striking and often-shown charts is how productivity gains stopped being shared with workers around 1976.
The Part-Time Employment Ratio: A Curious Anomaly in June: Let's take a close look at last week's employment report numbers on Full and Part-Time Employment. Buried near the bottom of Table A-9 of the government's Employment Situation Summary are the numbers for Full- and Part-Time Workers, with 35-or-more hours as the arbitrary divide between the two categories. The focus is on total hours worked: Full-time status may result from multiple part-time jobs. are the numbers for Full- and Part-Time Workers, with 35-or-more hours as the arbitrary divide between the two categories. The focus is on total hours worked: Full-time status may result from multiple part-time jobs. The Labor Department has been collecting this since 1968, a time when only 13.5% of US employees were part-timers. That number peaked at 20.1% in January 2010. The latest data point, over four years later, is only modestly lower at 19.2% last month, although this is a new interim low. Here is a visualization of the trend in the 21st century, with the percentage of full-time employed on the left axis and the part-time employed on the right. We see a conspicuous crossover during Great Recession. Here is a closer look since 2007. The reversal began in 2008, but it accelerated in the Fall of that year following the September 15th bankruptcy of Lehmann Brothers. In this seasonally adjusted data the reversal peaked in early 2010. Four years later the spread has narrowed, but we're still a long way from the ratio before the Great Recession.
Multiple Jobholders as a Percent of the Employed: Two Decades of Trends - What are the long-term trends for the percentage of multiple jobholders in the US? The Bureau of Labor Statistics has two decades of historical data to enlighten us on that topic, courtesy of Table A-16 monthly Current Population Survey. As of the latest monthly data, multiple jobholders account for less than 5% of civilian employment. The survey captures data for four subcategories, the current relative sizes of which I've captured in a pie chart below. Note that the distinction between "primary" and "secondary" jobs is subjective one. Not included in the statistics are the approximately 0.04% of the employed who work part time on what they consider their primary job and full time on their secondary job(s). Let's review the complete series to help us get a sense of the long-term trends. Here is a look at all the multiple jobholders as a percent of the civilian employed. The dots are the non-seasonally adjusted monthly data points and a 12-month moving average to highlight the trend. The moving average peaked in the summer of 1997 and is currently at its trough. The next chart focuses on the four subcategories referenced in the pie chart. The trend outlier is the series illustrated with the red line: Multiple Part-Time Jobholders. Its trough was in 2002 and has been trending higher long before Obamacare. We also see a significant change for the employed whose hours vary between full- and part-time for either their primary or secondary job.
More Employment Graphs: Duration of Unemployment, Unemployment by Education, Construction Employment and Diffusion Indexes - A few more employment graphs by request ... This graph shows the duration of unemployment as a percent of the civilian labor force. The graph shows the number of unemployed in four categories: less than 5 week, 6 to 14 weeks, 15 to 26 weeks, and 27 weeks or more. The general trend is down for all categories, and both the "less than 5 weeks" and 6 to 14 weeks" are close to normal levels. The long term unemployed is just below 2.0% of the labor force - the lowest since February 2009 - however the number (and percent) of long term unemployed remains a serious problem. This graph shows the unemployment rate by four levels of education (all groups are 25 years and older). Unfortunately this data only goes back to 1992 and only includes one previous recession (the stock / tech bust in 2001). Clearly education matters with regards to the unemployment rate - and it appears all four groups are generally trending down. Although education matters for the unemployment rate, it doesn't appear to matter as far as finding new employment. Note: This says nothing about the quality of jobs - as an example, a college graduate working at minimum wage would be considered "employed". This graph shows total construction employment as reported by the BLS (not just residential). Since construction employment bottomed in January 2011, construction payrolls have increased by 583 thousand. Historically there is a lag between an increase in activity and more hiring - and it appears hiring should pickup more this year. The BLS diffusion index for total private employment was at 64.8 in June, up from 62.9 in May. For manufacturing, the diffusion index decreased to 61.1, down from 63.6 in May. Think of this as a measure of how widespread job gains are across industries. The further from 50 (above or below), the more widespread the job losses or gains reported by the BLS.
Even With an Uptick in Jobs, Wariness Remains on Economy’s Full Health - Walking out isn’t normally trumpeted as a good thing. But when it comes to the U.S. job market, quitting is a sign of vigor. So economists cheered Tuesday when a monthly Department of Labor report showed slightly more than 2.5 million people chucked their jobs in May, the highest number of voluntary departures since the summer of 2008. Few moves flash confidence like the risk of leaping from job to job. At the same time, the number of job openings in May hit the highest level in seven years, another sign the labor market is healing from the heavy battering it took during the recession. Still, top policy makers, be it President Barack Obama or Federal Reserve Chairwoman Janet Yellen, remain far from convinced the U.S. economy is back to full health. Ms. Yellen last year flagged the “quit rate” as a key personal indicator for “a substantial improvement in the outlook for the labor market.” A sustained uptick in the quit rate, she said, “would signal that workers perceive that their chances to be rehired are good.”
What "Rosy" Job Numbers? Wal-Mart CEO Slams Recovery Mirage -- When the CEO of the world's biggest company doubts the veracity of US economic data, you know you have a problem. After quarters of disappointing growth in the face of miraculous equity market performance; Wal-Mart CEO Bill Simon warns that shoppers aren’t returning at the pace one might expect years after the recession peaked, despite mainstream media interpretation of the data showing unequivocal growth. Simply put, he exclaims, "the unemployment numbers particularly have been difficult to read with the number of people dropping out of the work force," adding that if we see a further drop in the participation rate it would fit with the fact that "middle-class and lower-class are still economically challenged, only spending during holidays and for family occasions," adding that traction has only come at the top-end.
BLS: Jobs Openings increase to 4.6 million in May - From the BLS: Job Openings and Labor Turnover Summary There were 4.6 million job openings on the last business day of May, little changed from 4.5 million in April, the U.S. Bureau of Labor Statistics reported today. ...Quits are generally voluntary separations initiated by the employee. Therefore, the quits rate can serve as a measure of workers’ willingness or ability to leave jobs. ... The number of quits (not seasonally adjusted) increased over the 12 months ending in May for total nonfarm and total private and was little changed for government. The following graph shows job openings (yellow line), hires (dark blue), Layoff, Discharges and other (red column), and Quits (light blue column) from the JOLTS. This series started in December 2000. Note: The difference between JOLTS hires and separations is similar to the CES (payroll survey) net jobs headline numbers. Note that hires (dark blue) and total separations (red and light blue columns stacked) are pretty close each month. This is a measure of labor market turnover. When the blue line is above the two stacked columns, the economy is adding net jobs - when it is below the columns, the economy is losing jobs. Jobs openings increased in May to 4.635 million from 4.464 million in April. The number of job openings (yellow) are up 19% year-over-year compared to May 2013. Quits are up 15%year-over-year. These are voluntary separations. (see light blue columns at bottom of graph for trend for "quits"). It is a good sign that job openings are over 4 million for the fourth consecutive month, and that quits are increasing.
Job Openings Rise to 7-Year High, but Hiring Notches Scant Gains - The number of job openings in the U.S. economy climbed to the highest level in 7 years, even as the number of people being hired was little changed from recent months, according to the Department of Labor‘s monthly job openings and labor turnover survey, known as JOLTS. Employers were seeking to fill more than 4.6 million jobs in May, up from 4.5 million the month before, according to the survey. The last time so many jobs were open was June 2007. The rate of hiring was little changed for the fourth month in a row, with about 4.7 million workers starting new jobs. The report aims to track the millions of Americans who quit a job, are laid off, or are hired for a new job each month. The survey serves as a supplement to the monthly employment situation report which was released last week and showed the unemployment rate dropping to 6.1%, the lowest level since September 2008. The report has risen in importance since Federal Reserve Chairwoman Janet Yellen identified it as an important guide to the health of the labor market. Ms. Yellen has said that she is watching to see when the rate of people voluntarily quitting their job returns to normal. Slightly more than 2.5 million people voluntarily left their job in May, the most since mid-2008, but still less than during the strongest points of the economic expansion from 2001 to 2007. The number of people quitting jobs each month collapsed during the recession, falling to 1.6 million quits a month in 2009 from 3.1 million in 2006, a decline of 47%.
In May, Job Openings Up, but Quits Flat and Hires Down - The May Job Openings and Labor Turnover Survey (JOLTS) data released this morning by the Bureau of Labor Statistics was more sobering than the strong June jobs report released last Thursday. The JOLTS data show a labor market that is holding steady, not accelerating. If job opportunities were ramping up, we should see the rate of hires and quits rising, but the hires rate has made no sustained improvement in the last nine months, and the quits rate hasn’t budged for seven months. Figure A shows the hires rate, the quits rate, and the layoff rate. The first thing to note is that layoffs, which shot up during the recession, recovered quickly once the recession officially ended. Layoffs have been at prerecession levels for more than three years. This makes sense; the economy is in a recovery and businesses are no longer shedding workers at an elevated rate. But for a full recovery in the labor market to occur, two key things need to happen: Layoffs need to come down, and hiring needs to pick up. Hiring is the side of that equation that, while generally improving, has not yet come close to a full recovery. There are more than 10 percent fewer hires each month than there were before the recession began, and hires actually dropped by 52,000 in May. The rate of hires has seen no sustained improvement since last August.The final piece of the puzzle is voluntary quits.. Voluntary quits, while slowly improving, are also nowhere near a full recovery. There are more than 15 percent fewer voluntary quits each month than there were before the recession began, and the quit rate has seen no improvement since last October. Low voluntary quits indicate that there are a huge number of workers who are locked into jobs that they would leave if they could.
Job Hiring Far Below Pre-Lehman Levels As Yellen's Favorite Labor Metric Redlining -- There was some good news in the JOLTS report released earlier today, mostly in the form of the Job Openings category which surged from 4,464K in April to 4.635K in May, well above the 4350K expected and the highest print since 2007 (granted the unadjusted data showed something completely different but that's a different story). And since this is one of Yellen's favorite labor market indicators, it means that the Fed is that much closer to finally turning the liquidity tap off (at least until the market crashes and the market is promptly forced to rush back in and bail everyone out all over again). Alas, there was also bad news. As the following chart shows, the trend that we have pounded the table on for the past year, namely the lack of actual hiring continues to persist. In fact, while job openings may have soared by nearly 300K in May, the actual number of Hired declined by 52K to 4,718K.
Job Separation Rate Shows Economic Shifts - St Louis Fed - In what ways did the labor market respond to the Great Recession and to what extent has it improved? While the unemployment rate grabs attention, there is much more detailed data behind it, such as the components of the job separation rate. Specifically, the job separations rate (and its components) is an interesting barometer of labor market conditions in a number of ways. Fluctuations in the job separation rate affect the unemployment rate: If the job finding rate remains constant, an increase in the job separation rate will increase the unemployment rate. The two types of job separations further illuminate the bigger picture: Voluntary separations (quits) and involuntary separations (layoffs and discharges) tell us how workers perceive the economy and how firms anticipate their staffing needs. The data show us that the number of job separations was oddly stable throughout the Great Recession. Its composition changed during the recovery, however, and is now actually lower than it was before the recession.
Jobs are staying vacant longer than ever - Last month I noted that the average duration of job vacancies was at a record high. Well, we just surpassed that record: The average job opening went unfilled for 25.1 days in May, the longest duration since at least 2001 (as far back as the data series goes). That compares to a low of 15.3 days in July 2009, about when the recovery officially began. These numbers are based on a method developed by Steven J. Davis, et al, and they reflect the average number of working days between when a job is first posted and when an offer is finally accepted. Typically, there is also an additional lag between the fill date and the new employee’s starting date, but that delay is not included in this measure. In some industries, job openings are staying vacant for much longer than 25 days. In financial services, for example, the typical job opening stayed vacant for about 4o days (compared to a low of 18.4 days in August 2009). In construction — a sector where some analysts have argued that a skilled-labor shortage has held back the housing market – workers are getting hired on a much shorter time frame. The average construction posting stays open for fewer than 10 days before being filled. Bear in mind though that during the depths of the recession, there was one month when construction jobs stayed open for less than 2 days, likely because there was such a large glut of idle workers and very little work. The employers that really seem to be dragging their feet these days are big companies: At firms with at least 5,000 employees, the average position stays open an astonishing 68.5 working days.
The skills mismatch remains a fixture in US labor markets - The Beveridge Curve, a scatter plot of job openings vs. the unemployment rate, continues to show a structural shift in US job markets. A large part of this shift is the skills mismatch. Companies are increasingly looking for skilled and experienced workers and are having a tough time filling those openings. If you are in retail for example, you will have no problems getting part and full time workers to stock the shelves in your store or run the cash register. On the other hand finding someone with the skills to run a store, even a really small one, is becoming more of a challenge. You'll get dozens of resumes to be sure, but very few with the right qualifications. One can see this effect in the small business survey data, as more firms are having a tough time filling openings. The US has millions of unemployed or "marginally attached" workers, yet these are not the workers companies want. Some would say that the reason firms are not getting the workers they want is poor pay. But if you are unemployed - and those of us who have been there know - low pay generally beats the unemployment benefits. Furthermore, at least across small businesses, pay is on the rise. No, it's nothing like it was before the recession, but those days are long gone.
A Nascent Sign of Faster Wage Growth Ahead - Businesses want more labor, but economywide data show they aren’t pumping up pay just yet. New data out Tuesday suggest tight-fistedness may finally be ending. If so, faster pay growth will add a significant support to consumer spending in the second half and beyond. Nonfarm payrolls increased by an average of 230,000 new jobs per month in 2014′s first half, and the latest Job Openings and Labor Turnover survey shows that companies, as of the end of May, had increased the number of job openings almost back to pre-recession levels. Despite greater demand for workers, pay scales have not budged much. Wages for all private-sector employees increased 2% in the year ended in June, according to the Labor Department, exactly where wage growth has trended through all of this recovery. News from the small-business sector, however, suggests pay growth is ready to break out of the 2% range. According to the June survey of small firm owners by the National Federation of Independent Business, a net 21% of small businesses report lifting compensation in the last few months. That is the highest reading since the end of 2007, right before the Great Recession started. Small companies are probably lifting wages to attract qualified job applicants and retain valued employees. Historically, a greater willingness among small businesses to dole out pay raises tends to be a leading indicator for rising growth in the average hourly wage for production workers. In turn, that subset of employees’ pay front-runs the growth in all private pay.
Dorms as "Parents' Home": The long term trends for higher enrollment - On Friday I noted an article by Derek Thompson in the Atlantic: The Misguided Freakout About Basement-Dwelling Millennials More than 15.3 million twentysomethings—and half of young people under 25—live "in their parents’ home," according to official Census statistics. There's just one problem with those official statistics. It is important to note that the Current Population Survey counts students living in dormitories as living in their parents' home. As Thompson noted, most of the recent increase in the percent living "in their parents' home" is related to living in dorms. This is an important point since there is a long term trend for higher school enrollment (so we shouldn't "freak out" about the reported increase in young people living at home). And higher school enrollment generally means lower labor force participation (as I've pointed out before, the decline in the overall labor force participation rate is due to several factors, but two of the most important are aging of the baby boomers and more younger people staying in school).This graph uses data from the BLS on participation rate, and the National Center for Education Statistics (NCES) on enrollment rates (most recent data for 2012). This graph shows the participation and enrollment rates for the 18 to 19 year old age group. These two lines are a "mirror image".
Fewer People Are Quitting Their Jobs, And Why That’s Not Good - Payroll growth finally has taken off this year, rising solidly above 200,000 jobs per month in the first six months. But what lies beneath the headline number says a lot about the economic outlook. Economists at Goldman Sachs GS -0.99%set out to gauge how dynamic the current labor markets are. What they found is there’s much less job movement than there would be in a fully healthy economy. Businesses adding and losing workers and people quitting and taking other jobs–what economists call “churn”—are generally good measures of economic confidence. Goldman constructed a labor-market dynamism tracker using data from a range of government sources. They took the hiring and separation rates in the Job Openings and Labor Turnover survey, the sum of the gross job-gain and job-loss rates from the Business Employment Dynamics report, and the share of workers making job-to-job transitions in the employment report‘s household survey. (The tracker prior to the mid-1990s relies on annual household survey data.) The tracker finds labor-market dynamism “has fallen substantially since 2000.” Dynamism rebounded only weakly in the last two recessions, compared to much stronger bouncebacks following the recessions in the 1980s and 1990s. Companies are laying off far fewer workers, but the hiring rate has recovered only partly from the recession. People are quitting less often, and workers show a greater tendency to stay put. Although some of the reduced churn reflects structural effects, “the decline seems mostly cyclical in nature,”
Weekly Initial Unemployment Claims decrease to 304,000 -- The DOL reports: In the week ending July 5, the advance figure for seasonally adjusted initial claims was 304,000, a decrease of 11,000 from the previous week's unrevised level of 315,000. The 4-week moving average was 311,500, a decrease of 3,500 from the previous week's unrevised average of 315,000. There were no special factors impacting this week's initial claims. The previous week was unrevised at 315,000. The following graph shows the 4-week moving average of weekly claims since January 1971.
New Jobless Claims at 304K, Beating Expectations - Here is the opening statement from the Department of Labor: In the week ending July 5, the advance figure for seasonally adjusted initial claims was 304,000, a decrease of 11,000 from the previous week's unrevised level of 315,000. The 4-week moving average was 311,500, a decrease of 3,500 from the previous week's unrevised average of 315,000. There were no special factors impacting this week's initial claims. [See full report] Today's seasonally adjusted number at 304K was lower than the Investing.com forecast of 315K. The less volatile four-week moving average is now only 1,000 above its nearly seven-year interim low set five weeks ago. Here is a close look at the data over the past few years (with a callout for the past year), which gives a clearer sense of the overall trend in relation to the last recession and the volatility in recent months.
The Long-Term Unemployed Are Not Finding Jobs as the Economy Recovers - Over the past six months, economists have debated whether the long-term unemployed would find work as the economy recovered. Slowly, but surely, we’re getting the answer. So far, it’s not good: Long-term unemployment is quickly growing from a national crisis into a national tragedy. After the financial crisis, long-term unemployment—workers unemployed for more than six months—skyrocketed to record levels. In fact, even today, long-term unemployment is higher than at any point before 2008: We know a lot about these workers. They are slightly older than the short-term unemployed and are more likely to be a minority. They also work in similar industries to the short-term unemployed and have similar education levels. 55 percent of them are male and 37 percent are married. As of June, there are more than three million long-term unemployed workers, although many more have dropped out of the labor market altogether. From both anecdotal and empirical evidence, we know that the long-term unemployed struggle to put food on the table and are prone to depression. We also know that the most likely cause of their long spell of unemployment was bad luck. Now that recovery summer seems finally to be upon us economists are watching intently to see whether employers will actually hire the long-term unemployed—or whether the financial crisis has doomed them to a lifetime of misfortune. Here are four scary signs that it’s the latter.
On Extension of Unemployment Benefits, Conservatives Are Still Wrong -- One of the biggest policy failures Congress has made this year was the inability to extend long-term unemployment benefits. By killing the Senate deal to renew benefits for five months, House Republicans have denied a much-needed source of income to more than a million Americans. But after the June jobs report came out last Thursday, a number of Republicans declared their lack-of-action on UI a success. A quick examination of the evidence shows how wrong they are. Long-term unemployment dropped by nearly 300,000 people in June. Since March, it has fallen by nearly 700,000. Conservatives have argued that this drop is the result of the long-term unemployed accepting work now that they cannot receive UI checks. At the Huffington Post, Arthur Delaney rounded up some of these pronouncements: On Fox News, conservative columnist Charles Krauthammer declared, “The debate on that extension is over, and the conservatives were right.” First, we don’t actually know why long-term unemployment is falling. They could be finding jobs—or they could be dropping out of the labor force altogether. The former is good news. The latter is not. Second, job growth could have accelerated for a number of reasons, including a stronger economy. In fact, the Congressional Budget Office projected that the refusal to extend unemployment insurance would cost jobs. The only way for the end of federal UI to boost job growth would be if it caused the long-term unemployed to accept jobs at a higher rate. As I noted above, we don’t know if that’s happening, but on top of that, long-term unemployment isn’t even falling at a faster rate. In fact, the ranks of the long-term unemployed have been falling at a consistent pace for years:
Flows From Unemployment to Employment & Extended Unemployment Insurance - I was not surprised to learn that conservatives assert that the recent increase in the growth of employment and reduction in unemployment are due to the failure to extend extended unemployment insurance. The headline labor force statistics have changed in the direction they predicted. Steve Benen noted the argument and linked to counter arguments by Danny Vinik and Ben Casselman. While their posts are very worth reading, I want to add more. Vinik mostly and correctly says we can’t yet determine the effect of briefer unemployment insurance on flows from unemployment to employment. Casselman focused on another issue and showed 12 month rolling averages which aren’t ideal for detecting a change January 1st. I have long thought that the best guess of the matching function is that hires of the unemployed are proportional to Vancancies to the 0.7 times number unemployed to the 0.3. To be kind to the Conservatives, I calculate the ratio of monthly flows from unemployed to employed to the square root of the product of vacancies and number unemployed. There isn’t any sign of a shift in January. One might claim that the increase in December was due to anticipation of the end of extended unemployment but I think that is nonsense (the failure to extend was a surprise). The data are noisy and I am looking at all of the unemployed not specifically those affected by the change, so Vinik is right it is hard to tell. But really, the conservatives don’t seem to have a case.
Availability of Unemployment Insurance - “Economists often expect unemployment insurance (UI) benefits… to elevate unemployment rates because recipients may choose to remain unemployed in order to continue receiving benefits, instead of accepting a job or dropping out of the labor force. This paper uses individual data from the Current Population Survey for the period between 2005 and 2013—a period during which the federal government extended and then reduced the length of benefit availability to varying degrees in different states—to investigate the influence of program parameters in the UI system on monthly transition rates of unemployed individuals. The main finding is that unemployed job losers tend to remain unemployed until they exhaust UI benefits, at which point they become more likely to drop out of the labor force; transitions to a job appear to be unaffected by UI benefit extensions. These findings imply that the longer periods of benefit eligibility under the federal programs EUC08 and EB—up to 99 weeks in many states in 2011 and 2012—contributed to the elevated jobless rates observed during that period, but not via lower employment. By the same token, the sharp contraction of benefit weeks that occurred in 2012 and continued more gradually in 2013 likely contributed to declines in unemployment and participation rates beyond what one would expect based on the improving economy alone. Similarly, the December 28, 2013 sudden cutoff of federal UI payments to an estimated 1.3 million jobless Americans who had been looking for work for more than six months is adding to the pace of transitions from unemployment to dropping out of the labor force, thus reducing the unemployment rate and the labor force participation rate further in the first half of 2014, although very modestly.”
Real Earnings of Private Employees Declined Again in May - Here is a look at two key numbers in last week's monthly employment report for June:
- Average Hourly Earnings
- Average Weekly Hours
The government has been tracking the data for Production and Nonsupervisory Employees for decades. But coverage of Total Private Employees only dates from March 2006. Let's examine the broader series, which goes back far enough to show the trend since before the Great Recession. I want to look closely at a five-snapshot sequence. (see graphs0 In Summary…
- Nominal average hourly earnings are up a six cents from the previous month.
- Real average hourly earnings are 29 cents below the December 2008 high.
- Hypothetical real weekly earnings are $4.36 below the previous high in September 2010.
- Hypothetical real annual earnings are $218 below the September 2010 peak.
Is Wage Growth the Problem or the Solution? -- Lots of talk has percolated recently about whether a sudden burst of rapid wage growth would force the Fed’s hand in pulling back monetary stimulus to the U.S. economy. Some who, like me, do not see any evidence of an imminent wage take-off have argued that the Fed should wait for some evidence of wage inflation before hitting the brakes. These arguments essentially treat a pickup of wage growth as a problem to be guarded against. But the most conspicuous failure in the U.S. economy over the past generation, by far, has been too slow wage growth for the vast majority of American workers. A recent report that I co-authored with colleagues from the Economic Policy Institute showed that a range of pressing economic problems–rising income inequality, failure to rapidly reduce poverty, failure to rapidly increase mobility, and even the too-sluggish recovery from the Great Recession–are rooted in the failure of most American workers’ hourly wages to come anywhere close to matching the growth rate of productivity. Further, we provide evidence that many of the standard narratives for why inflation-adjusted wages for this large majority haven’t grown–technological change, lagging skills of U.S. workers and purely apolitical developments in globalization–don’t seem to fit the facts. (Here’s one example: Most college graduates have essentially no wage growth for a decade or more.) So one part of the “how much slack” debate that too often goes unaddressed is that there is not only a lack of evidence that wages are about to start growing rapidly but also that it wouldn’t be a big problem if they did. In fact, it would be a good thing.
High-School Bathroom Cleaner: "$15/Hr Salary Will Change Everything" - My job is what’s called a “restricted” position — the California education code’s name for specially funded positions that can employ only people who meet certain conditions (they’re from impoverished areas or have disabilities, for example). Restricted workers have a set wage rate, which means I haven’t been able to ask for a raise, and I can’t earn overtime. The one thing that hasn’t been good about the job is the pay. When I started 10 years ago, I made $8.65 per hour; now I make $9.85 per hour. But I just learned that’s going to change. SEIU Local 99, the union that represents me and more than 30,000 other school workers here, just negotiated a new contract that will raise my pay to $15 per hour by 2016. This is a big deal for the 20,000 of us who make the district’s lowest wages and are covered by the raises. It might be an even bigger deal around the rest of the United States, since $15 per hour is the goal of a movement in cities around the country to improve the lives of working people. I’m not exactly sure how my life will be at $15 per hour. I’ve never made that much money, and I’ve been doing custodial work since I was 15. I started out while I was still going to school myself, as a part-time custodian at St. Nicholas, a parochial school in the San Fernando Valley. Back then, in 1997, I was making $7.25 an hour. After I graduated from San Fernando High School, the parochial school offered me a permanent position, and I worked there for four years, eventually making $8.50 per hour.
Why the Supreme Court’s Attack on Labor Hurts Women Most -- The War on Women found an ally at the Supreme Court last week with two rulings that threaten to deepen gender inequality in the workplace. The Burwell v. Hobby Lobby case is more clearly aimed at women, with its religiously inspired assault on women’s contraceptive healthcare access. But it was the ruling on union rights in Harris v. Quinn, which threatens a vital union for public healthcare workers, that may prove even more consequential for the lives of working women. Washington has for years been paralyzed by the right’s anti-abortion agenda and resistant to funding the most basic welfare supports for low-income mothers. Now the Court has expanded the attack on women through legal clampdowns on women’s economic and civil rights—attacking reproductive healthcare in one ruling and gutting women’s labor power in the other. Harris centered on Illinois home healthcare workers’ ability to collect dues from all workers they represent. Though the issues of “fair share” rules at unionized workplaces related to all public sector unions, Harris hit at the Achilles heel of public labor: the unique situation of home care workers for people with disabilities, working in private homes, but paid by the government. For this hybrid sector, the Court arbitrarily carved out of standard labor law a novel, and sexist, category, termed “partial public employees.” Siding with the national Right to Work Legal Defense Foundation, the decision effectively stripped unions working in the partial public sector of their ability to finance themselves by invalidating “fair share agreements,” the practice that allows unions to collect dues from employees of an organized shop.
Sex work is work: exploding the “sex trafficking” myth - Like everyone, I’ve seen the reports of people from foreign lands, brought to the west and forced to do sex work. They are called trafficked women, and are often depicted at the point of a police raid, with flashing cameras shoved in their faces. At best, they’re shown as victims; at worst, as nuisances and criminals. I write today to stand with Agustin, Grant, and Maggie McNeill, who have so powerfully argued that this portrayal, and the very concept of “sex trafficking” that underpins it, is a myth. To say this is not to sideline the coerced; in dismantling this pernicious myth, we put their lived experiences front and centre. Coercion, force, and violence in sex work are very real, but they pertain generally to life as a member of the oppressed, not just to sex work. They must be fought across the world, and the concept of sex trafficking does not help in that fight. Instead, it obscures the fact that many types of workers, from carers to builders, suffer force, violence and exploitation. Insidiously, the trafficking myth also deprives sex workers of agency and identity, as it sexualises and fetishises our lives and bodies.
White House Dictates: $3.8 Billion Needed To Stem The Surge Of Immigrants -- At almost double the $2 billion that many had expected, The Washington Post reports that The White House will request $3.8 billion from Congress in emergency funding to deal with an influx of unaccompanied minors from Central America. Funds would be allocated to send more immigration judges to the southern border, build additional detention facilities and add border patrol agents, to help stem the recent surge of women and children from El Salvador, Guatemala and Honduras.
Immigrants From Latin America and Africa Squeezed as Banks Curtail International Money Transfers --As government regulators crack down on the financing of terrorists and drug traffickers, many big banks are abandoning the business of transferring money from the United States to other countries, moves that are expected to reverse years of declines in the cost of immigrants sending money home to their families. While Mexico may be most affected — nearly half of the $51.1 billion in remittances sent from the United States in 2012 ended up in that country — the banks’ broad retreat over the last year is affecting other countries in Latin America and parts of Africa as well. The banks are being held accountable not only for the customers who directly use their money transfer services but also for their role in collecting remittances from money transmitting companies and wiring them abroad. JPMorgan Chase and Bank of America have scrapped low-cost services that allowed Mexican immigrants to send money to their families across the border. The Spanish bank BBVA is reportedly exploring the sale of its unit that wires money to Mexico and across Latin America. And in perhaps the deepest retrenchment by a bank, Citigroup’s Banamex USA unit has now closed many of its branches in Texas, California and Arizona that catered to Mexicans living in the United States and stopped most remittances to Mexico as it faces a federal investigation related to money laundering controls.
Multiple armed citizen groups seek recruits to secure U.S. border: Citizen groups in border states are seeking armed volunteers to patrol the U.S.-Mexico frontier alongside law enforcement officers who are struggling to deal with a surge of undocumented migrants from Central America. Southwestern states have seen a big influx of arrivals this year that has put a strain on the U.S. Customs and Border Protection (CBP) agency. Anti-illegal immigration groups have turned to social media, blogs and 24-hour hotlines in the hope of recruiting thousands of volunteers to help out. Federal authorities say they do not support any private group taking matters into their own hands, and say it could have “disastrous” consequences. The activists say their efforts are needed because the federal government has failed to secure the border.
Welfare economics: normative is performative, not positive (part 5 and conclusion of a series): This is the fifth (and final) part of a series. See parts 1, 2, 3, and 4.For those who have read along thus, far, I am grateful. We’ve traveled a long road, but in the end we haven’t traveled very far.We have understood, first, the conceit of traditional welfare economics: that with just a sprinkle of one, widely popular bit of ethical philosophy — liberalism! — we could let positive economics (an empirical science, at least in aspiration) serve as the basis for normative views about how society should be arranged. But we ran into a problem. “Scientificoliberal” economics can decide between alternatives when everybody would agree that one possibility would be preferable to (or at least not inferior to) another. But it lacks any obvious way of making interpersonal comparisons, so it cannot choose among possibilities that would leave some parties “better off” (in a circumstance they would prefer), but others worse off. Since it is rare that nontrivial economic and social choices are universally preferable, this inability to trade-off costs and benefits between people seems to render any usefully prescriptive economics impossible.
Homeless Population Is Getting older - In 1990, U.S. homelessness was most common among people in their 30s. In 2000, it was most common among people in their 40s. In 2010, it was most common among people in their 50s. Every decade, the group facing the highest risk of homelessness was born between 1954 and 1963. Problems facing this cohort of late Baby Boomers were discussed in a 2013 study published in the "Analyses of Social Issues and Public Policy." In short, they came of age in the late 70s and early 80s in a period of depressed wages for unskilled workers, higher youth and young adult unemployment, and rising rental housing costs. At the same time, they faced a proliferation of crack cocaine, leading to social problems and incarceration. "These conditions could have created an underlying vulnerability that resulted in a sustained risk for housing instability over the ensuing decades," the study concluded. Here's a chart adapted from the study showing this disturbing trend:
Gap between minimum wage and tipped wage hits record high -- Cities and states across the country are hiking their minimum wages absent any efforts by Congress to do so at the federal level. While that’s good news for many low-wage workers, waiters and others partly compensated in tips aren’t necessarily reaping the benefits. Restaurant industry groups like the National Restaurant Association (NRA) argue that the average tipped worker makes a decent living, but a new study from the Economic Policy Institute (EPI) says otherwise. EPI, which is partially funded by organized labor, found that the median tipped wage is significantly lower than the overall median wage—about $10.22 per hour versus $16.48. What’s more, the study found, tipped workers “experience poverty at much higher rates than the overall workforce.” The poverty rate for tipped workers was found to be 12.8%, versus 6.5% for other workers. Chicago, which could soon raise its base minimum wage from $8.25 to $13 per hour, is proposing a much smaller increase to the tipped minimum wage. If the recommendation from the city’s minimum wage task force goes through, tipped employees would get just $1 added to their current base wage of $4.95 per hour. All but seven states in the country have a tipped wage that’s different from the regular minimum wage. Under federal law, the tipped minimum wage is $2.13, with a $5.12 “tip credit” for employers; in other words, tipped workers are still expected to make at least $7.25 per hour (the regular minimum wage on the federal level), but management is allowed to pay less if the customers tip more.
The Minimum Wage For Tipped Workers Hasn’t Increased Since the Fall of the Soviet Union - In 1991, the US invaded Iraq for the first time. That year, the Soviet Union would dissolve into 15 independent states. It also marked the last time that the federal minimum wage for tipped workers was increased — by a whopping four cents, from $2.09 per hour to $2.13. At the time, the minimum for tipped workers was half of the overall floor of $4.25. Today, it stands at just 29 percent of the regular minimum wage (which, at $7.25 per hour, is already well below its real peak value of $10.71 in 1968). On Thursday, Sylvia Allegretto and David Cooper released a report for the Economic Policy Institute (EPI) detailing who these workers are, how many of them are struggling to make ends meet, and debunking a few common myths about tipped work. They write: The creation of the tip credit—the difference, paid for by customers’ tips, between the regular minimum wage and the sub-wage for tipped workers—fundamentally changed the practice of tipping. Whereas tips had once been simply a token of gratitude from the served to the server, they became, at least in part, a subsidy from consumers to the employers of tipped workers. In other words, part of the employer wage bill is now paid by customers via their tips. Today, this two-tiered wage system continues to exist, yet the subsidy to employers provided by customers in restaurants, salons, casinos, and other businesses that employ tipped workers is larger than it has ever been. At the federal level, it currently stands at $5.12 per hour.
Study: States that raised minimum wage had stronger job growth - A recent study by the Center for Economic and Policy Research attempts to undercut the argument that raising the minimum wage kills jobs. The study, which updates a Goldman Sachs analysis to include data from April and May, shows that the 13 states that increased their minimum wages on Jan. 1 have had stronger employment growth than the 37 states that didn’t. The study compared average employment during the first five months of 2014 with the last five months of 2013. The average change in payrolls in the 13 states that increased their minimum wages was 0.99% vs. 0.68% in the other states. On January 1, Connecticut, New Jersey, New York and Rhode Island boosted their pay floors as a result of legislation. The other nine states – Arizona, Colorado, Florida, Missouri, Montana, Ohio, Oregon, Vermont and Washington – automatically raised their minimums by smaller amounts based on inflation. CEPR acknowledges this analysis is far from scientific and draws no direct link between raising the minimum wage and payroll gains. Still, “it does provide evidence against theoretical negative employment effects of minimum wage increases,” CEPR researcher Ben Wolcott writes. Critics of minimum wage increases argue they raise business costs, forcing employers to lay off workers or hire fewer people. But CEPR senior economist John Schmitt says one reason minimum pay hikes actually could bolster employment growth is that they help businesses fill openings more quickly. Big employers of low-wage workers, such as fast food chains, virtually always have job vacancies, he says.
Puerto Rico general obligation bonds downgraded - (AP) — Fitch Ratings has downgraded $13.4 billion worth of Puerto Rico's general obligation bonds as well as bonds issued by the island's water and sewer company. Fitch said Wednesday that the downgrades are a result of a newly approved law that allows certain public corporations in Puerto Rico to restructure their debt if needed. The announcement comes more than a week after Moody's said it was downgrading $14.4 billion worth of outstanding Puerto Rico general obligation bonds. The U.S. territory is entering its eighth year in recession and is struggling with a $73 billion public debt load. Puerto Rico sold a record $3.5 billion in general obligation bonds in March despite having its credit rating downgraded to junk status.
Puerto Rico's Power Authority Taps Reserves to Pay Investors - WSJ: The Puerto Rico Electric Power Authority tapped reserve funds to pay investors last week in the latest sign the cash-strapped utility may soon restructure its debt. A trustee for the power authority withdrew about $41.6 million from a reserve fund to make payments on July 1, according to a notice posted Thursday on the Electronic Municipal Market Access website that described the event as "reflecting financial difficulties" for the issuer. Investors were concerned that the authority, which has almost $9 billion in total debt, wouldn't make scheduled bond payments last week after Puerto Rico passed legislation allowing some public agencies to restructure their finances. The power authority, called Prepa, also owes about $671 million to banks by mid-August and doesn't have the cash to pay, according to Standard & Poor's Ratings Services. Prepa reached agreements with those banks by mid-August and doesn't have the cash to pay, according to Standard & Poor's Ratings Services. Prepa reached agreements with those banks to extend deadlines for some payments. Prepa said in a statement that it made bond payments totaling more than $417 million as scheduled. "We continue to provide our customers with uninterrupted service and have more than sufficient liquidity to continue to pay our employees and suppliers on a timely basis," the agency said.
Detroit: My Complication Had A Little Complication - This week, the Sixth Circuit shattered the blockade on appeals from Detroit's bankruptcy. First, acting on a writ of mandamus, the Sixth Circuit ordered a district judge to adjudicate an appeal, on a short deadline, of a bankruptcy court order regarding the City's casino revenues from late August 2013. Given that the district judge had stayed other appeals on the same grounds, it is possible that those will have to get moving as well. Then, the Sixth Circuit scheduled oral argument for July 30 for appeals from the bankruptcy court's eligibility/pension impairment decision. Here's the notice; the time has since been changed to 1:30. The Sixth Circuit's acts are important reminders that rights to appeal on major legal questions are not inherently second fiddle to expedience in restructuring. Yet, is this ever a fraught time for the oral argument announcement! The Sixth Circuit notice strongly discourages motions for deferrals. The identified standard is "exceptional circumstances." Detroit's counsel filed a motion anyway, asking for a time-out at least until the votes on the plan are counted. The voting deadline is July 11. The official tally is due to the bankruptcy court by July 21.The eligibility appeals are intricately tied with key settlements on Detroit's plan of adjustment. The State of Michigan contribution to Detroit's plan is contingent on eligibility-challenging appellants giving up that fight. Most of those appellants - retiree and employee groups, unions, and the Detroit Retirement Systems - are part of the settlement and now advise a "yes" vote on class 10 and 11 claims, even though doing so is a vote to abandon the challenge to eligibility/pension impairment. Remember what Shirley Lightsey said: You Can't Eat Principles.
Detroit Plans to Pay 34 Cents on Limited-Tax General Obligations - Bankrupt Detroit plans to pay investors who own its $164 million of limited-tax general-obligation bonds 34 cents on the dollar, according to an internal report. The reduction is part of the city’s plan to pay about $2.5 billion toward $9.9 billion in unsecured obligations, including debt and pensions. Investors in the $3.7 trillion municipal market are watching Detroit’s bankruptcy case for clues about how debt backed by a government’s pledge to pay will fare in cases of distress. Detroit filed its record $18 billion municipal bankruptcy about a year ago. The 34-cent recovery differentiates limited-tax bonds from their unlimited-tax counterparts, which are considered to have a stronger revenue pledge. Detroit in April agreed to pay unlimited-tax general obligation bondholders about 74 percent of the $388 million they are owed.
Detroit Residents Face Water Crisis as 36 Detroit Businesses Owe Over $4.2 Million in Back Bills -- After facing international condemnation for shutting off access to clean water for thousands of Detroit residents, the Detroit Free Press reported yesterday that the water department will finally begin pursuing corporate debts. But it’s too little, too late. Over 7,000 residents already had their service cut off in June alone, before a single business faced the threat of collection. An estimated 40% of Detroit residents stand to lose water access by the end of the city’s brutal campaign to close delinquent accounts. Firedoglake is mobilizing to help those who have and will lose access to the city’s water supply. We’re working with the Detroit Water Brigade, raising $2,000 to immediately purchase and send as many water jugs and coolers to their distribution centers as possible. Can you please donate $10 or more to purchase water jugs and coolers for Detroit residents who’ve had their water cut off?
LA Schools Realize Giving Every Kid an iPad Was a Costly Disaster, Will Give Every Kid a Laptop Instead - The Los Angeles Unified School District's plan to give every child an iPad—at a cost of $1 billion to taxpayers—drew universal criticism after numerous problems arose. For one thing, when the devices were broken, lost, or stolen, it wasn't clear whether parents, the schools, or the kids themselves were responsible. Tech-savvy students easily broke through the firewalls administrators had installed to keep them from using the devices to visit social media websites. This prompted some schools to prohibit the use of the iPads at home, when students are away from teacher supervision, even though one of the major intended functions of the iPad program was to give kids a homework aid. The entire thing was an unmitigated disaster—a clear example of real life trumping the good intentions of bureaucrats But LAUSD has clearly learned its lesson, right? Wrong: Los Angeles school district officials have allowed a group of high schools to choose from among six different laptop computers for their students — a marked contrast to last year's decision to give every pupil an iPad. Contracts that will come under final review by the Board of Education on Tuesday would authorize the purchase of one of six devices for each of the 27 high schools at a cost not to exceed $40 million.
Students Get Too Much Summer Vacation, Workers Don't Get Enough - The U.S. is the only advanced economy that doesn't guarantee workers at least some paid vacation time. Most developed nations, in fact, provide 20 days or more of guaranteed vacation; even America's neighbor to the north, Canada, guarantees 10 paid vacation days and nine paid holidays annually. This chart from the Center on Economic and Policy Research shows the breakdown: The stubborn refusal to craft any sort of mandate results in almost one in four Americans having no paid vacation days at all. The average private sector worker in America, meanwhile, receives about 10 paid vacation days and six paid holidays annually, less than the legal minimum in nearly every other developed nation. And this stinginess exists despite the evidence that time off the job helps workers stay engaged and boosts productivity. But while giving the adults no break, U.S. primary and secondary students get a big one come summer, for no real reason other than tradition. However, study after study has shown that students suffer learning losses during summer vacation, losing about one month's worth of instruction in what is known as the "summer slide." The problem is particularly acute for students of low-income families, whose parents can't afford to send them to summer camps or enrichment programs. And what is lost during the summer is not regained. As a study by the RAND Corporation put it, "most disturbing is that summer learning loss is cumulative; over time, the difference between the summer learning rates of low-income and higher-income students contributes substantially to the achievement gap."
Expanding Apprenticeships - It's a commonplace of the education world that not all students learn the same way. . And it's time for the U.S. to recognize that some would learn better if we got them out of the existing school system and involved in apprenticeships. Robert I. Lerman lays out the issues and possibilities in "Expanding Apprenticeship Opportunities in the United States." What Lerman means by "apprenticeships" are a program where in the last couple of years of high school, students would apply for a program where they would complete high school, and maybe get a few college credits, while taking classes but also working about 2,000 hours (that is, the equivalent of 50 weeks of 40 hour workweeks, spread over a couple of years). Here are some of Lerman's points that caught my eye (citations omitted): "Today apprentices make up only 0.2 percent of the U.S. labor force, far less than in Canada (2.2 percent), Britain (2.7 percent), and Australia and Germany (3.7 percent). In addition, government spending on apprenticeship programs is tiny compared with spending by other countries and spending on less-effective career and community college systems that provide education and training for specific occupations. While total annual government funding for apprenticeship in the United States is only about $100 to $400 per apprentice, federal, state, and local annual government spending per participant for two-year public colleges is approximately $11,400. Not only are government outlays sharply higher, but the cost differentials are even greater after accounting for the higher earnings (and associated taxes) of apprentices compared to college students. Given these data, at least some of the low apprenticeship penetration can be attributed to a lack of public effort in promoting and supporting apprenticeship and to heavy subsidies for alternatives to apprenticeship. ...
American Teens Achieve Mediocrity In Financial Literacy - When it comes to financial literacy around the world, American teens are middling. The United States may fuel the world’s largest economy and operate its most robust financial system. But compared to the financial prowess of teenagers in 17 other countries, U.S. teens come off downright mediocre. That’s according to a new study published Wednesday by the Organization for Economic Cooperation and Development as part of its Program for International Student Assessment, conducted once every three years. The OECD, a 34-nation organization based in Paris, surveyed 15-year-old students in 13 member nations and five other nations throughout 2012 to ascertain their level of familiarity with the financial system as they neared adulthood. “Finance is part of everyday life for many 15-year-olds, who are already consumers of financial services, such as bank accounts,” the report said. “As they near the end of compulsory education, students will face complex and challenging financial choices, including whether to join the labor market or continue with formal education and, if so, how to finance such study.” The survey questions assessed the teens’ understanding of bank accounts, credit cards, taxes, savings and contracts — among other topics. Teens in Shanghai, China, proved the most financially literate of the countries surveyed with a mean test score of 603; Colombia rounded out the bottom of the ranking with an average test score of 379. American teens scored an average of 492 points — placing them ninth in the ranking, exactly in the middle of the pack.
Basement-Dwelling Millennials Are For Real -- The share of millennials – that is, 18-34 year-olds – living with their parents reached a many-decade high during the recession. Last week, an article suggested that these statistics are “criminally misleading” in overstating the increase in millennials actually living with parents because (1) they count dorm-dwelling college students as living with their parents and (2) college enrollment among young people has risen significantly. Both these points are true: the Current Population Survey’s (CPS) Annual Social and Economic Supplement (ASEC) counts college students who are living in dorms as living with their parents, and college enrollment has indeed gone up. But it does not follow that basement-dwelling millennials are a myth. The ASEC and other Census data show that after adjusting for college enrollment and for dormitory living, millennials were more likely to live with parents in 2012 and 2013 than at any other time for which a consistent data series is available (1986 or 1990, depending on the data source). The ASEC counts college students who are living in dorms as living with their parents, so it’s impossible to separate out the dorm-dwellers who were reported as living with parents from college students actually living with their parents full-time. But the survey also reports whether 18-24 year-olds are enrolled in college (in survey years 1986 onward). As a first step, we can exclude all full-time college students from the analysis to make sure we’re not including any dorm-dwellers. Excluding full-time college students, the share of millennials living with parents is still far higher during the recession than at any other time since 1986.
“Forbidden Bookshelf” Series Acquaints Public with Books Vanished by Government or Powerful Interests - A digital publisher called Open Road Integrated Media has launched a series called the “Forbidden Bookshelf,” in order to acquaint the public with books that were vanished or, in one way or another, killed at birth by the government or corporate entities when they were first published. Mark Crispin Miller, a professor of media studies at New York University, came up with the idea. He told Firedoglake in an interview that over the years he had found a lot of books he wanted to assign in his courses were unavailable,” which he said “speaks to certain problems in the book publishing industry.” More importantly, he also learned repeatedly of books that had been “disappeared” by powerful interests. Those works were not targeted with “outright bans,” because such outright censorship is unconstitutional in the United States. Rather, they were undone through other means, such as malicious bad reviews, or no reviews at all, or by the publisher not doing any marketing or even shipping copies to the bookstores.
Class of 2008 Grads in U.S. Earned Average $52,000 Four Years On -- Bachelor’s degree holders with full-time jobs had an average salary of $52,200 in 2012, four years after graduating at the height of the Great Recession, a study showed. For those not enrolled in further education, 83 percent of the Class of 2008 were employed four years later, a report by the National Center for Education Statistics showed. Students who graduated with a degree in a science, technology, engineering or mathematical (STEM) field earned an average of $65,000, 31 percent more than their non-STEM counterparts. “The amount of money earned, jobs held and hours worked all look to be in favor of those who majored in STEM subjects,” Ted Socha, mathematical statistician and project officer for the report said in a phone interview. “It’s where the most in-demand and desired jobs are.” Ninety-two percent of those with math or technology-related degrees worked full time, compared with 84 percent of those in other fields. They also held fewer jobs in the period, indicating that their employment is more stable, Socha said. Employed males working one full-time job earned an average of 22 percent more than their female counterparts, who earned an average of $47,400. The report surveyed 17,110 students about four years after they received their bachelor’s degrees in 2007-2008. The sample provides a nationally representative picture of the about 1.6 million students who completed requirements for a baccalaureate degree between July 1, 2007 and June 30, 2008.
The (Grim) Reason College Is Still Worth Its Cost - A recent paper by two economists at the Federal Reserve Bank of New York answers in the affirmative. Their reason, however, is a bit disappointing. Economists measure the value of a college education by the additional lifetime earnings that graduates can expect, taking account of both the costs of college and the earnings foregone if grads had found and stayed at a job out of high school. For decades, the rate of return measured this way has been strongly positive. But in the past decade, the earnings of college graduates have fallen. The drop has accelerated since the Great Recession–a result hardly surprising to recent graduates or their parents (who may still be housing their children in their post-college years). In addition, the sticker price of attending college has risen sharply. Despite these worrisome trends, going to college relative to not going still yields an annual rate of return of 15%, the economists found. The reason? Earnings of high school graduates, assuming they can get jobs, have fallen even faster. The good news in all this is that college graduates who major in technical fields–math, engineering and computers–fare better than their counterparts in liberal arts. Students and parents, are you listening to what the market is saying?
Student Debt in Low- and Moderate-Income Areas - St. Louis Fed - Student borrowers from low- and moderate-income (LMI) tracts generally have lower levels of student debt than those from middle- and upper-income (MUI) tracts, but their delinquency levels are much higher. In a recent Bridges article, Bryan Noeth, a policy analyst with the St. Louis Fed’s Center for Household Financial Stability, examined the student debt characteristics of borrowers in the Eighth District’s four largest metropolitan statistical areas (MSAs)—St. Louis, Little Rock, Ark., Louisville, Ky., and Memphis, Tenn.—focusing on the differences between LMI and MUI tracts.1 Noeth found that borrowers in LMI tracts tend to have lower levels of debt than those in MUI tracts. He wrote, “This may seem counterintuitive. Borrowers from LMI tracts likely had fewer resources to attend college so would need to take on more debt and, by definition, likely have less income to make repayments. However, there are several reasons why debt levels might be lower.” In LMI tracts, many students choose community colleges with lower tuition levels, and of those who have a degree, a higher percentage of students have an associate’s degree. Also, borrowers from LMI tracts are less likely to finish college, meaning they may not take on as much student debt. Conversely, a higher percentage of students from MUI tracts attend private institutions and are more likely to attain bachelor’s and graduate degrees, which tend to have higher educational costs.
Many over 50 are still saddled with student loans - Lingering student-loan debt — which in recent years has been a drag on the economy as borrowers delay big-ticket purchases such as homes and cars — is beginning to affect millions of people as they head toward retirement. More than 16 percent of the nearly $1.2 trillion in outstanding student-loan debt in the nation is held by people over 50, according to the New York Federal Reserve Bank. “It’s one of the largest economic issues of our time, and it’s not just a young person’s issue,” said Natalia Abrams of the advocacy group StudentDebtCrisis.org. Many of the borrowers have taken out loans later in life, often for retraining to stay afloat in a changing economy. Some wound up on the hook when they co-signed or took out loans for children and grandchildren. Others, like Andrew Jones of Englewood, N.J., have had the loans follow them throughout their adult lives into retirement. Jones defaulted on nearly $5,000 in student loans he took out in 1970, when he went off to Yankton College in South Dakota. He has paid more than double the initial balance, and his Social Security check recently was garnished to pay back the interest and fees. “I’m 63 years old and they’re chasing me on a student loan?” Jones said. “They want to keep taking money from me until I’m dead.”
Pension, pay hikes prove costly for LAUSD: Los Angeles Unified will dole out an extra $24.7 million this year to pay for rising employee pension costs after a series of state mandates left school districts largely to fund ailing retirement systems. The lion’s share of LAUSD’s increased cost — $16.3 million — will cover teacher pensions under the freshly passed AB 1469, which hiked school-system contributions to the world’s largest education-only pension fund, the California State Teachers Retirement System (CalSTRS). Another $8.37 million will cover district employees in the California Public Employees Retirement System (CalPERS), who are seeing an increase in their required contributions under the Public Employee Pension Reform Act of 2013. District number crunchers anticipated the rising price of pensions for the next three years, writing expenses into this year’s $7.27 billion operating budget and projecting increases through 2016-17, according to budget documents. But those contributions are set to skyrocket after three years. By 2021, LAUSD will pay a projected $366.8 million more in pension costs than it currently does, with CalPERS collecting $86 million more from the district. The cost of teacher pensions will have more than doubled, rising to $494 million from last year’s $213.2 million in district-paid contributions
Michigan Teacher Pensions Costs Increase To Nearly $1 Billion Per Year -- What started out as a $155 million tab in 2012 for public school employee pension and retirement health care costs will increase to $945 million by 2015, according to the Senate Fiscal Agency. The driver of the escalating costs is MPSERS' unfunded liability. The pension system's unfunded liability was $25.8 billion in 2013, up from $24.3 billion in 2012. The state's payments also go to defray retiree health care costs. The costs for the Michigan Public School Employees Retirement System includes the $882.7 million the state is projecting to spend on retirement contributions for K-12 education in 2015 plus the costs for community colleges, libraries and higher education. One reason the costs are increasing is that school districts didn't meet the annual required contributions for pension costs, said James Hohman, assistant director of fiscal policy at the Mackinac Center for Public Policy. In 2013, the state determined the cost was $1.9 billion, but districts paid $1.36 billion, according to state's 2013 annual audit.
Former CalPERS CEO Pleads Guilty to Bribery, Fraud, Including Taking Cash in Paper Bags - Yves Smith - Several readers sent accounts from the California press on the latest sordid chapter in a long-standing, large scale pay-to-play scandal at the giant California public pension fund, CalPERS. Earlier this month, state papers reported disclosed that the former CEO, Frank Buenrostro, had cut a plea bargain with Federal prosecutors and was turning evidence on his (alleged) former partner in crime, placement agent and former CalPERS board member Alfred Villalobos. We'd heard privately before that story broke that the charges against Buenrostro were about to be greatly expanded, which is likely what lead the former CEO to fold. But as a CalPERS insider told us, "It was a race to see who was going to cut a deal first."
Our Enormous Retirement Subsidies for the Rich -- In the State of the Union address, Obama revealed that he will be implementing a myRA plan, which is basically an Individual Retirement Account administered by the government. Savers will put the money in after-tax (like a Roth IRA), the accounts will be small (capped at $15,000), and the returns will be modest but guaranteed.But before people start rattling off alternative account proposals that are much better, it behooves us to collectively recall just how much money the federal government is already devoting to subsidizing private retirement accounts. Those in policy circles tend to be aware of this stuff, but it largely escapes the glare of everyone else. Each year, the federal government puts tax expenditures towards a whole slew of retirement instruments including defined benefit plans, 401(k)s, Keogh plans, traditional IRAs, and Roth IRAs. The Joint Committee on Taxation projects that in the five years between 2013 and 2017, spending on these subsidies will total over $700 billion. If we double that to do the 10-year budget thing everyone does for some reason, we wind up with $1.4 trillion of tax expenditures on just these subsidies. Who captures these subsidies? The rich of course. According to the CBO, the following is who soaked up the tax expenditures dedicated to net pension contributions and earnings in 2013.
Pay for some Medicaid doctors headed for 'especially big cliff' -- Family doctors in North Carolina are bracing for a looming deadline that will slash the amount they're paid for the treatment of the state's poor and disabled. On Jan. 1, a two-pronged state and federal cut to Medicaid reimbursement rates will mean a drop in payments of 15 percent or more for primary care physicians. Opponents of the cuts say they will return reimbursement rates to pre-2012 levels, a major hit for doctors considered a first line of defense against more costly medical care. "It's a pretty devastating blow," "Within a month or so, you're going to see people have to make tough decisions." Primary care doctors will see two things happen to their Medicaid reimbursement rates for the new year. First, a temporary boost to Medicaid payments for general practitioners put into place by the Affordable Care Act will expire. Meant to encourage more general practitioners to treat the poor and disabled with less costly preventative care, the lapsed measure amounts to a 15 percent cut, Griggs said. The deadline also triggers a 3 percent cut mandated by state lawmakers in 2013 as part of a so-called "shared savings plan," which is supposed to pay medical providers back for efficient and effective care. Primary care doctors were originally exempted from that plan – at least until Jan. 1.
Is Traditional Medicare withering on the vine? - On Oct. 24, 1995, Newt Gingrich made an assertion about what would happen to Medicare if its beneficiaries could choose between it and private plans. Medicare is “going to wither on the vine because we think people are voluntarily going to leave it — voluntarily.” Though he later walked this statement back, many observers viewed it as an attack on the program. In fact, over the nearly two decades since, Mr. Gingrich’s claim has undergone something of a test — and it has largely passed it.In that time, Medicare beneficiaries have enjoyed various levels of access to private alternatives to traditional Medicare through the Medicare Advantage program and its predecessors. These private Medicare plans must provide at least the same level of benefits as traditional Medicare, though may offer more generous benefits voluntarily. They are subsidized by the federal government, often to the degree that many beneficiaries pay no premium even when receiving more benefits than they would from the traditional program. Federal financial support for these alternative plans has waxed and waned, and enrollment in them with it. When government payments to plans were lower — as they were in the early 2000s — fewer plans participated, and those that did offered relatively less generous benefits; enrollment declined. When government payments to plans were higher — as they were beginning in the mid-2000s — enrollment increased.
Hobby Lobby ruling: The crux of the problem is employer-provided health insurance - In Monday's Burwell v. Hobby Lobby decision, the U.S. Supreme Court ruled that closely held private companies are not required to provide contraceptive coverage in their employees’ health insurance plans. The basis for the decision is the Religious Freedom Restoration Act of 1993, “which prohibits the “Government [from] substantially burden[ing] a person’s exercise of religion even if the burden results from a rule of general applicability.” The court once again applied the idea of a person to a company, in this case “closely held corporations” (to quote the decision). I’ll leave the person/corporation debate to the lawyers, political scientists, philosophers, and anyone else who wants to debate the point. Here, I want to focus on the crux of the problem: our employer-provided health-insurance system. In particular, the Supreme Court’s decision makes it clear that America’s experiment with employer-provided health care is a failure and that we need to move to either a single-payer system or a voucher system and remove employers from the health-insurance business.
Can the House sue over the employer mandate? -- Speaker of the House John Boehner has released a draft resolution authorizing the House of Representatives to file suit against President Obama. The claim? That the President’s delay of the employer mandate was unconstitutional. Set aside the delicious fact that Boehner—no friend to either Obamacare or taxes—is pressing to have the President enforce an Obamacare tax. On the merits, he’s got a point. As I’ve explained before, the legality of delaying the employer mandate is questionable. Even so, the lawsuit isn’t going anywhere. The problem is standing. The House of Representatives as an institution hasn’t suffered the sort of concrete, particularized injury that the courts are constitutionally empowered to review. This is a political dispute, not a judicial dispute, and the courts will properly leave it to the political branches to sort it out. The only arguments I’ve seen in favor of standing—they’re sketched out in a memo from Boehner—don’t withstand even cursory scrutiny. The primary claim seems to be that “[t]here is no one else who can challenge the president’s failure.” But so what? The Supreme Court has been unusually emphatic in holding that “the assumption that if [the challengers] have no standing to sue, that no one would have standing to sue, is not a reason to find standing.” Not every fight can or should see the inside of a courtroom.
Godzilla has risen: The insurance industry under the ACA -- Despite all the hopes many of us had for the Affordable Care Act (ACA), the current system of medical insurance is a dysfunctional nightmare. I should know, because I am in the unique position of experiencing it from three perspectives simultaneously: that of a patient who uses an insurance plan, that of a small business owner who purchases insurance for a group of employees, and that of a physician who contracts with and gets paid by insurance companies. As a patient, I am tricked by the expensive insurance plan I bought. Even though the card says “HSA 2000,” the deductible for my family is actually $4,000. After that the insurance only pays for 70 percent of covered charges when initially we were told 80 percent. When I call my insurance company to address problems, I must make sure that I have several hours of free time, so that I can stay on hold long enough to get through to the low level representative who has little power to do anything. The disclaimer “Description of covered benefits is not a guarantee of payment” makes me fearful and insecure. I am at the mercy of large, for-profit corporation that is beholden to shareholders and run by greedy CEOs who do not care about me. Having insurance means little anymore. Deductibles are high, share of costs are high, and many benefits are simply not covered. Deny, deny, deny! The company has so many devious ways of denying payment that even a sophisticated health care “consumer” can be taken by surprise. The reason for denial could be the type of treatment (no counseling for you!), or lack of a contract with a specific provider, or that your medication is non generic, or not on formulary.
Success Kills Another Obamacare Myth -- Solid news about Obamacare keeps coming. It’s almost as if the myths about the law -- the idea that it was a failure and about to collapse -- were junk. The Affordable Care Act was designed to achieve two goals, according to its advocates: it was supposed to increase the number of people with health insurance, and to cut health-care costs. Increasingly, the former looks like a solid achievement, and there are increasing signs the latter is being accomplished, too, though it isn't clear the ACA deserves the credit. The latest evidence is a bunch of new survey data on the newly insured; Larry Levitt summarizes it here. In short, after years of people losing insurance, there’s been a dramatic increase in the number of insured. Yes, there are still plenty of arguments about whether Obamacare is a bit behind or a bit ahead of its targets (these are statistical studies, and the evidence is far from clear when it comes to specific numbers). And, yes, we’re only one year into full implementation, and there’s plenty of uncertainty about how well the next phases will go. But the ACA essentially is doing what it was designed to do. On the question of costs, we know that something is changing for the good, and in a significant way. Compared with the coverage numbers, it’s a lot harder to pin down why medical inflation is way down: it could be the ACA, it could be technology, or the broader economy, or something else entirely. In any case, it’s hard to look at the numbers and determine that reform is causing problems. Meanwhile, it appears so far that those who have new insurance through expanded Medicaid or the exchanges like what they have. That shouldn’t be a surprise because the exchange plans aren't a radical departure from normal insurance -- except to those who bought scare stories that weren’t really based on much. Although it now appears that some scare stories may have backfired.
Why Obamacare Is Pushing Up Health Insurance Premiums - Now that Obamacare has been enacted, Americans across the nation are seeing their health insurance bills spiking, leading to what has been a documented slide in full-time hiring, a drop in consumer discretionary spending, not to mention stagnant and declining real wages. In short: a broad economic contraction (yes, yes, who could have possibly foreseen this). But how is it that insurers set their prices? As Bloomberg explains, insurers are calculating what to charge for health plans in 2015, which is no simple task. Actuaries can’t easily forecast how often the millions of new Obamacare enrollees will go to a doctor. New federal rules and expensive drugs will also increase costs. Wrong guesses could wipe out profits. Here is a quick and dirty way to understand why premiums are going up.
Proposal To Add Skimpier ‘Copper’ Plans To Marketplace Raises Concerns - Kaiser Health News: If you offer it, will they come? Insurers and some U.S. senators have proposed offering cheaper, skimpier "copper" plans on the health insurance marketplaces to encourage uninsured stragglers to buy. But consumer advocates and some policy experts say that focusing on reducing costs on the front end exposes consumers to unacceptably high out-of-pocket costs if they get sick. The trade-off, they say, may not be worth it. "It's a false promise of affordability," says Sabrina Corlette, project director at Georgetown University's Center on Health Insurance Reforms. "If you ever have to use the plan, you won't be able to afford it." Coverage on the health insurance marketplaces now is divided into five types of plans that require different levels of cost-sharing by consumers. All the plans cover 10 so-called essential health benefits, including hospitalization, drugs and doctor visits. Preventive care is covered without any cost-sharing. Platinum plans pay 90 percent of medical expenses, on average; gold plans, 80 percent; silver plans, 70 percent; and bronze plans, 60 percent. Premium tax credits are available for people with incomes up to 400 percent of the federal poverty level ($46,680 for an individual in the 2015 plans). In addition, a catastrophic plan is available, mainly to people younger than 30; it covers only limited services before the deductible is met and isn’t eligible for subsidies.
Race Is On to Profit From Rise of Urgent Care - — Start in Room 4, just beyond the reception area: A man is having blood drained from a bruised finger. Over in Room 1, a woman is being treated for eye trouble. Next door, in Room 2, a boy is having his throat swabbed. For more than eight hours a day, seven days a week, 52 weeks a year, an assortment of ailments is on display at the tidy medical clinic on Main Avenue here. But all of the patients have one thing in common: No one is being treated at a traditional doctor’s office or emergency room. Instead, they have turned to one of the fastest-growing segments of American health care: urgent care, a common category of walk-in clinics with uncommon interest from Wall Street. Once derided as “Doc in a Box” medicine, urgent care has mushroomed into an estimated $14.5 billion business, as investors try to profit from the shifting landscape in health care.But what is happening here is also playing out across the nation, as private equity investment firms, sensing opportunity, invest billions in urgent care and related businesses. Since 2008, these investors have sunk $2.3 billion into urgent care clinics. Commercial insurance companies, regional health systems and local hospitals are also looking to buy urgent care practices or form business relationships with them. The business model is simple: Treat many patients as quickly as possible. Urgent care is a low-margin, high-volume proposition. At PhysicianOne here, most people are in and out in about 30 minutes. The national average charge runs about $155 per patient visit. Do 30 or 35 exams a day, and the money starts to add up.
Hospitals Are Mining Patients' Credit Card Data to Predict Who Will Get Sick - Imagine getting a call from your doctor if you let your gym membership lapse, make a habit of buying candy bars at the checkout counter, or begin shopping at plus-size clothing stores. For patients of Carolinas HealthCare System, which operates the largest group of medical centers in North and South Carolina, such a day could be sooner than they think. Carolinas HealthCare, which runs more than 900 care centers, including hospitals, nursing homes, doctors’ offices, and surgical centers, has begun plugging consumer data on 2 million people into algorithms designed to identify high-risk patients so that doctors can intervene before they get sick. The company purchases the data from brokers who cull public records, store loyalty program transactions, and credit card purchases. Information on consumer spending can provide a more complete picture than the glimpse doctors get during an office visit or through lab results, says Michael Dulin, chief clinical officer for analytics and outcomes research at Carolinas HealthCare. The Charlotte-based hospital chain is placing its data into predictive models that give risk scores to patients. Within two years, Dulin plans to regularly distribute those scores to doctors and nurses who can then reach out to high-risk patients and suggest changes before they fall ill. “What we are looking to find are people before they end up in trouble,” says Dulin, who is a practicing physician.
Rapid Price Increases for Some Generic Drugs Catch Users by Surprise --The first sign of trouble came when Dr. Barry Lindenberg, a cardiologist, received a three-page insurance form in January, demanding he get preapproval to prescribe one of the oldest known heart medicines. His patient had been on the drug, digoxin, for many years. A mainstay of treating older patients with rapid rhythm disturbances, it was first described in the medical literature in 1785. Millions of Americans still use it every day, and many had long paid just pennies a pill. What the cardiologist did not know then was that the price of generic digoxin was rapidly rising. The three companies selling the drug in the United States had increased the price they charge pharmacies, at least nearly doubling it since late last year, according to EvaluatePharma, a London-based consulting firm. For patients, that meant the prices at pharmacies often tripled from last October to this June, according to Doug Hirsch, chief executive of GoodRx.com, a website that tracks drug pricing to help consumers find good deals. And while the average price tag at the pharmacy for a month of digoxin this year is still relatively cheap, about $50, he said, some patients are now encountering costs of more than $1,000. That can translate into co-pays of hundreds of dollars. No wonder, Dr. Lindenberg said, that he began hearing from patients requesting a drug change because they could not afford digoxin. He noted that one patient did not fill her prescription because it would have cost her $1.60 per pill, and that she ended up in intensive care.
Ritalin May Be Sabotaging Your Kids -- In a recent study, we and our colleague Lauren Jones examined the short- and long-term effectiveness of stimulants such as Ritalin in children. We looked at a sample of 8,643 Canadian children (1,654 of them in Quebec) before and after the 1997 expansion of drug insurance in Quebec, which made prescriptions more affordable. Within a decade of this expansion, 9 percent of children in Quebec were using stimulants, compared with 5 percent in the rest of Canada. By 2007, 44 percent of Canada’s ADHD prescriptions were being written in Quebec, which has a little more than 20 percent of Canada’s population. One might have anticipated that easier access to medication would lead to improved health and, ideally, better educational performance. Instead, we found evidence that the children using stimulants fared slightly worse. After the insurance expansion, the Quebec children experienced more depression and anxiety -- problems that could be side effects of stimulant medication. Meanwhile, there was little evidence of any benefits for the children's schooling. On the contrary, we found their chances of progressing through school without repeating a grade to be somewhat lower than they had been before the insurance expansion and lower than those of children in the rest of Canada. Their probability of high school graduation likewise declined a bit.
Parents can get refunds for some anti-depressant drugs given to kids -- Thousands of Missouri parents are entitled to refunds for antidepressants prescribed to children because the drugs were unapproved for use in that age group, a federal judge has ruled. Forest Laboratories and its subsidiary Forest Pharmaceuticals, which is based in Earth City, agreed to pay up to $10.4 million in refunds for misleading parents into giving the drugs Celexa and Lexapro to children and teenagers, according to a recent settlement of a class action lawsuit. A judge in the case ruled that under the Missouri Merchandising Practices Act, “parents have the right to be fully informed about the potential efficacy of a drug,” said Brent Wisner, a Los Angeles-based attorney for the plaintiffs. Anyone who bought Celexa for someone under 18 from 1998 to 2013 or Lexapro from 2002 to 2013 is eligible for partial to full refunds, or $50 if the total amount spent on the drugs cannot be proven. Several psychiatrists also said they were misled by the company. In his expert testimony in the case, Dr. Joseph Glenmullen of Harvard Medical School said, “Forest misrepresented both the efficacy and safety of Celexa and Lexapro use in children and adolescents, misled physicians and deprived patients of the benefit of their health care providers’ independent professional judgment.”
Smartphone dependency fuels other addictions, say rehab clinics -- Mobile devices help provide the three A’s — accessibility, affordability and anonymity, says Robert Weiss, senior vice president of clinical development for Elements , a national behavioral health company. “In 1988, you had to drive to an icky place for pornography and hope that nobody saw you,” he says. “Now, you just say, ‘Siri, show me the porn.’” Drug dealers will know an online message — “I’m in Newport Beach looking for tar or 420” — refers to black tar heroin and cannabis, Edwards adds, but those code words for drugs will go over the heads of most people. “Even a drug dealer has to take a nap occasionally, but it’s easy for people to connect with others to support that addiction,” he says. Smartphones are also playing a central role in behavioral addictions like gaming, social networking, pornography and sex, says Hilarie Cash, co-founder of Restart Life , a recovery retreat center in Fall City, Wash. Restart Life treats males over 18 years of age and provides a retreat away from digital media for 35 to 90 days, helping them improve their social skills. About 95% of the addictions Restart Life deals with relate to gaming, Cash says, but there are often other issues like pornography and social networking mixed in. “With a smartphone you can do that all the time,” she says. Weiss agrees. “The last cultural revolution took place on the streets,” he says, “but this one is a lot quieter.”
C.D.C. Closes Anthrax and Flu Labs After Accidents - NYTimes.com: After potentially serious back-to-back laboratory accidents, federal health officials announced Friday that they had temporarily closed the flu and anthrax laboratories at the Centers for Disease Control and Prevention in Atlanta and halted shipments of all infectious agents from the agency’s highest-security labs.The accidents, and the C.D.C.’s emphatic response to them, could have important consequences for the many laboratories that store high-risk agents and the few that, even more controversially, specialize in making them more dangerous for research purposes.If the C.D.C. — which the agency’s director, Dr. Thomas Frieden, called “the reference laboratory to the world” — had multiple accidents that could, in theory, have killed both staff members and people outside, there will undoubtedly be calls for stricter controls on other university, military and private laboratories. In one episode last month, at least 62 C.D.C. employees may have been exposed to live anthrax bacteria after potentially infectious samples were sent to laboratories unequipped to handle them. Employees not wearing protective gear worked with bacteria that were supposed to have been killed but may not have been. All were offered a vaccine and antibiotics, and the agency said it believed no one was in danger.In a second accident, disclosed Friday, a C.D.C. lab accidentally contaminated a relatively benign flu sample with a dangerous H5N1 bird flu strain that has killed 386 people since 2003. Fortunately, a United States Agriculture Department laboratory realized that the strain was more dangerous than expected and alerted the C.D.C.
Indiana storing blood & DNA of 2 million children without parent - As word of an Eyewitness News investigation spreads through Holliday Park, parents admit they are surprised. "You're kidding, right? I had no idea," said Ramon Moore, playing catch with his 7-year-old son, Xavier. "I didn't know that at all," agreed Holly Ruth, holding her 3-month old son, Lincoln. "Nobody ever told me," echoed Mallory Ervin, chasing her 4-year-old son, Theo, on the playground. Xavier, Lincoln, Theo and millions of other Indiana children all have something in common: the state of Indiana is storing their blood and DNA in an undisclosed state warehouse. "I'm curious why they didn't share that," said Ervin. "It now makes me think ‘what are they hiding?' As a parent, I'd absolutely like to know." 13 Investigates has discovered the Indiana State Department of Health is holding the blood samples of more than 2.25 million Hoosier children – without their parents' permission. If your children were born in Indiana since 1991, chances are their blood and DNA is among the state's massive collection.
Our future: Everything in modulation - In a recent post, I documented the desperate -- even ruthless -- effort to gain acceptance of vagus nerve stimulation for the treatment of depression. The medical-device industry is investing millions in order to reap billions in the burgeoning field of neuromodulation. But if you're not depressed: "Don't worry. Be happy!" Before long, they'll be peddling something that may change your life, too. Your brain is their playground. But the more you know about the industry, the more uneasy you'll feel about them messing with your mind. What's even scarier, is that now the military is involved. The Defense Advanced Research Projects Agency, or DARPA, is launching a $70 million program to study how electrodes implanted in our troops' brains might improve their moods and their ability to tolerate traumatic events, and allay their anxiety about what they're doing. Does that sound like a good thing to you?
This Breed of Mosquito Is Invading the U.S. — And It Could Carry a Terrifying Disease -- Chikungunya fever and the Asian tiger mosquito: two names you may not know, but which could soon threaten your health. In Swahili, “chikungunya” it means “walking bent over,” referring to the fact that those who contract the disease often have trouble walking due to headaches, rashes, fevers and, most of all, paralyzing joint pain. Before late last year, the disease was concentrated in Africa and Asia, but now it threatens American shores as a mosquito that carries it, the Asian tiger mosquito, is expanding as far north as New York and Chicago. There is no cure for the disease, according to the Centers for Disease Control, and while cases are rarely fatal, thousands have contracted the disease and a few have died since the first locally-acquired case popped up in the Caribbean in December 2013.
Tiny Flying Robots Are Being Built To Pollinate Crops Instead Of Real Bees --Honeybees, which pollinate nearly one-third of the food we eat, have been dying at unprecedented rates because of a mysterious phenomenon known as colony collapse disorder (CCD). The situation is so dire that in late June the White House gave a new task force just 180 days to devise a coping strategy to protect bees and other pollinators. The crisis is generally attributed to a mixture of disease, parasites, and pesticides. Other scientists are pursuing a different tack: replacing bees. While there's no perfect solution, modern technology offers hope. Last year, Harvard University researchers led by engineering professor Robert Wood introduced the first RoboBees, bee-size robots with the ability to lift off the ground and hover midair when tethered to a power supply. The details were published in the journal Science. A coauthor of that report, Harvard graduate student and mechanical engineer Kevin Ma, tells Business Insider that the team is "on the eve of the next big development." It had previously been impossible to pack all the things needed to make a robot fly onto such a small structure and keep it lightweight. The researchers believe that as soon as 10 years from now these RoboBees could artificially pollinate a field of crops, a critical development if the commercial pollination industry cannot recover from severe yearly losses over the past decade.
Approval of Bee-Killing Pesticides Challenged in Court -- Environmental and food safety groups yesterday challenged California’s illegal practice of approving new agricultural uses for neonicotinoid pesticides despite mounting evidence that the pesticides are devastating honey bees.Pesticide Action Network, Center for Food Safety and Beyond Pesticides, represented by Earthjustice, filed the legal challenge in the California Superior Court for the County of Alameda, urging the California Department of Pesticide Regulation (DPR) to stop approving neonicotinoid pesticides pending its completion of a comprehensive scientific review of impacts to honeybees. The DPR began its scientific review in early 2009 after it received evidence that neonicotinoids are killing bees, but five years later, the DPR has yet to take meaningful action to protect bees.
Pesticide Linked to Bee Declines May Also Be Killing Birds -- A widely used agricultural pesticide linked to bee declines may also be harmful to birds, according to a new study. The study found population declines across 14 species of birds. The insecticides, called neonicotinoids, are so popular among farmers that they’re the fastest growing class of pesticides, according to National Geographic. Rather than a spray that coats the plants, neonicotinoids are loaded right into the seeds, incorporating the bug-killing poison into every part of the plant. [Which means we can't wash them off our food.] Since their introduction in the 1990s, Wired reports, studies have shown that they’re killing not just the agricultural pests they’re designed to target, but also beneficial pollinators like honeybees, and even wild bees and butterflies. Now, a group of scientists studying bird populations in the Netherlands have linked high levels of the most common neonicotinoid in water to declining populations of birds that eat insects, according to Wired. “These insecticides appear to be having more profound effects than just killing our pollinating insects,” The study looked at 15 species of birds, according to an editorial published in Nature, which also published the new research. Nine of the species exclusively eat insects, and all feed insects to chicks. If the pesticides are leeching into soil and water, according to Nature, aquatic insects, caterpillars, beetles and grasshoppers could be dying off, meaning less food for the birds. Eating poisoned seeds could also contribute to the decline, according to National Geographic
Salvadoran Farmers Successfully Oppose the Use of Monsanto Seeds - Farmers across El Salvador united to block a stipulation in a US aid package to their country that would have indirectly required the purchase of Monsanto genetically modified (GM) seeds. Thousands of farmers, like 45-year-old farmer Juan Joaquin Luna Vides, prefer to source their seeds locally, and not to use Monsanto's GM seeds. "Transnational companies have been known to provide expired seeds that they weren’t able to distribute elsewhere," "We would like the US embassy and the misinformed media outlets [that are pressuring the Salvadoran government to change their procurement procedure] to know more about the reality of national producers and recognize the food sovereignty of the country," he added. During the last two months, the US government has been attempting to pressure the government of El Salvador to sign the second Millennium Challenge Compact with the Millennium Challenge Corporation (MCC), a US foreign aid agency created during the presidency of George W. Bush. The signing agreement was allegedly based upon the condition that El Salvador purchases GM seeds from Monsanto in conjunction with the Millennium Challenge Compact.
The People of Malawi Oppose Monsanto’s Cotton Scam --In Malawi a coalition of farmer, public health, religious, and citizen organizations is opposing the pending commercialization of Monsanto’s Bollgard II Bt cotton. The historical record on Bt cotton is conclusive – except where supported with massive, expensive artificial irrigation, synthetic fertilizer, and after the first few years increased pesticides, Bt cotton is economically unviable and destroys the farmers who try to grow it, driving them off their land, into shantytowns, or as in India to mass suicide. In Africa this record has been classically borne out in the experience of South Africa. Here Bt cotton was briefly toasted in the Western media, even as its record on the ground quickly proved a complete disaster. Within a few years the product almost ceased to be grown. South Africa provides perhaps the best example of Bt cotton as more of a media hoax than anything else. Only government bailouts and other subsidies have kept it in the field in the US, Australia, and India.
There’s No Debate: GMOs Are Nothing But A Corporate Poison Regime - As Beyond Pesticides points out in its brief opposing the application to the EPA from Texas cotton contractors for an “emergency” deregulation of the extremely toxic herbicide propazine, there’s no legitimate emergency here at all. On the contrary, the superweeds which are crippling industrial cotton production over large and increasing parts of the US were anticipated many years ago, and corporate agriculture made the conscious policy choice to embark upon a campaign guaranteed to bring this result. So how can the premeditated result now be called an “emergency”? The answer, of course, is that this is typical disaster capitalism propaganda meant to justify the increased use of poisons whose use was previously restricted on the grounds of their proven health hazards. The Roundup Ready GMO system, these days called the “first generation” of herbicide resistant GMOs, was originally touted with the promise that by relying on the allegedly less toxic glyphosate (also a lie) it would once and for all render more toxic herbicides obsolete. This marketing theme seemingly confirmed earlier bans and restrictions on various poisons, enacted during the period of the public’s maximum concern with environmental problems. Today we have the long anticipated collapse of the Roundup Ready regime and subsequent propaganda campaign on behalf of “second generation” GMOs resistant to 2,4-D, dicamba, and other poisons which are the exact herbicides Roundup Ready originally promised to render obsolete once and for all. With this we can see how the whole arc of GMO propaganda was a maneuver to not only sell vastly more glyphosate but to rehabilitate all the “restricted” poisons and render the old environmental concept of restrictions as such obsolete. This attempt at the rehabilitation of propazine is an example of this.
Excess water demand in California - WSJ reports: About 60 California cities and agencies have imposed mandatory water-use cutbacks, some as high as 50%. In many cases, the rules are enforced by charging higher fees for excess usage. In others, inspectors are deployed to crack down on scofflaws. . . . Among the most aggressively monitored locales is the state capital, Sacramento. . . . This year, the city cut outdoor watering to two days a week from three. Because only about half its homes have water meters to measure use, Sacramento must rely on inspectors to help enforce the rules. A team of 40 inspectors working for the city's Department of Utilities investigate complaints. Sacramento, a city of 475,000, had received 7,604 water-use complaints as of June 18, said city spokeswoman Jessica Hess. The city and other water districts, meanwhile, are offering carrots along with sticks, paying residents to replace their turf lawns with drought-resistant vegetation. The state of California does not have enough water to meet demand. One way they could eliminate excess demand is to raise water prices. If there are externality issues, stick a tax on it. This isn't so different from "charging higher fees for excess usage." But for the most part, municipalities have instead opted for the hodge podge of costly and overlapping remedies described above. Sometimes prices are actually raised, but the timing screws up the incentives. A lot of people seem pretty upset by the restrictions--one wonders if they'd be willing to pay more if they could have more water. The guy with the landscaping business is a pretty good example of Bastiat's "unseen" costs of policy.
When the Well Runs Dry, Try Dry Farming - A report released in May by the Center for Watershed Sciences at the University of California in Davis projects a nearly $2 billion loss to the agricultural economy in 2014 as a result of drought. The report goes on to say that in California’s Central Valley — often referred to as America’s fruit and vegetable basket — 410,000 acres may go unplanted for lack of water, leaving 14,500 farm workers without fields to tend. The Sierra Nevada snowpack, which supplies drinking water to much of the state, reached only 32 percent of its average annual depth this winter and as of June 15th the 12 biggest reservoirs in the state were averaging 49 percent of their capacity. The swirling red, orange and crimson colors covering California on the U.S. Drought Monitor’s online map make it obvious just how severe the situation is. All eyes are on California’s farmers, as agriculture accounts for 80 percent of water use in the state. Drip irrigation, satellite-controlled sprinkler systems and genetically engineered drought tolerance are a few of the tools employed in the war on excessive water use, but others see simpler solutions. One such approach — the traditional practice of dry farming — is surprisingly absent from the conversations about California’s epic drought, but offers a refreshing answer to the quandary of agricultural production in an arid landscape. Santa Rosa, the biggest city in California’s wine country, receives an average of 36 inches each year, seemingly on par. However, it’s the seasonal distribution that matters to farmers: Santa Rosa averages less than an inch of rainfall between June and September, while Philly is bathed in over 15 inches of summer showers, the time when crops actually need the water. In California, rain comes all at once; often just a few massive winter storms account for the majority of rainfall, long before the planting season begins. Dry farmers learn to capture the stormwater before it runs into the rivers and out to sea. They trap it in their soil and pray that it will remain long enough to get their crops through the season.
Nearly 80% of California now under ‘extreme’ drought conditions -- Harsh, dry conditions continue to expostulate some-more of California into a top probable difficulty of drought, a National Weather Service announced Thursday. Nearly 80% of a state was underneath “extreme” drought conditions in June, according to a latest U.S. Drought Monitor map. Within that area, a volume deliberate to be in a top difficulty of drought — “exceptional” — grew from 33% in May to 36%. Exceptionally dry conditions already impact pockets of Northern California, all of Central California and coastal communities, though have now extended to Ventura and Los Angeles counties, and many of Orange County, experts say. In April, a whole state was deliberate to be in serious drought for a initial time in 15 years. A vast apportionment of Northern California is intensely dry, formulating conditions unknown to firefighters who are struggling to conflict a 4,300-acre fire in Napa County. About 21% of California’s southeast counties are confronting serious drought conditions.
Parched California proposes steep fines for over-watering lawns (Reuters) - Regulators in drought-stricken California are proposing stringent new conservation measures to limit outdoor water use, including fines of up to $500 a day for using a hose without a shut-off nozzle. The most populous U.S. state is suffering its third year of drought and in January Governor Jerry Brown declared a drought emergency, allowing the state to request federal aid. In some cities and towns about half the water residents use is for lawns and cleaning cars, according to the State Water Resources Control Board, which made the proposal public on Tuesday. Voluntary measures do not go far enough, it said. true "It's not meant to spank people, it's meant to make people aware and say, 'This is serious; conserve'," said agency spokesman Timothy Moran, noting that the rules authorize local law enforcement agencies to write tickets imposing fines. The new restrictions prohibit watering gardens enough to cause visible runoff onto roads or walkways, using water on driveways or asphalt, and in non-recirculating fountains. Urban water agencies would be subject to daily fines of up to $10,000 for not implementing water-shortage contingency plans, which restrict how many days a week residents can engage in outdoor watering, among other limits on their customers.
Lake Mead, Nation’s Largest Reservoir, To Reach Record Low This Week - The last time Lake Mead, the largest reservoir in the United States, reached maximum capacity was 1983. This week the lake, located along the Colorado River near Las Vegas, Nevada, is expected to reach a new milestone — its lowest point ever. Formed by the Hoover Dam, Lake Mead has been suffering for years as an expansive drought across the West, coupled with rising temperatures and populations, has overstressed the massive man-made body of water. According to forecasts from the federal Bureau of Reclamation, water levels will fall this week to their lowest since it was first filled in 1937. The lake, which provides water for 20 million people across the Southwest has been losing water for over a decade and is currently at about 40 percent capacity. Christie Vanover with the Lake Mead National Recreation Area confirmed with ThinkProgress that the lake is projected to drop below the record low of 1081.82 feet this week, probably on Wednesday. She said the lake will be extending boat ramps to reach the lower levels. The Bureau of Reclamation published a projection in June showing Lake Mead’s water level falling to 1,064 feet by May 2016. Nearby Las Vegas gets 90 percent of its water from the lake. With one of the city’s two intake pipes at risk of being exposed, the city is hard at work drilling an expensive three-mile-long tunnel to access deeper reserves. Bronson Mack with the Las Vegas Valley Water District told ThinkProgress that the third intake tunnel is about 70 percent complete and will be completed sometime next year.
America’s Largest Reservoir Drains to Record Low As Western Drought Deepens - Lake Mead—America’s largest reservoir, Las Vegas’ main water source and an important indicator for water supplies in the Southwest—will fall this week to its lowest level since 1937 when the manmade lake was first being filled, according to forecasts from the federal Bureau of Reclamation. The record-setting low water mark—a surface elevation of 1,081.8 feet above sea level—will not trigger any restrictions for the seven states in the Colorado River Basin. Restrictions will most likely come in 2016 when the lake is projected to drop below 1,075 feet, a threshold that forces cuts in water deliveries to Arizona and Nevada, states at the head of the line for rationing. But the steadily draining lake does signal an era of new risks and urgency for an iconic and ebbing watershed that provides up to 40 million people in the U.S. and Mexico with a portion of their drinking water. The rules governing the river are complex, but the risk equation is straightforward: less supply due to a changing climate, plus increasing demands from new development, leads to greater odds of shortages.No area is more vulnerable than Las Vegas, which draws 90 percent of its water from Lake Mead. Today, in the midst of the basin’s driest 14-year period in the historical record, the gambler’s paradise is completing an expensive triage. The regional water authority is spending at least $US 829 million of ratepayer money to dig two tunnels—one at the lake bottom that will be completed next spring and the other an emergency connection between existing intakes—to ensure that the 2 million residents of southern Nevada can still drink from Mead as more of the big lake reverts to desert. Yet despite a shrinking lake, diminishing supplies and ardent pleas from tour guides and environmental groups to preserve a canyon-cutting marvel, the four states in the basin upriver from Lake Mead intend to increase the amount of water they take out of the Colorado River. All of the states are updating or developing new state water strategies, most of which involve using more Colorado River water, not less.
Drought Drains Lake Mead to Lowest Level as Nevada Senator Calls for Government Audit -- As the largest reservoir in the U.S. falls to its lowest water level in history, Nevada State Sen. Tick Segerblom introduced a bill title and issued a press release on July 8 calling for an “independent scientific and economic audit of the Bureau of Reclamation’s strategies for Colorado River management.” Sen. Segerblom’s position represents the growing political impatience with the current management system for the river. He takes hard aim at the Bureau of Reclamation as being responsible for these problems as he says, “Reclamation may have played a major role in erecting our Colorado River infrastructure, but it’s clearly time for people across the basin to begin leading its future management.” Further, the Senator calls for a more environmentally minded management focus on the health of the river as stated in his press release: “Healthy rivers signal healthy societies, yet Reclamation failed to mention ecological issues in its recent analysis. The Colorado River is a river of national parks, but the river running through them is struggling.” This week’s history-making, bad-news event at Lake Mead has already triggered lots of news stories, but almost all of these stories focus on the water supply for Las Vegas, Phoenix and California. But what about the health of the river itself? Senator Segerblom’s press release reminds us that this river is more than just water supply for cities and farms—it’s a living entity full of species that depend on the river for survival, and as the lake level falls, the first entity to feel even more pain won’t be Las Vegas or Phoenix but rather the river itself. Let’s take a look at the environmental problems with the Colorado River and how they are getting worse. Grab a cup of coffee because this is a buzzkill:
Las Vegas Is More "Screwed"; Drought Drains Lake Mead To Lowest Since Hoover Dam Built - Two weeks ago we highlighted just how "screwed" Las Vegas is due to the catastrophic drought that is occurring (combined with almost total ignorance that this is a problem). As Bloomberg's James Nash reports, about 55% of Nevada, already the nation’s driest state, is under “extreme’’ or “exceptional’’ drought conditions, the worst grades on the U.S. Drought Monitor; but recently the situation has got even worse. Lake Mead, the man-made reservoir that supplies 90 percent of the water for 2 million people in the Las Vegas area, has been reduced by drought to the lowest level since it was filled in 1937, according to the federal government who explained "It concerns us all very much," as it is a resource used by 3 states. Simply put, The shortfall is endangering water supplies to the residents and 43 million annual visitors to the driest metropolitan area in the country.
Who Stole the Water?: It's been a long, dry haul in the southeast quadrant of the state. The majority of Texas has been in a record-busting drought for most of a decade, and the last three years have been especially thirsty ones for communities on the Colorado River. Not to be confused with the other Colorado – which, in wet years, runs from the Rockies to Mexico and irrigates farms and cities in seven states – this one is the largest body of water that begins and ends in a single state. The river and man-made lakes created to store its volume are all in desperate shape. From its source in Dawson County, just south of Lubbock, through its southeast meander to the Gulf of Mexico, you can park your car and walk across streams that once would have swept you to the sea. Drained by demand from boom-town cities in the power corridor of central Texas and by a run of relentless heat that cut its inflow and hiked up rates of evaporation, the Colorado is under existential stress, and much more pain is in the forecast. Every reputable climatologist, including the state appointee, is predicting another decade of recurring drought and steady upticks in heat. That's hard news for all the many life-forms that drink, swim, and make their living from this river. But it may soon prove a blessing for one rare species: private-equity firms, called "water marketers," which stand ready to reap huge profits from disaster.
‘Water war’ threatens Syria lifeline -- When severe water cuts began to hit Aleppo province in early May, residents started referring to a "water war" being waged at the expense of civilians. Images of beleaguered women and children drinking from open channels and carrying jerry cans of untreated groundwater only confirmed that the suffering across northern Syria had taken a turn for the worse. However, lost in the daily reports was a far more pernicious crisis coming to a head: a record six-metre drop in Lake Assad, the reservoir of Syria's largest hydroelectric dam and the main source of water for drinking and irrigation to about five million people. Under the watch of the Islamic State group - formerly known as the Islamic State of Iraq and the Levant (ISIL) - levels in Lake Assad have dropped so low that pumps used to funnel water east and west are either entirely out of commission or functioning at significantly reduced levels. The shortages compel residents in Aleppo and Al Raqqa to draw water from unreliable sources, which can pose serious health risks. The primary reason behind the drop appears to be a dramatic spike in electricity generation at the Euphrates Dam in al-Tabqa, which has been forced to work at alarmingly high rates."[Lake Assad] is pumping out more than it is receiving. This is because the electricity generators are working 24 hours a day, more than they should be,"
El Niño in 2014: Still On the Way? - Key Points:
- Development of El Niño in 2014 continues to edge closer with sea surface temperatures (SST) in the key indicator equatorial regions approaching El Niño thresholds.
- The discharge of ocean heat to the atmosphere associated with the build-up of the El Niño phenomenon has predictably seen a rise in global surface temperatures, resulting in May 2014 being the warmest May ever recorded.
- Despite the strong initial build-up of a large warm water volume anomaly (WWV) in the equatorial subsurface ocean earlier in the year, the atmosphere has so far not provided sufficient reinforcement to maintain this large pool of warmer-than-average water and a substantial portion has been eroded.
- The last half-century of observations, however, still favour the development of an extreme El Niño event, but the substantial reduction of the warm water volume anomaly (thankfully) diminishes the odds of a powerful event rivaling that of 1997-1998 from taking hold.
Weather patterns falling in line with El Nino forecast - ABC Rural -- More weather patterns are emerging to reinforce the Bureau of Meteorology's prediction of at least a 70 per cent chance of an El Nino weather pattern developing in Spring 2014. The tropical Pacific Ocean temperatures have warmed to levels associated with a weak El Nino and the Southern Oscillation Index has dropped by more than 10 points. However the atmospheric patterns are still neutral and the water below the ocean surface has cooled. Bureau of Meteorology senior climate liaison officer, Jeff Sabburg, says the El Nino is not here yet because these atmospheric patterns and the ocean patterns have not yet coupled. "We have to have three or four criteria to be satisfied and as far as the Southern Oscillation Index (SOI) the two month average SOI has to be minus seven or lower but if something else like the sea surface temperatures in the tropical Pacific were to go out we may not still be in an El Nino so the point being that both the atmosphere and the ocean have to be coupled,"Mr Sabburg said. For Australia, El Nino weather patterns are often associated with below-average rainfall over southern and eastern inland areas and above-average daytime temperatures over southern parts of the continent. Of the last 26 El Nino's that have occurred in Australia, 17 have translated into an increased risk of drought, which Mr Sabburg says means 35 per cent of the time Australia hasn't gone into drought.
Miami, the great world city, is drowning while the powers that be look away - A drive through the sticky Florida heat into Alton Road in Miami Beach can be an unexpectedly awkward business. Most of the boulevard, which runs north through the heart of the resort's most opulent palm-fringed real estate, has been reduced to a single lane that is hemmed in by bollards, road-closed signs, diggers, trucks, workmen, stacks of giant concrete cylinders and mounds of grey, foul-smelling earth. It is an unedifying experience but an illuminating one – for this once glamorous thoroughfare, a few blocks from Miami Beach's art deco waterfront and its white beaches, has taken on an unexpected role. It now lies on the front line of America's battle against climate change and the rise in sea levels that it has triggered. "Climate change is no longer viewed as a future threat round here," "It is something that we are having to deal with today."Every year, with the coming of high spring and autumn tides, the sea surges up the Florida coast and hits the west side of Miami Beach, which lies on a long, thin island that runs north and south across the water from the city of Miami. The problem is particularly severe in autumn when winds often reach hurricane levels. Tidal surges are turned into walls of seawater that batter Miami Beach's west coast and sweep into the resort's storm drains, reversing the flow of water that normally comes down from the streets above. Instead seawater floods up into the gutters of Alton Road, the first main thoroughfare on the western side of Miami Beach, and pours into the street. Then the water surges across the rest of the island. The effect is calamitous. Shops and houses are inundated; city life is paralysed; cars are ruined by the corrosive seawater that immerses them.
Prius-Driving Wussies At EPA Say Rollin’ Coal Illegal; Jackbooted Thugs Coming For Yer TruckNutz - We told you a while back about the phenomenon of “rollin’ coal,” whereby Manly Men modify the fuel systems of their big diesel trucks to deliberately dump excess fuel into their engines, creating thick black smoke and proclaiming their freedom from clean air and other despicable liberal plots. It’s especially hilarious when they blow smoke on a Prius driver or a bicyclist, ideally one with asthma. You get the sense that if they could find an emphysema patient on oxygen to roll coal on, they might just ejaculate in their pants. It’s technological assholery as political statement, the closest these motorheads can get to actually taking a shit on the environmentalists (and the “environment,” which isn’t even a real thing) they hate so much. Oh, and incidentally, the Environmental Protection Agency clarified Monday that rollin’ coal is unquestionably illegal. But what would you expect from a bunch of wimpy poindexters who think the environment needs protecting? The nice folks at Talking Points Memo asked the actual press secretary for the EPA, Liz Purchia, to comment on the trend of rollin’ coal. At some point after her eyes finally stopped their own rolling, Purchia said, “the short answer is this is illegal.” And then, just like a terrible freedom-hating bureaucrat, she directed them to the EPA’s website: It is a violation of the [Clean Air Act] to manufacture, sell, or install a part for a motor vehicle that bypasses, defeats, or renders inoperative any emission control device.
When Beliefs and Facts Collide : Do Americans understand the scientific consensus about issues like climate change and evolution?At least for a substantial portion of the public, it seems like the answer is no. The Pew Research Center, for instance, found that 33 percent of the public believes “Humans and other living things have existed in their present form since the beginning of time” and 26 percent think there is not “solid evidence that the average temperature on Earth has been getting warmer over the past few decades.” Unsurprisingly, beliefs on both topics are divided along religious and partisan lines. For instance, 46 percent of Republicans said there is not solid evidence of global warming, compared with 11 percent of Democrats. As a result of surveys like these, scientists and advocates have concluded that many people are not aware of the evidence on these issues and need to be provided with correct information. That’s the impulse behind efforts like the campaign to publicize the fact that 97 percent of climate scientists believe human activities are causing global warming. In a new study, a Yale Law School professor, Dan Kahan, finds that the divide over belief in evolution between more and less religious people is wider among people who otherwise show familiarity with math and science, which suggests that the problem isn’t a lack of information. When he instead tested whether respondents knew the theory of evolution, omitting mention of belief, there was virtually no difference between more and less religious people with high scientific familiarity. In other words, religious people knew the science; they just weren’t willing to say that they believed in it.
Global Warming and the Which Way Is Up Problem in Economic Print -- It is painful to read Eduardo Porter's column on the prospects for slowing global warming and China's greenhouse gas emissions. It's not that Porter got anything in particular wrong; he is presenting standard projections that are the basis for international negotiations. Rather it is the framing of the trade-offs that is painful. Porter poses the question of the extent to which China should be willing to slow its economic growth to curb its greenhouse gas emissions, as opposed to rich countries like the United States bearing more of the burden. The reason this is painful is that most folks might recall that our major economic problem at the moment is secular stagnation. In case people forgot, this is a problem of inadequate demand. The story is that we don't have enough demand for goods and services to keep our workforce fully employed. As a result we have tens of millions who are unemployed, underemployed, or who have given up looking for work altogether. This is not just a U.S. problem but one that afflicts much of the world. The problem of global warming is one that needs lot of work. We need people to retrofit our buildings to make them more energy efficient, to put up solar panels and wind turbines to get clean energy. How about paying people to drive free buses so that commuters have more incentive to leave their cars at home? We need to build smart grids to minimize energy wastage. The list is really long.
The Economics of Global Warming - Those who don’t outright deny the existence of human-caused global warming often argue we can’t or shouldn’t do anything about it because it would be too costly. Take Prime Minister Stephen Harper, who recently said, “No matter what they say, no country is going to take actions that are going to deliberately destroy jobs and growth in their country.” But in failing to act on global warming, many leaders are putting jobs and economic prosperity at risk, according to recent studies. It’s suicidal, both economically and literally, to focus on the fossil fuel industry’s limited, short-term economic benefits at the expense of long-term prosperity, human health and the natural systems, plants and animals that make our well-being and survival possible. Those who refuse to take climate change seriously are subjecting us to enormous economic risks and foregoing the numerous benefits that solutions would bring. The World Bank—hardly a radical organization - is behind one study.. While still viewing the problem and solutions through the lens of outmoded economic thinking, its report demolishes arguments made by the likes of Stephen Harper. “Climate change poses a severe risk to global economic stability,” said World Bank Group president Jim Yong Kim in a news release, adding, “We believe it’s possible to reduce emissions and deliver jobs and economic opportunity, while also cutting health care and energy costs.” Risky Business, a report by prominent U.S. Republicans and Democrats, concludes, “The U.S. economy faces significant risks from unmitigated climate change,” especially in coastal regions and agricultural areas.
Blueprints for Taming the Climate Crisis - Here’s what your future will look like if we are to have a shot at preventing devastating climate change. Within about 15 years every new car sold in the United States will be electric. In fact, by midcentury more than half of the American economy will run on electricity. Up to 60 percent of power might come from nuclear sources. And coal’s footprint will shrink drastically, perhaps even disappear from the power supply. This course, created by a team of energy experts, was unveiled on Tuesday in a report for the United Nations that explores the technological paths available for the world’s 15 main economies to both maintain reasonable rates of growth and cut their carbon emissions enough by 2050 to prevent climatic havoc. It offers a sobering conclusion. We might be able to pull it off. But it will take an overhaul of the way we use energy, and a huge investment in the development and deployment of new energy technologies. Significantly, it calls for an entirely different approach to international diplomacy on the issue of how to combat climate change.
Excellent News! Whale Poop Could Save Us All From Global Warming, Maybe: According to new research from the University of Vermont, it all comes down to phytoplankton, which feed on, among other things, whale doots, and are terrifically efficient at absorbing carbon from the atmosphere, and are also the base of the oceanic food chain. More whales, more poop, more phytoplankton, healthier oceans, and more absorption of all the CO2 we’ve been pumping into the atmosphere. And while we’re at it, since whale carcasses are ecosystems in their own right, feeding bajillions of organisms that other fish also feed on, a recovery of whale populations would also help recovery of fishies what humans like to eat. Or to get all sciencey about it, U of Vermont conservation biologist Joe Roman, the lead researcher on the paper, explains that whales were once thought to be too few to affect the ocean biosphere much, but actually, “The decline in great whale numbers, estimated to be at least 66% and perhaps as high as 90%, has likely altered the structure and function of the oceans, but recovery is possible and in many cases is already underway.”
Climate skeptics are losing their grip - FT.com: We do not have a Chinese or an American atmosphere. We have a global atmosphere. We cannot run independent experiments upon it. We have instead been running a joint experiment. This was not a conscious decision: it happened as a result of the industrial revolution. But we are consciously deciding not to stop. Conducting irreversible experiments with the only planet we have is irresponsible. It would only be rational to refuse to do anything to mitigate the risks if we were certain the science of man-made climate change is bogus. Since it rests on well-established science, it would be ludicrous to claim any such certainty. On the contrary, any reasonably open-minded reader of the Summary for Policymakers from the Intergovernmental Panel on Climate Change would reach the conclusion that any such certainty on the science would be ludicrous. It is rational to ask if the benefits of mitigation outweigh the costs. It is irrational to deny the plausibility of man-made climate change. In these debates and indeed in climate policy, the US plays a pivotal role, for four reasons. First, the US is still the world’s second-largest emitter of carbon dioxide, though its 14 per cent share of the global total in 2012 puts it well behind China’s 27 per cent. Second, US emissions per head are roughly double those of leading western European economies or Japan. It would be impossible to persuade emerging economies to curb emissions significantly if the US were not to join in. Third, the US has unsurpassed scientific and technological resources, which will be sorely needed if the world is to tackle the challenge of combining low emissions with prosperity for all. Finally, the US is home to the largest number of passionate and committed opponents of action.
IPCC’s “Carbon Budget” Gives One-in-Three Chance of Failure - Gaius Publius - I recently made several points that need to be hammered over and over between now and the U.N. climate meeting in Paris in late 2015: The United Nations Climate Change Conference, COP21 or CMP11 will be held in Paris, France in 2015. This will be the 21st yearly session of the Conference of the Parties (COP 21) to the 1992 United Nations Framework Convention on Climate Change (UNFCCC) and the 11th session of the Meeting of the Parties (CMP 11) to the 1997 Kyoto Protocol. The conference objective is to achieve a legally binding and universal agreement on climate, from all the nations of the world. Leadership of the negotiations is yet to be determined.The purpose of the Paris meeting is to sign a binding agreement on carbon emissions. The purpose of the IPCC is to create a scientific framework for the discussions of the treaty-making FCCC.All of the talk in the lead-up to Paris will be about how much “burnable carbon” we can still emit. In other words, what’s our remaining “carbon budget”? Or more to the point, how much more money can Exxon make and still be one of the good guys? Built into those U.N. discussions are a couple of assumptions fostered by the IPCC:
- ▪ That 2°C global warming is a safe target.
- ▪ That doing what gives us a 66% chance of achieving the 2° warming target is a good enough.
- ▪ That Exxon, the Saudis, David Koch and others deserve to make some money from their buried assets.
You’ll hear about this endlessly in the next year or so. Now is the time to counter with the truth and tell it to everyone you know.
No False Choices: To Preserve A Livable Climate, We Need To Slash Both CO2 And Methane ASAP -- The bad news is that humanity has dawdled for so long that our only realistic chance to avoid multiple, irreversible, catastrophic climate impacts is to slash both carbon dioxide and the “super pollutants” like methane sharply starting as soon as possible. As Dr. Jeffrey Sachs, Director of Columbia’s Earth Institute, told MSNBC Tuesday: We’ve been told the basic falsehood that somehow fracking is going to save us, which is basically the opposite of the truth. What kind of good news can the world expect after ignoring near-unanimous expert advice for 25 years? Well, we can almost certainly avert the worst impacts for billions of people, but only by aggressively curtailing both CO2 (which lingers in the atmosphere for hundreds of years) and the super pollutants (which are much more potent at trapping heat in the short-term than CO2, but which have a much shorter atmospheric lifetime). Some confusion has been generated on this issue by a Tuesday New York Times piece, “Picking Lesser of Two Climate Evils,” which frames our optimum climate strategy as a choice between targeting CO2 and targeting super pollutants like methane, hydrofluorocarbons, and black carbon, that together cause some 40% of the warming we’re experiencing now. But that is a “false choice,” as longtime NASA climate scientist Drew Shindell explained to me. We have to do both to maximize lives saved and minimize the chances of dangerous warming. That’s a point Climate Progress has made consistently.
Overshoot Loop and Evolution - Ilargi: Today, when one observes the many severe environmental and social problems, it appears that we are rushing towards extinction and are powerless to stop it. Why can’t we save ourselves? To answer that question we only need to integrate three of the key influences on our behavior: biological evolution, overshoot, and a proposed fourth law of thermodynamics called the “Maximum Power Principle”(MPP). The MPP states that biological systems will organize to increase power[1] generation, by degrading more energy, whenever systemic constraints allow it[2].Biological evolution is a change in the properties of populations of organisms that transcend the lifetime of a single individual. Individual organisms do not evolve. The changes in populations that are considered evolutionary are those that are inheritable via the genetic (DNA/RNA) material from one generation to the next. Selection favors individuals who succeed at generating more power and reproducing more copies of themselves than their competitors. Energy is a key aspect of overshoot because available energy is always limited by the energy required to utilize it. Since natural selection occurs under thermodynamic laws, individual and group behaviors are biased by the MPP to generate maximum power, which requires over-reproduction and/or over-consumption of resources[3] whenever system constraints allow it. Overshoot eventually leads to decreasing power attainable for the group with lower-ranking members suffering first. Low-rank members will form subgroups and coalitions to demand a greater share of power from higher-ranking individuals who will resist by forming their own coalitions to maintain it. Meanwhile, social conflict will intensify as available power continues to fall. Eventually, members of the weakest group (high or low rank) are forced to “disperse.”[4] Those members of the weak group who do not disperse are killed,[5] enslaved, or in modern times imprisoned. By most estimates, 10 to 20 percent of Stone-Age people died at the hands of other humans. The process of overshoot, followed by forced dispersal, may be seen as a sort of repetitive pumping action—a collective behavioral loop—that drove humans into every inhabitable niche.
Towards an Energy Standard of ‘Local’ - For those of us interested in the intricacies of food systems, farmers’ markets are great places to test hypotheses. In The Energetics of Food Distribution I noted the comparative efficiencies associated with shipping larger quantities of food over longer distances. That post didn’t paint small-scale, localized food distribution in a very positive light, and after thinking about how best to characterize efficiency when comparing transport strategies over varying distances I thought it worthwhile to dedicate another post to the issue, this one informed by data collected from several local farmers. The graph below presents the fuel required to deliver 100 pounds of food for several small farms to my local farmers’ market relative to a semi truck transporting 40,000 pounds of food 3,000 miles to Vermont from the Central Valley of California. Recall that the semi truck in The Energetics of Food Distribution achieved the highest efficiency per unit food delivered for a set transport distance, but of course transport distance isn’t constant when comparing long distance shipments to local vendors. If transport distance shrinks enough, food distributed via less efficient means will end up using less fuel. For most of the vendors I surveyed – I collected information on the weight of food they brought to market, their round-trip travel distance and the fuel efficiency of their truck or van - the amount of fuel used per unit food delivered was lower than the semi from California, sometimes much lower.
Iran's Supreme Leader calls for more nuclear enrichment capacity (Reuters) - Supreme Leader Ayatollah Ali Khamenei said Iran would need to significantly increase its uranium enrichment capacity, highlighting a gap in positions between Tehran and world powers as they hold talks aimed at clinching a nuclear accord. Iran and six major powers - the United States, Russia, France, Germany, China and Britain - have less than two weeks to bridge wide differences on the future scope of Iran's enrichment programme and other issues if they are to meet a self-imposed July 20 deadline for a deal. They resumed talks in Vienna last week and their negotiators continued meetings in the Austrian capital on Tuesday, but there was no immediate sign of any substantive progress. French Foreign Minister Laurent Fabius said in Paris that none of the major outstanding issues had been agreed and that the United States wanted foreign ministers to join the negotiations. Iran's capacity to refine uranium lies at the centre of the nuclear stalemate and is seen as the hardest issue to resolve. Iran insists it needs to expand its capacity to refine uranium to fuel a planned network of atomic energy plants. The powers say Tehran must sharply reduce that capacity to prevent the country being able to quickly produce a nuclear bomb using uranium enriched to a far higher degree.
Fukushima radiation 'ice plan' failing to take hold --Japan's nuclear regulators call for TEPCO to find solution to thousands of tons of radioactive water. Japan's nuclear regulators have expressed alarm at the failure of a much-vaunted effort to freeze radioactive water that has built up beneath the Fukushima Dai-ichi nuclear plant, warning that the water could very easily escape into the nearby Pacific Ocean. Toyoshi Fuketa, the commissioner of the Nuclear Regulation Authority, has called on Tokyo Electric Power Co. to re-examine its plan to freeze around 11,000 thousand tons of contaminated radioactive water that is sloshing about in trenches dug around the reactor buildings. Two months after the work began, the water in the trenches is still not fully frozen and there is concern that it will gradually escape into the Pacific, which is just yards away.
WIPP Still Leaks -- Environmental radiation releases spiked again in mid-June around the surface site of the only U.S. underground, nuclear weapons waste storage facility near Carlsbad, New Mexico. The facility, the Waste Isolation Pilot Project (WIPP), has been shut down since February 14, when its isolation technology failed, releasing unsafe levels of Plutonium, Americium, and other radio-nuclides into the environment around the site. Radiation levels in the underground storage area, 2,150 feet below the surface vary from near-normal to potentially lethal. At the time of the February accident, more than 20 WIPP workers suffered low level radioactive contamination, even though none of them were underground. WIPP assumes, but cannot confirm, that underground conditions have not changed since May 31, when the last entry team went into the mine, as reported by WIPP field manager Jose Franco on June 5: In mid-March, WIPP suffered a surface radiation release almost twice the levels released in February. WIPP was designed to isolate highly radioactive nuclear weapons waste from the environment for 10,000 years. It went 15 years before its first leak of radioactivity into the above ground environment. Radiation levels in the storage area where the original leak occurred are possibly as lethal as Fukushima, hampering efforts to determine the source, cause, and scale of the February leak.
How Politicians Are Trying To Fund Overseas Coal Projects Under The Guise Of Eliminating Bureaucracy - Last December the Export-Import Bank, which helps finance foreign purchases of U.S. exports, announced it would stop financing coal-fired power plants abroad, with a few exceptions in the poorest countries in the world. Now, as political pressure puts the bank’s future in to question, those environmental guidelines are facing opposition in Congress. With a September 30 deadline for reauthorization, the efforts to reduce high carbon intensity projects are being used as political cover by far-right Republicans who have reversed course and decided to consider the bank as a form of corporate welfare after years of supporting it. Both of the working proposals in the House and Senate to renew the bank’s charter would reverse Ex-Im guidelines that prevent financing for overseas power plants, according to the Hill. Thousands of businesses use the bank for loans and insurance for exports. While the bank has been accused of pay-for-play politics and once funded failed energy giant Enron, the current movement is based around government overreach into the free market and is aligned with recent attacks on the EPA’s proposals to cut carbon pollution from fossil fuel-fired power plants. The 80-year-old bank borrows money from the U.S. Treasury to help American companies sell their exports abroad. It provides low-cost loans to foreign buyers as well as guarantees against potential losses for exporters. As part of the Obama Administration’s Climate Action Plan, the Ex-Im Bank board voted last December to stop funding the construction of new coal plants overseas. The bank has also funded a number of renewable energy projects, including U.S. solar-modules to Mexico, thin-film solar panels to India, and materials for solar projects in Spain and Africa.
Mountaintop Removal Coal Mining Decimates Fish Populations in Appalachia - A study from researchers at the U.S. Geological Survey (USGS) published this month provides strong new evidence that mountaintop removal coal mining in Appalachia is devastating downstream fish populations.That’s hardly news for long-time followers of the controversy surrounding mountaintop removal, a coal mining practice that involves blowing off the tops of mountains to access thin seams of coal and dumping the waste into valleys below. In 2010, a group of 13 prestigious biologists published a paper in Science, the nation’s premier scientific journal, that found:“Our analyses of current peer-reviewed studies and of new water-quality data from WV streams revealed serious environmental impacts that mitigation practices cannot successfully address… Clearly, current attempts to regulate [mountaintop removal mining] practices are inadequate.”The authors of the study published last week found a 50 percent decline in the number of fish species and a two-thirds decline in the total number of fish in streams below mountaintop removal mines in West Virginia’s Guyandotte River drainage. They made this important contribution to the science by using rigorous methodology to isolate several types of water pollution most likely to have caused these staggering declines.
Company That Caused Historic West Virginia Chemical Spill Fined $11k - The company responsible for letting 10,000 gallons of a mysterious chemical seep into West Virginia’s drinking water supply this past January was fined $11,000 by the U.S. Department of Labor on Monday, just two days before the six-month anniversary of the historic spill. After inspecting the facilities at Freedom Industries’ chemical storage site in Charleston, the Labor Department’s Occupational Safety and Health Administration (OSHA) found that, at the time of the spill, Freedom Industries’ chemical tanks containing crude MCHM had been surrounded by a wall that was not liquid tight. That violation that warranted a $7,000 fine. OSHA also hit Freedom Industries with an additional $4,000 fine for not having railings on an elevated platform used for loading and storing the chemical in the tanks. Both violations were labeled by OSHA as “serious,” warranting monetary penalties.
Less Than Tyrannical Feds Fine Freedom Industries Whopping $11,000 For Poisoning Water of 300,000 People, Because Freedom -- The over-reaching, over-regulating, money-grubbing feds of OSHA have fined Freedom Industries an exorbitant $11,000 for last January's massive spill of coal cleaning chemicals that left over 300,000 West Virginians without safe water, one in five people with reported health issues, and local businesses down an estimated $61 million. Yeah, that'll show 'em. Also, the "clean-up" site is still leaking - twice, last month - but Freedom officials say it's only because of "heavy rain" overflowing a trench whose design is "evolving" (they blamed the initial disaster on cold) and who could've predicted rain? Despite a fast-approaching deadline, only 78 families have filed legal claims against the company, perhaps because its murky leaders conveniently filed for bankruptcy earlier this year. No wonder the right keeps whining about over-regulation cramping their style. Damn socialism.
New Data Says Huge West Virginia Chemical Spill May Have Been More Toxic Than Reported - The mysterious chemical that tainted drinking water for 300,000 West Virginians this past January may have been more toxic than what was previously reported, according to new federally funded research released this afternoon. Environmental engineer Andrew Whelton tested crude MCHM — a chemical mixture used in the coal production process — and found it to be much more toxic to aquatic life than was reported by Eastman Chemical, the company that makes it. Whelton said he used exactly the same process to test the chemical that Eastman did — the same water chemistry, temperature, quality, and organisms — but found a drastically different result than what was reported on Eastman’s Material Safety Data Sheet for the chemical.“To be frank, [the drastic difference in results] could be for a number of reasons,” Whelton told ThinkProgress, noting that Eastman did its research on the chemical in 1998. “It could be is that the composition of the crude MCHM they tested in 1998 was different than the crude MCHM [Eastman] sent us in 2014.” Approximately 10,000 gallons of MCHM spilled into West Virginia’s Elk River on Jan. 9, taking away normal drinking water from 300,000 civilians. In the aftermath, nearly 600 people checked themselves into local hospitals with what federal epidemiologists called “mild” illnesses, such as rash, nausea, vomiting, abdominal pain, and diarrhea. Eastman’s data had been used as a basis for public health response following the spill.
Oilprice Intelligence Report: Natural Gas - The Big Sell Off: This week, August Natural Gas futures posted its biggest one day drop since mid-February. The sell-off basically erased all of 2014 gains. Bearish speculators sold heavily on the notion that the uneven U.S. heat pattern this summer will weigh on demand for the power-plant fuel. Although the weather has a short-term fundamental influence on the market, the recent price action clearly suggests that natural gas is in the hands of some strong short-sellers. This is because the market is taking a hit from both the demand and supply side of the equation. The short-term demand outlook looks bearish for the rest of the month. In the East, seasonally normal temperatures are expected to return from July 12 through July 21. The Midwest is expected to experience normal to cooler temperatures during the same time period. With weather forecasters confident that these areas are not expected to see any sustained heat across the major gas-consuming regions of the U.S., prices are expected to continue to feel selling pressure. On the supply side, a record string of storage injections has alleviated the fear that the U.S. won’t have enough gas for next winter’s heating season. Gas supplies have expanded by more than 100 billion cubic feet for eight consecutive weeks. This new record according to government statistics pushed U.S. inventories up to 1.929 trillion cubic feet in the week-ended June 27. This is only 29 percent below the five-year average for the period, according to the EIA.
Fracking Our Farmland, Our Families and Our Future: A New Toxic Legacy - http://www.sccma-mcms.org/Portals/19/assets/docs/fracking.pdf
New Research Strengthens Link Between Shale Drilling And Earthquakes - A recent study from Cornell University finds a probable link between drilling activity and an increased frequency of earthquakes in Oklahoma. Published in the journal Science, the study indicates that the practice of injecting millions of gallons of wastewater underground after a well is hydraulically fractured may increase the occurrence of earthquakes.Although scientists have yet to identify a concrete link between unconventional drilling and earthquakes, areas that have experienced an increase in oil and gas drilling have also seen an uptick in seismic activity. Oklahoma is currently the state with the highest number of magnitude 3.0 earthquakes for 2014. “It's been a real puzzle how low seismic activity level can suddenly explode to make (Oklahoma) more active than California,” says Katie Keranan, the lead researcher of the study and geophysics professor at Cornell University. A correlation between earthquakes and drilling have cropped up elsewhere, including Ohio, where regulators shut down several wells that were thought to have contributed directly to earthquakes. Ohio, in particular, has a large concentration of injection wells, and much of the wastewater from the thousands of fracked wells in places like West Virginia and Pennsylvania is trucked to Ohio for disposal. The injection wells are thought to be a contributor to earthquakes.
Study: 4 big wells injecting wastewater from energy drilling trigger more than 100 quakes - A new study explains how just four wells forcing massive amounts of drilling wastewater into the ground are probably shaking up Oklahoma. Those wells seem to have triggered more than 100 small-to-medium earthquakes in the past five years, according to a study published Thursday by the journal Science. Many of the quakes were much farther away from the wells than expected. Combined, those wells daily pour more than 5 million gallons of water a mile or two underground into rock formations, the study found. That buildup of fluid creates more pressure that "has to go somewhere," said study lead author Cornell University seismologist Katie Keranen. Researchers originally figured the water diffused through underground rocks slowly. But instead, it is moving faster and farther and triggers quake fault lines that already were likely ready to move, she said. "You really don't need to raise the pressure a great deal," she added. The study shows the likely way in which the pressure can trigger fault lines — which already existed yet were not too active— but researchers need more detail on the liquid injections themselves to absolutely prove the case, Keranen said. The wastewater is leftover from unconventional wells that drill for oil and gas with help of high pressure liquids — nicknamed fracking — and from the removal of water from diluted oil. These new methods mean much more wastewater has to be discarded. While there are about 8,000 deep injection wells in the region, the amount of water injected at the four wells — named Chambers, Deep Throat, Flower Power and Sweetheart — has more than doubled since the drilling boom started about a decade ago.
Fracking responsible for 22,900 percent increase in Oklahoma earthquakes since 2008 - A study published in July 4, 2014 issue of Science determined that the surge in earthquake activity in what had been tectonically calm Oklahoma is a direct result of hydrofracking and waste-water injection. Before 2008, Oklahoma averaged one earthquake with a magnitude of 3.0 or greater every year. To date in 2014, the state has witnessed more than 230 such tectonic events. One of the study’s co-authors, Cornell University’s Geoffrey Abers, told Nature that “it is really unprecedented to have this many earthquakes over a broad region like this.” “Most big sequences of earthquakes that we see are either a main shock and a lot of aftershocks or it might be right at the middle of a volcano in a volcanic system or geothermal system,” he added, “so you might see little swarms but nothing really this distributed and this persistent.” Abers and his colleagues analyzed the data on rate and volume of liquids being used in waste-water injection sites and compared it to the physical properties of the rock into which it was injected. They found that a small number of waste-water injection sites could be responsible for the large increase in earthquake activity state-wide. “The risk of humans inducing large earthquakes from even small injection activities is probably high,” Abers said about a 5.7 magnitude earthquake in Prague, Oklahoma in March. Now he has evidence proving that “[s]ome of these earthquakes are as much as 20 miles away from what seems to be the primary wells that are increasing the pressure.”
Earthquakes Linked To Fracking -- Research by Katie Keranen, an assistant professor of seismology at Cornell University in New York, found that injecting wastewater from fracking at underground disposal sites can cause earthquakes of moderate strength, or magnitude 3. Keranen’s research, published July 3 in the journal Science, backs up an earlier report by the U.S. Geological Survey (USGS) that found that some of the 450 earthquakes of magnitude 3 and larger in central and eastern parts of the United States between 2010 and 2013 coincided with the disposal of fracking wastewater. The USGS report said Oklahoma, which has recently been experiencing twice as many moderate quakes as even quake-prone California has, provides a better understanding of how an increase in fluid pressure and the quick movement of wastewater over broad underground tracts can cause earthquakes. It points to a study by the Oklahoma Geological Survey that Oklahoma County, which is close to a fault line, had only six earthquakes over eight years starting in 2000. Yet in 2009 there were 31, and in the subsequent 15 months, 850. "It's been a real puzzle how low seismic activity level can suddenly explode to make (Oklahoma) more active than California," Keranen told USA Today.
DEP considers rules on tremors and fracking: The closest earthquakes presumably caused by hydraulic fracturing stirred about a mile west of the Pennsylvania border, but regulators felt the reverberations in Harrisburg. The Pennsylvania Department of Environmental Protection is considering creating rules for the first time for wells in “seismic hazard areas” — places that may be susceptible to tremors triggered by well stimulation techniques like fracking. The agency floated the proposal in recent weeks in a paper outlining conceptual changes to the state’s oil and gas well regulations under the heading “TBD – Induced seismicity.” A lot remains to be determined, including what “seismic hazard areas” are and where they might be, if the state has them at all. DEP’s chief of oil and gas compliance and data management, Joseph Lee Jr., said the language is a placeholder for now, but the department and its partners are beginning a massive data-mining project to fill in the blanks. The issue arose after a series of earthquakes in March were linked to fracking at a Utica Shale well pad in Ohio. “The question is: Are these conditions that can occur in Pennsylvania?”
Study Finds More Costs Than Benefits From Fracking -- Even before the most recent recession, Carroll County in rural eastern Ohio was struggling. Employment prospects were sparse and young people were fleeing for opportunities elsewhere. Then came 2011 and arrival of the shale industry, giving the local economy an injection of jobs and the attendant financial benefits an influx of new business creates. Though shale development has changed the county’s fortunes, the transformation from ghost town to boom town has been far from smooth, according to a study released in April by nonprofit research organization Policy Matters Ohio. Months after the study was made public, there are still lingering questions about whether the cultural, environmental and public health costs of fracking outweigh the economic benefits.“This was a region struggling for a long time, so fracking has been a shot in the arm,” said Amanda Woodrum, report author and Policy Matters researcher. “But the story does not end there.”
Ohio study finds more costs than benefits in shale gas drilling -- The Carroll County study was part of a larger effort to determine the impact of shale development in four communities in Ohio, West Virginia and Pennsylvania. Policy Matters joined with other members of the Multi-State Shale Research Collaborative for the year-long venture. Carroll County, which has half the state’s active fracking wells, is a decade newer to the shale energy game than its out-of-state contemporaries, said Woodrum. Still, about 95 percent of county sub-surface rights have already been bought or leased for potential use in domestic oil and gas production. The signing bonuses that came with these land sales or leases — as high as $5,800 per acre — are being spent locally on farm property and equipment, the study says. Oil and gas companies are also purchasing supplies from businesses in Carrollton, the economic heart of the county, while company employees patronize local restaurants and bars. This activity has led to a 31 percent increase in sales tax receipts. Increased sales tax revenues resulted in much-needed facility repairs, including a courthouse clock tower built in 1885. Fracking-related employment in Ohio has grown by about 3,000 jobs, less than one-tenth of one percent of the state’s total employment, said Woodrum. This number is far from Ohio Oil and Gas Associations claims that 40,000 new positions would be created by the industry. In Carroll County, higher paying jobs related to oil and gas drilling, like construction of pipelines and processing plants, have been mostly going to out-of-state workers following their company’s drilling rig as it moves throughout the country. “Oil jobs are almost a new form of migrant labor,”
Tracking Health Issues Related to Fracking in Ohio - does not exist -- Unbelievable! Ohio is a huge fracking state....“The Ohio Department of Health does not maintain a database nor do we have a monitoring program,” said spokeswoman Melanie Amato in an e-mail. “The Ohio Department of Natural Resources tracks oil and gas complaints, but nothing related to health.”Similarly, officials in Oklahoma, Texas, Wyoming and West Virginia said their agencies had little or no regulatory role in oil and gas development. All five states referred us to their oil and gas commissions or environmental protection departments. In West Virginia, health officials in one county have struck out on their own. The Wheeling-Ohio County Health Department has created an online survey where residents can report potential health impacts such as respiratory problems or sleep disturbance from noise or light.
Fracking Fire Intensifies Push to Change Ohio Chemical Disclosure Laws --- Environmentalists say the recent fire at a hydraulic fracturing well in southeastern Ohio highlights the flaws in state and federal disclosure laws for chemicals used in "fracking." The fire at the Monroe County well site on June 28 spread to 20 nearby trucks on the drilling pad, and required additional firefighters from six counties to contain it. Melissa English, development director with Ohio Citizen Action, says first responders were probably unaware of the chemicals involved in the accident because the only ones listed were "condensate and produced water." "There were more chemicals on-site at the time of the fire, because they had started fracking by that time," says English. "They had started actually stimulating the well to produce oil and gas, which they hadn't done at the time the hazardous chemical inventory was filed last year." Under federal requirements, hazardous chemicals must be reported annually, and drillers must file reports for any additional chemicals brought on-site. For chemicals deemed "hazardous," drillers have 90 days to file. For chemicals termed "extremely hazardous," drillers have 30 days. English says it's possible during that 30- or 90-day window an accident could occur - and first responders would likely be unaware of the chemicals on-site. Under Ohio law, oil and gas drillers are not required to disclose the chemicals they use. Teresa Mills with the Center for Health, Environment and Justice is among those who have worked to end Ohio's exemption for the fracking industry and bring the state in line with federal requirements.
Company Seeks Barge Dock Permit for Shipping Fracking Wastewater - Ohioans are shocked to stumble on a new proposal by GreenHunter, a Texas-based fracking wastewater company, to build a barge off-loading facility on the Ohio River in Meigs County. Barging of liquid frack waste has not been approved by the U.S. Coast Guard, which received 60,000 public comments last December opposing the proposal.The dock proposal to U.S. Army Corps of Engineers was found by an individual scanning the Federal Register. No notice has been issued in state or local media. The online notice posted by the Corps on June 27, specifies that public comments must be hard copies and received at the Corps’ Huntington office by July 28. Roxanne Groff, Bern Township (Athens County) Trustee and former Athens County Commissioner, stated: It is imperative that the Corps allow more time for citizens to become informed and comment knowledgeably on this disastrous project. Most rural elected officials are not yet even aware of the project and only meet once a month. There is no time for discussion by citizens or time to even understand the potential impacts of toxic radioactive waste being offloaded to a facility that does not even have regulations for storage or transport from the river site. Groff alluded to two June 2014 Ohio fracking explosions and fires, one in Monroe County in which 20 fracking trucks burned for two days and led to a “significant fishkill,” Both explosions involved transfers of hydrocarbon-laden frack liquids. “Imagine an explosion from a barge carrying a half-million gallons of frackwaste at a site that is storing hundreds of thousands of gallons of this toxic radioactive waste. Can you imagine, if a spark ignited an off-loading bargeful, what a half-million gallons of flammable frackwaste would do to the riverside and downstream communities?” Groff asked.
GreenHunter Resources to Begin Multiple-Pipeline Project in Shale Areas -- GreenHunter Resources reports that, through its wholly-owned subsidiary GreenHunter Pipeline LLC, it has executed multiple definitive agreements to have exclusive use of three independent pipelines. This new project covers 34 miles of right-of-way to transport freshwater, oilfield waste water (brine), and hydrocarbons (oil, condensate and NGLs). The points of receipt (PORs) have been strategically chosen in two locations in southwestern Pennsylvania and northwestern West Virginia. These regions have quickly become some of the most densely populated areas for new permitting, drilling, and producing in the Marcellus shale play and in the evolving Utica shale play.The brine pipeline will be constructed of 12-inch-diameter pipe capable of transporting 100,000 bbl per day. The freshwater pipeline will be a 16-inch-diameter pipe with the capacity to handle approximately 140,000 bbl per day. The condensate pipeline will be a 6-inch-diameter pipe that will have a capacity of 30,000 bbl per day. The first phase of the project has begun with right-of-way negotiations underway, and it is scheduled to be complete and 100% operational by Jan. 1, 2016. The pipeline destination will also include a processing facility to split condensates into different quality products, typically resulting in higher value for these finished materials for ultimate marketing. The new processing plant for condensate is scheduled to be completed by the third quarter of 2016. Phase 2 of the project may consist of additional extensions to the primary gathering lines, extending further into Pennsylvania and possibly into Ohio. The parties anticipate the second phase to begin construction prior to the completion of the first phase.
Frackers Publish “How to Frack the Public” -- Three years in the making, co-authored by by head New York Frak Flak Karen “Mushrooms” Moreau, whose over-bearing bombast has has sold more towns on frack bans than the Slottjes, the frackers have issued their Rules of Deceit entitled “How to Frack the Public” for land men, frak flaks, industry shills and their local accomplices.Subtitled “How to make good on the promise of pizzas“ Frackers Release Fracking Community Engagement Standard - The American Petroleum Institute issued new propaganda specifically aimed at engaging with US communities affected by exploration and development of unconventional oil and gas resources, aka “fracking”. ANSI-API Bulletin 100-3 entitled “How to Frack the Public“emerged following 3 years of meetings and discussions with producers, state regulators, PR frak flaks, shale shysters, psy-ops specialists and spin doctors, API Minister of Information David Miller said. “It’s a first-of-its-kind industry propaganda for community engagement,” he told reporters on July 9. “These guidelines will provide a roadmap for oil and gas operators seeking to frack as much of the country as possible, thanks to advances in fracking, payola, media buys, and frozen pizza delivery. ” The new fracking propaganda is similar to other spin that already exist for pipelines and rail transportation of exploding shale bomb trains, Miller said. He and New York State Petroleum Council Executive Director Karen Moreau, who also participated in the teleconference, emphasized that it was not a knee-jerk response to recent court decisions or moves by communities to restrict or ban fracing or to the 150 communities that have taken steps to protect themselves from this sort of industry propaganda.
Don’t Fracking Sacrifice Anyone - Fracking Ban Must be Statewide to Ensure Safety for All. “The Times Union deserves praise for its recent editorial (‘For drillers, no means no’) in support of the recent New York State Court of Appeals ruling that municipalities do indeed have the right to ban fracking. But more importantly, the Times Union supported maintaining New York’s statewide moratorium given increasing scientific evidence showing harms of fracking and that fracking hurts property values. As a rural landowner in the Southern Tier — close enough to Pennsylvania that I often grimace from the sight and discomforting smell of flaring at frack sites across the state border — I am terribly alarmed by the gas industry’s suggestion that the Court of Appeals ruling could pave the way for fracking in areas of the Southern Tier that “want it.” If the industry’s scheme comes to fruition, I could be among the first victims. As I drink my well water each day, I think of all the recent studies showing the inherent problems and dangers of fracking. Just last week, a study in the journal Proceedings of the National Academy of Sciences — where researchers examined Pennsylvania state records of more than 41,000 gas wells — found fundamental problems with well casings and cement that mean four in 10 fracking wells in the state will leak into the groundwater or the atmosphere over time. As a breast cancer survivor, I know all too well the harm that such chemicals can have.
Arrested for Spreading Frack Filth in Texas - In New York and Fracksylvania, it’s legal to spread frack filth on roads as “de-icer” in the winter and “dust suppressant” in the summer. If you did that in Texas, you’d get arrested and thrown in the pokey. Texas Sheriff Wants Criminal Charges Filed in Fracking Pollution Case. A Texas waste hauling company that is already facing civil charges for a March accident that spread toxic drilling waste along a rural road could also be facing criminal charges. Karnes County Sheriff Dwayne Villanueva said he will ask county prosecutors to file a criminal complaint against On Point Services LLC after the Texas Commission on Environmental Quality (TCEQ) and the Texas Railroad Commission close their civil cases against the company. “We are prepared to ask the district attorney’s office to review the case for action,” Villanueva said. “There are two different levels of enforcement here: the civil by the state and the criminal by the county.”
Chevron Admits The Truth: Oil Shale Will Use Huge Amounts Of Western Water - One of the largest oil companies in the world has been forced in court to tell the truth, the whole truth and nothing but the truth about one of the key environmental impacts of developing oil shale in the arid West. Namely, it will consume an enormous amount of water in a region where drought and climate change are already stressing available water supplies. Chevron USA, in legal filings in a case brought by the conservation group Western Resource Advocates, has admitted that to meet a goal of developing a half million barrels of oil from sedimentary rock in northwest Colorado it would need 120,000 acre feet of water a year. That’s enough to meet the needs of 1 million people per year. Oil industry giants have often brushed off concerns about the water demands oil shale development would place on the Colorado River system, despite assessments by the U.S. Government Accountability Office, the federal Bureau of Land Management and the Rand Corporation that it will be water-intensive. Oil shale is different from shale oil which is conventional oil produced from shale rock formations using standard drilling techniques. Oil shale is a sedimentary rock that contains kerogen, which can yield liquid hydrocarbons when the rock is heated to high temperatures.
Activists Blockade Chevron Fracking Site in Eastern Romania - Twenty-five activists from across seven countries, chained themselves to the gates of a Chevron shale gas exploration well in Eastern Romania yesterday, and are calling on the government to ban fracking in the country. Photo credit: Greenpeace Romania Facebook page The Greenpeace activists—from Romania, Hungary, Austria, Czech Republic, Poland, Slovakia and Germany—held banners reading “Pungesti anti-Chevron quarantine area” and “Stop Fracking!” in protest of the U.S. energy giant’s exploration work on the ground. Chevron began work on the exploration well in Pungesti, northeast of Bucharest, in December last year having postponed operations several times due to local opposition. The protests in the village attracted widespread attention and media coverage last year as villagers, framers, protesters and the community’s religious leaders came together to block the fracking site and halt Chevron’s plans.
Does Gazprom Fund European Anti-Fracking Activists? - As far as conspiracy theories involving Russia go, this one takes the cake. Unlike the United States which has experienced a renaissance in energy production through the use of hydraulic fracturing or "fracking" in common parlance, Europe has not warmed to the technology. Many of the objections come from environmentalists who express concern over water usage, water pollution, earthquakes and so on. A few weeks ago, however, NATO Secretary-General Anders Fogh Rasmussen said that Russia was working to sabotage European energy independence from its oil and gas by undermining support for fracking. The alleged preferred means? Covert Russian funding for environmental groups: Anders Fogh Rasmussen, secretary-general of the North Atlantic Treaty Organisation (Nato), and former premier of Denmark, told the Chatham House thinktank in London on Thursday that Vladimir Putin’s government was behind attempts to discredit fracking, according to reports. Rasmussen said: “I have met allies who can report that Russia, as part of their sophisticated information and disinformation operations, engaged actively with so-called non-governmental organisations - environmental organisations working against shale gas - to maintain European dependence on imported Russian gas.” For obvious reasons, NATO is at pains to point out that Rasmussen is expressing an opinion and not the position of the organization. What is especially odd is how Putin becomes an environmentalist all of a sudden when Europe has the technology within its grasp to wean itself off Russian energy. In the context of climate change, for instance, it couldn't care less about the environment. Let's just say it is self-interested in raising environmental concerns for this particular issue that can hurt its core economic interests. For them, it's every which way but lose. Meanwhile, the "Russian collaborator" taunt is being leveled against all sorts of European environmental protesters:
Rupture-Prone Oil Trains Keep Rolling After Quebec Crash - When Aurora Mayor Tom Weisner sees rail cars full of crude oil rumble down the tracks that criss-cross his Chicago-area town, he often thinks about the derailment that killed 47 people almost a year ago in Canada. The disaster focused attention on the design of the oil tankers, yet two-thirds of the tank cars in use today are still older models that safety experts say are vulnerable to puncture. The July 6 derailment last year in Quebec and seven other major ones in the U.S. and Canada since then have spilled more than 3 million gallons of oil, with some cars catching fire or exploding. “You can see tanker car after tanker car go by on that rail constantly,” said Weisner, whose city is 40 miles (64 kilometers) southwest of Chicago and second to it in population in Illinois."Our regulators have got to figure out whether they’re working in the interest of the American people or the oil industry.” Weisner is co-chairman of the TRAC coalition, a group of communities that are lobbying for rail safety enhancements, including sturdier cars. Tank car owners like GATX Corp. disagree with some of the proposals to strengthen or phase out the cars quickly while railroads including BNSF Railway Co. balk at slowing train speeds. That means the trains keep barreling ahead, hauling the booming production of North Dakota -- where daily output has surged in eight years to 937,000 barrels from 4,300 barrels -- through Aurora and other cities.
Industry Data Show Oil-By-Rail in North America at Record Levels -- On July 3, the Association of American Railroads (AAR) released June 2014 data showing oil-by-rail and petroleum products at-large are moving at record levels throughout North America. The release of the data comes on the heels of the ongoing oil-by-rail nationwide week of action launched by environmental groups. For the 26th week of 2014 (the half year point) in the U.S., 18.5% more tank cars were on the tracks carrying petroleum and/or petroleum products than last year, a total of 15,894 cars. Examined on a year-to-date basis, 7.0% more of those same tank cars were on the tracks in the U.S. this year than last, totaling 380,961 cars to date. Across the border in Canada, the same trend lines exist: for the 26th week of 2014, 6.9% more cars moved petroleum and/or petroleum products by rail than in the 26th week of 2013. Looked at in terms of year-to-date compared to 2013, that totals a 7.7% increase in tank cars moving the commodity by rail. With its public relations work overseen and advised by SKDKnickerbocker — co-owned by former Obama White House communications director Anita Dunn — AAR has landed numerous meetings with the White House Office of Information and Regulatory Affairs (OIRA) in the attempt to water down crude-by-rail regulations currently being drafted by the U.S. Department of Transportation (DOT). As revealed on DeSmogBlog, AAR members gave a presentation to OIRA on June 10 on how companies would be faced with “far reaching economic impacts” if speed limits were imposed on trains carrying oil by rail.
America’s Dairyland Turning to Petrostate: Wisconsin Oil-By-Rail Routes Published for First Time - DeSmogBlog is publishing the first documents ever obtained from the Wisconsin government revealing routes for oil-by-rail trains in the state carrying oil obtained via hydraulic fracturing (“fracking”) in the Bakken Shale basin.The information was initially submitted to the U.S. Department of Transportation (DOT) under the auspices of a May 7 Emergency Order, which both the federal government and the rail industry initially argued should only be released to those with a “need to know” and not the public at-large. The Wisconsin documents show the three companies that send Bakken crude trains through the state — Burlington Northern Santa Fe (BNSF), Union Pacific and Canadian Pacific — all initially argued routes are “sensitive security information” only to be seen by those with a “need to know.” As covered in a previous DeSmogBlog article revealing the routes of oil trains traveling through North Dakota for the first time, the rail industry used this same line of legal argument there and beyond. As with North Dakota, BNSF is the chief mover of oil-by-rail in Wisconsin. BNSF is owned by Warren Buffett, one of the richest men on the planet and a major campaign contributor to President Barack Obama and expected major donor for Hillary Clinton's 2016 presidential bid. According to the records it submitted to Wisconsin Emergency Management, BNSF moves the majority of its crude-by-rail trains along the state's western corridor, which hugs the Mississippi River.
MAP: 25 Million Americans Live Within The ‘Blast Zone’ Of An Oil Train Explosion --Millions of Americans live within the “blast zone” of an oil train accident, according to a new map put together by environmental group ForestEthics. The map, created using industry data and on-the-ground reports of people living close to oil train routes, outlines the routes of oil trains across the U.S. and into Canada. Using census data, ForestEthics estimates that more than 25 million Americans live within a one mile zone that must be evacuated in case of an oil train fire — what the group calls the “blast zone.” That number could be even higher. Eddie Scher, Communications Director for ForestEthics, told ThinkProgress that the map represents all the known routes of oil trains, but since some states don’t make that information publicly available, it’s likely missing some routes.“We are looking at this as a very conservative take on what routes are being used by these oil trains,” he said. “I’m positive that there are more routes out there that have trains on them.”The group’s mapping site allows users to search by zip code to see the closest oil train routes in their region, and includes a petition to President Obama and Congress to address oil-by-rail safety that ForestEthics is planning to deliver later this year. In it, the group calls on regulators to ban DOT-111 tanker cars, which Scher said puncture easily and have been involved in major crashes, including the one in Lac-Mégantic that killed 47 people one year ago.
Higher Cancer Rates and Tainted Local Foods Linked to Tar Sands Operations -- A new study released by two Alberta First Nations communities in partnership with the University of Manitoba reports that certain carcinogens released in tar sands operations are being found in high levels in local wildlife. The study also reports a higher incidence of cancer among study participants, many of whom work in the tar sands industry, adding to evidence that these local communities suffer from higher rates of cancer. The Mikisew Cree Chief Steve Courtoreille said, “This report confirms what we have always suspected about the association between environmental contaminants from oil sands production upstream and cancer and other serious illness in our community… We are greatly alarmed and demand further research and studies are done to expand on the findings of this report.” The University of Manitoba study done in collaboration with the Mikisew Cree and Athabasca Chipewyan First Nations adds to growing body of scientific evidence that people living near tar sands operations are showing that serious health risks and problems. Projects like the proposed Keystone XL pipeline which will help the ramp more tar sands production posing even greater health risks should be rejected by the U.S. government. And despite these documented dangers, the province of Alberta and the federal Canadian government have done too little to protect the local community’s health. Now is the time for more rigorous health monitoring and a follow up investigation into elevated cancer rates.
TransCanada Buys Town’s Silence On Tar Sands Pipeline Proposal For $28K - A small town in Ottawa, Canada will be receiving $28,200 from energy company TransCanada Corp. in exchange for not commenting on the company’s proposed Energy East tar sands pipeline project, according to an agreement attached to the town council’s meeting agenda on June 23. Under the terms of deal, the town of Mattawa will “not publicly comment on TransCanada’s operations or business projects” for five years. In exchange for that silence, TransCanada will give Mattawa $28,200, which will ultimately go towards buying a rescue truck for the town. “This is a gag order,” Andrea Harden-Donahue, a campaigner for energy and climate issues with the Council of Canadians, told Bloomberg News. “These sorts of dirty tricks impede public debate on Energy East, a pipeline that comes with significant risks for communities along the route.” The terms of the agreement did not specifically mention the controversial Energy East pipeline, which would carry more than a million barrels of tar sands crude oil across Canada each day. However, the deal is being widely seen as a way for the company to avoid obstacles that may get in the way of the pipeline’s approval — especially considering the obstacles that have long plagued the approval of the controversial Keystone XL pipeline in the United States. The Energy East pipeline, though, is bigger than Keystone XL — in fact, it’s the most expensive pipeline project TransCanada has ever proposed. If approved, Energy East would carry about 1.1 million barrels of tar sands crude across Canada each day. That’s more than Keystone XL, which would carry 830,000 barrels per day from Canada down to refineries in Texas.
Canada's Enbridge in Talks with Alaska on Natural-Gas Pipeline - WSJ — Enbridge is in talks with Alaska about building a pipeline to ship natural gas from the North Slope, according to company and state officials, who describe the project as a potential alternative to an Alaskan pipeline project backed by Canadian rival TransCanada The state is eyeing the competing projects to carry surplus natural gas from the North Slope, either to meet demand in-state through the existing utility grid or to reach foreign buyers once the gas is liquefied for transport by ship. Calgary-based Enbridge said it has begun discussions with Alaska Gasline Development Corp., a state-funded body tasked with developing a 727-mile natural-gas pipe from Prudhoe Bay to Point MacKenzie, with a spur line to Fairbanks.
BP loses battle to trademark the colour green in Australia --- The oil giant BP has again failed in its long-running bid to trademark the colour green in Australia. The intellectual property watchdog, IP Australia, found BP was unable to show “convincing evidence” that it was indelibly linked in the average petrol consumer’s mind to the dark green shade known as Pantone 348C, a spokeswoman for the government agency said. BP first tried to register a trademark for the colour in 1991, and until 2013 fought legal battles against another corporate titan, Woolworths, to stake its claim to the colour as the dominant shade for its service stations. A spokeswoman for the energy company did not confirm whether BP would continue trying to claim the colour, saying only: “The colour green has been central to the BP brand since the 1930s and we believe it should be protected.”
Can the Arctic Reshape Global LNG Shipping?: Rising global temperatures are melting Arctic sea ice, so much so that some companies are now viewing the Arctic Ocean as a major shipping route for energy supplies. The Wall Street Journal published an article on July 9 that detailed a joint venture between two major Asian companies seeking to ship liquefied natural gas (LNG) through the Arctic Ocean. Mitsui OSK of Japan and China Shipping Development Company announced a combined investment of $932 million on three LNG carriers that could handle the rough icy waters of the far north. China and Japan promise to be huge buyers of LNG in the coming years. China, with its cities suffocating from air pollution, is seeking to replace much of its coal fleet with cleaner burning natural gas. And Japan – which has long been the world’s largest importer of LNG – is still heavily dependent on LNG imports with its 48 nuclear reactors still offline. China and Japan continue to scour the world for new LNG supplies, and melting sea ice has opened up the option of the Arctic Ocean. The three LNG ships ordered by Mitsui and China Shipping Development will be equipped with ice breaking capability in order to plough through chunks of ice. The objective is to export natural gas from the Yamal LNG project that Russia is building in the Arctic Circle, ship it via the Northern Sea Route (NSR) along Russia’s northern coastline, and on to China and Japan. The route between Russia and Asia via the Arctic would theoretically cut down on shipping times, and thus cost. “The shorter distance would be good for buyers, by cutting shipping costs and reducing other risks,” Yu Nagatomi, an economist at the Institute of Energy Economics, told the Wall Street Journal.
Ukraine’s gas debt to hit $5.26 bn, if no June payment — RT Business: Ukraine’s gas debt will increase to $5.26 billion on Monday, if it doesn’t pay its bill for June by the July 7 deadline. This bill is calculated on gas delivered before Russia’s Gazprom switched Ukraine’s Naftogaz to a prepayment system. In the first 15 days of June before the prepayment plan was introduced Russia supplied 1.56 billion cubic meters of gas to Ukraine. If the bill is not paid by July 7 the debt will rise to $5.26 billion, based on the new price of $485 per thousand cubic meters that came into effect in April. Ukraine has insisted it would pay the bill if it was charged $326, the head of Naftogaz said. Meanwhile the country is seeking ways to diversify away from its dependence on Russia. On Friday Ukraine’s Finance Ministry put forward an eight point plan to escape Russian gas dependence, via developing its own production as well looking for other suppliers.
Russia’s Grip Over EU Energy Unlikely to Change Soon The European Union’s initial resolve at breaking its dependence on Russian energy after the Ukraine crisis erupted appears to be giving way to a realization that its giant eastern neighbor will continue to be Europe’s main supplier of natural gas for years to come. The quasi civil-war in Ukraine is far from over, but with Russia showing more restraint than expected – the Russian parliament withdrew its authorization for the use of military force in Ukraine, for example – urgency over the issue receded in recent weeks. Also, the Ukrainian military has made surprising gains against pro-Russian rebels recently, raising hopes in European capitals that Ukraine will not be overrun by Russia and pro-Russia separatists. The sense of urgency is subsiding, and at the same time, there is a growing recognition that Europe cannot wean itself off Russian energy anytime soon. Russia’s destabilization of Crimea in March led EU leaders to seek ways to both punish Russia and improve energy security. One fallout was EU Energy Commissioner Guenther Oettinger decision in March to suspend discussions over the South Stream pipeline. If completed, the South Stream pipeline would travel from Russia underneath the Black Sea, through Bulgaria and Serbia before arriving in Western Europe. It would also allow for Russia to export more natural gas to Europe while bypassing Ukraine. But completing the pipeline would only increase Europe’s reliance on Russia for energy. The EU already depends on Russia for 39 percent of its natural gas imports, and building South Stream would increase that volume by an additional 25 percent. The pipeline is expected to come online in 2018 at a cost of $40-$45 billion, and will have a capacity of 64 billion cubic meters of natural gas.
Oil explorers hit rock bottom - FT.com: The $250m price tag attached to the sale of a 50 per cent stake in a key project should have given a big boost to the share price of Africa-focused oil explorer Bowleven last week. It failed to. Analysts said the farm-down of the oil and gasfield off the coast of Cameroon was worth about 68p a share to Bowleven. Yet a day later, its shares were trading at just 40.5p. Its market value is now lower than the cash it earned on the Cameroon deal. “Something is not working here,” says a person close to the company. “The market is dysfunctional.” International exploration and production companies – or E&Ps – were once stock market darlings. A string of spectacular discoveries by Tullow Oil in Africa, Cairn Energy in India and DNO in Iraqi Kurdistan grabbed headlines and investors’ attention. But E&Ps have lost their lustre. That is partly because they seem to have lost the knack of discovering oil. “It would be great if someone actually found something with the drill bit to remind people of the reasons for holding E&P stocks,” “Discoveries have been too sparse.” A trading update from Tullow Oil illustrated the point on Wednesday. A pre-tax exploration write-off of $415m was accompanied by a blip in interim production figures. Its share price has almost halved in the past two years.
Fossil industry is the subprime danger of this cycle - The epicentre of irrational behaviour across global markets has moved to the fossil fuel complex of oil, gas and coal. This is where investors have been throwing the most good money after bad. They are likely to be left holding a clutch of worthless projects as renewable technology sweeps in below radar, and the Washington-Beijing axis embraces a greener agenda. Data from Bank of America show that oil and gas investment in the US has soared to $200bn a year. It has reached 20pc of total US private fixed investment, the same share as home building. This has never happened before in US history, even during the Second World War when oil production was a strategic imperative. The International Energy Agency (IEA) says global investment in fossil fuel supply doubled in real terms to $900bn from 2000 to 2008 as the boom gathered pace. It has since stabilised at a very high plateau, near $950bn last year. The cumulative blitz on exploration and production over the past six years has been $5.4 trillion, yet little has come of it. Output from conventional fields peaked in 2005. Not a single large project has come on stream at a break-even cost below $80 a barrel for almost three years. "What is shocking is that upstream costs in the oil industry have risen threefold since 2000 but output is up just 14pc," The damage has been masked so far as big oil companies draw down on their cheap legacy reserves. "They are having too look for oil in the deepwater fields off Africa and Brazil, or in the Arctic, where it is much more difficult. The marginal cost for many shale plays is now $85 to $90 a barrel."
U.S.Taxpayers Lose over $21 Billion Annually in Fossil Fuel Production Subsidies - Fossil fuel subsidies have increased by 45% under President Obama's “All of the Above” energy policy. A new report released today by Oil Change International exposes over $21 billion in fossil fuel production subsidies annually in the U.S. at the federal and state levels. The report, entitled “Cashing in on All of the Above: U.S. Fossil Fuel Production Subsidies under Obama,” outlines the wide array of subsidies going to the industry amidst a deepening climate crisis being spurred by continued fossil fuel extraction and production. In total, the report catalogs over $37 billion in U.S. federal and state support for the fossil fuel industry in 2013. The report focuses on exploration and production subsidies because these subsidies are tied to the All of the Above energy policy in the U.S., and because they are completely incompatible with climate science that clearly shows that most existing fossil fuel reserves need to be left underground. Much of the increase in the value of fossil fuel production subsidies in the U.S. can be attributed to the increase in oil and gas production in recent years, the report finds. In particular, federal fossil fuel production and exploration subsidies in the US have grown in value by 45 percent since President Obama took office in 2009.
U.S. Seen as Biggest Oil Producer After Overtaking Saudi Arabia - The U.S. will remain the world’s biggest oil producer this year after overtaking Saudi Arabia andRussia as extraction of energy from shale rock spurs the nation’s economic recovery, Bank of America Corp. said. U.S. production of crude oil, along with liquids separated from natural gas, surpassed all other countries this year with daily output exceeding 11 million barrels in the first quarter, the bank said in a report today. The country became the world’s largest natural gas producer in 2010. The International Energy Agency said in June that the U.S. was the biggest producer of oil and natural gas liquids. “The U.S. increase in supply is a very meaningful chunk of oil,” Francisco Blanch, the bank’s head of commodities research, said by phone from New York. “The shale boom is playing a key role in the U.S. recovery. If the U.S. didn’t have this energy supply, prices at the pump would be completely unaffordable.” Oil extraction is soaring at shale formations in Texas and North Dakota as companies split rocks using high-pressure liquid, a process known as hydraulic fracturing, or fracking. The surge in supply combined with restrictions on exporting crude is curbing the price of West Texas Intermediate, America’s oil benchmark. The U.S., the world’s largest oil consumer, still imported an average of 7.5 million barrels a day of crude in April, according to the Department of Energy’s statistical arm.
The World Still Needs Saudi Arabia's Oil - Economic analysts are torn as to how important Saudi Arabia will prove to the global economy in years ahead. In the first half of 2014, the US surpassed Saudi Arabia to become the world’s foremost oil producer. This sparked widespread predictions that the US would soon become an oil exporter, reducing its dependency on Riyadh and harming Saudi Arabia’s leading role in the Middle-East. However, the ISIS invasion of Iraq and Syria, the Boko Haram insurgency and continued oil theft in Nigeria, unrest in Venezuela and ongoing violence in Sudan and South Sudan have changed the deal.
Oilprice Intelligence Report --While the US is trying unsuccessfully to unseat Iraqi Prime Minister Nouri al-Maliki due to his overly sectarian bent, ISIS--which in all its PR ‘stuntmanship’ has transformed itself into ‘IS’--has taken over the largest oil refinery in Syria, across the border. In the meantime, the Saudis are still banking on these Sunni jihadists to one-up Iran even though they cannot control ISIS, and Washington is likely thinking the same. All the while Washington’s worst nightmare is unfolding in the north, where the Kurds are preparing for an independence referendum, having usurped oil-rich Kirkuk, the last piece of the puzzle which lies in territories disputed by the Kurdistan Regional Government (KRG) and central/southern Iraq under Baghdad’s (waning) control.This week, IS (formerly ISIL, the Islamic State of the Levant, then ISIS, the Islamic State of Iraq and al-Sham, and now IS, simply the Islamic State—no need to limit our borders in this caliphate) took control of Al-Omar, Syria’s largest oil field. The field in Syria’s eastern Deir Ezzor province could be a value resource to fund the militant group’s efforts--when operational Al-Omar produced around 30,000 barrels a day. Oil prices began to stabilize as it became clear that Iraqi oil production appears to be operating normally, despite ISIS’ uprising, and due to the resistance in the form of various paramilitaries and Shi’ite militia groups. ISIS is heading to Baghdad, but its advance in Shi’ite-majority regions will not go unchallenged, which means all-out civil war.
ISIS' Latest And Most Ambitious Plan Yet: Invade Spain -- While Spain may have been scrambling for the past several years to figure out how to spin its economy, boasting one of the highest unemployment rates in the Eurozone, as recovering, coming up with numerous changes to what it believes should constitute GDP, most recently including an estimate of the contribution hookers and blow add to the economy, a surprising place which has emerged as a potential source of huge economic upside for Spain's economy is none other than the recently established Islamic State created by the ISIS al-Qaeda spin off. Because, stunningly, in a story right out of a history book covering the Islamic Conquest and subsequent Reconquista (however not in the middle ages but in the 21st century), the hardest-core Islamists around, those which even al-Qaeda deemed too "extremist", appears to have sworn to invade Spain next! As RT reported over the weekend, a group of jihadists claiming to be part of ISIS have vowed to invade Spain along with all other “occupied lands” in a video posted on the web. The men say Spain is the land of their forefathers and that they are prepared to die for their nascent Islamic State.
Are Neocons in Iraq Thinking Like the Banks that Blew up the Global Economy? - Yves here. For the normally anodyne OilPrice to run an article, Obama Fiddles While Iraq Burns, that is openly frustrated with US conduct suggests that there is considerable consternation in the oil industry about the lack of a coherent policy in Iraq. One school of thought has been that the US wanted a breakup, but history like the dissolution of Yugoslavia shows that they are ugly, bloody affairs that hurt the population and infrastructure. Both are bad for business, such as drilling for and refining oil, which was apparent reason we occupied Iraq in the first place. I've discussed with Lambert the difficult of coming up with a coherent rationale for the US stance towards Iraq.
Iraq loses control of chemical weapons depot to ISIS militants - The Iraqi government has informed the United Nations that it has lost control of a former chemical weapons depot to Islamist insurgents affiliated with ISIS, or IS, and cannot carry out its obligations to destroy what’s stored in the compound. In a letter penned by Iraq’s UN Ambassador Mohamed Ali Alhakim, it was revealed that “armed terrorist groups” took over the Muthanna complex on June 11. Located north of Baghdad, the facility was the main center for chemical weapons production prior to the 1991 Gulf War, and is still home to 2,500 rockets containing the lethal nerve agent sarin. According to the Associated Press, the compound is now in the hands of the Islamic State extremist group, also known as the Islamic State of Iraq and Syria (ISIS). In the letter to UN Secretary General Ban Ki-moon, Alhakim said that Iraqi officials witnessed the intruders looting some of the equipment before the surveillance system was taken offline.
Floodgates open as ISIS takes over swaths of both Syria and Iraq -- After three years of seesaw battles with the regime, Syrian rebels now face another daunting challenge: fending off radical Sunni militants who are taking over swaths of the country.The Islamic State in Iraq and Syria (ISIS) has gained notoriety in recent weeks as the group captured city after city in Iraq. Its goal: To create a caliphate, or Islamic state, spanning Iraq and Syria.Now, the crises in both countries are blending into a combined regional disaster as ISIS now controls land on both sides of the border -- opening the floodgates for weapons and fighters between Syria and Iraq. ISIS also took over six Syrian oil and gas fields and a major pumping station that distributes oil from Iraq into Syria, Abu Leila said. The captures include the al-Omar oil field, Syria's largest oil facility that can produce 75,000 barrels of oil a day. ISIS has also seized a military airport and a local army base.The land grabs by ISIS now stretch from Syria's Deir Ezzor province to the group's recently gained territories in Iraq's Sunni heartland, the opposition Syrian Observatory for Human Rights (SOHR) said.While ISIS has controlled parts of Syria for some time now, the group was fighting to open a route between its captures in Iraq and in Syria. That victory came Thursday, when ISIS wrested control of the Albu Kamal border crossing and all the cities between the crossing and Deir Ezzor city from Syrian rebels.
CEO Of One Of The World's Largest Energy Majors "Sees No Reason For Petrodollar" - The USA is fast running out of friends to support its 'exorbitant privelege'. Having alienated the Germans over NSA-eavesdropping, 'boomerang'd the Russians into de-dollarization, tariffed and quantitatively eased China into diversification, and finally 'punished' France into discussing the dollar's demise; it appears no lessor person than the CEO of Total (the world's 13th biggest oil producer and Europe's 2nd largest), believes "There is no reason to pay for oil in dollars." Clearly, based on Christophe de Margerie's comments, that we have passed peak Petrodollar.
Beijing residents will have to wait at least another 16 years to breathe healthy air -- Over the past six years, Beijing has seen at least 1,812 days of “unhealthy” air quality, and that trend isn’t going to get better any time soon. Pan Tao, head of the Beijing Municipal Research Institute of Environmental Protection, estimates that air pollution in the capital won’t be reach safe levels until at least 2030.China’s president Xi Jinping has called air pollution the “most prominent challenge” Beijing faces. Foreign firms are paying their workers “hardship” salaries to be posted in the city. In February a report from the Shanghai Academy of Social Sciences said that pollution in the capital is “near a level that is no longer livable for human beings.”As a result, China is trying to improve air quality however it can, from deploying pollution zapping drones to shutting down outdoor barbecues and planting 667 hectares (1,648 acres) of trees, as well as more serious moves to shift coal-powered energy production westward, shutter or fine polluting factories, and curb nearby steel production. The government has also announced a 10 billion yuan ($1.65 billion) fund devoted to cleaning up the country’s air overall. Still, Beijing’s levels of PM2.5—the most dangerous kind of particulate matter, which is small enough to the bloodstream—won’t reach 35 micrograms per cubic meter for another 16 years, according to Pan, speaking at a symposium on urban environment in Beijing on July 1st.
"This Could Be The Last Straw" 90% Of China Loan Guarantors Bankrupt - In Wenzhou - dubbed the capital of China's private businesses - nearly 90 per cent of loan guarantors have failed since the start of the credit crisis arising from the underground banking system, according to the media. As SCMP reports, although their services are critical for the economic system and the millions of small firms - that provide the majority of the mainland's jobs - hundreds of loan guarantee groups are creaking under the weight of bad loans and are simply unable to bear any more. "It could become the last straw that breaks the camel's back," exclaims the head of a local law firm, "without the privately owned small businesses, China's economy won't have a future." But PMIs are up so everything's fine?
China’s Wealthy Getting Richer in a Declining Economy-- As China’s economy declines, inequality is growing. A recent study by Yu Xie and Xiang Zhou finds that China’s Gini coefficient surpassed 0.50 in 2010, remaining high through the present period. Despite the decline in investment and production, the sheer number of wealthy is increasing—Forbes states that China had 157 billionaires in 2013. The number of high net worth individuals, individuals with over US$1 million of investable wealth, rose by 17.8% in 2013 to 758,000, according to consultancy Capgemini and RBC Wealth Management. Rapidly increasing wages in the financial and IT industries, contrasted with stable or slowly increasing wages in most other sectors (for example, utilities, construction, and transportation) has led to a sharp divergence between the income of the average worker and incomes of workers in privileged industries. What is more, the skyrocketing pay of top executives has enriched certain individuals over the masses. China’s private financial wealth amounts to US$22 trillion, according to the Boston Consulting Group. This is equivalent to well over double China’s GDP in 2013. While the average per capita income was US$6,747 in 2013, Chinese executives averaged well over US$100,000. The poorest workers have also face delayed or partial payment of wages. In many cases, this has led to protests and legal action against employers.
China Attacks Oz Banks for Laundering Flight Capital - Yves Smith - Yves here. China is cracking down on flight capital, starting with Australian banks. As the most casual readers of the business press know, the international wealthy, particularly Russians and Chinese, have been using residential real estate in "world cities" as their favorite lockbox. As we've written, it's stunning to see how much real estate has been hoarded in London. Mayfair was depopulated during the petrodollar recycling of the 1970s; now much of Belgravia, Chelsea near Sloan Square, and Kensington are visibly underpopulated. Vancouver has been bid to the sky by Chinese flight capital. New York is a big destination for Russian and Chinese investors, and Chinese money has been pouring into Australian real estate. The Chinese move may be an admission of stress on the financial system.
How Worrisome Are U.S. Exports to China? - After noting the role of health care spending in producing the largest negative shift from first to third estimate for quarterly GDP in modern U.S. history, Jim Hamilton notes the role of falling U.S. exports as the second biggest contributor to that outcome: The second most important factor in the revision is that the Q1 deterioration of exports is now seen as even worse than originally reported, with lower exports subtracting 1.2 percentage points from the GDP growth rate. Part of this may be payback for unusually strong export numbers for 2013:Q4. But if it signals a weakening in China or other key trading partners it could be more worrisome. So how worrisome is the level of U.S. exports to China? To answer that question, let's take a very close look at the year-over-year rate of growth for the value of goods traded between China and the U.S. since January 2012 through the trade volume data most recently reported by the U.S. Census Bureau for May 2014. In the chart below, the blue line with diamond shaped data points represents the annual growth rate of China's exports to the U.S, while the red line with the square data points represents the annual growth rate of the U.S.' exports to China: This chart shows the surge in U.S. exports to China in the fourth quarter of 2013, which coincides with the exporting of the record bumper crop of soybeans and other agricultural products from the U.S. to China following their harvest in the third quarter of 2013, as the U.S. agricultural industry effectively sold out all of its inventory during the fourth quarter in response to Chinese demand. As such, since the bumper crop and subsequent trade in these goods represents a unique situation, the decline in U.S. exports following the fourth quarter of 2013 cannot be considered to be "payback", which won't affect the year over year growth rate data until the fourth quarter of 2014. The volume of U.S. exports in the periods preceding and following the fourth quarter of 2014 is therefore more indicative of the relative health of the Chinese economy.
China's June Exports Rise Less Than Forecast: Chinese exports expanded less than expected in June signaling that foreign demand provide insufficient support for the economy to achieve its 7.5 percent growth target. Exports grew 7.2 percent in June from last year, data from the General Administration of Customs showed Thursday. Although the annual growth was faster than the 7 percent rise posted in May, it was below the 10.4 percent increase forecast by economists. Imports also climbed by a less-than-expected 5.5 percent in June. It reversed May's 1.6 percent fall but was weaker than the expected 6 percent growth. Consequently, the trade surplus decreased to $31.6 billion from $35.9 billion in May, when it was forecast to rise to $36.9 billion. Nonetheless, the customs office said export growth will accelerate in the third quarter
China’s Exports May Have (Gently) Turned a Corner - China’s latest trade data disappointed many economists, but it may offer hope that a long-running slowdown in Asian export growth has bottomed out. China’s General Administration of Customs said Thursday that exports in June grew 7.2% compared with the same month of 2013, below a median forecast of 10% growth from a Wall Street Journal poll of 21 economists. That rounded out yet another quarter of weak, single-digit export growth. After years of growing by more than 10% a year, exports grew 5% in the quarter compared to the year before. That’s the fifth straight quarter of single-digit expansion. But the uptick in exports represents a rebound from the first quarter’s 3% contraction. That suggests that, while the export cycle may not be recovering to its post-crisis pace, it is at least perhaps no longer slowing down. Two of Asia’s electronics exporting powerhouses, South Korea and Taiwan, have reported a similar trend. South Korea’s exports grew 3% in the second quarter, up from 2% in the first three months of the year. Taiwan’s also expanded 3%, up from just 1% in the first quarter.
China’s Outward foreign direct investment - According to the United Nations Conference on Trade and Development’s latest World Investment Report Overview 2014, Foreign Direct Investment inflows to China reached $124 billion last year, while outflows rose to $101 billion. The Report anticipates that outflows will surpass inflows within the next few years, changing China from a net recipient of FDI to a net supplier. This change will affect China’s external balance sheet, and its response to financial crises. China’s foreign assets have traditionally been overwhelmingly concentrated in foreign exchange reserves. In 2011, for example, reserves accounted for two-thirds of all the country’s foreign assets. While the central bank’s holdings of foreign currencies (mostly held as U.S. Treasury securities) allowed it to deter any speculative currency attacks, they carried a low rate of return. That return fell even further during and after the global financial crisis as the Federal Reserve drove down interest rates, both short- and long-term. Therefore, China’s assets have not been very profitable. A very large proportion of China’s foreign liabilities, on the other hand, has consisted largely of FDI; in 2011, the share of FDI in foreign liabilities was 59%. These investments were very profitable for the foreign firms that held them, producing a substantial stream of income. Consequently, as Yu Yongding, director of the Institute of World Economics and Politics at the Chinese Academy of Social Sciences has emphasized, China’s net return on international investments has usually been negative, despite its status as a net international creditor. China’s net international investment position in 2011 represented +21% of its GDP, but it recorded a negative net primary income flow of about -1% of its GDP.
The Renminbi’s Grand Tour Barry Eichengreen - Barry Eichengreen doubts that China's designation of clearing banks in Europe will boost its currency's global role. - European and Chinese officials have made two notable announcements in recent weeks. On June 18, China’s second largest financial institution, China Construction Bank, was designated as the official renminbi clearing bank for London. The next day, the Frankfurt branch of the Bank of China, the country’s largest commercial bank, received the same designation for the eurozone. Both announcements were greeted with great acclaim. British Chancellor George Osborne hailed the creation of a London clearing bank as “hugely important” for the financial future of the City. Joachim Nagel of the German Bundesbank lauded the Bank of China announcement as a “milestone on the road toward creating a renminbi trading center in Frankfurt.” We should expect these kinds of enthusiastic pronouncements from European officials, who are desperate for good news, whatever its source. But should the rest of us care? After all, banks, firms, and even individuals already can buy renminbi for their pounds and euros. A range of financial institutions, both locally and in Hong Kong, have long stood ready to provide this service. The only difference is that the two big Chinese banks, when doing business in London and Frankfurt, will be permitted to purchase renminbi in China itself when their foreign customers demand it. The People’s Bank of China (PBOC) will give them a quota for this purpose. Other banks, when seeking to provide renminbi to their clients, are limited to bidding for the fixed supplies that circulate offshore. This raises their costs and limits demand for their services. Thus, by permitting two clearing banks to access renminbi onshore, Chinese officials are effectively subsidizing their London and Frankfurt operations and encouraging direct sterling and euro trades.
China President Warns Conflict With America Would Be "Global Disaster" -- While recent US relations with Russia plumbed lows unseen since the Cold War, at the same time "succeeding" in cementing relations between Russia and China, the so-called Eurasian, anti-Petrodollar axis, and leading to an accelerated groundbreaking natgas deal between Kremlin and Beijing, at least the department of state had managed to not completely alienate China. Which maybe why China just issued a rather out of place tongue-in-cheek warning overnight, when China’s President Xi Jinping called for greater military communication with the U.S., saying as he opened high-level talks between the two countries that any conflict would be a global disaster.
Beijing, Seoul agree to direct trade in national currencies - China designated a clearing bank in Seoul for yuan transactions in South Korea on Friday, coinciding with a visit by President Xi Jinping, as Beijing promotes greater use of its currency overseas, AFP reports. China's central bank has authorised the Bank of Communications, the country's fifth largest lender, to undertake yuan clearing business in the South Korean capital, the People's Bank of China (PBoC) said in a statement. The announcement came as Chinese President Xi Jinping wrapped up a state visit to South Korea on Friday. China is seeking to make the yuan - also known as the renminbi - used more internationally in keeping with the country's status as the world's second biggest economy behind the United States. A joint communique endorsed Thursday by Xi and his South Korean counterpart Park Geun-Hye also pledged to strengthen efforts to launch direct trading between the yuan and the won.
The Bank of Japan's QE program diverges sharply from other central banks - Many investors seem unaware of just how large Japan's QE program has been relative to other central banks. While the Fed, the ECB, and the BOE have roughly converged to the same level (as a proportion of their GDP), the Bank of Japan's balance sheet is more than double that of its counterparts abroad. The official goal of course is to stimulate credit growth to the private sector by lowering longer term rates and boosting excess reserves in the banking system. The 10-year Japanese government bonds now yield 0.57% and the reserves have indeed spiked. But while we've seen small improvements in bank lending, credit growth in Japan remains tepid. The primary reason for this trend has to do with the lack of demand for credit. Both households and companies are loathe to take on debt. One can't blame them of course - taking on fixed liabilities with looming risks of deflation is dangerous (imagine watching your assets depreciate, while liabilities remain fixed.) And as we saw in the US (see chart), other than during periods of frozen credit markets, quantitative easing has not been shown to be very effective in stimulating credit expansion. As a prerequisite to get people to borrow, one needs a stable inflation rate. And while the BOJ has achieved higher inflation, question linger about its stability. A great deal of the price increases has been achieved by weakening the yen (see post). The yen depreciation however has been halted, with USD/JPY exchange rate remaining remarkably stable. All this will come to a head in October of this year, when growth and in particular the inflation rate will be benchmarked against the BOJ's target levels. If the projections are unsatisfactory, as some expect, the BOJ will be forced to accelerate the quantitative easing program. The already massive divergence between BOJ's balance sheet and that of the other major central banks will increase further.
May machinery orders plunge a record 19.5% - Japan Times - Japan’s core private-sector machinery orders plunged by a record 19.5 percent in May, the government said Thursday, indicating the first consumption tax hike in 17 years on April 1 is affecting the economic outlook by discouraging companies from beefing up investment. The orders, excluding those for ships and from utilities because of their volatility, fell following a seasonally adjusted 9.1 percent drop in April. In March, the orders soared 19.1 percent, the fastest growth since comparable data became available in April 2005, the Cabinet Office said. The value of the orders, widely regarded as a leading indicator of capital spending, slid to ¥685.3 billion, the smallest since January 2013, prompting the government to downgrade its basic assessment of the orders. The office said the orders are at a “standstill in their growth trend,” after saying last month they are “on a growth trend.” Prime Minister Shinzo Abe’s government sees business investment as a pillar of economic growth. The plummet in machinery orders is likely to put a damper on optimism that a robust corporate sector can help ease the negative impact on the economy of the 3-percentage-point tax hike to 8 percent, analysts said. Machinery orders are “very weak” and will “remain weak” for the time being, given a downturn in domestic demand in the wake of the consumption tax increase,
Japan Core Machine Orders Plunge 19.5% In May: Core machine orders in Japan plummeted 19.5 percent on month in May, the Cabinet Office said on Thursday - worth 685.3 billion yen. Marking the highest monthly decline on record, the headline figure catastrophically missed forecasts for an increase of 0.7 percent following the 9.1 percent contraction in April. On a yearly basis, machine orders tumbled 14.3 percent - also well shy of expectations for a gain of 10.1 percent following the 17.6 percent spike in the previous month. Following the release of the data, the Japanese government cut its assessment of core machine orders. The total number of machinery orders, including those volatile ones for ships and from electric power companies, plunged 30.5 percent on month and 2.6 percent on year in May to 2,173.5 billion yen. Manufacturing orders dropped 18.6 percent on month and 3.8 percent on year to 283.5 billion yen in May, while non-manufacturing orders lost 17.8 percent on month and 19.9 percent on year to 427.0 billion yen. Government orders surged 22.4 percent on month and 9.5 percent on year to 363.7 billion yen. Orders from overseas tumbled 45.9 percent on month and 0.2 percent on year to 873.7 billion yen. Orders from agencies added 2.2 percent on month and 9.0 percent on year to 100.9 billion yen.
Japocalypse Now - Machine Orders Crater 19.5%, Biggest Monthly Drop On Record == "Bye, bye, Abe" Just when you thought Japanese macro data couldn't get any worse... it does. Plumbing new depths in the "you can't print your way to prosperity" plan, Japanese Private Sector Machine Orders collapsed 19.5% month-over-month - the largest monthly drop ever (as the dragged-forward pre-tax-hike demand left a hole the size of Fukushima behind it). With Abe's disapproval ratings soaring and inflation surging, hopes for more 'bad news is good news' QQE should be quickly dismissed.
Japan economics minister warns of premature QE exit, sees room for more easing (Reuters) - Japanese Economics Minister Akira Amari warned that it would be premature for the Bank of Japan to consider an exit strategy from its massive stimulus program, voicing hope instead for further monetary easing if achievement of its inflation goal falls behind schedule. Amari also said that while Japan appears to be emerging from years of persistent price declines, it was too early to formally declare a sustained end to deflation with the economic recovery still vulnerable to external shocks. "The BOJ has expressed strong determination that it won't hesitate to take further action if (the timing for meeting the inflation target) is not on schedule," Amari said in an interview at a Reuters Newsmaker event on Friday. "If the BOJ judges that it's not on schedule, I think the central bank will decide on its own (to act)," he said. The central bank has kept policy unchanged since deploying an intense burst of monetary stimulus in April last year, when it pledged to double base money via aggressive asset purchases to accelerate inflation to 2 percent in roughly two years.
Japan’s Current-Account Surplus Masks Export Weakness - Japan posted a fourth straight current-account surplus, as income from overseas investments masks the failure of the yen’s slide to boost exports. The excess in the widest measure of trade was 522.8 billion yen ($5.1 billion) in May, the finance ministry reported in Tokyo today, beating the median forecast of 417.5 billion yen in a Bloomberg survey. Exports rose 2 percent from a year earlier. Export volumes remain under the level when Prime Minister Shinzo Abe came to power in December 2012, despite the yen’s 16 percent slide against the dollar over the period. Abe’s task is to ensure his growth strategy -- the third of his so-called three arrows of Abenomics -- gives companies enough of an edge over overseas rivals to boost outgoing shipments. “The strength of recovery in global demand will play a bigger role than the currency in affecting Japanese exports,” said Koichi Fujishiro, an economist at Dai-ichi Life Research Institute in Tokyo. “Sluggish exports can be attributed to the rising ratio of overseas production.”
Why Hasn't the Yen Depreciation Spurred Japanese Exports? - NY Fed - The Japanese yen depreciated 30 percent from its peak in the fourth quarter of 2011 against its trading partners. This was expected to boost its exports as the lower yen makes Japanese goods more competitive on global markets. Instead, the volume of Japanese exports of goods actually fell by 0.6 percent over this same period, as can be seen in the chart below. Weaker external demand surely contributed to this poor export performance. Yet over the same period, U.S. goods exports grew by more than 6 percent, which suggests that other factors are also at play. In this post, we draw on our recent paper “Importers, Exporters, and Exchange Rate Disconnect” that highlights another channel to help explain these puzzling developments. In that study, we show that a key to understanding why there is low pass-through from exchange rates into export prices is that large exporters are also large importers, so they face offsetting exchange rate effects on their marginal costs. In the case of Japan, the connection between the yen and production costs has been made stronger since the country replaced nuclear power with imported fuels in the aftermath of the 2011 earthquake.
(What’s Left of) Our Economy: TPP Fakeonomics from Asia -- For now, though, let’s turn to the often-delusional world of international economics, especially in the trade field, and spotlight an unusually pathetic example of an Asia trade specialist who doesn’t seem to know the first thing about Asia trade. Although that sounds harsh, it’s hard to conclude anything else from Jayant Menon’s new post for the influential voxeu.com site on why reaching a Trans-Pacific Partnership (TPP) has taken so much longer than the trade deal’s supporters claimed to expect. As Menon says he sees it, one big obstacle is Washington’s refusal to compromise on proposed measures that he describes as completely and unfairly skewed in favor of U.S. interests at the expense of the other countries involved, especially low-ish-income economies like Vietnam and Malaysia. Most of these measures, in turn, involve not traditional trade barriers like tariffs and quotas, but national regulations, policies, and economic structures themselves that often have the effect of interfering with trade, whether they intend to or not. There’s a legitimate debate here: Should most of these so-called invisible, or non-tariff, trade barriers stay in place (because sovereign countries should have every right to govern their own affairs)? Or should they be scrapped dismantled because most of them are unmistakably intended to keep imports out? I believe nearly all the evidence favors the latter view – especially for the protectionist economies of Asia – but that’s not the main problem with Menon’s analysis. Instead, it’s his apparent belief that the TPP will contain provisions that make possible enforcing agreements on these non-tariff barriers. Everything known about U.S. trade deals reveals this assumption to be laughable.
Overcrowded Singapore Spills Into Indonesia, Malaysia - American readers, this being the IPE Zone, I ain't talking about New York-New Jersey-Connecticut. Asian readers, I ain't talking about China-Hong Kong-Macau (the Pearl River Delta) either since the latter two aren't "states." Instead, meet Sijori (Singapore-Johor-Riau) representing the three nation-states of Singapore-Malaysia-Indonesia at the heart of Southeast Asia. I suppose it was inevitable that Singapore would get full up sooner or later. It is the world's second most densely populated country after the principality of Monaco (all 2 sq. km. of it). Sure they've been able to fiddle with this fact at the margins--over 20% of it is now built on reclaimed land, and most people already live in skyscrapers. However, there comes a point when people will no longer put up with ever-increasing costs for ever-shrinking residences. In other words, Singapore may already have hit its limit. Like in the aforementioned Pearl River Delta, the beneficiaries are neighbors of overbuilt areas. Johor, Malaysia everyone knows about since its sultan sold Singapore to the British all those years ago, while Riau Archipelago, Indonesia is more of a recent beneficiary. At any rate, the new trend is for homebuyers to buy in neighboring Malaysia. Like in the US Tri-State Area, people commute across state lines to get to work and come home in the evening:
Currency Reserves Swell in Asia —Asia's central banks snapped up dollars and other currencies in June at the fastest pace since 2011, bringing total foreign-currency reserves to $7.47 trillion, the latest in a series of records, in an effort to fend off the impact of a wave of cheap global capital. According to the latest data, holdings in Hong Kong, Singapore, South Korea and Taiwan all hit new highs, while Japan's reserves rose to $1.28 trillion. Citigroup economists estimate that China will report a record $3.99 trillion in reserves within the next week. The surge in reserves comes as U.S. Treasury Secretary Jacob Lew pressed his Chinese counterparts Tuesday, during a visit to Beijing, to let the yuan rise and fall according to market conditions. Last week, Mr. Lew promised to take China to task for buying up dollars to keep its currency artificially low, arguing that China's rising level of foreign-currency reserves demonstrate that the yuan's value is too low. Asia's big exporters have long bought up dollars to keep their currencies low and stay competitive. In recent years, though, the region's central banks have increasingly used foreign-exchange reserves as a buffer against vast flows of investment money created by central banks' easy-money policies. Quantitative easing by the U.S., Japan and Europe—efforts to pump money into their economies via large-scale purchases of assets such as bonds—has been particularly significant.
India to provide four free vaccines, including rotavirus: India will provide four new vaccines free of cost as part of a programme to reduce child mortality, Prime Minister Narendra Modi has said. They include one for rotavirus, which kills thousands of children a year. The disease causes dehydration and severe diarrhoea. It spreads via contaminated hands and surfaces, and is common in Asia and Africa. The move brings to 13 the number of free vaccines provided against life threatening diseases. "The introduction of four new life-saving vaccines will play a key role in reducing childhood and infant mortality and morbidity in the country," Mr Modi said in a statement. "Many of these vaccines are already available through private practitioners to those who can afford them. The government will now ensure that the benefits of vaccination reach all sections of society, regardless of social and economic status." The four new vaccines will combat rotavirus, rubella, polio and Japanese encephalitis. Diarrhoea caused by rotavirus kills nearly 80,000 children each year and results in up to a million hospital admissions in India, the statement said. Regular outbreaks of encephalitis also kill hundreds of children every year.
Why Does India Need to Revamp its Labor Laws? - While the new Narendra Modi government is unlikely to announce big changes in the country’s strict labor laws in the national budget this week, economists and executives say it needs to move quickly to loosen the laws if it wants to prompt a much-needed jump in investment and job creation. It has been in office just over a month but Mr. Modi’s government has already shown it is ready to tweak the archaic labor laws of Asia’s third largest economy. According to discussion proposals it has placed on the labor ministry’s website, it is considering revamping regulations to allow, among other things, women to work late at night and minimum wages increases with inflation. While the first changes in the laws are aimed at wooing the powerful labor unions, executives are hoping that the next round will be less popular reforms like giving big companies more freedom to hire and fire as they please. “This is just a beginning,” said a senior labor ministry official who asked not to be named. During the spring elections, Mr. Modi’s party, the Bharatiya Janata Party, pledged to create jobs and strive to build India into a manufacturing and export power house like China. If it wants that to happen, then India will — like China — need to create labor laws that make it easier for companies to build massive manufacturing facilities to absorb the country’s ever-expanding workforce. Mr. Modi loosened up local labor laws when he was chief minister of the western state of Gujarat and many expect him to bring the same policies to New Delhi.
This Is Why India Has to Shrink the Subsidy Raj -- Taxes and subsidies are part of every government’s toolkit for tinkering with prices and economic activity. But India tinkers more—and more expensively—than most. A reined-in subsidy bill is on many economists’ wish-lists for the new Indian government’s inaugural budget, which will be unveiled on Thursday. The previous administration, led by the Congress party, budgeted nearly 2.5 trillion rupees, or $41 billion, on fuel, food and fertilizer subsidies for the current fiscal year, which ends in March 2015. That’s nearly 15% of total spending for the year, or almost 2.5% of India’s gross domestic product. This ball of twine won’t likely be untangled in one budget. But here’s an overview of how the major subsidies work, and why economists say rolling them back isn’t only about saving the government money—it’s also about helping some of India’s most important industries grow and invest.
India’s Modi (Barely) Passes His First Big Test on Economic Reform - Narendra Modi and his Bharatiya Janata Party (BJP) rode into office in May on a tidal wave of support created by hopes he would revive India’s stumbling economy. India, once one of the world’s best-performing emerging economies, has witnessed growth shrink under 5% — too low to rescue the hundreds of millions of countrymen still trapped in desperate poverty. Business leaders have had high expectations that Modi would push ahead with the long-stalled but painful reforms necessary to restart the country’s economic miracle. In his first major policy pronouncement, however, Modi indicated change would come — but slowly. On Thursday, Modi’s Finance Minister, Arun Jaitley, presented the new government’s budget in Parliament in New Delhi. Indian budgets are considered a bellwether for the direction of economic policy. What emerged was a very gradualist approach, with some encouraging tidbits, but no signs Modi is in a big rush to remake the Indian economy. The government pledged to open the defense and insurance industries wider to foreign investors, bring down the budget deficit more rapidly, press ahead with much needed tax reform, improve the country’s inadequate infrastructure and support manufacturing to create more jobs. Jaitley also promised an overhaul of costly food and fuel subsidies, which are a huge burden on the strained budget, to make them “more targeted” on the most needy.Yet for a government that has pledged to control spending and unleash the country’s growth potential, the budget was still puffed up with plenty of populist pork. The budget reiterated Modi’s campaign pledge to provide toilets for all. Jaitley also decided to maintain the previous administration’s expensive and controversial program to guarantee jobs for rural workers, though he suggested its oversight would be strengthened to ensure funds got utilized more wisely. On other issues, Jaitley seemed to fudge a bit. Widely criticized efforts by the previous government to impose retrospective taxes scared foreign investors, and though Jaitley said the Modi administration would limit any such taxes and “provide a stable and predictable taxation regime that would be investor-friendly,” he didn’t emphatically close the door on them, either. “Nothing that was announced today marks this government out as being significantly different from the last,”
India's Modi feels heat from credit agencies, markets on budget (Reuters) - New Indian Prime Minister Narendra Modi is under pressure to perform on the economy after a budget packed with ambitious targets met mild scepticism from investors and credit-rating agencies and failed to dispel the latent risk of a downgrade. With varying degrees of severity, Fitch, Moody's and Standard & Poor's all expressed worries that Finance Minister Arun Jaitley's pledge to keep this year's fiscal deficit to 4.1 percent of gross domestic product looked unrealistic. While the budget unveiled a number of measures to attract foreign investment, Jaitley's revenue and growth numbers were predicated on a major revival in private investment across the economy - one that is by no means guaranteed. true The finance minister seemed to recognise the risks to his own forecasts in an interview he gave state broadcaster Doordarshan after the budget speech, saying that the deficit target was a challenge he had accepted with a caveat. "I have told the people that revenues are low, the monsoon is not extremely bright this time - the prospects ... therefore this is a challenging task," Jaitley said.
Tech Frontliners: Bangladesh's Traveling Infoladies - Your feelgood story of the day comes courtesy of Bangladesh's social entrepreneurs known as the "infoladies." Like vast swathes of the developing world, many parts of Bangladesh do not have Internet connections or other things many in the developed world take for granted. However, this does not mean that ICT are not helpful for purposes such as viewing world prices of crops on world markets when deciding what to plant, talking to relatives working abroad as migrant workers, accessing medical information and so forth. What are the needs technologically met by the infoladies? Businessweek has a neat photo essay on this matter: Only 5 million of Bangladesh’s 152 million citizens have regular Internet access. Three-quarters live in rural villages. The Infoladies, a group of about 50 women in their early 20s, travel through the countryside equipped with a laptop computer, a tablet, a smartphone, a digital camera, and a glucometer ministering to the technologically impoverished. The traveling infoladies have become more plentiful from their start as participants in a social entrepreneurship program. Nowadays they move around via bicycle in rural Bangladesh after ICT training to help those who do not have regular telecoms access:
What did $7 billion spent on opium eradication in Afghanistan buy? More opium. - With the outcome of Afghanistan's controversial presidential election still in doubt, and uncertainty over Afghan forces' ability to stand against the Taliban after most US forces withdraw, it's hard to say with certainty what the US-led war there has accomplished, or failed to accomplish.But one thing is clear, as shown by latest quarterly report from the US Special Inspector General on Afghanistan Reconstruction: The $7 billion US program to eradicate poppy cultivation there over the past decade has been a flop. The country is today the world's largest supplier of opium, the purified latex sap from the Papaver somniferum poppy species that is usually then converted into heroin. It accounts for about three-quarters of the global recreational supply, and surging Afghan production is one reason why street heroin prices have been falling across the globe. The latest (United Nations Office of Drugs and Crime) Opium Survey estimates that 209,000 hectares are under opium-poppy cultivation, an all-time high and a 36% increase from 2012.
Inflation Is Rising, But No Sirens Ahead | PIMCO -- Over the secular horizon – the next three to five years – we expect global inflation to remain muted overall, as we think there is still a degree of slack in the global economy. Moreover, supply has increased in certain commodities like crude oil and natural gas, and there have been improvements in production of base metals like nickel. While investors should stay vigilant to the possibility of commodity price spikes or other inflation surprises, our secular base case is for inflation to be modestly higher than current levels. In the developed markets, the U.S. and Europe in particular, inflation is bottoming and poised to move up modestly. We expect inflation in the U.S. to move close to the Federal Reserve’s 2% target, though it is still likely to be relatively low over the secular timeframe. However, we have a slight bias to higher inflation since that is what the Federal Reserve wants – stronger economic growth in the U.S. cannot be achieved without higher inflation. In Europe as well, we should see aggregate inflation move up from the currently very low 0.7% year-over-year rate to a rate north of 1%. This is still well below the European Central Bank’s (ECB) target, and we expect continued stimulative policy from them. In emerging markets (EM), inflation is strongly tied to commodity price movements. Therefore, we expect inflation to remain more volatile in EM than in developed markets over the secular horizon. The New Neutral, and its characteristic lower developed market rates, could see portfolio flows into EM contributing to inflation surprises, if central banks waver in their discipline. In China, however, slowing growth and a need to rebalance and even weaken the currency mean that its economy is unlikely to export inflation to other markets such as the U.S.
Welcome to the Everything Boom, or Maybe the Everything Bubble --In Spain, where there was a debt crisis just two years ago, investors are so eager to buy the government’s bonds that they recently accepted the lowest interest rates since 1789. In New York, the Art Deco office tower at One Wall Street sold in May for $585 million, only three months after the going wisdom in the real estate industry was that it would sell for more like $466 million, the estimate in one industry tip sheet. In France, a cable-television company called Numericable was recently able to borrow $11 billion, the largest junk bond deal on record — and despite the risk usually associated with junk bonds, the interest rate was a low 4.875 percent. Welcome to the Everything Boom — and, quite possibly, the Everything Bubble. Around the world, nearly every asset class is expensive by historical standards. Stocks and bonds; emerging markets and advanced economies; urban office towers and Iowa farmland; you name it, and it is trading at prices that are high by historical standards relative to fundamentals. The inverse of that is relatively low returns for investors.
Central banks ending era of clear promises, return to 'artful' policy: The world's major central banks are returning to a more opaque and artful approach to policymaking, ending a crisis-era experiment with explicit promises that they found risked their credibility and did not substitute for action. From Washington to London to Tokyo, the global shift from transparency to flexibility underscores the challenges central bankers face as they test the limits of what monetary policy can achieve. The return to a more traditional policymaking approach and nuanced statements will challenge the communication skills of central bankers who have been chastened in the last year after some too-specific messages confused and disrupted financial markets. Complicating things on the world stage, the U.S. Federal Reserve and the Bank of England are looking to telegraph plans and conditions for raising interest rates, while the European Central Bank and the Bank of Japan are heading the other way. "Central banking used to be an art," said a senior official of a G7 central bank. "It became less so once, globally, but with what's happened at the Fed and the BoE, it may be back to being an art."
IMF Chief Signals Slight Downgrade To Global Growth Outlook - - International Monetary Fund Managing Director Christine Lagarde indicated a slight reduction to the institution's global growth outlook as investment remains subdued. The global economic outlook to be released later this month would be "slightly different" from previous forecasts, Lagarde said at the Cercle des Economists conference in Aix-en-Provence, France on Sunday. Nonetheless, she said the global activity is expected to gain momentum in the second half of the year and to accelerate further in 2015 after an unexpectedly weak start to 2014. In April, the Washington-based lender projected 3.6 percent growth for 2014 and 3.9 percent growth for 2015. Citing investment shortfalls in virtually all countries, Lagarde said public investment took a hard hit during the sovereign debt crisis in many economies, and private investment has not crowded in. According to Lagarde, public cutbacks in investment are likely to hold back growth prospects. In the emerging market and developing economies, infrastructure constraints are already hurting growth.
Why Will Economic Growth Be Slower in 2060 Across the Globe? - Real Time Economics - WSJ: The global economy is one thing that may not be getting better with time. Aging populations, climate change, decelerating growth in emerging economies and rising inequality threaten to drag down global growth in the next five decades, according to a recent report from the Organization for Economic Cooperation and Development. It projects that the world economy will expand at an annual average 2.4% in 2050 to 2060, notably slower than the 3.6% estimated between 2010 and 2020. Climate change will be a critical factor weighing on global growth, unless steps are taken to reduce carbon dioxide emissions, the OECD report said. By 2060, climate change could curtail South and Southeast Asia’s gross domestic product by nearly 6%, and by 1.5% globally. Heightened income inequality inside advanced economies will prove a challenge to global growth as well, the OECD said. If policies remain unchanged, the average OECD country will face a drastic increase in pretax earnings inequality–by 30%–in 2060, which could hinder growth if such imbalances limit economic opportunities for low-income individuals, the OECD said. Meanwhile, even as inequality grows inside developed nations, the income gap between advanced and emerging economies is expected to shrink. That will likely lead to less economic migration, the OECD said, adding to pressures on growth already caused by aging populations. Such shifts mean the global economy will have to pin its hopes on innovation and investment in skills to drive growth 50 years from now, the OECD said.
Productivity Can Return If The Central Banks Would Give It A Chance -- No lesser mortal than commodity-king Andy Lees (ex-UBS and current manage of ALM Macro) explains that today's declining global productivity is and was always a consequence of government policy of taxing productivity in favor of social transfers. The gradual dumbing down of capitalism and move towards social democracy over the last 50 years relied on building a Ponzi scheme of financial innovation to keep the illusion alive. But, he offers hopefully, system dynamics of the natural environment (how land that was once lost to the desert by over taxing it can be returned to a productive use) offer hope that this ponzi trend can be broken. Simply put, Lees concludes, "the system has to change. The issue is whether government and ultimately society can survive during the change; whether the public can unite behind a leadership that can implement tough decisions and allocate capital productively, or whether further sacrifice will be needed first, and how that sacrifice may come"
Financing still a mystery as Nicaragua unveils details of giant canal — The Chinese tycoon behind a plan to build a mammoth inter-oceanic waterway to compete with the Panama Canal whisked into Nicaragua this week and, in several appearances, including one with President Daniel Ortega, affirmed that “the biggest construction project in the history of mankind” has a green light.In a lengthy appearance on state television Tuesday night, Ortega sat next to Wang Jing, the Chinese telecommunications magnate who’s been pushing the plan, and pledged that the proposed canal “will permit the country to eradicate poverty and misery.” The two promised that environmental damage during construction of the canal _ at 173 miles long, more than three times the length of the one in Panama _ will be minimal. Construction will begin late this year and be finished within five years, they said. As many as 5,100 ships a year would use it to pass between the Atlantic and Pacific oceans.Wang flew into Nicaragua on a private jet over the weekend, and his team has been offering details about the project in a series of appearances that have been live-streamed on the Internet from Nicaraguan state television. The 41-year-old entrepreneur told university students that the project will bring “radical change” to Nicaragua, the Western Hemisphere’s second poorest nation, and spread wealth “to the whole country.”What went completely unanswered were two basic questions: Who’s going to pay for a canal with an estimated cost of $50 billion? Is China’s hidden hand at play?
Violent worker protests in Buenos Aires as Argentina stares second debt default in the face - A protest by Argentine car workers quickly deteriorated into violence on the Panamericana highway leading into Buenos Aires as angry pickets confronted police. The auto part company Lear has announced mass redundancies blaming them on the current recession. Unions say its the fault of the government pandering to American companies in unpopular debt negotiations. Union Secretary Laura Yampo: “This is happening because President Christina Fernandez’s government is doing business and negotiating with imperialists to pay the fraudulent external debt and for this reason it has to maintain good relations with the American company owners.” The government has until July 30 to reach an agreement with hedge funds suing for full repayment of sovereign bonds which the country defaulted on in 2002. It has been holding out but the American Supreme Court where the case was heard ruled in favour of the hedge fund holders.
Employment and Investment: the great Canadian disconnect » Can policies stimulating private investment deliver higher employment? Maybe, but investment and employment have become disconnected recently in Canada. John Taylor has noted a strong negative correlation between investment and the unemployment rate, and argued that higher investment is the best way to reduce unemployment. Paul Krugman has questioned the direction of this causality, and the Canadian evidence seems to be somewhat supportive of his position.The issue of causality aside, a reduction in the unemployment rate does not necessarily lead to an increase in employment, because the unemployed may stop looking for work and leave the labour force. For this reason, economists pay attention to the employment-to-population ratio as a better gauge of labour market conditions (see for example this post by David Andolfatto, and this Maclean’s Econowatch piece by Stephen Gordon). In this post, therefore, we highlight the relationship between investment and the employment-to-population ratio for Canada.
Egypt sharply raises energy prices - FT.com: Egypt on Saturday implemented a long-feared hike in energy prices after the government pledged to reduce a gaping budget deficit by slashing fuel subsidies accounting for a fifth of state spending. The move, long seen as a crucial structural reform, has been repeatedly postponed by successive administrations fearful that it would provoke social unrest in a country with high poverty levels and a foundering economy. Ibrahim Mehleb, reappointed prime minister in the new military-backed government sworn in last month, said it would be a “crime” not to curb the subsidies. Addressing a televised news conference, he said the reform was necessary to free funds for essential services such as health care and education. On Saturday, there were reports of localised strikes by taxi drivers and of angry altercations between passengers and microbus drivers charging higher fares. The price of diesel, used in industry and in public transport, including the microbuses heavily relied upon by the poor, has jumped 64 per cent to 25 cents a litre. The highest price rise was for 80 per cent octane gasoline used by older cars, up 78 per cent to 22 cents per litre. Natural gas prices for a range of industries have also increased by 30 to 70 per cent. Electricity prices are due to start rising from this month with a view to phasing the subsidy out completely over five years according to a separate official
Egypt Raises Fuel Prices 78% Overnight - Egypt's surging budget deficit has hit its limit and the Oil Ministry has decided to cut its $20bn plus fuel subsidies. The result - mainstream fuel prices by up to 78% from midnight on Friday. As Reuters reports, previous governments have failed to curb energy product subsidies, fearing backlash from a public used to cheap fuel. We will wait and see the response but as one analyst noted "It should be noted that the effect of a rise in fuel prices will not affect the poor directly, since they do not own cars..." which makes perfect sense as long as the poor do not use or purchase any item that has fuel in its supply chain - brilliant! The government hopes the fuel subsidy cut will raise 40 billion pounds.
France Assures Push Against Petrodollar Is Not A "Fight Against Dollar Imperialism" - To complete the French triple whammy offensive against the US Dollar this weekend (first, French central banker Noyer suggesting de-dollarisation; second, French oil major Total's CEO "seeing no reason for the Petrodollar"), French finance minister Michel Sapin says "now is the right time to bolster the use of the euro" adding, more ominously for the dollar, "we sell ourselves aircraft in dollars. Is that really necessary? I don’t think so." Careful to avoid upsetting his 'allies' across the pond, Sapin followed up with the slam-dunk diplomacy, "This is not a fight against dollar imperialism," except, of course - that's exactly what it is... just as it was over 40 years ago when the French challenged Nixon.
France lashes out against US dollar, calls for ‘rebalancing’ of world currencies — The French government wants to break the monopoly the dollar has on international transactions after the country’s largest bank, BNP Paribas, was slapped with a record $9 billion fine and a 1-year dollar trading ban. Michel Sapin, the French finance minister, called for a “rebalancing” of the currencies used for global payments, saying the BNP Paribas case should “make us realize the necessity of using a variety of currencies” the Financial Times Financial Times reports. "We [Europeans] are selling to ourselves in dollars, for instance when we sell planes. Is that necessary? I don’t think so. I think a rebalancing is possible and necessary, not just regarding the euro, but also for the big currencies of the emerging countries, which account for more and more of global trade,” the finance minister told the FT at a conference over the weekend. France wants to bring the euro to greater prominence in international trade. Sapin said he would raise the idea on Monday when he meets in Brussels with eurozone finance ministers. BNP was punished for for helping counties like Iran, Sudan, and Cuba process $30 billion in transactions which are illegal under US law, since they violate US sanctions. Starting on January 1, 2015, the bank will not be able to carry out dollar-based transactions for one year.
France Has Hissy Fit Over BNP Paribas Fine and Dollar Dominance - Yves Smith - Here’s the guts of the French compliant, which is that the US is abusing the power of dollar dominance, courtesy the Financial Times:France’s political and business establishment has hit out against the hegemony of the dollar in international transactions after US authorities fined BNP Paribas $9bn for helping countries avoid sanctions.Michel Sapin, the French finance minister, called for a “rebalancing” of the currencies used for global payments, saying the BNP Paribas case should “make us realise the necessity of using a variety of currencies”….Mr Sapin said he would raise the need for a weightier alternative to the dollar with fellow eurozone finance ministers when they meet in Brussels on Monday, although he declined to go into detail about what practical steps might emerge. This talk is a lot of hot air. Mind you, we’ve been critics of US foreign policy, particularly in the Middle East, but the French position is ridiculous. First, BNP Paribas broke US laws. No and, ifs, or buts about it. BNP Paribas made itself subject to US laws by having operations in the US, which were necessary for the bank to have access to Fedwire, the Fed’s system for processing large transactions. Payment system experts like Perry Merhling point out that private inter-bank payment systems also depend on being backstopped by a central bank. Even though the transactions in question originated offshore, they were cleared through BNP’s New York branch
US Set To Alienate Angry Germany Next, As Crackdown Shifts From BNP To Commerzbank, Deutsche Bank - It appears that having pushed France forcefully into the Russia-China Eurasian, and anti-US camp, the US will now do the same with Germany. Because by infuriating the German population with first refusing to return their gold contained (the legend goes) at the New York Fed, and then with scandal after spying scandal, now the time has come to "punish" Germany's largest banks for the same kind of money laundering that BNP was engaged in. As the NYT and Reuters report, the time has come to shift away from the BNP scandal and focus on what will soon be the Commerzbank and Deutsche Bank fallout. According to the NYT, the money laundering crackdown is "bound for another European financial center: Germany. As NYT adds, correctly, "The Commerzbank investigation features an added twist: The bank is 17 percent owned by the German government. It is unclear whether — as in the BNP case, which led French authorities to intervene on the bank’s behalf — the settlement talks could inflame diplomatic tensions between Washington and Berlin."
Premature Retail Spending Hope for France and Italy, Lofty Expectations for Germany - Markit's Eurozone Retail PMI shows Eurozone retail sales flat as declines falls in France and Italy offset German gains. The Markit Eurozone Retail PMI which tracks month-on-month changes in like-for-like retail sales read 50.0 in June, little-changed from May’s 49.9 and indicative of a flat trend in sales. Compared to the situation one year earlier, trade was down moderately during June, according to firms. Commenting on the data, Phil Smith, economist at Markit which compiles the Eurozone Retail PMI survey, said: “The latest retail PMI data show a flat trend in eurozone retail sales forming, a relative positive in the context of the recent prolonged downturn. The stagnation hides a growing divergence in country - level performance, however. The gap between Germany’s headline retail PMI and the average of those for France an d Italy has increased throughout the second quarter to the widest for almost a year. Any hopes that consumer spending in France and Italy had turned the corner are looking a little premature.” Eurozone retail sales were supported by continued growth in Germany, where trade rose sharply on the month and to the greatest extent for almost three-and-a-half years. In stark contrast, France’s retail sector showed renewed weakness as sales there fell solidly, offsetting back-to-back marginal increases in the first two months of the quarter. Moreover, June’s decrease was the sharpest so far in 2014. A deepening downturn was meanwhile seen in Italy, where the rate of decline in sales accelerated for the second straight month to the fastest since February. At the aggregate level, retailers’ purchasing activity followed the trend in sales and was unchanged in June after a fractional decrease mid-quarter. Stocks of items for resale meanwhile rose for the seventh straight month, and at the fastest rate since April 2011. This was largely due to sales being markedly lower than targets on average.
France: The Sick Man of the EU - Let’s start by looking at French GDP and its components. The largest quarterly growth in the last 4 quarters was the .6% in the 2Q13. This is a very weak rate and it occurred nearly a year ago. Since that time, overall growth has been fluctuating around the 0% rate. Household consumption has expanded and contracted in the same number of quarters (2 each) and the -.5% in the first quarter of this year negates the overall growth in this data subset for the last three years. Investment is no better, with that data point printing three quarters of contraction. The only solid point is exports, which have increased. Put bluntly, the GDP accounts are very concerning. Not all is bad from this report, as household income is increasing: In nominal terms, household’s gross disposable income (GDI) upturned in Q1 (+1.3% after -0.3%). Indeed, taxes on income and wealth markedly decreased (-4.1%) following a strong H2 2013 (+1.7% in 2013 Q3 and +5.1% in Q4). This progress resulted notably from measures adopted to enhance the efficiency of taxes in 2013: the de-indexation of the income tax thresholds, the creation of a 45% bracket and the lowering of the family quotient ceiling. Moreover, wages received by households increased at the same rate as at the end of 2013 (+0.5%) and social benefits decelerated slightly (+0.7% after +0.8%). It may take a few more quarters for the change in tax policy to work its way through the French economy. In addition, unemployment is also very high: What we see above is three years of unemployment over 10% -- clearly indicating there is something fundamentally wrong with the French growth picture. And finally, there is the French composite Markit number: The recent Markit report stated that France was indeed the main drag on EU growth. And the above data simply confirm that analysis.
Paris to Tax Empty Offices at 20-40% of Rental Value; Price Crash On the Way - The ideas from France get nuttier and nuttier as time goes by. Via translation from Les Echos, please consider Paris Will Tax Empty Offices. The Paris City Council approved Tuesday a tax on commercial vacant properties. The main objective according to city planners is to encourage the conversion of empty offices into housing, not to "create a new tax". The city plans to tax owners of vacant commercial premises at 20% of the rental value of the first year, 30% the second, 40% the third year, from 1 January 2015. Paris has 18 million square meters of office space, of which 6-7% is vacant, according to the deputy in charge of Housing Ian Brossat. The mayor of Paris, Anne Hidalgo, pledged during his campaign to get at least 200,000 square meters transformation of offices into housing during his term. With this ruling, a price crash in office space lease terms as well as property values is a given. And if a mad dash for the exits ensues (as is highly likely), expect downward price pressures on rental values and condo prices as well.
German exports and imports fall more than expected in May (Reuters) - German exports and imports dropped much more than expected in May, data showed on Tuesday, coming on the heels of other soft indicators that have signalled Europe's largest economy is losing momentum. Exports - the traditional backbone of Germany's economy - struggled last year and fell in three of the first five months this year, weighing on overall growth and making the economy reliant on imports. They, however, slumped in May. Figures from the Federal Statistics Office showed seasonally-adjusted exports fell by 1.1 percent on the month, while imports dropped 3.4 percent, the steepest monthly fall since November 2012. The trade surplus widened to a seasonally adjusted 18.8 billion euros from a revised 17.2 billion in April and compared with a Reuters consensus forecast for 16.4 billion. true "A weak May trade release wraps up an overall disappointing month," said Christian Schulz of Berenberg bank. The news follows signs from other data - such as a slump in industrial output, weak orders and retail sales - that Europe's growth locomotive is in for a weaker second quarter than expected.
Four is a trend? - WHEN do individual pieces of data become a trend? In the past few days, we have seen a surprise 1.3% monthly slump in British factory output, a 1.8% decline in German industrial production, a 1.7% decline in France, and a 1.2% drop in Italy. No one can blame the weather for these numbers, as they did for first-quarter US GDP. European stocks have been weaker, although a cumulative 2.6% drop is hardly a sign of panic. At heart, the issue is the same as it has been for several years. Markets have been buoyed by the activities of central banks which have kept rates at unprecedentedly low levels and bought assets. This has encouraged a rush into higher-yielding or more risky assets.
Merkel goes to China to halt German economic slowdown - The yield spread between US treasuries and German government bonds hit a new high last week (see chart). Was this divergence in rates simply a response to the ECB action last month (see post) in combination with stronger jobs data in the US or is there more to it? Part of the answer has been softer than expected economic data out of Germany. The nation that pulled the euro area out of its recession has been experiencing some headwinds. Germany's recent expansion has been partially driven by exports - both to the Eurozone and to elsewhere. And while the nation's domestic demand remains relatively strong (see German retail PMI), weakness in exports is beginning to show.
Italy faces resistance to softer European spending reforms: Italy and its allies will receive no special leeway in meeting EU budget rules, the influential chairman of eurozone finance ministers said yesterday, as Germany resisted attempts to soft-pedal on long-promised spending reforms. Italy, leading a drive for greater flexibility in the way the rules are applied to encourage economic growth and investment, has the second-highest public debt in the eurozone as a proportion of national output, after Greece. Italian Prime Minister Mateo Renzi, pressing his campaign for greater fiscal flexibility, said all the money governments invested in broadband networks should be stripped out of the calculation of public deficits. “Every euro spent in digital infrastructures must be out of the box,” Renzi said in English at a conference in Venice. Italy opened the first finance ministers’ meeting of its European Union presidency by calling for ‘incentives’ to reform after years of rigid focus on budget austerity. But Rome faced immediate resistance, including from Germany. “Italy is delivering reforms and, as chairman, my goal is to help every country to find incentives to do reforms,” Italian Economy Minister Pier Carlo Padoan told reporters. Padoan chairs meetings of the 28 EU finance ministers, a key forum for any change in the direction of economic policy.
Portugal's Largest Bank Misses Bond Payment; Bonds Collapse - Brussels, we have a problem. As we warned 6 weeks ago, Espirito Santo International SA - is in a "serious financial condition" according to a central bank driven external audit by KPMG identified "irregularities in its accounts." Sure enough, the 'ponzi-like' maneuvers have left the bank unable to pay its bonds as Bloomberg reports bonds plunged to record lows after a parent company delayed payments on short-term notes. More importantly, given the divisively dependent nature of the domestic sovereign bond market (and hence the health of the EU) and its banking system, it is noteworthy that Portuguese bond risk has surged to 4 month highs with the biggest 2-day spike in a year. As one analyst noted, “The bigger question is whether the government will have to get involved,” leaving the EU taxpayer on the hook once again (for fear of M.A.D. threats) as most critically, it "will have to step in to prevent systemic repercussions?"
Portuguese Bank Jitters Intrude on QE-Induced Euphoria - Despite unimpressive and often mixed economic data, market prices in a wide range of financial assets have continued to grind higher. And the results that cheered pundits are hard to square. For instance, Floyd Norris in the New York Times today scratches his head over how inconsistent recent employment gains are with the first quarter GDP contraction at an annualized 2/9% rate. It’s also hard to reconcile with reports of weak retail sales and falling in-store traffic. Similarly, China has become concerned enough about growth that it’s started pump priming again. Even so, car sales dropped by 3.4% in June. And in Japan, machinery orders plunged by 19% in May. And despite the recent discussion of Eurozone recovery, recent reports have put a dent in cheery forecasts. As Ambrose Evans-Pritchard noted: Data released on Thursday showed that industrial output for May fell 1.7pc in France and 1.2pc in Italy. It has fallen for three months in a row in Germany, hit by Russia’s recession and weakness in China and Japan.“The German economy is highly leveraged to world trade and that is in contraction,” “The CPB’s World Trade Monitor has been negative for the past two months on a three-month moving average, and we haven’t seen anything like that since the collapse before the Lehman crisis.” But financial markets have brushed off all sorts of causes for concern: the confrontation over Ukraine, rising hostilities in the Middle East, first in Iraq, and now in Gaza as well, the simmering tension in Asia as China’s expanding territorial claims put it more and more at odds with its neighbors. But the prospect of the failure of a bank in Portugal that is part of a larger conglomerate structure rattled investors yesterday. While the bank, Banco Espírito Santo SA, isn’t systemically important, its rapid deterioration spooked investors:
European Banks Are In Trouble - With Austrian bank contagion impacting European stocks on Friday, we thought it worth a look at the 'recovering-out-of-the-crisis-all-is-well-and-stress-tests-will-prove-it' European banks. It appears, having bid with both hands and feet for Europe's peripheral debt - thus solidifying the very sovereign-financial-system linkages that were the cause of the European crisis contagion - Europe's banks had the jam stolen from their donuts when Mario Draghi did not unveil a massive bond-buying scheme (by which they could offload their modestly haircut collateral at 100c on the euro, raise cash, take profits, and all live happily ever after). A TLTRO is no use to the banks who now know even the first sign of one dumping his domestic bonds will cause this illiquid monstrosity to collapse under its own weight. It is clear - as the following chart shows - that investors are quickly coming to that realization and exiting European bonds in a hurry.
ECB’s Not-So-Targeted Loan Program May Still Deliver - The European Central Bank’s new, targeted lending program doesn’t look all that targeted. Under a plan announced in June, the ECB will make four-year loans available to banks starting in September at a fixed rate of 0.25%. There’s a catch: banks must in turn raise their level of lending to the private sector. The ECB added some details Thursday. Banks must keep lending at or above a benchmark based on loans outstanding through April 2014, or be forced to repay the ECB funds, penalty-free, after two years. Concessions were made for banks that have been reducing the size of their balance sheet. That sets the bar pretty low. And there are no restrictions on what banks actually do with the new ECB cash, they just have to show that lending to the private sector is up, which may happen anyway given expectations for an ongoing recovery in the euro zone. That means banks can still use ECB loans to buy higher-yielding government bonds, known as the carry trade. Even if the program fails to steer much additional credit to the private sector, it may still be effective. With few strings attached, banks have more of an incentive to tap the facility. ECB Mario Draghi pegged a possible maximum take-up of EUR1 trillion. In a sense, this is a euro-zone version of quantitative easing. Central bank money is used to purchase assets, except in the euro zone’s case it is the banks that are doing the actual buying, not the ECB.
Why Are TBTF Banks So Happy With The European Banking Union? - On Tuesday, November 4th of this year, supervision of the Eurozone’s 130 biggest banks, representing 80% of total financial assets, will be passed from national authorities into the welcoming hands of the ECB. From that day on, European banking union will be a reality. The banks love the idea, as do apparently most Eurocrats, Members of the European Parliament, and national leaders. Even Angela Merkel and her government have finally come on board, in exchange for guarantees of “quality surveillance, tighter coordination of economic policies, and more binding agreements.” As for the rest of the inhabitants of the Eurozone – all of whom will be impacted in one way or another – most are blissfully unaware that it is even happening. According to the official story, the citizens of Europe stand to benefit enormously from the banking union since it will impose greater control and tighter regulation of Europe’s banks. It will also save taxpayers from having to fund future bailouts. The only problem is: if the main point of banking union is to protect taxpayers and bank customers, why do the continent’s biggest banks seem so happy? If the last six years have taught us anything, it is that when the big banks win, the rest of us lose. And if the banks lose (which, let’s face it, rarely, if ever, happens these days) the one thing you can guarantee is that they and their powerful lobbying representatives will kick up the mother of all stinks. None of which is happening. Indeed, quite the contrary: rather than seeing the new system as a threat, the banks see it as an immense opportunity.
Bill Black: Merkel’s Pyrrhic Victory over Cameron - The old line that one should be very careful about what one wishes for – for you may receive it applies to Germany’s installation of Jean-Claude Juncker as head of the EU Commission. Germany’s Prime Minister Angela Merkel has just crushed her UK counterpart (David Cameron) by orchestrating a nearly unanimous vote among EU nations to appoint (not, really, “elect”) Juncker as head of the EU Commission (not, really, “Parliament”). The old days of needing to hide Germany’s control of the EU through the façade of a German-French partnership are long gone. EU nations know that there will be a high price to pay for attempting to buck Germany – and that the effort will fail. Cameron’s effort to block Juncker is generally viewed outside of the UK as quixotic and humiliating while Merkel is viewed as reigning supreme and serene. The reaction in the UK, however, to Cameron’s efforts is quite different. Cameron’s efforts are generally viewed favorably and Juncker and Merkel are more unpopular than ever. If a plebiscite were held today the UK would likely vote to leave the EU. Merkel has two self-created strategic problems with regard to the EU that threaten the EU and Germany’s dominance over the EU. First, Merkel engineered Juncker’s appointment not because even she considers him a good leader but as a reward for Juncker’s leading role as austerity’s hit man. As Ambrose Evans-Pritchard wrote recently: Italy’s Beppe Grillo, [has] seiz[ed] on Mr Juncker as the face of the scorched-earth policies that have trapped Europe in a Lost Decade. ‘Wherever Juncker goes in Europe, the grass no longer grows,’ he said.
EU's right to be forgotten: Guardian articles have been hidden by Google. [Following] a European court ruling that individuals had the right to remove material about themselves from search engine results, arrived in the Guardian's inbox this morning, in the form of an automated notification that six Guardian articles have been scrubbed from search results. Three of the articles, dating from 2010, relate to a now-retired Scottish Premier League referee, Dougie McDonald, who was found to have lied about his reasons for granting a penalty in a Celtic v Dundee United match, the backlash to which prompted his resignation. Anyone entering the fairly obvious search term "Dougie McDonald Guardian" into google.com – the US version of Google – will see three Guardian articles about the incident as their first results. Type the exact same phrase into Google.co.uk, however, and the articles have vanished entirely. McDonald's record is swept clean. The Guardian has no form of appeal against parts of its journalism being made all but impossible for most of Europe's 368 million to find. The strange aspect of the ruling is all the content is still there: if you click the links in this article, you can read all the "disappeared" stories on this site. No one has suggested the stories weren't true, fair or accurate. But still they are made hard for anyone to find.
Implementation Of Europe’s ‘Right To Be Forgotten’ About As Absurd As You’d Expect - Last week, Google began the process of erasing links from its search engines in Europe in order to comply with a May ruling from the European Union’s highest courtthat essentially created out of whole cloth a so-called “right to be forgotten.” Under that ruling, European citizens could now demand Google remove search results about them with regard to whether or not the material linked to was true, or even whether or not it would be considered defamatory under the law. As Wired’s Marcus Wohlsen demonstrates, and as probably could have been predicted from the beginning, the entire process is turning into something of a disaster: The recent European Union ruling that granted citizens the “right to be forgotten” from Google’s search results is morphing into a nightmare for the web giant. British news organizations are reporting that Google is now removing links to some of their articles, including stories that involve the disgraceful actions of powerful people. On Wednesday, BBC economics editor Robert Preston said he received a notice from Google informing him that a 2007 blog post he wrote on ex-Merrill Lynch CEO Stan O’Neal would no longer turn up in search results in Europe. Meanwhile, the Guardian reports that it received automated notifications on six articles whose links would be axed from European view. These included stories on a scandalized Scottish Premier League soccer referee, an attorney facing fraud allegations, and, without explanation, a story on French office workers making Post-It art.


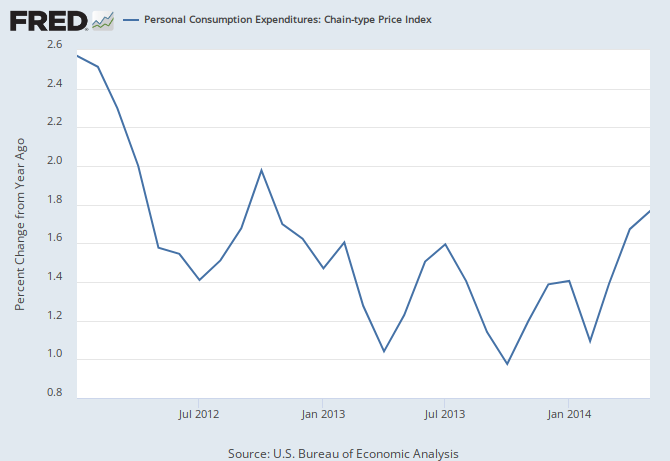
No comments:
Post a Comment