Fed Fine-Tuned Rate Liftoff, Balance Sheet Reduction Strategy in July Meeting - Members of the Federal Reserve’s policy-setting board honed their strategy for eventually hiking interest rates and reducing the central bank’s massive balance sheet at the late-July meeting, minutes show. Without providing specific timing, officials said they would probably target a federal funds rate in the range of 0.25 percentage points “at the time of liftoff and for some time thereafter.” The officials also agreed the Fed’s balance sheet “should be reduced gradually and predictably.” The consensus among members of the Federal Open Markets Committee, which sets most Fed policy, is that interest rates will start moving higher no earlier than mid-2015. Although as economic conditions have improved, a growing campaign has mounted among some FOMC members to move that date up. The minutes released on Wednesday reflect that ongoing debate but gave no indication the policy makers were ready to move up their timetable for raising rates. Instead, the focus at last month’s meeting was in providing more details as to how the Fed will structure what it refers to as its “normalization” policy, or a return to policies that don’t include the unprecedented stimulus programs initiated in the wake of the 2008 financial crisis. While formulating a strategy and deciding on the proper language for raising the key fed funds rate, central bankers acknowledged that more complex measures will also be employed in their effort to maintain stable interest rates once liftoff begins.
FRB: H.4.1 Release--Factors Affecting Reserve Balances--August 21, 2014: Federal Reserve statistical release: Factors Affecting Reserve Balances of Depository Institutions and Condition Statement of Federal Reserve Banks
FOMC Minutes: Most Participants will wait for more data - Most participants want to see more data - and several are still concerned that inflation is too low. From the Fed: Minutes of the Federal Open Market Committee, July 29-30, 2014. Excerpts: With respect to monetary policy over the medium run, participants generally agreed that labor market conditions and inflation had moved closer to the Committee's longer-run objectives in recent months, and most anticipated that progress toward those goals would continue. Moreover, many participants noted that if convergence toward the Committee's objectives occurred more quickly than expected, it might become appropriate to begin removing monetary policy accommodation sooner than they currently anticipated. Indeed, some participants viewed the actual and expected progress toward the Committee's goals as sufficient to call for a relatively prompt move toward reducing policy accommodation to avoid overshooting the Committee's unemployment and inflation objectives over the medium term. These participants were increasingly uncomfortable with the Committee's forward guidance. However, most participants indicated that any change in their expectations for the appropriate timing of the first increase in the federal funds rate would depend on further information on the trajectories of economic activity, the labor market, and inflation. In particular, although participants generally saw the drop in real GDP in the first quarter as transitory, some noted that it increased uncertainty about the outlook, and they were looking to additional data on production, spending, and labor market developments to shed light on the underlying pace of economic growth. Moreover, despite recent inflation developments, several participants continued to believe that inflation was likely to move back to the Committee's objective very slowly, thereby warranting a continuation of highly accommodative policy as long as projected inflation remained below 2 percent and longer-term inflation expectations were well anchored.
Goldman Post-Mortem: Minutes Have More Hawkish Tone - The July FOMC minutes generally had a slightly hawkish tone, warns Goldman's Jan Hatzius, emphasizing that labor market slack had improved faster than expected and that the labor market was now closer to what might be considered normal in the longer run. Overall, these remarks suggest that the change in the labor market language found in the July FOMC statement - shifting focus to broader labor market indicators rather than the unemployment rate specifically - was not intended to be a dovish change, as some commentators thought at the time. Finally, some participants noted some evidence of stretched valuations in specific markets.
Fed to give clearer signal on rates rise - FT.com: The Federal Reserve will provide greater details about the normalisation of monetary policy well before interest rates rise, according to the minutes of its July meeting that also show officials debating the strength of the US jobs market. Members of the Federal Open Market Committee were generally supportive of proposals outlined by Fed staffers for implementing and communicating monetary policy once the Committee begins to tighten the stance of policy. “Participants agreed that the Committee should provide additional information to the public regarding the details of normalisation well before most participants anticipate the first steps in reducing policy accommodation to become appropriate,” said the FOMC minutes. The FOMC minutes “stressed the importance of communicating a clear plan while at the same time noting the importance of maintaining flexibility so that adjustments to the normalisation approach could be made as the situation changed and in light of experience.” The catalyst for tighter monetary policy is the performance of the labour market, which the Fed said had been surprisingly strong over the year. The July meeting minutes revealed policy makers believed the labour market had improved at a faster than anticipated rate. But they remained concerned about “still-elevated levels of long term unemployment and workers employed part time for economic reasons as well as low labour force participation.”
Fed Officials Said Job Gains May Bring Faster Rate Increase - Federal Reserve officials raised the possibility they might raise rates sooner than anticipated, as they neared agreement on an exit strategy, according to minutes of their July meeting. “Many participants noted that if convergence toward the committee’s objectives occurred more quickly than expected, it might become appropriate to begin removing monetary policy accommodation sooner than they currently anticipated,” the minutes, released today in Washington, read. Fed Chair Janet Yellen has committed to use monetary policy to strengthen the labor market so long as inflation remains in check. “Many participants” at the meeting still also saw “a larger gap between current labor market conditions and those consistent with their assessments of normal levels of labor utilization,” the minutes showed.
Fed’s Williams Still Sees Rate Hikes Some Time Next Year - Federal Reserve Bank of San Francisco President John Williams told cable news channel CNBC that he still expects the first central bank increase in short-term interest rates will come around a year down the road. “A rate hike some time in the middle of 2015 seems reasonable” right now based on the current outlook for the economy, Mr. Williams said in the interview Thursday, echoing comments he’s made in recent public remarks. But he also said central bank policy will “depend on how the economy is doing.” If the economy performs better than central bankers now expect, it could bring forward the timing of the Fed’s first move to increase interest rates from their current near zero percent level, the official noted. Mr. Williams was interviewed by the cable channel on the sidelines of the Kansas City Fed‘s annual research conference in Jackson Hole, Wyo. But the speeches will be closely watched for clues about the outlook for monetary policy in the world’s leading economies. Mr. William’s view that the Fed still has time before raising interest rates stands in contrast with the event’s host, Kansas City Fed leader Esther George. She said in a Fox Business Network interview earlier in the day that she’d like to see the Fed consider increasing interest rates pretty soon.
New Fed Exit Strategy Emerges and Foreign Banks Big Winners - Federal Reserve officials haven’t decided when to raise short-term interest rates, but as The Wall Street Journal reported earlier this week, they are closer to finishing a blueprint for how they’ll do it. Minutes of the Fed’s July 29-30 policy meeting laid out fresh details and elaborated on others. Among the big winners in the new approach–as we’ll explain lower in this post–are foreign banks. The most striking feature of the Fed’s strategy is that it keeps in place an effective subsidy that the U.S. central bank is currently paying to foreign banks.Here’s how: In recent years foreign banks have been tapping U.S. money market funds for very cheap short-term loans. Unlike domestic banks, foreign banks don’t have domestic depositors to tap for funds, so they turn elsewhere for dollars. Money market funds make the funds available for a few hundredths of a percentage point. The foreign banks in turn park those loans at the Fed for 0.25% interest. They earn profits on the spread between the cheap cost of funds available from money market funds and the higher rate they get at the Fed. It’s a trade that domestic U.S. banks have been unwilling to make because they have to pay additional fees to the Federal Deposit Insurance Corp. on their borrowings, fees the foreign banks don’t have to pay. “A change in the calculation of the Federal Deposit Insurance Corporation (FDIC) deposit insurance fee in 2011 likely reinforced the relative attractiveness of fed funds borrowing for foreign banks (which are generally not FDIC insured) versus domestic banks,” New York Fed economists found in a study last year. Foreign banks accounted for nearly 60% of fed funds market trading in 2012, according to the New York Fed study. By keeping a quarter-percentage-point spread in place between money market funds and commercial banks with its new system, the Fed is effectively keeping in place a structure that allows foreign banks to profit where domestic U.S. banks can’t.
Why The Fed Is Being Forced To End QE -While the Federal Reserve presents itself as free to do whatever it pleases whenever it pleases, the reality is the Fed's own policies are constraining its choices. Take the taper of U.S. Treasury bond purchases--the heart of quantitative easing (a.k.a. QE or more accurately free money for financiers). You probably know how this works:the U.S. government runs a deficit, as it spends more than it collects in tax revenues. This deficit is funded by the sale of Treasury bonds. The Fed has been creating money out of thin air, a.k.a. printing money, and using this new money to buy Treasu ry bonds. As the Federal deficit shrank, the Fed upped its bond-buying program (QE). As a result, the Fed was buying more bonds than the Treasury was issuing.This graph from from the excellent charting site Market Daily Briefing plots the Fed's bond-buying (printing) and the Federal deficit (issuance ofnew bonds, which is different from rolling over the existing debt as bonds mature and must be replaced with new bonds).
Yellen Channeling Slick as Surrealistic Economy Shows ’67 Claims - The U.S. labor market is looking a little surreal these days. Take the number of workers filing claims forunemployment benefits. As a share of the population, it’s the lowest since at least 1967. Yet the ranks of the long-term unemployed remainlarger than at any time before the 2007-2009 recession. That leads to two starkly different views of the U.S. economy. In one, job growth is increasing along with inflation, leaving Yellen, now at the helm of the U.S. central bank, behind the curve with recession-era monetary policy still in place. The other view portrays a fragile recovery that owes its modest gains to the Fed’s near-zero interest rates. The job-market contrasts are dividing economy-watchers on when the Fed should start raising rates, which it hasn’t done since 2006. “The difference of opinion is whether we’re in a state that’s about as good as it’s going to get or whether we’re in a very poor state, but with good policies and a bit of luck we’ll be able to do a lot better,” Testifying to lawmakers July 15, Yellen said the recovery is incomplete and slow wage growth signals “significant slack” in labor markets. Yellen said the central bank has no “mechanical answer” for when to raise rates, and that before doing so, policy makers must be certain the economy is on a solid footing. While her overall view is positive, she said there are still “mixed signals” and “we have in the past seen sort of false dawns.” The strength in jobs data in recent months is adding to Yellen’s challenge, as a growing chorus of economists says the Fed hazards overshooting its inflation target or stoking bubble-like conditions in risky assets by maintaining such easy monetary policy. The central bank has held its benchmark interestrate near zero since December 2008 and purchased assets that have ballooned its balance sheet to a record $4.4 trillion.
FRB: Speech--Yellen, Labor Market Dynamics and Monetary Policy--August 22, 2014: At the Federal Reserve Bank of Kansas City Economic Symposium, Jackson Hole, Wyoming August 22, 2014
Janet Yellen’s speech at Jackson Hole -- You can read it here. And below is an excerpt: As the recovery progresses, assessments of the degree of remaining slack in the labor market need to become more nuanced because of considerable uncertainty about the level of employment consistent with the Federal Reserve’s dual mandate. Indeed, in its 2012 statement on longer-run goals and monetary policy strategy, the FOMC explicitly recognized that factors determining maximum employment “may change over time and may not be directly measurable,” and that assessments of the level of maximum employment “are necessarily uncertain and subject to revision.”4 Accordingly, the reformulated forward guidance reaffirms the FOMC’s view that policy decisions will not be based on any single indicator, but will instead take into account a wide range of information on the labor market, as well as inflation and financial developments...
Fed Chair Yellen: Unemployment Rate "somewhat overstates" Improvement in Labor Market - From Fed Chair Janet Yellen at Jackson Hole Economic Symposium: Labor Market Dynamics and Monetary Policy. Excerpts: One convenient way to summarize the information contained in a large number of indicators is through the use of so-called factor models. Following this methodology, Federal Reserve Board staff developed a labor market conditions index from 19 labor market indicators, including four I just discussed. This broadly based metric supports the conclusion that the labor market has improved significantly over the past year, but it also suggests that the decline in the unemployment rate over this period somewhat overstates the improvement in overall labor market conditions. More excerpts:
Fed’s Lockhart Tells CNBC He Still Sees First Rate Rise In Mid-2015 - Federal Reserve Bank of Atlanta leader Dennis Lockhart said in an interview with CNBC Friday that he still expects the central bank to begin ending its ultra-easy monetary policy stance around a year from now. “I’m holding to the mid-2015 view” when it comes to the timing of the Fed’s first increase in what are now near zero short-term interest rates, Mr. Lockhart said. “I’m a little bit more cautious then perhaps some others in declaring that the evidence we’ve seen in the last few months of a stronger economy necessarily tells us we’re going to stay on the necessary track to achieve our objectives,” he said. Mr. Lockhart has held this view for some time, but he added that things could change for monetary policy if the economy surprises to the upside. “If we see very, very strong data and it exceeds expectations, it could possibly move forward” the timing of that first increase in short-term rates, the official said. But the policymaker also said he would like to see “several more months of confirming evidence” before changing his outlook for monetary policy. Mr. Lockhart was speaking on the sidelines of the Kansas City Fed’s closely-watched research conference now being held in Jackson Hole, Wyo. His comments to CNBC followed a speech on labor markets by Fed Chairwoman Janet Yellen that offered little strong guidance about the future of monetary policy.
Fed’s Williams: Economy Still Benefiting From ‘Strong’ Fed Support - —Federal Reserve Bank of San Francisco leader John Williams repeated Friday that he believes it will likely be about a year before the central bank ends its ultra-easy money stance. “The economy is still benefiting from strong support from the Fed, and we don’t want to remove that yet,” Mr. Williams said in an interview on Fox Business Network, held on the sidelines of the Kansas City Fed’s annual research conference in Jackson Hole, Wyo. Mr. Williams repeated “it’s still not time yet” to raise rates, saying the Fed can likely hold off from increasing short-term rates from their current near zero levels until the summer of 2015, based on the current outlook. Mr. Williams said that he believes that even with the notable labor market gains that have been made over recent months, there’s still “significant slack” to be found in labor markets, which argues in favor of the Fed offering support.
Keep rates low until the hidden jobless return to work - FT.com: Persistent unemployment will do more lasting damage than a rise in inflation, writes Adam Posen. This year’s annual conference of central bankers in Jackson Hole is focused on the right question: how to determine the extent of labour market slack in the US and other advanced economies. This is the most pressing issue for Janet Yellen, Federal Reserve chairwoman, and her colleagues, given the limits of what monetary policy can do about structural unemployment. There has been a legitimate debate over what lies behind the low US labour force participation rate, which measures the proportion of adults who are either working or looking for work. Some blame demographics, with two large cohorts (ageing baby boomers and women of child-bearing age) both disproportionately likely to leave the workforce. Others take a different view, arguing that wages are being held down in areas of the country where statisticians count more people as unemployed or no longer looking for work.. Still, any decision by the Federal Open Market Committee to hold off raising interest rates will not be made on data alone. At least two other judgments are involved. The first concerns the relative costs of erring in one direction or another, given the unavoidable uncertainty. For most of the past three decades central bankers have assumed that allowing inflation to overshoot would lead to explosive upward spirals in prices. By contrast, overshooting on unemployment was assumed to have little lasting effect. The risks were seen as asymmetric. No chances were to be taken with inflation for the sake of employment. It has become clear, however, that those assumptions should be reversed under conditions of persistent low inflation and slow growth. Even if it overshoots briefly, people are unlikely to expect high inflation to stick in the face of weak demand, particularly for labour; expectations are well-anchored. This was demonstrated by the experience in the UK in 2010-11, when the Bank of England’s Monetary Policy Committee held its fire on interest rates as inflation briefly spiked due to short-term shocks, and inflation came back down nonetheless.
The Fed Should Continue its Support for a Jobs Recovery -- Since the Great Recession began almost 7 years ago, the Fed has been the most proactive and the most effective macroeconomic policy-making institution both in attempting to end the recession and then subsequently trying to spur a full recovery. It’s been the most effective by far in the United States and almost certainly the most effective in the world. The Fed deserves a lot of praise for this stance and the economic evidence argues strongly that it should continue to prioritize boosting employment and spurring a full economic recovery. Specifically, this evidence indicates: The economy continues to have enormous amounts of productive slack – including in the labor market. Until this slack is taken up, wage-driven inflationary pressures just will not materialize. Wage and compensation growth will have to more than double to put significant upward pressure on overall price-growth in coming years – meaning that the Fed should be fully comfortable with nominal compensation growth as high as 4 percent over the next couple of years. This follows from the fact that trend productivity growth is roughly 1.5 percent so that 2.0 to 2.5 percent nominal compensation growth above 1.5 percent implies rising unit labor costs corresponding to 2.0 percent inflation, allowing for an additional to 0.5 compensation growth at the expense of historically thick profit margins. The Fed is commonly described as being tasked with targeting more rapid employment growth and economic activity until the point that such rapid growth begins to spur accelerating inflation. The U.S economy is nowhere near the point where growth is rapid enough to spark accelerating inflation. Instead, we remain far from fully recovered from the Great Recession, and because of this, inflationary pressures just aren’t in the data.
Fed Conference Paper: Concern Over Long-Term U.S. Joblessness Overdone - A new paper to be presented Saturday at the Kansas City Fed’s annual Jackson Hole conference makes a claim likely to raise eyebrows at the meeting: The problem of long-term joblessness following the recession is vastly overstated by a focus on what the authors see as the wrong sort of data. Top Federal Reserve officials, including Fed Chairwoman Janet Yellen, repeatedly have cited elevated numbers of Americans unemployed for 27 weeks or longer as a sign the job market and the economy still operate well below their potential. The Fed said in its July policy statement that “a range of labor market indicators suggests there remains significant underutilization of labor resources.” Central bank officials see that as a key reason for keeping short-term interest rates near zero for a while longer. But the paper’s authors, Jae Song, an economist at the Social Security Administration, and Till von Wachter, a professor at the University of California, Los Angeles, say the Fed is looking for such “slack” or underutilized resources in the wrong places. They use administrative data from the Social Security Administration to measure long-term “non-employment,” which the authors define as the fraction of individuals in the labor force with “non-employment spells lasting at least a calendar year.” Their findings challenge conventional wisdom that the most recent recession’s impact on the job market was particularly damaging compared with other economic slumps in modern history. “In contrast to the behavior of long-term unemployment, long-term non-employment behaved similar in the Great Recession” to previous recessions, they say.
Roundup Of Key Research Papers At Jackson Hole - With all eyes and ears firmly focused Janet Yellen's opening oratory this morning (due at 10ET), the contents of the rest of the conference appear to have been forgotten (and yet in the past have been among the most crucial to comprehend central banks' actions after the fact - forward guidance and QE for 2). As Bloomberg BusinessWeek reports, robots don’t steal jobs, the U.S. labor market is less flexible than it was, and workers haven’t suffered unprecedented periods out of work (and rehiring odds are the same as always), are among the conclusions of key papers being presented at the symposium, along with (unsurprisingly) findings that policymakers would benefit from a better understanding of labor market dynamics. The following is a brief review of their contents...
Federal Reserve earnings climb 13% in second quarter - The Federal Reserve earned $27.3 billion in the second quarter, largely from interest on its huge bond holdings, the central bank said Friday. That's up 13% from the first quarter. The Fed as usual gave most of its earnings, $26.8 billion, to the U.S. Treasury. In the first half of 2014, the Fed earned $57.6 billion, compared to $41.5 billion in the same six months of 2013. Some $51 billion was remitted to the Treasury, a move that helped pare the U.S. budget deficit to $460 billion in the first 10 months of the federal government's 2014 fiscal calendar. The Fed has sharply boosted its earnings over the past few years via interest paid on the trillions of dollars in Treasurys and mortgage-backed securities that the bank has purchased in an effort to stoke faster economic growth. The bank has slowed its purchases since the end of 2013 and expects to stop buying bonds by the fall. The Fed will still continue to earn interest, however, on its huge stockpile of bonds that it will continue to own. Eventually as the bonds reach maturity or are sold, the Fed is expected to start generating losses for an unspecified period.
Activists at Jackson Hole See Recovery on Wall Street, ‘Not My Street’ - A group of activists has descended on the Kansas City Federal Reserve Bank’s annual conference in Jackson Hole, Wyo., to tell central bank officials that any move to raise interest rates soon could wreak havoc on the lives of Americans still struggling with a weak economic recovery. U.S. unemployment has fallen fairly rapidly in recent months, to 6.2% in July, down from its post-recession peak of 10%. However, the activists said those numbers mask much deeper troubles in the country’s poorer neighborhoods. The unemployment rate for African-Americans, for instance, was 11.1% in July. Reggie Rounds, 57 years old, came to the conference from Ferguson, Mo., the site of recent violent protests following the killing of an unarmed teenager by a police officer. During a brief conversation here with Federal Reserve Vice Chairman Stanley Fischer, Mr. Rounds, who is unemployed and says he hasn’t had regular work for years, urged the central bank to keep poor Americans on their minds as they make policy decisions. “I deal with people who have educated themselves. These people, sir, are inundated with student loans. They’re making just not livable wages or not wages at all,” Mr. Rounds told Mr. Fischer. “We’re desperately needing a stimulant into this economy, and job creation, to get us going.” Mr. Fischer responded: “That’s what the Fed has been trying to do and will continue to try to do.”
The Federal Reserve Board Responds to Bankers - Dean Baker - The Washington Post had an article on grassroots efforts to try to influence the Federal Reserve Board's decisions on monetary policy. It would have been helpful if the piece provided more background on the Fed's institutional structure and decision-making process. The Fed's decisions on monetary policy (e.g. raising or lowering interest rates and quantitative easing) are made by the 19 member Federal Reserve Open Market Committee (FOMC). This committee includes seven governors who are appointed by the President and approved by Congress. The term is 14 years, although governors rarely serve out a full term. The other 12 members of the FOMC are the presidents of the district banks. These presidents are essentially appointed by the banks within the district. This structure ensures that the banking industry's concerns will get a full hearing at Fed meetings. The concerns of workers whose jobs and wages depend on the Fed's decisions may not be heard. At one point the article discusses public protests against Paul Volcker's decision to raise interest rates when he was chair of the Fed in the early 1980s. It tells readers that the protests did not affect Volcker's decisions at all. Whether or not this is true, that does not mean that the protests had no impact on the Fed's actions. Volcker had to get the support of the majority of the FOMC to get his way on monetary policy. If the protests affected the views of other members then Volcker would have been forced to take these views into account in setting policy. For this reason the focus on Volcker badly misleads readers on the potential impact of public protests.
Fed’s Plosser Warns Very-Easy Money Policy Increasingly Risky - Federal Reserve Bank of Philadelphia President Charles Plosser said on Thursday that the U.S. central bank’s expectation of maintaining its near-zero-percent interest rate stance well into the future is “risky policy.” Speaking in a CNBC interview, Mr. Plosser, a persistent critic of Fed actions, said he remains uncomfortable with the central bank telling markets and others that it will carry on with its very easy money policy well into the future. Most Fed officials currently expect to maintain very low interest rates into 2015. In a CNBC interview earlier Thursday, San Francisco Fed chief John Williams said he doesn’t expect the Fed to raise rates until the middle of next year. “If the Fed gets this wrong here, I mean if [rate increases are] off by six months or a year, is there real danger to the economy? There could be,” Mr. Plosser said. He again argued that instead of offering what appears to be a calendar-based commitment to monetary policy actions, the Fed should instead better describe the economic landscape that will drive it to raise rates. . It’s “probably inappropriate” at this time for the Fed to be making such assurances about the future of monetary policy, Mr. Plosser said. “We need to be responsive to the data, not to some calendar or point in time,” he explained.
Hawks Crying Wolf - Paul Krugman -- Binyamin Appelbaum: An increasingly vocal minority of Federal Reserve officials want the central bank to retreat more quickly from its stimulus campaign, arguing that the bank has largely exhausted its ability to improve economic conditions. Is this really true? Of course, they are being very vocal — but when didn’t they call for monetary tightening? The article highlights Charles Plosser of the Philadephia Fed; if you’ve been following these things, you know that Plosser has been warning about imminent inflation since the beginning of the crisis. He did it in 2008; he did it in 2009; he did it in 2010; he did it in 2011; I’m getting tired here, but you can easily find him doing the same in 2012 and 2013. And he has of course been wrong all the way — but he’s doing it again. This is news? The real story here is the remarkable resilience of inflation panic: people who worry about inflation never seem daunted in the least by the repeated failure of their predictions. It’s an interesting question why.
Inflation Erodes Assets: That’s Why Some People Fear It - Paulie Walnuts Krugman has a nice piece out this AM on why the central bank should downweight the views of those who’ve been wrongly crying hawk wolf re inflation for years now. I’ve made the same point as the din of voices urging the Fed to pre-emptively tighten is getting louder.One point to add: Paul writes that it’s “less clear” why “the inflation obsession is as closely associated with conservative politics as demands for lower taxes on capital gains.”I think at least part of the answer is a rule of thumb I’ve been mentally toting around since I read about it 30 years ago: unemployment hurts the poor, inflation hurts the rich.Obviously, like any such rule, it’s overstated. High and rising inflation hurts everybody, and capital income has taken big hits in recent recessions (though the top 1% has consistently bounced back well ahead of the rest). But inflation erodes asset values, not unlike a tax on capital gains, and generally speaking, those who depend on portfolios vs. paychecks are going to be less sensitive to unemployment. So, as Paul stresses, they have a class interest to advocate for heading off inflation, even if it’s a phantom menace, while at the same time worrying not so much about the impact of tightening on those who depend on a tight job market.
Fed Dissenters Increasingly Vocal About Inflation Fears - — An increasingly vocal minority of Federal Reserve officials want the central bank to retreat more quickly from its stimulus campaign, arguing that the bank has largely exhausted its ability to improve economic conditions.The debate, reflected in an account of the Fed’s most recent policy-making meeting published on Wednesday, is likely to dominate the gathering of central bankers and economists at Jackson Hole, Wyo., Thursday through Saturday. Fed officials are convinced that the economy is gaining strength after the years of false starts, but a majority of policy makers, led by the chairwoman, Janet L. Yellen, favors a slow retreat from the Fed’s efforts to encourage job creation. They note that millions of people still cannot find jobs, while inflation remains relatively weak. At the July meeting, however, a number of officials described a growing risk that the Fed’s control of inflation is being loosened by its focus on job creation. They note that the economy has improved more quickly than expected in recent months. The remaining damage caused by the Great Recession, in this view, can no longer be repaired by keeping interest rates low through the Fed’s primary policy tool.
Ahead of Jackson Hole, July Inflation Remained Subdued - The Bureau of Labor Statistics released the July CPI data this morning. Year-over-year unadjusted Headline CPI came in at 1.99%, which the BLS rounds to 2.0%, little unchanged from the previous month' 2.07%. Year-over-year Core CPI (ex Food and Energy) came in at 1.86% (rounded to 1.9%), essentially unchanged from the previous month's 1.93%. The non-seasonally adjusted month-over-month Headline and Core numbers were fractionally negative (-0.04% and -0.01%, respectively. On a seasonally-adjusted basis, the all items index posted its smallest increase since February. When we dig deeper, we see that food prices rose but were offset by declines in the energy subcomponents. Inflation remains subdued as we approach the Fed's Jackson Hole summit later this week. Here is the introduction from the BLS summary, which leads with the seasonally adjusted data monthly data: The all items index posted its smallest seasonally adjusted increase since February; the indexes for shelter and food rose, but were partially offset by declines in the energy index and the index for airline fares. The food index rose 0.4 percent in July, with the food at home index also rising 0.4 percent after being unchanged in June. The decrease in the energy index was its first since March and featured declines in the indexes of all the major energy components. The index for all items less food and energy increased 0.1 percent in July, the same increase as in June. Along with the shelter index, the indexes for medical care, new vehicles, personal care, and apparel all increased in July. Along with the index for airline fares, the indexes for recreation, for used cars and trucks, for household furnishings and operations, and for tobacco all declined in July. The all items index increased 2.0 percent over the last 12 months, a slight decline from the 2.1 percent figure for the 12 months ending June. The index for all items less food and energy rose 1.9 percent over the last 12 months, the same figure as for the 12 months ending June. The energy index has increased 2.6 percent, and the food index has risen 2.5 percent over the span. [More…] The first chart is an overlay of Headline CPI and Core CPI (the latter excludes Food and Energy) since the turn of the century. I've highlighted 2 to 2.5 percent range, which the Federal Reserve currently targets for the CPI's cousin index, the BEA's Personal Consumptions Expenditures (PCE) price index.
Key Measures Show Low Inflation in July - The Cleveland Fed released the median CPI and the trimmed-mean CPI this morning: According to the Federal Reserve Bank of Cleveland, the median Consumer Price Index rose 0.1% (1.5% annualized rate) in July. The 16% trimmed-mean Consumer Price Index also increased 0.1% (1.6% annualized rate) during the month. The median CPI and 16% trimmed-mean CPI are measures of core inflation calculated by the Federal Reserve Bank of Cleveland based on data released in the Bureau of Labor Statistics' (BLS) monthly CPI report.Earlier today, the BLS reported that the seasonally adjusted CPI for all urban consumers rose 0.1% (1.1% annualized rate) in July. The CPI less food and energy increased 0.1% (1.2% annualized rate) on a seasonally adjusted basis. Note: The Cleveland Fed has the median CPI details for July here.
Grand Central: Crude Oil Price Drop Takes Pressure Off the Fed - Nymex crude oil futures have dropped 3% in two days to $94.48 per barrel and they’re down 10% from a year ago. The bad news in this drop is the implication of soft global demand when many economists were looking for a lift in worldwide economic growth. The good news is that markets have weathered months of grisly conflicts in the Middle East and Ukraine and the supply worries that come with the shooting. If Iraqi and Kurdish forces continue to push back Islamic State forces which are deeply opposed to advanced economy values, or if Russian and Ukrainian adversaries cool off, market angst about Middle East and Russian energy supplies could further dissipate. Whether looked at from the supply side or demand side, the energy price drop takes some pressure off the Federal Reserve and other central banks to move toward tighter monetary policies. The U.S. consumer price index rose 0.1% in July from a month earlier on a seasonally adjusted basis and was up 2% from a year earlier. Given the recent descent of crude, headline consumer prices in August appear on a path for another tepid reading.
Deutsche Bank: Ignoring food price pressures could be a mistake - Economists and central bankers tend to be less focused on what consumers pay at the grocery store because food and energy prices have historically been more volatile - remember, it's just "noise". However what they can't ignore is how shoppers view inflation - i.e. inflation expectations. And food prices have a significant impact on households' views on future inflation. Deutsche Bank: - ... food prices factor significantly into households’ perceptions of overall price pressures. This is illustrated in the following figure, which shows year-ahead inflation expectations from the University of Michigan Survey of Consumer Sentiment versus CPI food. In fact, it is worth noting that CPI food demonstrates a higher degree of correlation with one-year price expectations than either the headline or core metrics — and it similarly surpasses energy, core goods, core services and shelter. ... while forecasters are focusing on service-sector inflation in general and shelter inflation more specifically, they should be careful to not ignore mounting food price pressures, because this category could provide important insight toward the evolution of inflation expectations. If food price inflation accelerates, as we project, the stability of inflation expectations could degrade - and this would be a vexing development for monetary policymakers.
Why inflation remains best way to avoid stagnation - FT.com: People who were not born when the financial crisis began are now old enough to read about it. Yet no matter how stale our economic troubles feel, they manage to linger. Given the severity of the crisis and the inadequacy of the policy response, it should be no surprise that recovery has been slow and anaemic: that is what economic history always suggested. Yet some economists are growing disheartened. If secular stagnation is a real risk, we need policies to address it. One approach is to try to change the forces of supply and demand to boost the demand for cash to invest, while stemming the supply of savings, and reducing the bias towards super-safe assets. This looks tricky. Much policy has pushed in the opposite direction. Consider the austerity drive and long-term goals to reduce government debt burdens; this reduces the supply of safe assets and pushes down real rates. Or the tendency in the UK to push pension risk away from companies and the government, and towards individuals; this encourages extra saving, just in case. Or the way in which (understandably) regulators insist that banks and pension funds hold more safe assets; again, this increases the demand for safe assets and pushes down real interest rates. To reverse all these policies, sacrificing microeconomic particulars for a rather abstract macroeconomic hunch, looks like a hard sell. There is a simple alternative, albeit one that carries risks. Central bank targets for inflation should be raised to 4 per cent. A credible higher inflation target would provide immediate stimulus (who wants to squirrel away money that is eroding at 4 per cent a year?) and would give central banks more leeway to cut real rates in future. If equilibrium real interest rates are zero, that might not matter when central banks can produce real rates of minus 4 per cent.
Nobel guru fears it may be nigh impossible to stop deflation -- Christopher Sims – a monetary expert, who now thinks money indicators have been rendered "essentially obsolete" by modern finance – says it may be impossible to reverse deflation in the Western economies by any normal means, in which case we are in trouble. He argues that the public (including investors) are convinced that there will have to be some sort of payback for all the debts accumulated during the great era of leverage and excess. They have "internalised" the prospect of future tax rises and spending that will make them feel poorer. "Some 60pc of people in the US say they doubt there will be any government benefits for them when they retire, and 60pc of those already retired think their benefits will be reduced," he said. This has powerful implications. Many of these people are retrenching pre-emptively, en masse, in most of the mature industrial economies. They are discounting a "future stream of primary surpluses". By the same token businesses are putting off investment and hoarding cash in anticipation of a hit to come. We may be deluding ourselves in thinking that companies will soon be confident enough to let rip with a fresh burst of spending and investment. They may just sit on their money for year after year. If this is broadly true, it means that any use of fiscal stimulus will be neutralised by the countervailing actions of taxpayers, and may even be a net negative. Deficits become "deflationary", contrary to standard textbook theory or populist assumptions, and threaten a self-fulfilling effect that becomes almost impossible to stop over time. Prof Sims, who won the Nobel Prize in 2011 for studying "cause and effect in the macroeconomy", says monetary policy cannot do the trick either once interest rates have dropped to zero. He dismisses the monetary effects of quantitative easing as trivial. At best, he says, QE is a bluff intended to show resolve and change psychology.
Buiter on helicopter drops -- Some further, further reading on Friday — a new paper from Citi’s Willem Buiter, on why helicopter drops of money always work. From the abstract (our emphasis): Three conditions must be satisfied for helicopter money always to boost aggregate demand. First, there must be benefits from holding fiat base money other than its pecuniary rate of return. Second, fiat base money is irredeemable – viewed as an asset by the holder but not as a liability by the issuer. Third, the price of money is positive. Given these three conditions, there always exists – even in a permanent liquidity trap – a combined monetary and fiscal policy action that boosts private demand – in principle without limit. Deflation, ‘lowflation’ and secular stagnation are therefore unnecessary. They are policy choices. The full paper is here.
Deconstructing Fed Vice Chair Stanley Fischer on the Disappointing Global Recovery - Gerald Epstein, of the Political Economy Research Institute (PERI), interviewed by Jessica Desvarieux of the Real News Network:
Can central bankers succeed in getting global economy back on track? - Why is the world economy still so weak and can anything more be done to accelerate growth?... This week brought another slew of disappointing figures from Europe and Japan, the weakest links in the world economy since the collapse of Lehman Brothers, despite the fact that the financial crisis originated in the United States. But even in the United States, Britain and China, where growth appeared to be accelerating before the summer, the latest statistics — disappointing retail sales in the United States, the weakest wage figures on record in Britain and the biggest decline in credit in China since 2009 — suggested that the recovery may be running out of steam. As Stanley Fischer, the new vice chairman of the Federal Reserve Board, lamented on August 11 in his first major policy speech: “Year after year, we have had to explain from mid-year onwards why the global growth rate has been lower than predicted as little as two quarters back. … This pattern of disappointment and downward revision sets up the first, and the basic, challenge on the list of issues policymakers face in moving ahead: restoring growth, if that is possible.”
The central message of Fischer’s speech — that central bankers and governments should try even harder than they have in the past five years to support economic growth — was closely echoed by Mark Carney, the governor of the Bank of England, at his quarterly press conference two days later.
The Treasury and the Fed are at Loggerheads over QE...In my last post on QE, I quoted a paper by James Hamilton and Cynthia Wu that provides some empirical evidence for the importance of the asset composition of the Fed's balance sheet and its effect on the term structure of interest rates. They have posted their data online and it makes for interesting bedtime reading. Hamilton and Wu combined their data with evidence from the yield curve. They found that qualitative easing can be effective at the lower bound and that ... buying $400 billion in long-term maturities outright with newly created reserves, ... could reduce the 10-year rate by 13 basis points without raising short-term yields. To construct these estimates, they used a theoretical model developed by Vayanos and Vila which assumes that there are investors who have a 'preferred habitat'. The Hamilton Wu results are important. I ran some regressions of term premiums on bond supply by maturity, using their data, and I found the same orders of magnitude in the response of interest rates that they found. But there is an interesting sub-text to their analysis discussed in Section 8 of their paper. The Fed and the Treasury have been following conflicting policies. David Beckworth on his blog in 2012 makes the same point.
Treasury Curve Collapses To Flattest Since Jan 2009 -- The spread between 30Y and 5Y Treasury yields has collapsed to 151bps, its lowest since January 2009. It seems expectations for the exuberance of the business cycle expansion are a little underwhelming. This is half the Treasury curves peak steepness (hope) seen at the end of 2010...
Monetary policy cannot solve secular stagnation alone - If there is an insufficiency of demand even in normal times, this problem would need to be addressed with structural policies. The answer can hardly be more bubbles so that inflation rates go up. Using monetary policy to drive the real interest rate permanently to low, or perhaps, even negative rates is difficult and can create significant distortions in the economy. This point can be illustrated by the US example: while monetary policy has been very supportive and has helped avoid a slide into deflation during the crisis, arguably before the crisis it contributed to the build-up to many of the problems in the US economy. The massive bubbles that resulted from the combination of lax monetary policy and an inadequate financial regulatory system should certainly be considered a problem, not a solution. A perhaps more important part of the solution to the current problem has been the acceptance of structural policies that are more conducive to a recovery: the US recovery has been helped by very significant debt reductions in the household sector thanks to non-recourse mortgages and similar things. More importantly, the banking system has been relatively quickly cleaned up, which also helped the recovery.
In Which I Make Myself Very Confused About Cyclical Recovery -- DeLong - Will somebody please tell me that I have made a gross arithmetic error in what is below, and can be much more optimistic? Let me start with this graph: Perhaps a few more 25-54 year olds are in school today than in 2000 or 2007. But only a few. As best as I can see, no more 25-54 year olds are having kids than in 2000 or 2007. And only a very few more 25-54 year olds are staying home to care for elderly relatives than in 2000 or 2007. But I look at this graph--my standard graph for trying to ascertain the cyclical- and hysteresis- state of the U.S. labor market without confusing the demographic effects of population aging with those of the Great Recession Lesser Depression of 2008-?. I see a huge excess decline in participation driven by "hysteresis" that is permanent damage to economic potential produced by the catastrophe. And I see, over and above that, only 1/3 of the work accomplished of cyclical recovery back to a normal spread between prime-aged participation and prime-aged employment.
The Declining U.S. Reliance on Foreign Investors - NY Fed - The United States has been borrowing from the rest of the world since the mid-1980s. From 2000 to 2008, this borrowing averaged over $600 billion per year, which translates into U.S. spending exceeding income by almost 5.0 percent of GDP. Borrowing fell during the recent recession, as would be expected, and then rebounded with the recovery. Since 2011, however, borrowing has trended down and fell to 2.4 percent of GDP in 2013, the smallest amount as a share of GDP since 1997. A reduced dependency on foreign funds can be viewed as a favorable development to the extent that it reflects an improvement in the fiscal balance to a more easily sustainable level. However, it also reflects the lackluster recovery in residential investment, which is one reason the economy has yet to get back to its full operating potential. The amount borrowed from the rest of the world is measured by the current account balance, which is the broadest measure of cross-border transactions. As seen in the chart below, the United States was spending substantially above its income before the recession, to the tune of 5.8 percent of GDP in 2006. The amount of borrowing fell during the recession and started to rebound in 2010, but borrowing has since trended down.
In Iraq, U.S. is spending millions to blow up captured American war machines - Last week was a weird one for American military hardware. In the United States, Mine-Resistant Ambush Protected vehicles (MRAPs), AR-15s and camouflage body armor all made an appearance on the streets of a suburb in the heartland, helping to give a tense situation the push needed to turn into a week of riots. American citizens in Ferguson, Missouri, feeling they were being occupied by a foreign army, rather than their friendly neighborhood cop on the beat. MRAPs didn’t get a better rap overseas, either. In what’s still being called Iraq — at least for the sake of convenience — the U.S. Air Force has resumed bombing missions in the northern part of the “country.” The aim of the missions is stated as being the defense of a minority group known as the Yazidis, who practice a religion unique to themselves and are under threat by the Islamic State, a jihadi group that controls a large chunk of territory in Syria and Iraq. The extremist cadre Islamic State — which has declared itself to be the new caliphate, representing God’s will on earth — has had an incredible string of military successes over the last few months. They’ve taken a lot of territory. They’ve slaughtered a lot of people, including civilians. They’ve imposed what they say is Islamic law — though many Islamic scholars would beg to disagree. And Islamic State’s captured an enormous amount of U.S. weaponry, originally intended for the rebuilt Iraqi Army. You know — the one that collapsed in terror in front of the Islamic State, back when they were just ISIL? The ones who dropped their uniforms, and rifles and ran away?
Krugman: War Is BAD for the Economy -- We pointed out in 2009 that war is bad for the American economy. We noted in 2012 that military spending as “stimulus” can’t work, because conditions are different than they were in World War II. We’ve reported for years that economists (like Paul Krugman) who believe that war stimulates the economy are wrong. We exhaustively debunked this claim again just last month. Mr. Krugman has now changed his mind. He wrote yesterday in the New York Times:If you’re a modern, wealthy nation, however, war — even easy, victorious war — doesn’t pay. And this has been true for a long time. In his famous 1910 book “The Great Illusion,” the British journalist Norman Angell argued that “military power is socially and economically futile.” As he pointed out, in an interdependent world (which already existed in the age of steamships, railroads, and the telegraph), war would necessarily inflict severe economic harm even on the victor. Furthermore, it’s very hard to extract golden eggs from sophisticated economies without killing the goose in the process.We might add that modern war is very, very expensive. For example, by any estimate the eventual costs (including things like veterans’ care) of the Iraq war will end up being well over $1 trillion, that is, many times Iraq’s entire G.D.P.
The Bomber Will Always Get Funded -- and Used -- Think of it this way: first Washington provides the Iraqi military with training and massive infusions of military equipment to the tune of $25 billion. Next that military, faced with its first serious opposition, the militants of the Islamic State of Iraq and Syria (ISIS), numbering in the thousands against security forces in the hundreds of thousands, collapses. In June, two full divisions, 30,000 Iraqi troops, flee the city of Mosul, abandoning their posts in the face of the advance of ISIS fighters. In all, four divisions of the country’s 14-division army disintegrate throughout the north. Left behind is a massive trove of U.S.-supplied weaponry, including 1,500 Humvees, 52 U.S.-made M198 howitzers, tanks, trucks, rifles, and ammunition. ISIS militants, who seem remarkably capable of operating such equipment without an American trainer or adviser in sight, then turn some of that weaponry (as well as weapons captured from the Syrian military) on U.S.-backed forces, including, in the north, Kurdish pesh merga militias. (They have evidently even brought tanks into play near the Turkish border.) To save its Kurdish allies from disaster, the Obama administration then sends in the U.S. Air Force (both fighter-bombers and Predator drones) in close support of the beleaguered Kurdish forces. Doing what air power seems most capable of, the planes begin destroying the armored vehicles and artillery pieces ISIS has brought to bear in Kurdish areas. In other words, U.S. air power is called in to take out U.S. military equipment (and anyone manning it). To complete the circle, both the Iraqis defending Baghdad and the Kurds now desperately need new weaponry, and Washington is already starting to supply it in the north and soon undoubtedly in the south as well. Can there be any question that this is a win-win situation for the American arms industry and the military-industrial complex? It gives new meaning to American bombing campaigns that, since 1991, have proven to be disastrous regional destabilizers. Think of this as an innovative profit center for American industry and a jobs-creation exercise of the first order: we provide the weapons, we destroy them, then we provide more.
How a Widely Beloved Tax Deduction Really Just Benefits the Well-Off and Exacerbates Inequality: Anyone who is concerned about the country’s growing inequality crisis should be pushing for reform of the feature of the U.S. tax code known as the mortgage interest deduction. Not only does this wasteful tax subsidy primarily benefit the richest Americans, it also costs the U.S. Treasury between $70 and $100 billion annually in revenue, making it the third largest deduction on the books. National opinion polls indicate that between 60 and 90 percent of Americans support the mortgage interest deduction (MID), which allows taxpayers to deduct interest on $1.1 million in mortgages on primary residences, vacation homes and even yachts. And yet because of the way this tax subsidy is structured most U.S. homeowners receive very little if any benefit from it. Indeed, in its current form, the MID’s biggest beneficiaries are the real estate industry and its wealthiest customers—U.S. homeowners who have gross adjusted gross incomes of more than $100,000, and who in 2012 consumed a whopping 77 percent of the benefits. Homeowners from the top two percent of American taxpayers who earn more than $200,000 (or married couples who earn more than $250,000) annually fared the best: They gobbled up 35 percent of the subsidy.
Paul Ryan: I’m Keeping Tax Cuts for the Rich -- Reducing the top tax rate has been the Republican Party’s highest priority for a quarter century. Since the 2012 election, a handful of apostates have gently urged it to change course. Paul Ryan, who remains the most powerful figure within the party, has just given an interview to John McCormack, and he has a message for the reformers who want to change course: forget it. Ryan, reports McCormack, “made it clear that he disagrees with some conservatives who are willing to accept a high top tax rate in order to increase the child tax credit.” If the significance of Ryan’s statement here doesn’t immediately strike you, let me explain. Starting in the early 1980s, supply-side economics emerged as the Republican Party’s policy doctrine. Supply-side economics holds that the marginal tax rates hold the key to economic growth, and thus that even tiny changes to tax rates can unleash massive changes to economic performance. Accordingly, Republicans have valued low tax rates over absolutely everything else. In the 2012 election, that commitment turned into a major liability for the party. The Republican ticket ran on a somewhat sketchily defined plan to reform taxes, the impact of which would have been to give the richest one percent a huge tax cut and impose higher taxes on the middle class. The Republican reformers have, correctly, identified the commitment to reducing the top tax rate as a major (or even the major) liability. The most important theme of “Room to Grow,” a policy manifesto by “reform conservatives,” is that the GOP should abandon supply-side economics. In some ways, this is the key to many other policy choices the party faces. If they keep their traditional commitment to low top tax rates above all else, there’s simply no money to spend elsewhere. On the other hand, if Republicans stop proposing to cut rich peoples’ taxes by hundreds of billions of dollars, they’ll be able to spread that money around on other things — tax credits for middle-class families, maybe some kind of health insurance — that would benefit a vastly larger bloc of voters.
How Much Would An Individual Tax Rate Cut Add to the Deficit, and Who Would Benefit? -- Reducing tax rates is a guiding principal of most tax reform plans. Even Democrats who see reform partly as a tool to boost revenues agree that some money generated by eliminating tax preferences ought to go to rate reduction. But how much does Treasury lose when Congress reduces individual tax rates, and which taxpayers benefit the most from the cuts? My Tax Policy Center colleague Elena Ramirez has just updated TPC’s estimates and the results are illuminating. A one percentage point across-the-board reduction in tax rates would add $662 billion to the budget deficit over 10 years—about $40 billion in 2015 rising to more than $85 billion by 2024. More than half the benefit would go to the households in the top 20 percent of income, while the highest-income one percent would pocket nearly 22 percent of the rate cut. Put another way, people making between $10,000 and $20,000 would enjoy about a 0.1 percent boost in after-tax incomes, or about $7 on average. Those making $50,000 to $75,000 would get an additional 0.5 percent or $295. And those making $1 million or more would see their after tax incomes rise by 0.9 percent, or nearly $18,000 on average.
Highest earners making less, Social Security data show - It is getting much harder to earn big bucks in America, my new analysis of official wage data shows. The number of workers making $2 million or more per year declined almost 5 percent, from 39,650 in 2000 to 37,714 in 2012. This decline is especially remarkable, given 11 percent population growth. These top jobs paid less too, despite 22 percent real growth in the economy over those 12 years. Measured in 2012 dollars, average pay at the top was $5.04 million, down from $5.27 million in 2000. That’s 4.3 percent less pay per top worker. Combined, the decline in big bucks jobs and average pay meant top earners got a smaller slice of the national wage pie. The pie grew 7.2 percent. But the $2 million and up workers saw their slice shrink from 3.4 percent to 2.9 percent. Now why should the typical worker care about this trifecta of bad news for high earners? After all, just one worker in about 4,100 makes this kind of money. What does it possibly matter to ordinary Americans that bosses who make as much in a year as they may earn for a lifetime of labor are squeezed a bit? It matters because falling pay at the top can become a powerful tool for change. U.S. representatives and senators may not care much what a typical constituent thinks, but they do care about what the highest-paid Americans think, because they donate to campaigns.
The Tax Dodge That Has Plagued the U.S. for More Than a Decade - A little more than a decade ago, a company called Stanley Works was considering moving to Bermuda in order to save some money. Stanley, a tool-manufacturing company, had done some calculations, and figured out that it could save about $30 million per year in U.S. taxes by ditching its Connecticut headquarters. The decision seemed fairly clear-cut, as they’d be lowering their costs. Certain members of the government were outraged at the idea. “They escape from millions of dollars of federal taxes. That’s wrong,” said Senator Chuck Grassley, as he proposed legislation that would prevent Stanley from leaving Connecticut. “Our bill requires the IRS to look at where a company has its heart and soul, not where it has a filing cabinet and a mailbox.”The company said that it decided to stick around because Congress had shown that it was ready to start a tax-reform process that would make a move to Bermuda unnecessary. As a coda, in 2004, legislation was passed that made it more difficult to reincorporate abroad. (Stanley, for its part, survived, and is still headquartered in Connecticut.) But now, 12 years later, it appears that only the nouns have changed. Walgreen (the company that owns Walgreens stores) was, a month or so ago, considering moving to Switzerland for the same reason that had inspired Stanley to explore Bermuda. It could save around $800 million per year by ditching Illinois for Western Europe. If Walgreen relocated, it could leave CVS, its Rhode Island-based competitor, in the dust.
Shareholders, public deserve tax transparency - Tax inversions. Double Irish with a Dutch sandwich. Spinning off tangible assets into real estate investment trusts. Son-of-BOSS shelters. These are among the array of eye-glazingly complicated tax avoidance strategies adopted by America’s biggest companies. Each gets a moment in the sun when some enterprising journalist stumbles upon a particularly egregious example of its use; the public expresses outrage; policymakers denounce the behavior, which they themselves have incentivized; and then maybe Congress plays whack-a-mole trying to close the loophole. Then the public forgets, firms come up with inventively aggressive new strategies, and the pattern repeats. Here’s a proposal to try to curb this cycle: Require all publicly traded companies to make their tax returns public. Period. This is not a new idea. In fact, when the modern federal corporate income tax was introduced in 1909, it came with a requirement to disclose the returns. Such transparency mandates were fought over bitterly for the next couple of decades, and U.S. returns have been confidential since 1935. The basic rationale behind tax transparency is that shareholders (and creditors and the general public) deserve to know what publicly traded companies are doing, particularly if complicated tax acrobatics are distorting their operational and investment decisions. Today, publicly traded corporations must disclose some information about their accrued tax liabilities in Securities and Exchange Commission filings, but even tax experts find it nearly impossible to reconstruct what they actually pay from year to year, and to whom — let alone what kinds of intricate shelters they’ve crafted to be able to tell one audience (the public) that they’re hugely profitable and another (the Internal Revenue Service) that they’re barely scraping by.
The Conversation We Should Be Having About Corporate Taxes - The corporate inversion — when a U.S. company takes on the legal identity of foreign subsidiary, usually in order to reduce its taxes — has become about as controversial as corporate finance topics get. President Obama has called such transactions “unpatriotic.” Others have defended them as a way for American companies to stay competitive in the face of a uniquely intrusive tax code. Harvard Business School’s Mihir Desai and Bill George both fall mostly in the second camp, but with some surprising twists that came out when I spoke with them recently. Desai is a professor at Harvard Business School and Harvard Law School who has done a lot of research on corporate taxes, and wrote the July-August 2012 HBR article “A Better Way to Tax U.S. Businesses.” George is a professor at HBS and the former CEO of Medtronic, which has been involved in one of this year’s highest-profile inversion transactions, a merger with Ireland-based Covidien. Part of our conversation was recorded for an HBR Ideacast, which you can listen to below. What follows that is an edited, much-condensed transcript of both the Ideacast and the progressively wonkier discussion that ensued after the podcast was done.
The incredible shrinking (foreign) demand for US corporate debt? -- Every month, the US Treasury publishes data on international capital flows by the type of asset and the country in which the transaction occurred. In a recent note on the latest data, CreditSights highlighted something we found very interesting: foreigners appear to have stopped buying US corporate bonds (on a net basis) during the crisis and have refused to return to the market in the years since. The truth of the matter is a little more complex, but still interesting: This is striking for at least two reasons. First, net foreign demand for US corporate bonds in the past five years seems to have moved inversely to net foreign demand for US long-term securities as a whole: And second, the collapse in foreign demand for US corporate bonds occurred at a time when US corporate bond issuance (gross, not net, but still) is at all-time high…as yields have plunged. Part of the explanation for this puzzle is that the Treasury has an unusually broad definition for “corporate bonds” when calculating its international capital flow data. From CreditSights: The TIC data on corporate debt includes mortgage-backed and other asset-backed securities and so, regrettably, it doesn’t give us a pure picture of the actual level of foreign demand in the “pure” corporate bond market.
There Is a Simple Solution to the Conflict of Interest of Bond Rating Agencies - Dean Baker - Floyd Norris had an interesting piece discussing the conflict of interest problems with company auditors and also the bond rating agencies that rate securities issued by banks. The basic problem is that since both are paid by the companies who hire them, they have a strong incentive to give an positive assessment regardless of the reality of the situation. This was a huge problem in the housing bubble years when the credit rating agencies gave trillions of dollars worth of mortgage backed securities top investment grade ratings even though they were filled with dicey mortgages. In fact, there is a relatively simple solution to the conflict faced by bond rating agencies which actually was put forward as part of Dodd-Frank. Senator Franken proposed an amendment, which was approved overwhelmingly in a bi-partisan vote, which would have had the Securities and Exchange Commission (SEC) pick the credit rating agency. (I worked with Senator Franken's staff on designing this plan.) This plan would have eliminated the conflict of interest since a negative rating would not reduce the probability of being hired for further work. This amendment was stripped out in conference committee, with the support of the Obama administration, as Timothy Geithner indicated in his autobiography. The argument against the proposal said a great deal about the corruption underlying the debate on this issue.
Ballooning Finance: How Financial Innovation Produces Overgrowth and Busts - Yves Smith - It’s a welcome surprise to see economists devise a model that delivers generally sensible results. Here, three economists looked at how financial innovation leads to an bloated financial sector as well as greatly increasing the risk of meltdown.One quibble is that they characterize financial innovation as a benign process at the outset that is all too quickly abused, particularly when the authors assume information asymmetries (as in the investors don’t fully understand what they are buying). One of their examples, collateralized debt obligations for subprime securitizations, disproves the thesis. The writers miss that an earlier version of this type of asset-backed CDO also existed in the 1990s, and as in its 2000 reincarnation, was critical to keeping subprime mortgage securitizations going. As we discussed long form in ECONNED, the ability to sell these deals was constrained by the difficulty of placing the least attractive tranche, the BBB slice. Those (along with more attractive financial sausage constituent parts) were rolled into CDOs, which were tranched just as the original mortgage backed securities has been. Now astute students of finance know that pretty much any product defect can be solved by price. That means those deemed-to-be-drecky BBB tranches could have sold if they had had higher interest rates. Of course, that would have meant some combination of higher interest rates on the underlying mortgages (as in less product to sell, since fewer people can afford payments on more costly mortgages) and/or lower fees to the deal participants. So these CDOs, which proved to be a Ponzi scheme in both their 1990s and 2000s versions, were a “financial innovation” created to get around the need to price RMBS more realistically. And the result in both cases was too much subprime origination and a CDO crash.
Patent trolls as the new rentier class - According to the Merriam-Webster dictionary, a rentier is a person who lives on income from property or securities. From the point of view of Marxist rentier capitalist theory, a rentier is also a parasite who adds no value to society, but instead survives solely due to his ability to extract rents (tribute) from productive people. A rentier achieves this through muscle or social norms which defend his exclusive rights over property in such a way that he must be compensated for their use by others. Today, patent trolls are emerging as the world’s most nefarious rentier types. The reason they’re so particularly nefarious, we’d argue, is directly linked to the type of property that they’re trying to monopolise. Intellectual property. Organised productive society has always had to deal with parasites, of course. In early society these parasites usually took the form of pirates, thieves and barbarous invaders who would either destroy value or, more conventionally, threaten to destroy value if tributes were not paid. The scale of the parasitic and destructive muscle dictated the scale of the tribute (the cost of maintaining civilisation ordered) that had to be given up by productive organised society. The parasites created the motivation, in other words, to upscale production in such a way that the tributes paid to parasites became meaningless in relative terms. Consequently, if parasites were the reason why the cost of capital (the cost to organised progressive life) was soaring in the first place, it was the innovation inspired by monopolistic repression which allowed it to be outwitted and made irrelevant.
NYT’s William Cohan Blasts “Holder Doctrine” of Headfake Bank “Settlements” With No Prosecutions -- Yves Smith - Even though there is tacit acceptance, or perhaps more accurately, sullen resignation, about regulators’ failure to make serious investigations into financial firm misconduct (probes on specific issues don’t cut it), occasionally a pundit steps up to remind the public of the farce that passes for bank enforcement. Today William Cohan tore into Attorney General Eric Holder, and by implication the Administration, for its raft of bank “settlements” which have come is a sudden spurt, no doubt intended to boost the Democrat’s flagging standing in the runup to the Congressional midterms. We’ve pointed out that the comparatively few commentators who have looked past the overhyped Department of Justice press releases into the details of the agreements have been appalled at the embarrassing lack of detail, meaning the almost total absence of any admission of wrongdoing. It’s critical to understand why this silence is important. It means that regulators have accepted as a condition of the settlement that they are to protect the bank from private suits by remaining as silent as possible about precisely what horrible things were done. The absurd part is that regulators and prosecutors could easily call the banks’ bluff by threatening to go a few rounds in court: “Would you rather have us start discovery and see what we can get in the record, or would you rather make some admissions right now?” But of course, the dirty secret here is the Administration is not just protecting the banks. It now also needs to hide how cronyistic its behavior has been.
Regulators Punting on “Too Big to Fail” Problem of Repo, Looking to Install Yet Another Bailout Vehicle - Yves Smith - The post-crisis era is rife with band-aid-over-gunshot-wound approaches to deep-seated weakness in the financial system. Perversely, because the authorities were able to keep the system from falling apart, albeit via a raft of overt and covert subsidies to the perps, they've reacted as if all that needs to be done is a series of fixes rather than more fundamental interventions. One glaring example is a critically important funding mechanism, repo, for firms that hold large inventories of securities and/or enter into derivative positions, such as major capital markets firms like Goldman, Deutsche Bank, and Barclays, as well as hedge funds. Here, the authorities have been giving way to industry demands that will assure that repo, which was bailed out in the crisis, will be bailed out again.
Fed blow to banks over ‘living wills’ - FT.com: Global banks can no longer assume continuing access to the Federal Reserve’s discount lending window as an element of their living wills, people familiar with the process have warned. US regulators set out the specific guidance in confidential letters on August 5 detailing why they recently rejected the living wills of the world’s largest banks. Hundreds of banks took advantage of the discount lending window on multiple occasions during the 2008 credit crunch. Critics say that instead of creating an environment for an orderly resolution that would avoid the kind of panic that ensued after the failure of Lehman Brothers, regulators are creating more risk by making a bank’s failure theoretically inevitable. They added that the prohibition defeats the purpose of the discount window and the role of the Fed as the lender of last resort. “How are you supposed to write these living wills if the assumptions regulators are making are false and inaccurate?” asked one US commentator. “They are disconnected from what would happen in the real world.” But the Fed and the Federal Deposit Insurance Corporation, which are under pressure to avoid government bailouts in any future crisis, want to force the banks to come up with emergency plans that do not involve any government aid, even when it comes to the discount window, which is available only to banks that are in trouble rather than failing. For the 2013 living wills, 11 banks ranging from Citigroup to Barclays were told they made unrealistic assumptions about how customers, counterparties and investors would behave in a crisis. In addition, they were informed that they failed to make or identify the kinds of structural changes that would be needed to ensure an orderly resolution.
Top White Shoe Law Firms Cited as Enablers of Bank Misconduct - Yves Smith - One of the tacit agreements among those at the very top of the power pecking order is not to criticize each other in public (with a few ritualized exceptions, like roughings up in Congressional hearings). So while this account, from Susan Beck at Litigation Daily, might not seem all that bad, given the mind-numbing range and variety of bank misdeeds, what is critical to recognize here is the way that these top blue-chip law firms have abandoned their traditional role of helping clients stay on the right side of the knife edge of misconduct. They not only happily helped them disobey, but pushed the accountants into helping with the cover up. From Beck: For the second time this summer, a major law firm has come under scrutiny for its questionable role advising a bank on transactions with sanctioned countries. This time the firm is Sullivan & Cromwell, whose work for Bank of Tokyo-Mitsubishi UFJ was revealed in documents filed Monday by the New York State Department of Financial Services…[Benjamin] Lawsky accused the PwC unit of helping Bank of Tokyo “scrub” a report to state and federal financial regulators about its falsification of wire transfer information for Sudan, Iran and other nations sanctioned for human rights abuses…Monday’s settlement describes how in 2007 and 2008 Bank of Tokyo and its lawyers pressured PwC to omit incriminating details about its activities in a regulatory report. The agreement says the bank’s lawyers “essentially dictated” part of the report to PwC, rewording a passage that cast doubt on PwC’s review of suspect transactions. (The final language deemed the review “appropriate.”) An unnamed PwC director who is now a partner at the company warned that using certain words to describe the bank’s stripping instructions might get the bank or its lawyers “all twisted up.”
No need for banks in an era of intellectual capital - FT.com: It is merger season in Silicon Valley. More than $100bn in technology deals were done in the first half of this year alone, according to Mergermarket. The numbers for the second half will probably be even bigger. The year-end tally will include Facebook’s $19bn acquisition of WhatsApp, Oracle’s $5.3bn purchase of Micros Systems and a significant entry from normally deal-shy Apple, which has agreed to buy headphone maker Beats for $3bn. Amid all of this, one element is missing: bankers. Investment banks are used to earning big fees when corporate clients absorb other companies. But many big deals are being completed without the buyer using any investment bank at all. This is heartening news for all of us who think that financial services companies in general, and investment banks in particular, are too big and too important. No longer is being an investment banker seen as the best way for a young, talented graduate to make lots of money and achieve great worldly success. Smart kids are moving to San Francisco rather than New York or London. They fund their start-ups with west coast money, build their companies with west coast talent and see multibillion-dollar deals being done between members of their west coast peer group. It makes little sense to turn to an east coast investment banker for “expert” advice on career-defining strategic decisions when there is no reason to believe that expert has a deeper understanding of your industry than you do. It is no coincidence that the rise of the self-advised mega-merger has coincided with the rise of the California-based venture capital industry as the most important single funding source for technology companies. There are still initial public offerings, of course, and gigantic public companies: Google and Apple have a combined market capitalisation of $1tn. But Silicon Valley, as a rule, does not fund itself in the stock market any more. The flotation of Apple in 1980 and of Microsoft in 1986 came at a time when those companies were investing heavily in developing the Macintosh and Windows systems.
Unofficial Problem Bank list declines to 447 Institutions - This is an unofficial list of Problem Banks compiled only from public sources. Here is the unofficial problem bank list for Aug 15, 2014. As expected, the OCC provided an update on its enforcement action activities today, which contributed to several changes to the Unofficial Problem Bank List. In all, there were four removals and two additions that leave the list at 447 institutions with assets of $142.1 billion. A year ago, the list held 717 institutions with assets of $253.9 billion. Added this week were First Federal Savings and Loan Association of Greensburg, Greensburg, IN ($158 million) and Quontic Bank, Astoria, NY ($126 million). The other notable change was the OCC issuing a Prompt Corrective Action order against The National Republic Bank of Chicago, Chicago, IL ($1.0 billion), which has been laboring under a formal enforcement action since 2010. Next week will likely be quiet as we do not anticipate the FDIC providing an update until two weeks from now. CR Note: The first unofficial problem bank list was published in August 2009 with 389 institutions. The list peaked at 1,002 institutions on June 10, 2011, and is now down to 447.
DOJ Announces Record $16.7 Billion Mortgage Settlement With Bank Of America: Live Feed -- It was in June of 2011 when we reported that Bank Of America agreed to pay $8.5 billion to settle mortgage (mis)representation suit, where we said the bank was "about to part with more money than it has earned since 2008 in what will soon be the biggest financial settlement in the industry." Fast forward 3 years later when Bank of America once again makes history with its latest, and literally greatest, mortgage settlement with the US government, putting all of its MBS transgressions in the past, and which will cost the bank some $16.65 billion (of which, however, some $7 billion will be "consumer relief" and the remainder likely tax-deductible), a new record, and allow the bank to continue adding back "one-time, non-recurring" litigation charges to its adjusted, non-GAAP bottom line, thus once again "beating expectations".
In a Bank Settlement, Don’t Forget the Bulldozers - NYTimes.com: A win-win. That’s how people on both sides of the negotiating table will undoubtedly characterize the long-awaited, $16 billion-plus mortgage settlement that Bank of America is expected to reach with the Justice Department this week. For federal and state governments, the deal will mean billions in cash and borrower assistance. For the bank, the agreement will help it get past its mortgage woes, many emanating from its 2008 purchase of Countrywide Financial, a truly toxic lender. As has become typical in these settlements, troubled borrowers across the country will most likely receive aid in the form of reductions in what they owe on their mortgages. Money will probably also be set aside for loan counseling, an important tool for countering predatory lending. But even if this largest-ever mortgage settlement goes through as expected, it will fall short if little to no meaningful cash goes to the demolition and repurposing of abandoned homes. Such a deal would neglect thousands of residents in neighborhoods where vacant properties are still imperiling real estate values and attracting crime. These are people who still pay their mortgages and property taxes but are caught in the devastating cycle that zombie houses can create in a neighborhood. Many of these homeowners, already poor, are impoverished further by blight on their streets.
Bank Settlement Grade Inflation: High Bullshit to Cash Ratio in $17 Billion Bank of America Deal - Yves Smith -- Over the last year, the Administration has entered into a series of bank settlements over various types of mortgage misconduct. The sudden rush to generate headlines from misdeeds that have been covered in the media in lurid detail during and after the crisis looks an awful lot like an effort to stem continuing criticism over the abject failure to punish banks and more important, their execs for blowing up the global economy for fun and profit, particularly since the Dems are at serious risk of losing control of the Senate in the Congressional midterms. But as much as the media dutifully amplifies the multibillion headline value of these pacts, we’ve reminded readers again and again that all of these agreements have substantial non-cash portions which are ludicrously treated as if they have the same value as cold, hard cash. As we’ve reminded readers often, it’s critical to keep your eye on the real money, since the rest of the total is almost without exception things the bank would have done anyhow (or even better, giving banks credit for costs actually borne by others, like modifying mortgages that the bank merely services, meaning the bank gets a credit for a writedown imposed on an investor).
Homeowner help remains elusive in $16.5bn Bank of America fine - The Justice Department has inked yet another cash settlement for misconduct in the production of mortgage-backed securities, this time with Bank of America for $16.65bn. Don’t expect a lot of that to be of any help to people who lost their homes. While Bank of America is ostensibly devoting around $7bn of the money to consumers, homeowners will actually see very little money or help. We can look to the first settlement of this type with a bank – last November’s deal with JPMorgan Chase – and draw some conclusions. Under that settlement, which the Justice Department called a template for future fines against the banks, JPMorgan is supposed to deliver $4bn in consumer relief, primarily through reducing interest rates or principal on mortgages. But homeowners will have to wait. Like the other banks, JPMorgan has three years to make good on this relief. An initial report from Joseph Smith, who is overseeing JPMorgan’s consumer relief obligation, shows that the bank’s money is not exactly flying out the door to homeowners. As of 31 March of this year, five months after the settlement, JPMorgan only claimed verifiable modifications on 100 loans, for a grand total of $6m in credited relief – a little under 1% of the total it has promised. Even though the settlement provides a bonus credit for relief delivered within the first year, JPMorgan has decided to stretch things out.
Few homeowners expected to benefit from Bank of America’s $16.65B settlement — Bank of America's record $16.65 billion settlement for its role in selling shoddy mortgage bonds — $7 billion of it geared for consumer relief — offers a glint of hope for desperate homeowners. The settlement requires the nation's second-largest bank to reduce some homeowners' loan balances, provide new loans to low-income buyers and address areas of neighborhood blight. But consumer advocates say few people will be helped relative to the devastation triggered by the mortgage bonds, which fueled the worst financial crisis since the 1930s and threw millions of homes into foreclosure. Only a fraction of homeowners would be eligible for refinancing under the settlement. And the process by which people would qualify and receive aid could drag on for years, with payouts set to be completed as late as 2018. Those who have lost their homes to a foreclosure or a short sale — when a lender accepts less money from a sale than what the borrower owes — likely wouldn't benefit at all.
Some homeowners could get hit with a whopping tax bill if they accept help through Bank of America’s settlement- The $17 billion settlement that Bank of America reached with the Department of Justice on Thursday provides mortgage debt relief for some troubled homeowners. But those that accept the help could get hit with a hefty tax bill later. As part of the settlement, the bank agreed to spend $7 billion on helping struggling homeowners and communities, including lowering the mortgage balances of certain borrowers who owe more than their homes are worth. The problem is that some of these "underwater" borrowers might have to pay taxes on the debt that’s forgiven. In 2007, Congress adopted a law that spared homeowners from being taxed on the amount of the loan that was written off. But that tax break expired in December, and now that kind of relief can be counted as income by the IRS, an issue we wrote about in April. In negotiating the deal, the Justice Department recognized that many of the borrowers it was trying to reach would be in no position to accept the help if doing so would lead to a huge tax bill. "That’s why the Department secured a commitment from Bank of America to pay a portion of the settlement – over $490 million – to defray some of this tax liability," U.S. Attorney General Eric H. Holder Jr. said when he announced the deal. "And our settlement requires the bank to notify all consumers of the potential tax liability."
Goldman Paying $3.15B Over US Mortgage Bond Claims — Goldman Sachs has agreed to pay $3.15 billion to resolve claims that it misled U.S. mortgage giants Fannie Mae and Freddie Mac about risky mortgage securities it sold them before the housing market collapsed in 2007.The Federal Housing Finance Agency, which oversees Fannie and Freddie, announced the settlement Friday with the Wall Street powerhouse.New York-based Goldman Sachs sold the securities to the companies between 2005 and 2007.“We are pleased to have resolved these matters,” said Goldman Sachs Group Inc. general counsel executive Gregory Palm in a statement.The settlement is the latest federal government settlement over actions related to the financial crisis that struck in 2008. The crisis, triggered by vast sales of risky mortgage securities, plunged the economy into the deepest recession since the 1930s.
CoStar: Commercial Real Estate prices increased 10% year-over-year in June - Here is a price index for commercial real estate that I follow. From CoStar: Commercial Real Estate Prices Steadily Advance In Second Quarter Despite a modest pull-back in June 2014, CCRSI’s value-weighted U.S. Composite Index advanced 2.3% in the second quarter of 2014, and 9.7% for the 12-month period ending in June 2014. Reflecting the impact of larger, core-like property sales, the value-weighted U.S. Composite Index is now in line with its prerecession highs reached in 2007. The equal-weighted U.S. Composite Index, which tracks smaller, more numerous property trades typical of those in secondary markets, is now beginning to catch up with its value-weighted counterpart. It advanced 2.4% in the second quarter and 10% for the 12 months ending in June 2014.... Boosted by a strong second quarter, repeat sale transaction volume reached nearly $39.3 billion in the first half of 2014 , an increase of 14.5% from the first half of 2013, and roughly on a par with the first half-year totals reached in 2006-07. Repeat-sale pair volume increased 8.8% in the Investment Grade segment and 27.2% in the General Commercial in the first half of 2014 over the same period one year earlier. Meanwhile, only 8.7% of properties are selling at distressed pricing as of the second quarter of 2014 — the lowest distress sales rate since the fourth quarter of 2008.
The New Way the Government Is Poisoning the American Dream -- It’s yet another prime example of “The strong get more while the weak ones slave.” Private equity shops and institutional players are buying and packaging (securitizing) nonperforming mortgages from the Federal Housing Administration (FHA) and selling those mortgages to mutual funds and themselves. On the surface, the U.S. Department of Housing and Urban Development (HUD) wants to minimize the cost to taxpayers. After all, we have to cover the insurance guarantees the FHA made on loans it backed but are now nonperforming or in foreclosure. That’s really nice of HUD and the FHA, thinking about us taxpayers. Maybe they should have thought about us when they agreed to guarantee payment on loans to less-than-prime borrowers who only have to put down 3% to get their loans. But, whatever, they’re from the government… It’s also nice that most of those loans, the FHA-insured ones, get packaged into securities and sold to institutional investors. Because, you know, those institutional investors, the same ones who package FHA loans into securities and sell them to each other and keep piles for themselves, need us to cover their backsides. It’s just the socialization of losses to protect poor wee banks and financial institutions.
Are we facing yet another foreclosure crisis? --Despite numerous reports indicating that there has been a deep decline in foreclosure inventory over the past several months in many markets, the reality, as chronicled in several articles recently penned by this author and others, is that foreclosure rates are very likely to rise again in the not-too-distant future. With that prospect just over the horizon, it is important to note that property preservation and repair services for bank-owned properties remain a vital component of mortgage default servicing.As has been well documented, I am not alone in my beliefs about the prospects for increased foreclosure rates, at least not any more.For example, author Keith Jurow has also been making the case that the so-called housing “recovery” is nothing more than an illusion. In a piece he wrote that appeared on Doug Short’s Advisory Perspective web site titled, “Why the Move-up Housing Market is Gone,” Mr. Jurow noted in particular that the mortgage delinquency problem just won’t go away. In part, Jurow wrote, “I have also been writing about the serious delinquency problem for four years. Wall Street continues to disregard the issue. “First, the delinquency figures put out by the Mortgage Bankers Association and others are misleading and quite useless. Why? More than 22 million homeowners have had their mortgages modified since 2008. Most of them had been delinquent in their payments. Once the modifications become permanent, the loan is considered current. So of course this pushes the delinquency rate ay down.” To Jurow’s point, the recidivism rate on loans that have been modified following the housing crash has risen to be as high as 70%. The highly touted loan modification “workout” programs like HAMP, HAFA and other foreclosure alternative programs has only forestalled foreclosure, not eliminated them.
Lawler: Updated Table of Distressed Sales and Cash buyers for Selected Cities in July - Economist Tom Lawler sent me the updated table below of short sales, foreclosures and cash buyers for several selected cities in July. I think it is very useful for looking at the trend for distressed sales and cash buyers in these areas. I sincerely appreciate Tom sharing this data with us! On distressed: Total "distressed" share is down in all of these markets, mostly because of a sharp decline in short sales. Short sales are down in all of these areas.Foreclosures are down in most of these areas too, although foreclosures are up a little in few areas like Nevada, Sacramento, Orlando, Miami and the Mid-Atlantic (areas with foreclosure delays related to a judicial foreclosure process or state law changes). The All Cash Share (last two columns) is mostly declining year-over-year. As investors pull back, the share of all cash buyers will probably continue to decline.
MBA: Mortgage Applications Increase in Latest MBA Weekly Survey - From the MBA: Mortgage Applications Increase in Latest MBA Weekly Survey: Mortgage applications increased 1.4 percent from one week earlier, according to data from the Mortgage Bankers Association’s (MBA) Weekly Mortgage Applications Survey for the week ending August 15, 2014. ... The Refinance Index increased 3 percent from the previous week. The seasonally adjusted Purchase Index decreased 0.4 percent from one week earlier. ...The average contract interest rate for 30-year fixed-rate mortgages with conforming loan balances ($417,000 or less) decreased to 4.29 percent from 4.35 percent, with points increasing to 0.26 from 0.22 (including the origination fee) for 80 percent loan-to-value ratio (LTV) loans. The first graph shows the refinance index. The refinance index is down 74% from the levels in May 2013. As expected, refinance activity is very low this year. The second graph shows the MBA mortgage purchase index. According to the MBA, the unadjusted purchase index is down about 11% from a year ago.
Fannie Mae Sledgehammers Housing Forecasts -- You’d think the housing market is in fine shape, based on the sizzling optimism of the National Association of Home Builders, which just released its Housing Market Index. It rose to 55 in August – above 50 means more builders view conditions as good than poor – the third month in a row of gains, and the highest level since January. All three components of the HMI rose: current sales conditions to 58; future sales (that’s where hope thrives) to 65, the highest since August 2013; and traffic of prospective buyers (that’s where reality is nagging) to 42. OK, so foot traffic was crummy. But in the prior month, it was 39, even crummier. That all three components rose three months in a row “is a positive sign that builder confidence appears to be firming following an uneven spring,” said NAHB Chief Economist David Crowe. This feat was due to “sustained job growth, historically low mortgage rates, and affordable home prices, which are helping to unleash pent-up demand.” But the NAHB’s electronic ink wasn’t even dry, so to speak, when the ever optimistic Fannie Mae, the bailed-out government mortgage giant, came out with its August 2014 forecast, in which it took a sledgehammer to its prior forecasts. Home sales have been plunging for months, after post-crisis optimism peaked mid last year. And Fannie Mae is belatedly adjusting to an ugly reality.It slashed its 2014 forecast for construction starts for single-family homes to 642,000 units, down 8% from its July forecast of 696,000. But it has been slashing its forecasts all along: in January, it had still seen 768,000 single-family housing starts for the year. And in August last year, it had forecast 876,000 starts for 2014. It has now chopped 27% off that forecast. Same thing with home sales. Fannie Mae cut its forecast for new single-family home sales to 431,000 units, down 11% from last month, down 21% from its forecast in January. August last year, it still believed that 588,000 new single-family homes could be sold in 2014. Now it has axed that by a brutal 36%.
In Phoenix, a Realty Check as Market Moderates - To understand why the U.S. housing market this year isn't providing the lift many economists expected, look to Phoenix.Among the cities most battered by the 2006 bust, Phoenix was the first to snap back in 2011. Prices, off by 56% from peak, then rebounded sharply, trimming that drop by a third. The number of homes in some stage of foreclosure has fallen to about 4,300 homes today from more than 50,000 four years ago. Now, prices and sales are cooling off. Inventories of homes listed for sale have climbed to their highest level in three years while the number of houses sold in June fell 12% from a year earlier. ... As the foreclosure boom that fueled much of the recovery fades, income and population growth are reasserting themselves as drivers of the housing market in places such as Phoenix. Meanwhile, lingering scars from the bust are playing out as some of the country's hottest housing markets struggle to pass the baton from bargain-hunting investors, who typically pay cash, to traditional buyers with mortgages.
Rising Inventory & Low Rates Haven't Created More Housing Demand - Simply put, the lack of recovery in housing demand is directly related to the lack of recovery in real median income and growth in year-over-year average hourly wages. Yet many have failed to recognize how important wages and liquid assets are to creating real demand in the housing market. This, in spite of the preponderance of evidence presented to us from the likes of the distinguished and insightful Professor Anthony Sanders, who has provided pictorial analyses of this issue, such as the chart below. Three other important indicators, which typically drive an increase in home purchases -- rising rents, rising housing inventory and lower mortgage rates -- in this climate seem to have no effect, signaling a fundamental softness in the housing market in 2014.
- Rising rents: Even with rents consistently rising in most markets demand for housing from the mortgage buyer remains soft. The buying a home is cheaper than renting thesis sounds good, but didn’t work out too well in this cycle.
- Rising Inventory: Even with more homes on the market this year than last year, demand for housing from the mortgage buyer & the cash buyer has been less year over year. On a positive note we are seeing a cooling off on price gains and this is a good factor for the housing market, not a bad one.
- Lower Mortgage Rates: Even with mortgage interest rates falling from Jan 1, 2014, demand for housing from the mortgage buyer has been negative year over year all year long.
Where Have the First-Time Home Buyers Gone? - First-time buyers aren’t playing as big a role in the housing market as they did a few years ago, when lower prices and a big tax credit lured them to the market. But when it comes to homes financed by conventional or government-backed loans, first-time buyers still account for a historically high share of purchases, according to a new paper from researchers at the Federal Housing Finance Agency. The FHFA, which regulates mortgage-finance giants Fannie Mae and Freddie Mac, examined loans that were either sold to those companies or insured by the Federal Housing Administration, a government agency that has traditionally played a large role serving first-time buyers. These entities have backed more than 80% of all loans made since 2009. Here’s what they found: The first-time buyer share of purchase-mortgage lending rose to a high of 63% in 2009, when Congress enacted an $8,000 tax credit for first-time buyers. That was from a nadir of 37% in 2003.[View an interactive graphic to explore the trends by state] First-time buyers accounted for a lower share of purchases from 2004 to 2006, when home prices were rising rapidly and credit was available on much easier terms from lenders that were selling those loans to Wall Street firms, bypassing Fannie, Freddie, and the FHA. First-time buyers’ share of loans began to increase steadily in 2007, until reaching that 2009 peak. Since 2009, the share of mortgages to first-time buyers has declined, dropping to 56% last year. That is still higher than at any time between 1993 and 2008. An updated version of the paper that was released last month breaks out the first-time buyer share by state. As you might expect, it finds that the first-time buyer share tends to decline in states as home prices rise. Declining home prices, by contrast, “tend to induce relatively robust home purchasing volume by first-time home buyers,” the paper said.
Why the Trade-Up Housing Market Is Gone: For four years, I have stood alone in offering compelling evidence that the housing crash is far from over and that the so-called recovery is nothing more than an illusion. Recently, concerns began to be uttered in the mainstream media that the recovery was showing signs of faltering. After all, new home sales were weak and the Case-Shiller index was showing slower price gains. With mounting signs that the housing recovery is faltering, let’s take an in-depth look at whether the recovery has any basis in reality. In an article published in early June, I offered evidence that the number of homes for sale has soared in major metros around the country. As I predicted, owners who had held their houses off the market expecting to get a higher price have been pouring onto the market in droves. In Connecticut where I live, listings have been climbing rapidly for months. Take a look at this table of ten towns/cities where listings have risen substantially. It would be a mistake for you to think that this is happening only in Connecticut. The following table shows the soaring number of listings in ten major metros around the country. If sales volume was stronger, this huge increase in home listings would not be very troublesome. However, Redfin.com’s latest report for June showed that sales volume was down year-over-year in 21 out of 29 major metros which they track. You don’t need to be a genius to understand what the soaring number of listings combined with weak sales means for home prices.
U.S. existing home sales rise at fastest pace in 10 months (Reuters) - Americans resold their homes in July at the fastest pace in almost a year, a sign the housing market was gaining steam again after a year-long slump. The National Association of Realtors said on Thursday existing home sales increased 2.4 percent to an annual rate of 5.15 million units. That was above analysts' expectations and marked the fourth straight month the pace of home resales accelerated. true Home resales dropped in the summer of 2013 after the Federal Reserve signaled it would dial back its monetary stimulus for the economy, pushing mortgage interest rates higher. The Fed, however, ended up keeping a bond-buying program running at full throttle for longer than investors expected, and mortgage rates edged lower again. This, coupled with robust job growth this year, helped push home resales in July to their highest level since September 2013. Distressed sales, which include foreclosures and short sales, made up only 9 percent of sales last month, the lowest share since the NAR starting tracking this information in October 2008. More homes also are being put on the market, keeping prices from rising as quickly and providing potential buyers with more choices.The number of homes on the market for resale rose to 2.37 million in July, the highest level since August 2012 and 5.8 percent more than in July of last year. The median sale price was $222,900, 4.9 percent higher than in July 2013.
Existing Home Sales in July: 5.15 million SAAR, Inventory up 5.8% Year-over-year - The NAR reports: Existing-Home Sales Continue to Climb in July - Total existing-home sales, which are completed transactions that include single-family homes, townhomes, condominiums and co-ops, rose 2.4 percent to a seasonally adjusted annual rate of 5.15 million in July from a slight downwardly-revised 5.03 million in June. Sales are at the highest pace of 2014 and have risen four consecutive months, but remain 4.3 percent below the 5.38 million-unit level from last July, which was the peak of 2013. ... Total housing inventory at the end of July rose 3.5 percent to 2.37 million existing homes available for sale, which represents a 5.5-month supply at the current sales pace. Unsold inventory is 5.8 percent higher than a year ago, when there were 2.24 million existing homes available for sale.This graph shows existing home sales, on a Seasonally Adjusted Annual Rate (SAAR) basis since 1993. Sales in July (5.15 million SAAR) were 2.4% higher than last month, but were 4.3% below the July 2013 rate. The second graph shows nationwide inventory for existing homes. According to the NAR, inventory increased to 2.37 million in July from 2.29 million in June. Headline inventory is not seasonally adjusted, and inventory usually increases from the seasonal lows in December and January, and peaks in mid-to-late summer. The third graph shows the year-over-year (YoY) change in reported existing home inventory and months-of-supply. Since inventory is not seasonally adjusted, it really helps to look at the YoY change. Note: Months-of-supply is based on the seasonally adjusted sales and not seasonally adjusted inventory.
Existing home sales improve, but prices have probably peaked: Although existing home sales have much less of an economic effect than new home construction and sales, they do constitute about 90% of the market, so they give us a wealth of information. This morning's release for July helps confirm that the bottom in sales, induced by higher mortgage rates that began in midyear 2013 has probably passed. On the other hand, inventory is increasing and at least a temporary top in housing prices is probably occurring right about now. Because prices and inventory aren't seasonally adjusted, I am going to give you the YoY% comparison increase/decrease in existing home sales (blue), prices (red), and inventory (green): Remember that sales move first, followed by prices, followed last by inventory. The graph above shows that sales probably bottomed in March at 4.59 million annualized, but are still -4.3% below their peak of 5.38 million annualized established in July of last year. Meanwhile price increased are slowing down, although they haven't turned negative. Inventory is still increasing at an increasing rate. Next, here are actual sales (blue) vs. mortgage rates (inverted, red): We can see that sales decline in reaction to the steep increase (shown as a decrease) in mortgage rates. With those reversing, sales have started to reverse/ Finally, here are median prices (blue) vs. months' supply of houses on the market (red): You can see that the last time we had this many months of supply, housing prices (which are NOT seasonally adjusted) appeared to be slightly past their peak. It's a good bet that prices, which typically reach their seasonal peak in June or July, have also reached their interim peak in the last two months.
Foreclosed-Property Sales Fall to Lowest Levels Since 2008 - Thursday’s home-sales report offers the clearest evidence that the housing market is moving out of the emergency ward and into a rehab facility. But the big question right now is how long it will stay in that recovery unit. The National Association of Realtors reported that home sales rose for the fourth straight month in July to the highest seasonally adjusted annual rate since last September. But the real sign that the housing market is out of critical condition comes courtesy of a separate survey the NAR does of its members. That survey estimates the share of distressed home sales in July fell to 9% of all sales, the lowest level since the trade group’s tally began in October 2008. Housing is far from full health. Construction of single-family homes is a shadow of its former self, even as rental construction has begun to exceed pre-crisis levels. Last year’s jump in mortgage rates took a bigger bite out of demand than most economists had expected, and sales have firmed up in recent months in part because financing is still relatively cheap. Freddie Mac reported on Thursday that the 30-year fixed-rate mortgage fell to 4.1% last week, its lowest level so far this year. As we wrote earlier this week, sales volumes have stumbled in markets like Phoenix in part because there are fewer foreclosed properties (or sales of rehabbed foreclosures that were being flipped by investors). Investors have also pulled back from the market as prices rise higher, making homes less affordable for the buy-to-rent businesses that grew quickly in 2011 and 2012.
A Few Comments on Existing Home Sales -- The most important number in the NAR report each month is inventory. This morning the NAR reported that inventory was up 5.8% year-over-year in July. It is important to note that the NAR inventory data is "noisy" and difficult to forecast based on other data. The headline NAR inventory number is not seasonally adjusted, even though there is a clear seasonal pattern. Trulia chief economist Jed Kolko has sent me the seasonally adjusted inventory. NOTE: The NAR does provide a seasonally adjusted months-of-supply, although that is in the supplemental data. This shows that inventory bottomed in January 2013 (on a seasonally adjusted basis), and inventory is now up about 10.7% from the bottom. On a seasonally adjusted basis, inventory was only up 0.2% in July compared to June. Important: The NAR reports active listings, and although there is some variability across the country in what is considered active, many "contingent short sales" are not included. "Contingent short sales" are strange listings since the listings were frequently NEVER on the market (they were listed as contingent), and they hang around for a long time - they are probably more closely related to shadow inventory than active inventory. However when we compare inventory to 2005, we need to remember there were no "short sale contingent" listings in 2005. In the areas I track, the number of "short sale contingent" listings is also down sharply year-over-year. Another key point: The NAR reported total sales were down 4.3% from July 2013, but normal equity sales were probably up from July 2013, and distressed sales down sharply. The NAR reported that 9% of sales were distressed in July (from a survey that is far from perfect): Last year in July the NAR reported that 15% of sales were distressed sales. A rough estimate: Sales in July 2013 were reported at 5.38 million SAAR with 15% distressed. That gives 807 thousand distressed (annual rate), and 4.57 million equity / non-distressed. In July 2014, sales were 5.15 million SAAR, with 9% distressed. That gives 464 thousand distressed - a decline of over 40% from July 2013 - and 4.69 million equity. Although this survey isn't perfect, this suggests distressed sales were down sharply - and normal sales up slightly (even with less investor buying).
Home and Jobs Data Suggests Momentum - Sales of existing homes in the United States rose in July to a 10-month high, and the number of Americans filing new claims for unemployment benefits fell last week, signaling strength in the economy early in the third quarter.The growth outlook was further buoyed by other reports on Thursday showing that in August, factory activity in the mid-Atlantic region hit its highest level since March 2011 while a gauge of future economic activity increased solidly last month. “The economy is beginning to fire on more cylinders,” said Ryan Sweet, a senior economist at Moody’s Analytics in West Chester, Pa. The National Association of Realtors said existing-home sales increased 2.4 percent, to an annual rate of 5.15 million units. That was the highest reading since September and confounded economists’ expectations for a pullback. It was the fourth consecutive monthly gain in sales, confounding economists, who had expected a decline. In a further encouraging sign, the share of first-time buyers rose for a second consecutive month and more houses came onto the market, which should temper price increases. Earlier stages of the housing recovery were driven by investors.
First-Time Buyer Comparisons Can Be Deceiving in Housing Market - New data show that first-time home buyers aren’t playing as big a role in the mortgage market as they did a few years ago, when prices were lower and a big tax credit fueled a surge of sales. The research from the Federal Housing Finance Agency looks at the share of mortgages taken out by first-time buyers from Fannie Mae, Freddie Mac and the Federal Housing Administration over the last two decades and across all 50 states. The first-time buyer share peaked at 63% in 2009, at the height of the tax-credit frenzy, and hit a low of 37% in 2003. The share was relatively stable in the late 1990s, hovering around 45%. It stood at 56% last year. How does this compare to other measures of first-time buyers? For one, it’s much higher than other measures because it is examining the share of home purchases that are financed. If all-cash transactions were included, the numbers would probably decline.Different reports often state that the “normal” share of first-time buyers is around 40%, though this figure is often used in a way that can be misleading. The Federal Reserve Bank of Atlanta has a good summary of the different data sources for the first-time buyer share of sales.The 40% figure comes from the National Association of Realtors’ annual profile of home buyers and sellers. The survey dates to 2001 and covers only the market for primary-residence purchases, which means it includes second homes or investment properties.
Homeownership Rates Come Back Down the Mountain - Back in the mid-1990s, I thought of the U.S. homeownership rate as fairly constant, holding at about 64-65% most of the time. In the fourth quarter of 1995, for example, the homeownership rate was a bit above this range at 65.1%. But looking back at Census Department data for the fourth quarter of various years (see Table 14 here), the homeownership rate had been 64.1% in 1990, 63.5% in 1985, 65.5% in 1980, 64.5% in 1975, 64.0% in 1970, and 63.4% in 1965. Since 1995, U.S. homeownership rates have climbed a mountain--speaking graphically--and have now come back down. Here's a figure from the Census Bureau's July 29 report on "Residential Vacancies and Homeownership in the Second Quarter 2014." The homeownership rate checked in at 64.7% in the second quarter of 2014. Here's a slightly different perspective from the same report, looking at the vacancy rate--that is what share of rental housing and of homes are vacant. At about the same time that the homeownership rate was rising in the first half of the 1990s, the vacancy rate for homes was also rising--which suggests that an enormous boom in residential construction was occurring at the time. It's worth remembering that as homeownership rates climbed up one side of the mountain from about 1995 to 2004, the change was viewed as a success by both parties. Bill Clinton had a National Homeownership Strategy which pushed to make it easier for people with lower incomes to own a home. Of course, the underlying problems have now become obvious. It's hard to oppose policies that gives low-income people a better chance to own a home. But if those policies involve encouraging those with lower incomes to take out subprime mortgages, so that the people you are claiming to help will be actually be carrying overly large debt burdens and become highly vulnerable to a downturn in housing prices, then this way of pushing for higher rates of homeownership is a poisoned chalice.
The Schizophrenic US Housing Market In One Chart -- For those who are looking for just one chart with which to summarize the US housing market, here it is courtesy of the NAR, which earlier today reported July existing home sales, which despite beating expectations, were still 4.3% below the 5.38 million annualized homes sold a year ago. The chart shows that while the housing market for the low-end continues to collapse (the 12.9% drop was "only" -12% three months ago), and the mid-range is virtually frozen, all the upside activity, activity which pushes the median price ever higher ( in July it was $222,900, 4.9% percent above July 2013 and the 29th consecutive month of year-over-year price gains), was in the ultra-luxury segment, or houses which cost over $1 million as the "1%", both foreign and domestic, continues to convert their pieces of fiat paper into hard real-estate assets
Signs of improvement in residential construction - - Despite tepid wage growth in the US and Dodd-Frank-driven headwinds for mortgage lending (see post), two signs point to moderate improvements in residential construction.
1. The homebuilder optimism index recovered more than forecast.
2. Lumber futures have risen materially from their lows in June.
At this point it is difficult to say whether this construction improvement relates to new home purchases or new rental units. Given the looming rental market shortage in the US (see post), we are certainly going to see more apartment construction, adding to construction employment. And while nobody expects a major boom in construction employment across the country, there is definitely room for improvement.
US home construction jumps 15.7% in July — U.S. home construction rebounded in July, rising to the fastest pace in eight months and offering hope that housing has regained momentum after two months of declines.Construction increased 15.7 percent in July to a seasonally adjusted annual rate of 1.09 million homes, the Commerce Department reported Tuesday. That was the fastest pace since November and followed declines of 4 percent in June and 7.4 percent in May.Applications for building permits, considered a good sign of future activity, also showed strength in July, advancing 8.1 percent to an annual rate of 1.05 million, after declines of 3.1 percent in June and 5.1 percent in May.The July rebound reflected strength in single-family home construction, which rose 8.3 percent, and in apartment construction, which was up 33 percent.The strength in July was led by a 44 percent rise in construction starts in the Northeast. Housing construction was up 29 percent in the South, recovering from a 26.8 percent plunge the month before blamed in part on heavy rains in that part of the country.
Housing Starts increase to 1.093 million Annual Rate in July - From the Census Bureau: Permits, Starts and Completions Privately-owned housing starts in July were at a seasonally adjusted annual rate of 1,093,000. This is 15.7 percent above the revised June estimate of 945,000 and is 21.7 percent above the July 2013 rate of 898,000. Single-family housing starts in July were at a rate of 656,000; this is 8.3 percent above the revised June figure of 606,000. The July rate for units in buildings with five units or more was 423,000. Privately-owned housing units authorized by building permits in July were at a seasonally adjusted annual rate of 1,052,000. This is 8.1 percent above the revised June rate of 973,000 and is 7.7 percent above the July 2013 estimate of 977,000. Single-family authorizations in July were at a rate of 640,000; this is 0.9 percent above the revised June figure of 634,000. Authorizations of units in buildings with five units or more were at a rate of 382,000 in July.
Housing Permits, Starts Surge Driven By Renewed Rental Housing Scramble -- After June's very disappointing housing starts and permits numbers, which plunged to 893K and 963K respectively well below consensus expectations, it was time for the Department of HUD to show how it's done, and moments ago the July housing starts and permits data literally blew away Wall Street expectations, as Starts soared from an upward revised 945K to 1093K, the highest print since November 2013, while permits surged from an also upward revised 973K to 1052K, smashing expectations of 1000K and the biggest beat since October. Why? Multi-family housing is back with a vengeance with "rental" permits and starts soaring by 24% and 33% respecitvely in the month of July.
It looks like the housing slowdown is abating: The drift lower in interest rates this year looks like it is feeding through into new housing. In general, in the past, a 1% change in interest rates has led to an approximate 100,000 change, annualized, in housing permits. The rise in interest rates of over 1% at midyear 2013 fed through into a complete halt in growth in new home construction. Now the fade lower of 0.6% in interest rates since the beginning of 2014, leading to YoY interest rates being lower, is showing up in a little bit of a revival. To begin with, here are interest rates (inverted, blue, left scale) compared with housing permits (red, right scale): Now here is the same data on a YoY% basis: The YoY decline in interest rates should show up as a YoY improvements in housing permits, and it appears that's what happened in July. A second theme I have written about in the last few months is how the large Millennial generation is having a similar effect now as the Baby Boom did almost half a century ago. The surge in the number of young adults is adding demand to the market, and in particular to multi unit dwellings such as apartment construction. You can see that as rates rose in 2013, both single family dwellings (blue, left scale) and apartments (red, right scale) came under pressure, but apartments fared better: While the absolute number of the increase in multiunit dwellings authorized is small, measured as a YoY% change, you can see that apartments held up better during the recent slowdown, and have rebounded more:
Homes Built for Rent Claim Smaller Share - Recent Commerce Department data show that construction of single-family homes for rental purposes is shrinking toward its long-term average market share, but that doesn’t include the entire picture. Robert Dietz, an economist for the National Association of Home Builders, examined Commerce home-construction data released this week, concluding builders in the first half of this year started construction of 10,000 homes intended to be rentals. That’s 3.1% of all homes started in that span, which is close to the 21-year U.S. average of 2.8%. Last year the single-family, built-to-rent market accounted for 3.2% of home starts and in 2012 it was 5.8%. The percentages were higher in past years for several reasons. Overall home construction was low in recent years in comparison to historical averages, giving homes built for rental a larger percentage of a smaller market. Several builders also ventured into building rental homes as the pool of renters grew amid tight mortgage-lending standards and previously weak job growth. Now, however, it appears the market is settling back to its regular level. “We’re going back to 2% to 3% over the long run as first-time buyers come back into the marketplace and the rest of the single-family (for-sale) market expands,” Mr. Dietz said. There’s more to the story, though. The Commerce data captures only homes that builders construct for themselves to own and rent out. It doesn’t include the so-called merchant-building industry of builders constructing homes to be sold to investors who operate them as rentals.
A few comments on July Housing Starts - This was a solid report for housing starts in July. There were 585 thousand total housing starts during the first seven months of 2014 (not seasonally adjusted, NSA), up 9.1% from the 563 thousand during the same period of 2013. Single family starts are up 3%, and multi-family starts up 24%. The key weakness has been in single family starts. Starts were up 21.7% year-over-year in July. This solid year-over-year increase was due to a combination of more starts in July (highest this year), and an easier comparison to last year. There was a huge surge in housing starts early in 2013, and then a lull - and finally more starts at the end of the year. This graph shows the month to month comparison between 2013 (blue) and 2014 (red). Starts in Q1 averaged 925 thousand SAAR, and starts in Q2 averaged 997 thousand SAAR (up 8% from Q1). Q3 is off to a solid start. This year, I expect starts to mostly increase throughout the year (Q1 will probably be the weakest quarter, and Q2 the second weakest). The comparisons will be easy for the next few months, and starts should finish the year up double digits from 2013. Below is an update to the graph comparing multi-family starts and completions. Since it usually takes over a year on average to complete a multi-family project, there is a lag between multi-family starts and completions. Completions are important because that is new supply added to the market, and starts are important because that is future new supply (units under construction is also important for employment). These graphs use a 12 month rolling total for NSA starts and completions. The rolling 12 month total for starts (blue line) has been increasing steadily, and completions (red line) are lagging behind - but completions will continue to follow starts up (completions lag starts by about 12 months). This means there will be an increase in multi-family completions later this year and in 2015.
A look behind the headline housing starts report for the United States - As discussed in previous post, today's report on US housing starts indeed showed significant improvements. However, this only tells part of the story. The number of housing starts for single-family units remains to a large extent range bound (see chart). A great deal of the growth instead is coming from multi-family construction (see chart). That's driven by rapidly rising demand for rental housing in the US, as shortages become more pronounced (see post). This demand is visible in the latest report on inflation, which also came out today. Rent expenses are now growing considerably faster than the CPI as well as wages. Rent inflation vs. core CPI. This trend of rental units dominating housing starts growth is likely to continue as homeownership rates decline. Adequate supply of new multifamily housing will be critical in years to come.
With Rentals in Fashion, Apartment Construction Hits 25-Year High - It’s no secret that the apartment sector has been on a tear. A big share of July’s gain in housing construction came from the multifamily sector, which tends to be fairly volatile on a monthly basis. But looking at a rolling 12-month total of multifamily starts without any seasonal adjustment shows that construction for the year ended July reached its highest level since 1989, according to Commerce Department data released Tuesday. Big gains in apartment construction are less bullish for economic growth than a comparable rise in single-family construction, notes Diane Swonk, because single-family housing has a bigger multiplier effect for both consumer spending and job growth. “We will take what economic activity we can get, but our housing market model was designed in the U.S. to build a lot of single-family homes for owners, not multifamily homes for renters,” Ms. Swonk wrote Tuesday. Single-family construction improved in July but has been softer than expected this year. Single-family building permits, for example, are up just 0.8% through July versus the year-earlier period, compared to a 17.5% year-to-date gain for apartment permits. Still, the surge in apartments offers further evidence that job gains are boosting household formation and that the housing market faces a shelter shortage that will require more construction—for renting or for owning. The hope is that eventually more of these renters will buy homes.
NAHB: Builder Confidence increased to 55 in August, Highest since January - The National Association of Home Builders (NAHB) reported the housing market index (HMI) was at 55 in August, up from 53 in July. Any number above 50 indicates that more builders view sales conditions as good than poor. From the NAHB: Builder Confidence Rises Two Points in August Builder confidence in the market for newly built, single-family homes rose two points to 55 on the National Association of Home Builders/Wells Fargo Housing Market Index (HMI) for August, released today. This third consecutive monthly gain brings the index to its highest level since January ..Derived from a monthly survey that NAHB has been conducting for 30 years, the NAHB/Wells Fargo Housing Market Index gauges builder perceptions of current single-family home sales and sales expectations for the next six months as “good,” “fair” or “poor.” The survey also asks builders to rate traffic of prospective buyers as “high to very high,” “average” or “low to very low.” Scores from each component are then used to calculate a seasonally adjusted index where any number over 50 indicates that more builders view conditions as good than poor. All three HMI components posted gains in August. The indices gauging current sales conditions and expectations for future sales each rose two points to 58 and 65, respectively. The index gauging traffic of prospective buyers increased three points to 42. This graph show the NAHB index since Jan 1985.
AIA: Architecture Billings Index increased in July, "Highest Mark Since 2007" - This index is a leading indicator primarily for new Commercial Real Estate (CRE) investment. From AIA: Architecture Billings Index Reaches Highest Mark Since 2007 The last three months have shown steadily increasing demand for design services and the Architecture Billings Index (ABI) is now at its highest level since 2007. As a leading economic indicator of construction activity, the ABI reflects the approximate nine to twelve month lead time between architecture billings and construction spending. The American Institute of Architects (AIA) reported the July ABI score was 55.8, up noticeably from a mark of 53.5 in June. This score reflects an increase in design activity (any score above 50 indicates an increase in billings). The new projects inquiry index was 66.0, following a very strong mark of 66.4 the previous month. The AIA has added a new indicator measuring the trends in new design contracts at architecture firms that can provide a strong signal of the direction of future architecture billings. The score for design contracts in July was 54.9. • Regional averages: Northeast (55.5), South (55.1), Midwest (54.1), West (53.5) This graph shows the Architecture Billings Index since 1996. The index was at 55.8 in July, up from 53.5 in June. Anything above 50 indicates expansion in demand for architects' services. Note: This includes commercial and industrial facilities like hotels and office buildings, multi-family residential, as well as schools, hospitals and other institutions. According to the AIA, there is an "approximate nine to twelve month lag time between architecture billings and construction spending" on non-residential construction. So the readings over the last year suggest an increase in CRE investment this year and in 2015.
A National Debt Registry? -- There's a fascinating long magazine piece in the NYTimes about consumer debt sales and collection. The piece ends by asking why we don't have a national debt registry, as if that were the solution to all debt collection problems. Unfortunately, the author only asked the FTC about this issue (and acknowledges that it isn't in FTC jurisdiction), not the CFPB, and the author doesn't consider any of the problems with creating and implementing a debt registry. As the case of MERS shows, it isn't so easy to create a well-functioning registry of property rights of any sort. Let me illustrate a few challenges to creating a debt registry: First, there's the question of who gets to input information into the system. If the system is open to everyone, what stops me from claiming that Bob Lawless is a notorious deadbeat who owes thousands to me? Perhaps a lawsuit from Bob, but I could make a lot of trouble for him before he gets the debt cleaned up. Second, what ensures that information is accurately entered into the system? Local land records (excluding the handful of Torrens systems around) do not vouch for the accuracy of mortgage or sale filings. Accuracy is both a matter of correct data entry and of timely data entry. The MERS system has had problems with both--information isn't always entered correctly and often it isn't entered at all (or at least in a timely fashion). Third, who can view the system? This is a huge set of privacy concerns. Right now, if I wanted to find out what debts Bob Lawless owes, I would not have any easy, legal way to do so. I have no right to obtain Bob's credit report or to open his mail or read his emails. My guess is that Bob likes it this way--he'd rather not have me and all of his blog-groupies and students knowing the balance on his credit cards or wondering what procedure he had done for which a certain doctor's office (with a revealing speciality title) says he owes money.
Inside the Dark, Lucrative World of Consumer Debt Collection - Some of the deals Siegel made were hugely profitable, while others proved more troublesome. As he soon discovered, after creditors sell off unpaid debts, those debts enter a financial netherworld where strange things can happen. A gamut of players — including debt buyers, collectors, brokers, street hustlers and criminals — all work together, and against one another, to recoup every penny on every dollar. In this often-lawless marketplace, large portfolios of debt — usually in the form of spreadsheets holding debtors’ names, contact information and balances — are bought, sold and sometimes simply stolen.Stolen. This was the word that was foremost in Siegel’s mind on that October afternoon. He had strong reason to believe that a portfolio of paper — his paper — had been stolen and was now being “worked” by one of the many small collection agencies on the impoverished and crime-ridden East Side of Buffalo. Using his spreadsheets, this unknown agency was calling his debtors and collecting debt that was rightfully his. The debtors, of course, had no way of knowing who actually owned the debt. Nor did they have any reason to suspect that they might be paying thieves. They were simply being told they owed the money and had to pay.
The Psychological Damage of the Recession Is Not Going Away - - The U.S. economy has nearly recovered. Now someone has to convince Americans. Nearly half think the United States is still in recession, according to a recent Wall Street Journal poll. Some 76 percent don’t think their children’s generation will have a better life than they did. Americans are right to think they are worse off: Even if they have recovered financially, they have become aware that the economy is riskier than it used to be. They might never bounce back from that. Economic well-being is not limited to wealth, earnings, and employment; security matters, too. All else being equal, a riskier environment is worse, economically speaking. Financial markets may be less volatile, but structural changes in the economy have increased risk for most Americans’ largest asset: future earnings. Lifetime earning power has been getting less certain for decades, but it took the recession to make people realize it. In 2002, one out of two Americans expected real income gains in the next five years, according to the Index of Consumer Sentiment; by 2013, only one in three did. It is well known that real median earnings didn’t increase in the last 20 years; overall earnings have become more volatile, too. The amount that the average household’s earnings fluctuate each year has been increasing (PDF) since the 1980s. Household finances also are less secure because people have less liquid savings and more debt. The economic stress associated with the recession made these trends more apparent.
Consumer Prices in U.S. Rise at Slowest Pace in Five Months -- The cost of living in the U.S. climbed in July at the slowest pace in five months, indicating price pressures remain limited even as the economy picks up. The consumer price index increased 0.1 percent, matching the median forecast of 80 economists surveyed by Bloomberg, after rising 0.3 percent the prior month, a Labor Department report showed today in Washington. Stripping out volatile food and fuel, the so-called core measure also climbed 0.1 percent, less than projected. Inflation continues to run below the Federal Reserve’s target as sluggish global demand limits companies’ ability to charge customers more. Restrained increases give the central bank’s policy makers room to keep interest rates low well after the projected end of their bond-buying program in October. “Some of the inflation concerns that you were hearing back in June will probably ease off a little bit,” said Michael Feroli, chief U.S. economist at JPMorgan Chase & Co. in New York and the second-best forecaster of consumer prices over the last two years, according to Bloomberg data. “It takes some pressure off the Fed to speed up rate normalization. There had been a lot of rhetoric about the Fed being behind the curve on inflation, and this probably takes some wind out of that.”
Core CPI Rises At Slowest Pace In 14 Months As Food Costs Jump - Consumer Price Inflation rose a mere 0.1% MoM in July, its equal lowest since November 2013 and in line with expectations as falling energy and transportation costs (both -0.3% MoM) led the stabilization (with a 5.9% plunge in airfares). The biggest drop was in personal computers (-1% MoM) which is now -6.0% year-over-year. Food prices rose 0.4% MoM. Ex-food-and-energy, prices also rose 0.1%, missing the 0.2% expectations, to the slowest pace of core inflation since April 2013. So much for all that inflation is about to break out and tear bond yields higher chatter... (no matter how real or unreal the government's hedonically-manipulated data is). The 2-month change in Core CPI swung from hottest in 7 years to coldest in 14 months...
July Inflation Update -- I have been looking at core inflation without shelter. To the extent that very low long term interest rates are driving home prices, shelter inflation may be a countercyclical indicator. (To be clear, I think rent equivalent is the appropriate inflation measurement to use. The notion that a context of moderate rent inflation, very low interest rates, and rising home values is inflationary is dangerously wrong.) In this context, a crippled credit market is artificially curbing demand for homes, reducing the supply of new homes. The effect is that an undersupply of homes is leading to rent inflation. As credit markets loosen, home supply will respond. Oddly, in this way, demand recovery will be a supply recovery. Recovery of real estate credit markets may actually suppress nominal GDP relative to real GDP, as it is (correctly) measured. In the first graph, we can see that core-less-shelter inflation swung down. All the net core inflation in the month came from shelter. This is the second month of moderating inflation after several months of increasing inflation, which clouds the picture of where inflation my be leading as QE3 ends. The continued strength in shelter inflation suggests that we are still early in the credit market recovery. The real estate recovery should create a bit of a virtuous circle, as the continued re-inflation of property values feeds back into credit creation and reduces mobility frictions. As long as this is allowed to continue, home prices should continue to rise, home supply should increase, and rent inflation should moderate.
Reality check: Here’s what it looks and feels like when inflation really is sky high -- America faces many economic challenge, but inflation — at least as defined as an “ongoing rise in the general level of prices” — hasn’t been one of them. Some folks on the right argue otherwise, but they are simply wrong. As the Bureau of Labor Statistics reported today, the Consumer Price Index for All Urban Consumers, CPI-U, rose just 2.0% over the past 12 months. If you exclude volatile food and energy prices, the index is up 1.9%. (Private measures tells a similar story.) Cold comfort, of course, if your wages are stagnant or falling. But those are economic growth or redistribution issues, not a “the Fed is too easy” issue. (In fact, a tighter Fed the past five years might have dragged the US into a EU-style long recession.) And what about food prices? Aren’t they up a lot? Well, since CPI is an average, some prices will likely be up more than others. And food prices have been rising faster than the CPI average. Economist Chris Christopher of IHS Global Insight: “Lower and middle income households are likely to be paying a larger percentage of their But as Paul Dale of Capital Economics points out in a morning note, food price rises are (a) hardly hyper-inflationary and (b) may be ready to slow: The chunky 0.4% m/m gain in food prices was offset by a 0.3% m/m decline in energy prices. Food price inflation has now risen to a two-year high of 2.6%, but the latest decline in agricultural commodity prices suggests it has peaked. What’s more, both gasoline and natural gas prices have continued to fall.
Graph of the Day: Just how tight is the relationship between inflation and wage growth? (Answer: not very) - There’s been of late an interesting outpouring of quality research on one of my favorite topics: the relationship between labor market slack and wage growth. I’ve got a longer piece on this coming out later, but the punchline is, as you probably know if you’re drawing a paycheck: considerable slack remains in the job market and it’s still a drag on the real wage growth of most workers. I’ve got links below to the pieces I cite in my forthcoming analysis, but here’s a figure I think deserves more attention than I gave it, from this new paper by economists at the Cleveland Fed. It takes a bit of explaining. The lines in the figure show the errors from a model designed to predict inflation. .. But what the researchers were really asking here is whether adding wages to the model improved its accuracy. After all, there’s a lot of folks running around claiming that unless they want to face uncontrollable (or un-anchored, in Fed jargon) inflation, the Fed better take pre-emptive action against incipient wage growth. Yet, as this and other analysis in the paper reveal, linkages between wage and price growth are but weakly correlated. Adding various different wage series (that’s what those acronyms are: AHE, CPG, ECI) to a forecast model for inflation hardly improves its accuracy at all.What’s the implication? It’s that Fed policy makers should not assume that wage growth is de facto inflationary. Go ahead and keep your powder dry, FOMC, but in the words of my monetary policy mentor, Dr. Robert Marley, when it comes to wage growth, don’t “kill it before it grows!”*
Gasoline Price Update: Down for the Seventh Consecutive Week - It's time again for my weekly gasoline update based on data from the Energy Information Administration (EIA). Rounded to the penny, Regular and Premium dropped three cents, the seventh week of price declines. Regular is up 28 cents and Premium 26 cents from their interim lows during the second week of last November. According to GasBuddy.com, two states (Hawaii and Alaska) have Regular above $4.00 per gallon, unchanged from last week, and no states are averaging above $3.90, unchanged from week. South Carolina has the cheapest Regular at $3.13.
Subprime Auto Lending Rise Not Yet Worrisome: N.Y. Fed Economists - A recent spike in subprime auto lending does not look excessive, considering gains in the broader car industry, according to economists from the Federal Reserve Bank of New York. Overall lending in the auto sector approached an eight-year high in the second quarter while mortgage lending hit a 14-year low—confounding economists about the outlook for U.S. consumer spending. The boom in auto loans has led to increased regulatory scrutiny. Earlier this month, the Justice Department told General Motors Co. to turn over documents linked to its subprime car loan operations dating back to 2007. However, the New York Fed economists are more sanguine about the increase in subprime auto lending activity. They say that, in the context of a broader boom in car sales, the increase in the subprime sector is not disproportionate. “Subprime auto lending is definitely on the rise in absolute terms, although the increase in prime auto lending over the same period makes the relative increase in the subprime share less pronounced,” the authors said in the New York Fed’s Liberty Street Economics blog. “We will continue to monitor this ongoing change in the consumer lending market.”
Car Repos Soar 70% As Auto Subprime Bubble Pops; "It's Contained" Promises Fed - The auto loan subprime bubble may be the latest to burst (after student loans) as the rate of car repossessions jumped 70.2 percent in the second quarter, with much of that increase coming from finance companies not run by automakers, banks or credit unions. "The number of delinquencies and repossessions rising is what we would expect as the auto industry sells more vehicles," "But this slight uptick is one to keep an eye on." The surge in delinquencies and repossessions is being driven primarily by borrowers with subprime and deep subprime credit scores.
DOT: Vehicle Miles Driven increased 0.9% year-over-year in May - The Department of Transportation (DOT) reported:Travel on all roads and streets changed by +0.9 (2.4 billion vehicle miles) for May 2014 as compared with May 2013. Travel for the month is estimated to be 264.2 billion vehicle miles. Cumulative Travel for 2014 changed by +0.2 (2.9 billion vehicle miles).The following graph shows the rolling 12 month total vehicle miles driven. The rolling 12 month total is still mostly moving sideways ..Currently miles driven has been below the previous peak for 78 months - 6 1/2 years - and still counting. Currently miles driven (rolling 12 months) are about 2.2% below the previous peak. The second graph shows the year-over-year change from the same month in the previous year. In May 2014, gasoline averaged of $3.75 per gallon gallon according to the EIA. That was up from May 2013 when prices averaged $3.67 per gallon. Of course gasoline prices are just part of the story. The lack of growth in miles driven over the last 6+ years is probably also due to the lingering effects of the great recession (high unemployment rate and lack of wage growth), the aging of the overall population (over 55 drivers drive fewer miles) and changing driving habits of young drivers.
ATA Trucking Index increased 1.3% in July - Here is a minor indicator that I follow, from ATA: ATA Truck Tonnage Index Increased 1.3% in July American Trucking Associations’ advanced seasonally adjusted For-Hire Truck Tonnage Index rose 1.3% in July, following a decrease of 0.8% the previous month. In July, the index equaled 130.2 (2000=100) versus 128.6 in June. The index is off just 0.6% from the all-time high in November 2013 (131.0). Compared with July 2013, the SA index increased 3.6%, up from June’s 2.3% year-over-year gain. The latest year-over-year increase was the largest in three months. ...“After a surprising decrease in June, tonnage really snapped back in July,” said ATA Chief Economist Bob Costello. “This gain fits more with the anecdotal reports we are hearing from motor carriers that freight volumes are good.” Costello added that tonnage is up 4.9% since hitting a recent low in January.“The solid tonnage number in July fits with the strong factory output reading and a jump in housing starts for the same month,” he said. “I continue to expect moderate, but good, tonnage growth for the rest of the year.” Here is a long term graph that shows ATA's For-Hire Truck Tonnage index.
Philly Fed Manufacturing Survey increases to 28 in August, Highest since March 2011 - Earlier from the Philly Fed: August Manufacturing Survey The diffusion index of current general activity increased from a reading of 23.9 in July to 28.0 this month. The index has increased for three consecutive months and is at its highest reading since March 2011 The new orders and shipments indexes remained positive but fell to near their levels in June. The new orders index decreased 20 points [to 14.7], while the shipments index decreased 18 points.The current indicators for labor market conditions suggested continued modest expansion in employment. The employment index remained positive for the 14th consecutive month but declined 3 points from its reading in July [to 9.1] ...Most of the survey’s broad indicators of future growth showed improvement this month. The future general activity index increased 8 points and is at its highest reading since June 1992. This was above the consensus forecast of a reading of 15.5 for July. Here is a graph comparing the regional Fed surveys and the ISM manufacturing index. The dashed green line is an average of the NY Fed (Empire State) and Philly Fed surveys through August. The ISM and total Fed surveys are through July.
Philly Fed Business Outlook: Highest Six-Month Outlook in 22 Years - The Philly Fed's Business Outlook Survey is a monthly report for the Third Federal Reserve District, covers eastern Pennsylvania, southern New Jersey, and Delaware. The latest gauge of General Activity came in at 28.0, an increase from last month's 23.9. The 3-month moving average came in at 23.2, up from 19.0 last month. Since this is a diffusion index, negative readings indicate contraction, positive ones indicate expansion. Today's stunner: The six-month outlook at 64.4 is a 22-year high -- the highest since June of 1992. Here is the introduction from the Business Outlook Survey released today: Indicators for the August Business Outlook Survey suggest that the region’s manufacturing sector is continuing to grow. The survey’s indicator for general activity was higher this month, but indicators for new orders, shipments, and employment, while positive, fell from their readings in July. The survey’s broad indicators of future activity increased, suggesting that firms remain optimistic about continued growth over the next six months. (Full PDF Report) The first chart below gives us a look at this diffusion index since 2000, which shows us how it has behaved in proximity to the two 21st century recessions. The red dots show the indicator itself, which is quite noisy, and the 3-month moving average, which is more useful as an indicator of coincident economic activity. We can see periods of contraction in 2011 and 2012 and a shallower contraction in 2013. The indicator is now above its post-contraction peak in September of last year.
Philly Fed Surges To Highest Since March 2011 Despite Plunge In Jobs & New Orders - Philly Fed has beaten expectations for 6 months in a row with its biggest surge since the 2009 lows. Against expectations of 19.3, Philly Fed printed 28.0 - highest since March 2011 all-time highs. All sounds awesome right? Umm, no, 7 of 9 internal declined including - New Orders tanked, Employment tumbled, Prices Paid plunged, and Prices Received slumped. So, in case you were wondering how it is possible that Philly Fed surged given such shitty internals, the 6-month forecast index ("hope") just surged to 22-year highs. And not only that: put all hopes of that long-delayed CapEx renaissance on hold: "While most broad indicators of future growth have been improving, the survey’s future capital spending index has been slipping. Although the index decreased just 1 point this month, its reading, at 17.5, is now the lowest it has been in seven months."
U.S. factory activity expands at fastest pace in over four years in Aug: Markit (Reuters) - - The U.S. manufacturing sector expanded in August, with the rate of growth exceeding expectations and moving at the fastest pace in more than four years, an industry report showed on Thursday. Financial data firm Markit said its preliminary or "flash" U.S. Manufacturing Purchasing Managers Index rose to 58 in August, which was its highest since April 2010, from 55.8 in July. Economists polled by Reuters expected a reading of 55.7. A reading above 50 signals expansion in economic activity. true The output subindex jumped to 60.2 from last month's 59.7. "August’s survey delivers further evidence that robust manufacturing growth momentum has been sustained through the third quarter, with overall business conditions improving at the fastest pace for over four years," said Tim Moore, senior economist at Markit. "It seems US manufacturers are increasingly confident that the recovery is firmly back on track and are gearing up for a sustained rebound in production schedules over the months ahead." Markit's gauge of employment in the manufacturing sector rose to 54.6 from 51.2, and was at its highest since a matching 54.6 in March 2013.
US Manufacturing PMI Surges To Over 4-Year High, Biggest Beat On Record - Following July's drop in US Manufacturing PMI (and biggest miss in 11 months), August's Flash print hit 58.0 - its highest since April 2010, beating expectations of 55.7 and up from the 55.8 July final print. With China (biggest PMI miss on record) and Europe (13-month low PMI) both disappointing, the world needed some help and the US 'soft' survey offered it up in spades... Production levels surged, employment rose at the fastest pace since March 2013, and new orders picked up once again. This was the biggest beat on record - well above even the highest economist's estimate. Mission Accomplished...
We Just Witnessed A Historic Month For Commercial Aircraft Orders - People ordered a ton of airplanes in July. In a note to clients, Brian Jones at Societe Generale said he expects durable goods orders rose 24.5% in July, up from 1.7% in June, and topping the current record high monthly percentage increase. The catalyst? Airplanes. Jones notes that Boeing reported a record 324 commercial aircraft were ordered in July, nearly three-times the 109 ordered in June, with the composition of these orders weighted towards the company's more expensive models. Boeing's orders totaled an estimated $98.3 billion, Jones estimates, and he expects the Census' durable goods report next week to show an increase in aircraft bookings that is about half that amount. Jones writes that, "While market participants have been trained to strip out the ever-volatile transport category when assessing a report, July’s projected moon shot, with its implications for future nondefense capital goods shipments, may indeed be too large to ignore." Here's the eye-popping chart that shows the projected increase in airplane sales.
LA area Port Traffic: A little soft due to strike in July -- Container traffic gives us an idea about the volume of goods being exported and imported - and possibly some hints about the trade report for June since LA area ports handle about 40% of the nation's container port traffic. There was a 5 day trucker strike at both the ports of Long Beach and Los Angeles that probably impacted traffic. The following graphs are for inbound and outbound traffic at the ports of Los Angeles and Long Beach in TEUs (TEUs: 20-foot equivalent units or 20-foot-long cargo container). To remove the strong seasonal component for inbound traffic, the first graph shows the rolling 12 month average. On a rolling 12 month basis, inbound traffic was down 0.1% compared to the rolling 12 months ending in June. Outbound traffic was also down 0.1% compared to 12 months ending in June. Inbound traffic has been increasing, and outbound traffic has been moving up a little recently after moving sideways. The 2nd graph is the monthly data (with a strong seasonal pattern for imports). Usually imports peak in the July to October period as retailers import goods for the Christmas holiday, and then decline sharply and bottom in February or March (depending on the timing of the Chinese New Year). Imports were down slightly year-over-year in July, exports were also down slightly year-over-year. Overall traffic was a little soft in July probably due to the short strike. It is possible traffic will be close to the pre-recession peaks over the next few months.
Michael Strain: Here’s how we should fix US infrastructure — and boost upward mobility -- In his Washington Post column, AEI economist Michael Strain makes the case that any way you want to massage the data, it’s clear the US has an infrastructure problem. So how can you go about fixing and upgrading the power grid, bridges, roads, and schools without turning the whole effort into a top-down, Keynesian boondoggle? Keep the project-picking local and give cities and states the flexibility to figure out how to fund their share. What’s more, helping upward mobility for working-class Americans should be a key policy goal. Strain: The amount of money involved could be relatively small: We could simply buy buses, have them pick up workers in lower-income, outer neighborhoods and exurbs, and then run them express from those places — not stopping along the way in middle- and upper-income neighborhoods — all the way into commercial centers. In larger cities, we could run the buses express from low-income exurbs to the last stop on commuter rail lines; basically, we could give low-income workers a fast lift to the train, connecting residents of exurbs with the labor markets of major cities. Buses are great because they’re flexible, cheap and use existing roads. Additionally, we could spend more money to build more sophisticated transportation networks — more roads, maybe rail; roads that function as dedicated bus lanes? — to support working-class Americans in their noble effort to earn their own success in the labor market. By significantly decreasing commuting times from lower-income neighborhoods and exurbs — which are often measured in hours, not minutes — we would effectively increase the number of jobs available to low-income workers. Some workers on the margin of participating in the labor market may enter if their commute time is one hour rather than two. The long-term unemployed, currently in the labor market, would have more jobs to which they could apply. And the quality of life for low-income workers with long commutes would increase.
Weekly Initial Unemployment Claims decrease to 298,000 - The DOL reports: In the week ending August 16, the advance figure for seasonally adjusted initial claims was 298,000, a decrease of 14,000 from the previous week's revised level. The previous week's level was revised up by 1,000 from 311,000 to 312,000. The 4-week moving average was 300,750, an increase of 4,750 from the previous week's revised average. The previous week's average was revised up by 250 from 295,750 to 296,000. There were no special factors impacting this week's initial claims. The previous week was revised up to 312,000. The following graph shows the 4-week moving average of weekly claims since January 1971.
Why Are Jobless Claims Falling So Fast? - The number of people filing new claims for unemployment benefits fell last week to 298,000, marking the third time in the last five weeks they have fallen below the 300,000 level. The last time claims were so low was in early 2000 and 2006, at the height of previous economic expansions. Jobless claims, a proxy for layoffs, are also near record lows when population growth is taken into account. Yet the improvement seems out of step with other labor-market indicators. The nation’s unemployment rate was 6.2% in July, a historically elevated rate for this point in the recovery, and many economists believe even that gauge overstates the true health of the job market. The jobless rate doesn’t capture, for example, discouraged workers who have given up their job searches. Economists believe that one reason for a lower rate of layoffs is a labor market that has become generally less dynamic over the last few decades. Employers have become less likely to lay off workers over time, though they have also grown more cautious about hiring. Similarly, workers have grown more reluctant to change jobs, possibly stunting career development and earnings growth as a result. But more recently, most of the fall in jobless claims has been driven by a decline in the number of the newly laid off who don’t bother to apply for government benefits in a generally improving economy.
Americans' Satisfaction With Job Security at New High: In the U.S., 58% of full- or part-time workers are completely satisfied with their job security. This represents an increase from the levels recorded during the aftermath of the Great Recession -- from 2009 to 2013 -- when roughly 50% of Americans said they were completely satisfied. While workers' satisfaction with their job security has varied at least slightly from year to year, it has been consistently lower in the past five years than in the period immediately prior to the 2007-2009 recession. The weak economy and soft job market during that period appear to have caused workers to feel less secure in their employment, even after the U.S. unemployment rate fell from its peak in 2010. Now, with unemployment down to nearly 6%, Americans are finally showing more confidence in their job security -- in fact, more confidence than at any point in Gallup's trend. This trend complements the decline in worker concern about being laid off, which dropped this year to levels not seen since the recession. Workers' overall satisfaction with several specific aspects of their jobs increased between 2013 and 2014. Last year, 54% of workers were completely satisfied with the amount of vacation time they receive. This increased by five percentage points to 59% in 2014. In 2013, 56% were satisfied with their boss or immediate supervisor. In 2014, 60% are satisfied -- a four-point increase.
Lagging Demand, Not Unmployability, Is Why Long-term Unemployment Remains So High - While the rate of short-term unemployment (joblessness lasting less than 27 weeks) has fallen to almost pre-Great Recession levels, the rate of long-term unemployment (joblessness lasting for 27 weeks or more) is still significantly elevated from its pre-Great Recession levels. This has led some economic observers to infer that there is actually less labor market slack in the U.S. economy than the overall rate of unemployment would suggest. This argument hypothesizes that movements in the short-term unemployment (STU) rate are largely cyclically determined, but that the long-term unemployment (LTU) rate is now essentially a component of “structural” unemployment. Structural unemployment is when workers don’t have the skills that employers are currently demanding, do not live where jobs using their skills are located, or face some other barrier to finding work that cannot be solved by an increase in aggregate demand relative to potential supply. Cyclical unemployment, conversely, can be addressed by boosting aggregate demand relative to potential supply. This briefing paper examines competing explanations for the still-elevated long-term unemployment rate (LTUR) and assesses what if anything the elevated LTUR means for estimates of how much slack remains in the U.S. labor market.
Cyclical vs. Structural: Bivens and Shierholz Turn Over Every Stone to Find Out - Jared Bernstein - As central bankers gather for their annual conference in Jackson Hole, Wyoming, a top agenda item is evaluating the current and future amount of slack in the US economy. In this regard, they’d be well advised to check out this new study from the two economists at the Economic Policy Institute which provides an exhaustive examination of the issue. Read the paper yourself, or at least just look at the figures and tables, but here are some highlights:
- –actual GDP still remains well below potential GDP, even as the deep recession and weak recovery has reduced the latter;
- –inflation and the growth of unit labor costs (real compensation growth adjusted for productivity) remain historically low even in the face of sharp increases in the money supply;
- –interest rates remain very low even in the face (at least a few years ago) of large budget deficits, though of course the Fed itself is a key determinant of this outcome;
- –corporate profits remain high and the labor share of national income remains low, suggesting labor market slack, lack of wage pressures, and room for non-inflationary growth “paid for” through a rebalancing of these “factor shares.”
- –neither measures of quantity (unemployment) or price (wages) reveal evidence of a skills mismatch—a structural problem—in the job market;
- –as a number of papers have shown in recent weeks, long-term unemployment is a factor depressing wage growth, meaning that these job seekers represent cyclical, not structural, labor market slack;
- –in fact, long-term unemployment rate, which has in fact responded in a cyclical manner in recent months (i.e., it’s fallen fairly sharply as the job market has improved) is about where you’d expect it to be given the cyclical slack documented throughout the piece.
Rising Robots: Is it Obvious Robots Cost Human Jobs? Looking for Someone to Blame? -- Technology Review has an interesting infographic on the Rising Use of Robots, and which sectors show the biggest increase in use. I broke up the infographic into a series of smaller ones for purposes of discussion, adding red, blue, and purple colored boxes in the following chart.
- In Europe, except Germany, robot usage is up and employment down.
- In the US, South Korea, and Germany, robot usage is up and so in human employment.
- I Japan robot usage and employment are both down.
One Paragraph Cuts Through The Hype Of Robots Taking Your Job -- The official schedule for the Jackson Hole economic conference is up, and there have been several papers posted. One very interesting paper comes from MIT professor David Autor, who discusses the potential impact of robots and computers on future employment trends. Autor offers up this paragraph to explain why robots might always have a challenge learning certain tasks. Just imagine the difficulty in trying to identify something as simple as a "chair." To give this skepticism heft, return to the challenge of training a machine to recognize a chair. Ultimately, what makes an object a chair is that it is a device purpose-built for a human being to sit upon. This “purposiveness” may be difficult for a machine learning algorithm to infer, even given an arbitrarily large training database of images. As Grabner et al. (2011) argue, it is likely that humans recognize chairs not simply by comparing candidate objects to statistically probable feature sets but also by reasoning about the attributes of the object to assess whether it is likely intended to serve as a chair. For example, both a toilet and a traffic cone look somewhat like a chair, but a bit of reasoning about their shapes vis-à-vis the human anatomy suggests that a traffic cone is unlikely to make a comfortable seat. Drawing this inference, however, requires reasoning about what an object is “for” not simply what it looks like. Contemporary object recognition programs do not, for the most part, take this reasoning-based approach to identifying objects, likely because the task of developing and generalizing the approach to a large set of objects would be extremely challenging. One is reminded of Carl Sagan’s remark that, “If you wish to make an apple pie from scratch, you must first invent the universe.”
Seeking New Start, Finding Steep Cost -- Millions of unemployed Americans have trained for new careers as part of the Workforce Investment Act, a $3.1 billion federal program that, in an unusual act of bipartisanship, was reauthorized by Congress last month with little public discussion about its effectiveness. Like Mr. DeGrella, many have not found the promised new career. Instead, an extensive analysis of the program by The New York Times shows, many graduates wind up significantly worse off than when they started — mired in unemployment and debt from training for positions that do not exist, and they end up working elsewhere for minimum wage. Split between federal and state governments — federal officials dispense the money and states license the training — the initiative lacks rigorous oversight by either. It includes institutions that require thousands of hours of instruction and charge more than the most elite private colleges. Some courses are offered at for-profit colleges that have committed fraud in their search for federal funding. This includes Corinthian Colleges Inc., which reached an agreement last month with the federal Education Department to shut down or sell many of its campuses.The Times examination, based on state and federal documents, school and court records, and interviews, shows that some of the retraining institutions advertise graduation and job-placement rates that often do not hold up to scrutiny. The idea of dividing responsibility between federal and state officials was to give local and state authorities more power in helping the unemployed in their areas. But the unemployed who sign up for training are often left to navigate a bureaucratic maze with almost no guidance. To avoid any appearance of favoritism, federal job counselors are not allowed to recommend schools to job seekers, leaving many of the unemployed to unwittingly select institutions that are expensive, have a history of legal trouble or are academically substandard. There is, for example, no mechanism for students to check in with counselors to gauge their progress or determine whether the training program is a good match. States say they investigate complaints and audit programs with poor outcomes, but students say they tend not to register formal complaints about a program’s quality.
Blame Employers, Not Workers, for Any Skills Gap, Economist Says - Ever since the the recession, job openings have far outpaced the number of people being hired. A common refrain from employers is that workers lack proper training and education for the available jobs–in other words, that a “skills gap” is to blame. But the fault rest with employers, not workers, says a new working paper from Peter Cappelli, the director of the Center for Human Resources at the Wharton School.“These complaints about skills are driving much of the debate around labor force and education policy, yet they have not been examined carefully,” writers Mr. Cappelli. And, to be sure, employers are filling jobs more slowly than in the past. One index showing this is the Dice-DFH Vacancy Duration Measure, which uses Labor Department data to calculate how long job vacancies sit before being filled. In June, the latest month available, the average opening lingered for 24.9 working days before being filled, up from 15 days in 2009. But does this result from employees with the wrong skills? Mr. Cappelli looks at major studies claiming a skills gap and criticizes their evidence. For example, the questions used in surveys where employers say they cannot find employees have often been badly written. Mr. Cappelli says a better explanation of the inability to fill certain jobs rests with employers themselves. The “obvious solution” to “virtually all the skill problems reported by employers is to increase training and produce the skilled workers they want themselves.”
Long-Term Trends More Worrisome Than Sudden Crash - Employment losses during the Great Recession may have had more to do with factors like the rise of Walmart than with the recession itself, two economists say in a new academic paper. The paper, presented Friday morning at the annual gathering of economists and central bankers at Jackson Hole, Wyo., argues that the share of Americans with jobs has declined because the labor market has stagnated in recent decades — fewer people losing or leaving jobs, fewer people landing new ones. This dearth of creative destruction, the authors argue, is the result of long-term trends including a slowdown in small business creation and the rise of occupational licensing.“These results,” wrote the economists Stephen J. Davis, of the University of Chicago, and John Haltiwanger, of the University of Maryland, “suggest the U.S. economy faced serious impediments to high employment rates well before the Great Recession, and that sustained high employment is unlikely to return without restoring labor market fluidity.” Their findings contribute to the growing genre of papers that purport to show that the weakness of the American economy is caused largely by problems that predate the recession — and that the Federal Reserve can’t remedy them with low interest rates.
Household income hasn't shared in recovery - Five years after the official end of the Great Recession, median household income is still below where it was before the recession hit. As of June, median annual household income was 4.8 percent below December 2007, when the recession began, dropping from $56,000 to $54,000. Going back to the good old days, it's down 5.9 percent from January 2000, according to the Sentier Research Group, which compiled the numbers from the latest Current Population Survey by the U.S. Census Bureau. Average weekly earnings of private employees, for example, have increased a smidgen, from $825 in December 2007 (in 2014 dollars) to $844 today. On the household income front, there is one set of winners - those age 65 and older, who gained an average of close to 6 percent since 2009. Everyone else (except the affluent) lost, especially those between ages 55 and 64 (down 6.4 percent) and between 25 and 34 (5.2 percent). Hardest hit: the unemployed (down 23.5 percent), part-time workers (8.9 percent) and African Americans (7.7%) since 2009. Overall, Sentier sees "some measurable recovery" five years after the official end of the recession - but "gains have not been evenly shared." Clearly.
Why the Middle Class Isn’t Buying Talk About Economic Good Times : For five years, the United States economy has been expanding at a steady clip, the stock market soaring, the headlines filled with talk of recovery. Yet public opinion polling shows most Americans still think the economy is pretty miserable. What might account for the paradox? New data from a research firm offers a simple, frustrating answer: Middle-class American families’ income is lower now, when adjusted for inflation, than when the recovery began half a decade ago.Sentier Research, a firm led by former census officials, used census data to tabulate an estimate of the median household income — how much is earned by families at the exact middle of the nation’s income distribution. In June 2014, it found in a report issued Wednesday, the median household income was $53,891, down from $55,589 in inflation-adjusted dollars when the economic expansion began in June 2009.The economic paradox isn’t much of a paradox at all in this light: The purchasing power of the typical American family is 3.1 percent lower now than it was five years ago. No wonder people are unhappy about the economy! The benefits of rising levels of economic activity have simply not accrued to middle-income wage earners.
This chart shows the stunning disappearance of middle-class jobs — everywhere - You are not imagining it. The above chart is from “Polanyi’s Paradox and the Shape of Employment Growth, “ a new paper (my analysis to come) by David Autor at the Federal Reserve’s Jackson Hole conference. And here is how Autor defines, high-, middle-, and low-wage jobs:High-paying occupations are corporate managers; physical, mathematical and engineering professionals; life science and health professionals; other professionals; managers of small enterprises; physical, mathematical and engineering associate professionals; other associate professionals; life science and health associate professionals.Middle-paying occupations are stationary plant and related operators; metal, machinery and related trade work; drivers and mobile plant operators; office clerks; precision, handicraft, craft printing and related trade workers; extraction and building trades workers; customer service clerks; machine operators and assemblers; and other craft and related trade workers. Low paying occupations are laborers in mining, construction, manufacturing and transport; personal and protective service workers; models, salespersons and demonstrators; and sales and service elementary occupations.
Autor Paper at Jackson Hole: Automation Is Polarizing the Labor Market –In an essay in The Wall Street Journal last month, Harvard University economist Lawrence Summers envisioned a world in which computers and machines displace a vast new array of human work, creating an economy that produced few opportunities and sources of income for actual people. Taxis wouldn’t need drivers, nor retailers cashiers or banks financial analysts. “The challenge for economic policy will increasingly be generating enough work for all who need work for income, purchasing power and dignity,” he argued. David Autor, a Massachusetts Institute of Technology economics professor, argues in a paper to be presented Friday that automation is creating a different kind of problem for the economy. Rather than destroying jobs broadly, it is polarizing the labor market. While thinning out the ranks of middle-class jobs easily replaced by machines, he argues automation is increasing the ranks of low-skilled workers who perform tasks that can’t easily be displaced by machines — like cooks or home health workers — and the ranks of high-end workers with abstract thinking skills that computers can’t match. In 1979, middle-income jobs in sales, office work, manufacturing and administrative work accounted for 60% of U.S. employment. By 2012, these jobs had declined to 46% of employment, while the share of high-end and low-end work expanded, Mr. Autor shows. The biggest beneficiaries are people at the high end. “From 1979 through 2007, wages rose consistently across all three abstract task-intensive categories of professional, technical and managerial occupations,” Mr. Autor argued. Their work tends to be complemented by machines, he argued, making their services more valuable. By contrast, wage growth in the middle has been anemic and pressured at the low end by middle-income workers looking for income at lower-end jobs.
Broadening Agreement That Job Polarization Wasn’t Present in the United States In 2000s - A common but erroneous theme in the media about recent labor market trends is that technology (the robots!) threatens job growth and is the cause of wage stagnation and inequality. Politicians, policymakers, and pundits echo this as well. These insights come from research on the “job polarization hypotheses”—the claim that computerization leads to the “simultaneous growth of high-education, high-wage and low-education, low-wages jobs at the expense of middle-wage, middle education jobs” and, correspondingly, to wage polarization. It is noteworthy, therefore, that MIT Professor David Autor, the leading intellectual architect of the job polarization hypothesis, has presented a paper at the Federal Reserve Bank of Kansas City’s economic policy symposium in Jackson Hole, Wyo., which finds that job polarization did not occur in the 2000s and that, in any case, job polarization is not necessarily connected to wage polarization. In 2010, Autor wrote the influential paper The Polarization of Job Opportunities in the U.S. Labor Market: Implications for Employment and Earnings for the Center for American Progress and the Hamilton Project. This paper laid out what became the conventional wisdom: “the structure of job opportunities in the United States has sharply polarized over the past two decades, with expanding job opportunities in both high-skill, high-wage occupations and low-skill, low wage occupations, coupled with contracting opportunities in middle-wage, middle-skill white-collar and blue-collar jobs” and “this pattern of employment polarization has a counterpart in wage growth.”
Low-Paid Jobs Now Pay Even Worse Than Before The Recovery Began - Those who work in jobs that pay poorly are now making even less than they were when the recovery began, according to a new analysis from the National Employment Law Project (NELP). As the report notes, since the recovery started in 2009, “Lower- and mid-wage occupations experienced greater declines in their real wages than did higher-wage occupations.” Jobs that pay in the top two tiers saw a decline in wages between 2.1 and 2.5 percent. But those in the bottom three groups in terms of pay saw wages decline between 3.6 and 4.6 percent. Some of the low-wage jobs that employ the most people have suffered even more. The food service industry has seen big drops: an 8.3 percent decline for restaurant cooks, 6.3 percent for food preparation workers, and 3.5 percent for servers. Maids and housekeepers have seen wages decline by 5.8 percent, as have home health aides, while personal care aides have seen a 6.3 percent decline. And retail workers have had wages go down by 4.2 percent. Overall, across all jobs, median hourly wages have declined 3.4 percent between 2009 and 2013. This trend is also troubling because these jobs have seen some of the strongest growth in the recovery, outpacing better paying ones. The NELP report notes that low-wage industries have accounted for 41 percent of job growth over the past year, employing 2.3 million more workers than when the recession began, while mid-wage industries have only made up 26 percent and high-wage ones have made up 33 percent. “Today, there are approximately 1.2 million fewer jobs in mid- and higher-wage industries than there were before the Great Recession took hold,” it says. This continues a trend NELP has been tracking over recent years.
Your paycheck has been shrinking for 5 years - More Americans are working and the unemployment rate is falling, but it sure isn’t showing up in workers’ paychecks. Since the Great Recession ended five years ago, the amount of money Americans earn each hour after adjusting for inflation has actually fallen. And that largely explains why the U.S. economy is growing just 60% as fast as it normally does. Hourly wages have risen about 10% overall since June 2009, to $24.45 an hour. But over the same span they’ve slipped 0.3% in “real” or inflation-adjusted terms. That means most families are just treading water. No wonder retail sales and purchases of other goods and services lag well behind the pace of consumer spending in the boom years of the late 1990s and early to mid-2000s. U.S. households simply don’t have a lot of spare cash lying around to splurge like it’s 1999. What’s surprising is that hourly wages remain stagnant despite a big uptick this year in the number of jobs created. Real wages have been flat for two straight months and they haven’t risen at all in six months. How bad is that? The government only started collected hourly wage data for all employees in 2006. Yet an older report on the earnings of nonsupervisory workers - that is, excluding bosses – suggests the last time the U.S. experienced a worse six-month stretch was in 1992.
Working Part Time — But Not by Choice - St. Louis Fed -- The unemployment rate has fallen considerably from its recent peak of 10 percent in October 2009 to 6.2 percent in July 2014. However, there are still concerns that the number of individuals who are working part time for economic reasons (PTER)1 remains elevated while the number of unemployed individuals and marginally attached individuals has been decreasing. A recent article in The Regional Economist examined the data on PTER in the aftermath of the Great Recession and compared those numbers with the data from earlier recessionary periods. Maria Canon, an economist with the Federal Reserve Bank of St. Louis, and Marianna Kudlyak and Marisa Reed, both with the Federal Reserve Bank of Richmond, found that the ratio of PTER to unemployment behaved similarly to the way it behaved previously during a recession. It increased at the business cycle trough and reached its highest point at the business cycle peak. The figure below shows those working PTER as a share of the civilian noninstitutional working-age population. The fraction of PTER as a share of the population was higher in the latest recession than in the previous recession.2 During the Great Recession, the series reached 3.8 percent in 2009. It then declined to 3.2 percent in 2013.
America's Involuntary Part-Time Workforce - While various members of the Federal Reserve system pontificate about the United States economy and how their monetary policy has been effective in preventing an economic collapse, there is little doubt that their experiment has been less than a success when it comes to America's employment situation, particularly among those that have only been able to get part-time employment for economic reasons. Here is a graph from FRED showing how the number of non-agricultural workers that are part-time employed for economic reasons is still elevated: Just before the Great Recession, there were about 4.2 million involuntary part-time workers. This rose rapidly to 9.119 million in March 2010, an increase of 117 percent. In July 2014, that number had fallen to 7.4 million, a drop of 1.719 million or 19 percent. If we use the non-seasonally adjusted figures, there are 7.568 million involuntary part-time workers. Over the four year period between July 2010 and July 2014 and despite the Fed's "heroic" monetary policy efforts, the number of part-time workers that would rather be working full-time but cannot because there are no jobs for them has only dropped by 939,000. You will also note that the number of involuntary part-time workers is still higher than at any time between 1955 and the present. Let's look at a graph that shows the number of involuntary part-time workers as a percentage of the entire non-farm workforce since the workforce has obviously expanded over time:The appearance of an improving employment picture in the United States is, in part, smoke and mirrors. The monthly BLS statistics are skewed by a shrinking labor force participation rate and a high number of workers whose potential is not being fully utilized because the economy simply is not creating enough full-time jobs to keep America fully employed. So much for the Fed's experiment.
How a Part-Time Pay Penalty Hits Working Mothers - Women get paid less than men in almost all jobs, but when women in low-wage jobs need to take time off work to care for children, they are at an even greater disadvantage. If all employees got paid the same hourly amount (assuming they’re equally productive on the job), it would go a long way toward closing the gender pay gap, according to Claudia Goldin, a Harvard economist who has analyzed income data across occupations, including a new set of unpublished data on hourly workers that she prepared for the White House Summit on Working Families in June. Instead, she has found, people in professions like law and finance get paid disproportionately more when they work extra-long hours. At the other end of the spectrum, people in low-wage jobs do not benefit much from working more, but get paid disproportionately less per hour when they work fewer than 40 hours a week. The penalty is similar for men and women — but ends up hurting women more, because they are far more likely to take breaks during their careers or need shorter or predictable hours to handle child care.
There’s Nothing ‘Natural’ About Unemployment: Fed Conference Paper - Governments and central banks can and should take an active role in promoting job creation and reducing inequality in the wake of deep downturns such as the most recent recession, argues a new paper to be presented Saturday at the Federal Reserve Bank of Kansas City’s annual Jackson Hole conference. Taking aim at the economics notion that there is a “natural” rate of unemployment below which inflationary forces will spiral upward out of control, Giuseppe Bertola says the state of the job market depends heavily on policy choices. “Unemployment is always and everywhere man-made and shaped by human interactions and collective policies,” writes Mr. Bertola, in a play on the late economist Milton Friedman’s famous statement that inflation is always and everywhere a monetary phenomenon. Mr. Bertola emphasizes that, because of what he sees as the limitations of monetary policy once interest rates reach zero, policy makers should look at a wider array of measures to address the high unemployment levels that have followed the 2008 financial crisis and the deep recession of 2007-2009. “Macroeconomic policy would benefit from a better understanding of labor markets,” he says.
The Geography of Jobs - Only now, as we reach the fifth anniversary of the end of the recession, has employment in the United States finally regained its pre-recession peak. The national story of slow recovery obscures the more complicated regional picture: As is the case during most business cycles, the pace of recovery has been very uneven among the states. At present, only 16 states plus the District of Columbia have employment rates at least one percent higher than they had prior to the start of the recession. Among the states that have experienced the highest overall employment gains are the beneficiaries of expanding energy production. Among the states where employment remains substantially below pre-recession levels are those states most affected by the bursting of the housing bubble and those with declining manufacturing employment. Only 16 states and the District of Columbia are at least one percent above their pre-recession employment levels. For more than half of these states (North Dakota, Texas, Alaska, Utah, Colorado, Oklahoma, Montana, West Virginia, and Louisiana), expanding energy production has played a key role in driving employment growth. The District of Columbia and the other employment-gaining states can attribute their total employment growth to increases in a variety of sectors, most notably health services and leisure and hospitality. Four of these states (North Dakota, Colorado, Texas, and South Dakota) and the District of Columbia also had among the highest proportional increases in population due to inflows of people from other states between 2010 and 2013 (net domestic migration) as people moved to where the jobs were. Texas alone added more than 400,000 people from other states (1.5 percent of its 2013 population) during this period. Population also migrated away from the states at the bottom of the job recovery rankings: Of those in the bottom 10, New Jersey, Maine, New Mexico, Connecticut, Michigan, Rhode Island, and Illinois all lost population to domestic migration.
The Geography Of Jobs: Mapping The Recovery - (infographic) The current 'boom'in energy production, the hangover from the housing bubble, and the long-term decline in manufacturing employment are combining to shift the employment profile of the US economy. But as Deloitte Unioversity press notes, the national story of slow recovery obscures the more complicated regional picture: As is the case during most business cycles, the pace of recovery has been very uneven among the states. At present, only 16 states plus the District of Columbia have employment rates at least one percent higher than they were prior to the start of the recession. Overall, as the following chart shows, Americans have been struggling to find work, but some states and industries have had an easier time than others.
Energy-Rich U.S. States Saw Fastest Economic Growth in Late 2013 - U.S. economic growth accelerated in the second half of 2013 before unexpectedly contracting early this year. But growth late last year was uneven across the nation, with some energy-rich states leading the pack while economies slowed in New England and on the Plains. That’s according to new data released Wednesday by the Commerce Department. The agency already reported gross domestic product for the nation on a quarterly basis and at the state level annually. Now, it has offered a quarterly breakdown for state-level GDP data through the end of 2013. The data are volatile from quarter to quarter, but allow a finer understanding of the ups and downs in regional economies. The new state-level data are adjusted for inflation but do not incorporate revisions that were issued in late July for the national GDP numbers. North Dakota had the fastest growing state economy last year, with state GDP expanding 9.7% from 2012. The year’s worst performance came in Alaska, where the state economy shrank 2.5%. But Alaska’s economy strengthened over the course of last year, according to the new data. GDP in the Last Frontier declined at a seasonally adjusted annual rate of 6.5% in the first quarter and 4.8% in the second quarter, but expanded at a 3.2% pace in the third quarter and a 2.2% pace in the fourth quarter. Other energy-rich states led the pack as 2013 came to a close. GDP in North Dakota and Wyoming expanded at an 8.4% pace in the fourth quarter. West Virginia’s GDP grew at a 7.5% pace in the final three months of 2013 and Louisiana’s economy expanded at a 5.4% pace.
BLS: State unemployment rates little changed in July - From the BLS: Regional and State Employment and Unemployment Summary Regional and state unemployment rates were generally little changed in July. Thirty states had unemployment rate increases from June, 8 states had decreases, and 12 states and the District of Columbia had no change, the U.S. Bureau of Labor Statistics reported today. Forty-nine states and the District of Columbia had unemployment rate decreases from a year earlier and one state had an increase... Mississippi had the highest unemployment rate among the states in July, 8.0 percent. North Dakota again had the lowest jobless rate, 2.8 percent.This graph shows the current unemployment rate for each state (red), and the max during the recession (blue). All states are well below the maximum unemployment rate for the recession. The size of the blue bar indicates the amount of improvement. The states are ranked by the highest current unemployment rate. Mississippi had the highest unemployment rate in July at 8.0%. The second graph shows the number of states with unemployment rates at or above certain levels since January 2006. At the worst of the employment recession, there were 10 states with an unemployment rate at or above 11% (red). One state has an unemployment rate at or above 8% (light blue), and 11 states are still at or above 7% (dark blue).
Utah Emerges as Job Creation Engine, Giving Chase to North Dakota -- The employment boom in the West isn’t confined to energy-rich North Dakota. Utah has emerged this year as a job creation leader, according to Labor Department data released Monday. The state’s July unemployment rate of 3.6% ranks only behind North Dakota’s minuscule 2.8%. Utah payrolls have grown by 2.5% over the past six months, also second-best in the country. But unlike North Dakota’s oil-fueled expansion, Utah’s economic resurgence reflects broad-based gains, While energy is a growing field in the state, the tourism and technology sectors have been strong and financial services is expanding, she said. Salt Lake City has the highest number of Goldman Sachs employees in North America, after New York. Utah was “hit harder during the downturn, but it’s recovered more quickly the rest of the country,” In the past six months—a time when the country as a whole added better than 200,000 jobs each month—Utah added a total of 33,000 jobs to payrolls. That outpaces much larger states such as Virginia, New Jersey and Illinois.
Did Most States Really Fall Back into Recession Since 2009? A Look Inside the Zany New GDP Numbers -- Most states in the U.S. have experienced at least two consecutive quarters of economic decline in the years since the national recession ended, according to new data from the Department of Commerce. Two consecutive quarters of contracting gross domestic product is a common rule of thumb for a recession (though economists prefer a more complicated method), suggesting that most of the U.S. has relapsed into recession at one point or another in the past five years. (For the record, those states with declines are: Alabama, Alaska, Arkansas, Delaware, DC, Hawaii, Indiana, Iowa, Kansas, Kentucky, Louisiana, Maine, Massachusetts, Michigan, Mississippi, Missouri, Nevada, New Jersey, New Mexico, New York, Oklahoma, Pennsylvania, Rhode Island, South Dakota, Vermont, Washington, West Virginia, Wisconsin and Wyoming.) A look at some of these states, however, suggests the key culprit in new recessions may not be pronounced economic decline, but rather extremely volatile data from the Department of Commerce. According to the Department of Commerce data, New York experienced two quarters of contracting GDP in 2010 and then again in 2011. But in between these two mini-recessions, the economy grew at an annual rate of nearly 10%, a veritable boom that would make New York one of the fastest growing places in the world during those months. According to this data, New York also experienced GDP declines in 2006 and 2007.But has the state of New York really experienced five recessions in a decade, as the new GDP data suggest?A look at jobs data, for example, calls this into question. New York’s payrolls continued to climb even as GDP eroded. A decline in jobs is a classic hallmark of recession, yet New York’s decline only happened during the national recession.
Public-Sector Cuts Drag Down State and Local Economies - Some states and cities struggling to dig themselves out of post-recession job losses are suffering from additional self-inflicted wounds. State lawmakers can affect state labor markets through the budgetary choices they make about the state and local public-sector workforce. As the recession took hold and revenues dropped, lawmakers in states and localities were faced with difficult decisions on how to achieve budget balance. While some state lawmakers attempted to preserve public-sector jobs—such as by raising taxes on the wealthy—too many chose to slash vital investments in the public sector, weakening the critical services provided by police, firefighters, teachers, and social workers. As the chart below shows, since the start of the Great Recession in December 2007, 28 states plus the District of Columbia have added state and local government jobs, while 21 states have cut public sector workers. Interactive Economic Snapshot
Low Wages and Few Benefits Mean Many Restaurant Workers Can’t Make Ends Meet - The restaurant industry is a large and fast-growing sector of the U.S. economy. It currently employs 5.5 million women (accounting for 9.9 percent of all private-sector employment among women) and 5.1 million men (accounting for 8.4 percent of private-sector employment among men). The restaurant industry includes a wide range of establishments, from fast-food to full-service restaurants, from food trucks to caterers, from coffee shops to bars. While there are certainly employers in the restaurant industry who provide high-quality jobs, by and large the industry consists of very low-wage jobs with few benefits, and many restaurant workers live in poverty or near-poverty.This paper examines the restaurant industry and the workers who hold restaurant jobs, including how much they earn, what jobs they do, whether they receive benefits, and whether they and their families are able to make ends meet. Key findings include:
- The median hourly wage in the restaurant industry, including tips, is $10.00, compared with $18.00 outside of the restaurant industry. After accounting for demographic differences between restaurant workers and other workers, restaurant workers have hourly wages that are 17.2 percent lower than those of similar workers outside the restaurant industry. This is the “wage penalty” of restaurant work.
- The largest restaurant industry occupation is waiter/waitress, which makes up nearly a quarter (23.3 percent) of all restaurant jobs, and has a typical wage, including tips, of $10.15 an hour. The lowest-paid occupation is cashiers/counter attendants, at $8.23 an hour, while the highest paid are managers, at a typical wage of $15.42 per hour—which is still lower than the overall median wage outside the restaurant industry.
- Unionization rates are extremely low in the restaurant industry, but unionized restaurant workers receive wages that are substantially higher than those of non-union restaurant workers.
Inequality Delusions - Paul Krugman Via the FT, a new study compares perceptions of inequality across advanced nations. The big takeaway here is that Americans are more likely than Europeans to believe that they live in a middle-class society, even though income is really much less equally distributed here than in Europe. I’ve truncated the table to show the comparison between the U.S. and France: the French think they live in a hierarchical pyramid when they are in reality mostly middle-class, Americans are the opposite. As the paper says, other evidence also says that Americans vastly underestimate inequality in their own society – and when asked to choose an ideal wealth distribution, say that they like Sweden. Why the difference? American exceptionalism when it comes to income distribution – our unique suspicion of and hostility to social insurance and anti-poverty programs – is, I and many others would argue, very much tied to our racial history. This does not, however, explain in any direct way why we should misperceive real inequality: people could oppose aid to Those People while understanding how rich the rich are. There may, however, be an indirect effect, because the racial divide empowers right-wing groups of all kinds, which in turn issue a lot of propaganda dismissing and minimizing inequality. Interesting stuff.
The Stunning Charts Showing Just How Much Richer The Rich Have Gotten While The Poor Drown In Debt -- Nowhere is the "financialization" of the US economy more evident than in this chart showing the relative net worth ratio of quntile to the next quintile right below it. Quote Census: "The distribution of net worth became more spread out between 2000 and 2011. The ratio of median net worth of the highest quintile to the second quintile increased from 39.8 to 86.8 between 2000 and 2011, and the ratio of the highest quintile to the third quintile increased from 7.7 to 9.2. The ratio of the highest quintile to the fourth quintile was 3.0 in 2000 and showed no statistically significant change over this period."
A Universal Basic Income and Work Incentives. Part 1: Theory - Everywhere you look, it seems, people are talking about a Universal Basic Income (UBI)—a monthly cash benefit paid to every citizen that would replace the existing means-tested welfare system. Supporters maintain that a UBI would not only provide income support to people in need, but would also increase work incentives. That is because, unlike the current welfare system, it would not claw back 50, 70, or even 100 percent of the earnings of low-income workers who make the effort to get a job. Opponents are more skeptical. They fear that if everyone were given a basic cash income with no requirement to work, people would quit their jobs in droves and we would end up with a nation of layabouts. Who is right? This post examines the relevant economic theory. Part 2 will look at the evidence.
Chart of the Day: Welfare Reform and the Great Recession - CBPP has posted a series of charts showing the effects of welfare reform on the poor over the past couple of decades. In its first few years it seemed like a great success: welfare rolls went down substantially in the late 90s while the number of poor people with jobs went up. But the late 90s were a boom time, and this probably would have happened anyway. Welfare reform may have provided an extra push, but it was a bubbly economy that made the biggest difference. So how would welfare reform fare when it got hit with a real test? Answer: not so well. In late 2007 the Great Recession started, creating an extra 1.5 million families with children in poverty. TANF, however, barely responded at all. There was no room in strapped state budgets for more TANF funds: The TANF block grant fundamentally altered both the structure and the allowable uses of federal and state dollars previously spent on AFDC and related programs. Under TANF, the federal government gives states a fixed block grant totaling $16.5 billion each year....Because the block grant has never been increased or adjusted for inflation, states received 32 percent less in real (inflation-adjusted) dollars in 2014 than they did in 1997. State minimum-required contributions to TANF have declined even more. To receive their full TANF block grant, states only have to spend on TANF purposes 80 percent of the amount they spent on AFDC and related programs in 1995. That “maintenance of effort” requirement isn’t adjusted for inflation, either.
New report details depth of hunger crisis in the United States - A new study by the non-profit agency Feeding America reveals the extent and depth of the hunger crisis in the United States. According to the report, “Hunger in America 2014,” about one in seven in the US, 46 million people, rely on food banks in order to feed themselves and their families. The number includes 12 million children and 7 million senior citizens. The findings are based on responses from a survey of 60,000 recipients of food aid from the 200 food banks that are affiliated with Feeding America. The survey was conducted between April and August 2013 and thus does not reflect the impact of more recent cuts carried out by the Obama administration to the Supplemental Nutrition Assistance Program (SNAP), commonly referred to as food stamps. In February Obama signed legislation slashing $8.7 billion over ten years from the federal food stamp program. It followed cuts in November that slashed food assistance by $319 per year for a typical family of three. Last year the US government reported that a record number of Americans, more than 47 million, were relying on food stamp benefits. According to Feeding America only 55 percent of those receiving aid through its affiliated food banks are also enrolled in the SNAP program. The persistence of high levels of food insecurity, more than five years after the economic crash of 2008-2009, demonstrates that talk of an economic recovery is a fraud. In fact hardship is growing among wide layers of the population, including those who are working and attending school. The numbers presented by the survey suggest that the problem of hunger in America is broader than suggested by the numbers for food stamp enrollment alone, and could embrace as much as 20 percent of the US population.
Average cost of raising a child hits $245,000 - New parents be warned: It could cost nearly a quarter of a million dollars to raise your child -- and that's not even including the cost of college. To raise a child born in 2013 to the age of 18, it will cost a middle-income couple just over $245,000, according to newly released estimates from the U.S. Department of Agriculture. That's up $4,260, or almost 2%, from the year before.Estimates can vary widely depending on where you live and how much you earn. High-income families who live in the urban Northeast, for example, are projected to spend nearly $455,000 to raise their child to the age of 18, while low-income rural families will spend much less, an estimated $145,500, according to the report. The figures are based on the cost of housing, food, transportation, clothing, health care, education, child care and miscellaneous expenses, like haircuts and cell phones. But the estimates don't include the cost of college -- a big-ticket expense that keeps rising. The good news: overall costs have grown more slowly in recent years thanks to low inflation, said economist Mark Lino, who has written the annual report for the USDA since 1987. But many families are still having to do more with less. The country's median income remains more than 8% below where it was before the recession, while child care and health care costs continue to grow faster than inflation.
Average cost to raise a child hits $245,000, without college — New parents be warned: It could cost nearly a quarter of a million dollars to raise your child — and that’s not even including the cost of college. To raise a child born in 2013 to the age of 18, it will cost a middle-income couple just over $245,000, according to newly released estimates from the U.S. Department of Agriculture. That’s up $4,260, or almost 2%, from the year before. Estimates can vary widely depending on where you live and how much you earn. High-income families who live in the urban Northeast, for example, are projected to spend nearly $455,000 to raise their child to the age of 18, while low-income rural families will spend much less, an estimated $145,500, according to the report. The figures are based on the cost of housing, food, transportation, clothing, health care, education, child care and miscellaneous expenses, like haircuts and cell phones. But the estimates don’t include the cost of college — a big-ticket expense that keeps rising.
Sure, So a Kid May Cost $245,340 to Raise, But Don’t Panic - The U.S. Department of Agriculture released a study this week showing the average middle income family will spend $245,340 to raise a child to the age of 18 — even before paying for college tuition. A cool quarter million to raise a child sounds like a horrifying amount of money. Who has that sort of cash lying around? The median family income in the U.S. was only $51,017 in 2012, according to the Census Bureau. But a closer look at the numbers behind the USDA’s report shows less cause for concern than the blaring headline might suggest. For one thing, we’re talking about the cost of having the sole responsibility to feed, shelter, clothe, transport, educate, and care for a living human for almost two decades. This is obviously a significant undertaking. But per year, that $245,340 works out to about $13,000 a year. The Department of Agriculture calculates these expenses based on a family earning, on average, $82,790 a year. If you say the median family earns about $50,000 and needs nearly a quarter million dollars to raise a child, it sounds terrifying. If you say that families earning around $80,000 a year spend $13,000 of it on their kid, it’s not quite as scary. Families earning less money raise their children on less than $10,000 a year, according to the report.
North Carolina judge: State’s school voucher program unfairly benefits religious schools: (Reuters) – A North Carolina judge on Thursday blocked the state’s new school voucher program, saying it unconstitutionally diverted money from public education to private schools, many of them religious. The Opportunity Scholarship program, designed to give poor and middle-class families public funds to help pay private school tuition, was passed by the state’s Republican-controlled Legislature last year and had already begun operating. School vouchers have drawn criticism from those who say they drain money from public schools and subsidize overtly religious education. Supporters say they offer parents more choices on where to educate their children. In his order blocking the program, Judge Robert Hobgood said it diverted money that under the state constitution can only be used for public schools. Some of that money was going to private schools that discriminate based on religious affiliation, he added. Backers of North Carolina’s $10 million voucher program said they planned to appeal the ruling and would seek to reverse the judge’s order suspending the program as the case works its way through the courts.
FBI Raids of Charter School Operators Jump -- There’s been a flood of local news stories in recent months about FBI raids on charter schools all over the country. From Pittsburgh to Baton Rouge, from Hartford to Cincinnatti to Albuquerque, FBI agents have been busting into schools, carting off documents, and making arrests leading to high-profile indictments.
- "The troubled Hartford charter school operator FUSE was dealt another blow Friday when FBI agents served it with subpoenas to a grand jury that is examining the group's operations. When two Courant reporters arrived at FUSE offices on Asylum Hill on Friday morning, minutes after the FBI's visit, they saw a woman feeding sheaves of documents into a shredder."—The Hartford Courant, July 18, 2014
- "The FBI has raided an Albuquerque school just months after the state started peering into the school’s finances.." --KRQE News 13, August 1 2014
- "Wednesday evening's FBI raid on a charter school in East Baton Rouge is the latest item in a list of scandals involving the organization that holds the charter for the Kenilworth Science and Technology School. . . .. The school receives about $5,000,000 in local, state, and federal tax money. . . .the FBI raided the school six days after the agency renewed the Baton Rouge school’s charter through the year 2019."—The Advocate, January 14, 2014
- "The state of Pennsylvania is bringing in the FBI to look into accusations that a Pittsburgh charter school [Urban Pathways Charter School] misspent tens of thousands of taxpayer dollars on luxuries such as fine-dining and retreats at exclusive resorts and spas." --CBS News November 12, 2013
- "COLUMBUS, OH—A federal grand jury has indicted four people, alleging that they offered and accepted bribes and kickbacks as part of a public corruption conspiracy in their roles as managers and a consultant for Arise! Academy, a charter school in Dayton, Ohio." –FBI Press Release, June 2014
Suspensions are Keeping Students of Color from their Diplomas -- Despite being ranked as one of the best states to live in, Minnesota still suffers from racial inequality. Even if laws and politics treat everyone equally, the educational experience is different for people of different races. In 2013, only 62 percent of students of color graduated from high school, as opposed to 85 percent of white students. Similarly, a smaller proportion of students of color will finished college compared to their white counterparts: 33 percent of white Minnesotans have a degree, but only 19 percent of black Minnesotans. Suspension, studies show, is a key reason why students drop out of school. A study conducted in Florida found that being suspended out-of-school even once was associated with a two-fold increase in the risk of dropout. Moreover, each additional suspension increased the risk of dropping out by 20 percent. By the end of the suspension period, students tend to lag behind academically and feel very excluded in classes. As a consequence, that feeling of disconnectedness convinces students that they are not smart enough to continue their education and that quitting is a better option. Dropping out of school early can have tremendous effects on someone’s life, taking away employment opportunities and increasing the likelihood of crimes. A paper published by Northwestern University shows that students who drop out of high school have only a 46 percent chance of finding a job, and those who manage to find a job will likely have an income below the national average. Moreover, 22 percent of black males who drop out of high school are jailed. This means, if you are a black male student and you get suspended, it's more likely that your future will involve unemployment, working in in a low paying job, or jail.
Detroit Teachers Union Will Fight Pay Cuts ‘By Any Means Necessary’ -- The Detroit teachers union is preparing to enter into a legal battle with the Detroit Public Schools district to prevent a 10 percent wage cut after voters failed to pass a county-wide tax millage.Keith Johnson, president of the Detroit Federation of Teachers, told WWJ’s Charlie Langton he will fight another wage reduction “by any means necessary.”“I will exhaust every dollar available to me as president of DFT to make the district pay for their ineptitude and their attempts to impose their ineptitude or the cost of their ineptitude upon the DFT and other employees,” he said. “The more we give, the more they want. They more they want, the more they take. We simply are not going to let them take any more.”Johnson, who is meeting with attorneys on Tuesday, said he could not rule out the possibility of a lawsuit against the district. He said teachers have already taken enough pay cuts.“The district has always had to save money and unfortunately, they feel that the way to do it is to always penalize the employees,” he said. “But who in their right mind submits a budget that has contingency money in it, saying that this budget is in part predicated upon a millage that we hope passes?”
Study: A fourth of public school spending goes to salaries and benefits of nonteachers - A new Thomas B. Fordham Institute study finds that the number of non-teaching staff in the United States has grown by 130% since 1970. These three millions employers now account for half of the public school workforce with their salaries and benefits absorbing one-quarter of current education spending. The largest single position is now that of “teacher aide,” which was pretty much nonexistent in 1970. What’s going on? From an analysis by Chester Finn: The advent and expansion of special education, for example, led to substantial demand for classroom aides and specialists to address the needs of youngsters with disabilities. Broadening school duties to include more food service, health care, and sundry other responsibilities accounts for still more. But such additions to the obligations of schools are not peculiar to the United States, and they certainly cannot explain big staffing differences from place to place within our country Our sense is that these millions of people have quietly accumulated over the years as districts simply added employees in response to sundry needs, demands, and pressures—including state and federal mandates and funding streams—without carefully examining the decisions they were making or considering possible tradeoffs and alternatives. This was the path of least resistance and, at a time of rising budgets, was viable even if imprudent. But it’s no longer sustainable in the public sector any more than the private. Observe how private firms go about reducing costs, boosting productivity, enhancing organizational efficiency, and increasing profitability: they almost always start with staffing.
The hunger crisis in America's universities -- Hungry students don’t enter the on-campus food pantry at New York’s LaGuardia Community College; instead they sit in an office in the college’s financial services center while a staff member or volunteer runs upstairs to get their food, bringing them unmarked grocery bags to take home. Little more than an unlabeled office, containing a series of unmarked file cabinets, the pantry goes undetected to most – and that’s the point. Dr. Michael Baston, the college’s vice president of Student Affairs, says the whole process is designed to be invisible. “We did this because we feel like it is a stigma reducing strategy,” he said. “Because we want students to feel like whatever the resource they need to sustain themselves, that would be available to them.” Battling stigma is a challenge for food pantries of all stripes, but the struggle appears to be especially pronounced on college campuses. After all, universities are supposed to be islands of relative privilege. If you can afford to spend thousands of dollars a year on a college education, the thinking goes, you can’t possibly be hungry enough to require emergency food assistance.
One (More) Shocking Way Colleges Are Ripping Off Kids - Marking up movie theater popcorn is one thing, but jacking the price of a laptop by more than 100% is another, especially when the would-be buyers are college kids. As students get ready to head to campus, college stores are making laptop shopping a buyer-beware endeavor. An investigation by DealNews.com found that college bookstores hike prices on the laptops and tablets they sell by an average of 35% over the regular sale prices of retailers like Amazon, Best Buy and Staples. DealNews looked at prices for the cheapest tablets and laptops, plus the most expensive laptops, available at the online stores of five public and one private college, then compared those to back-to-school deals offered by other retailers on identical or very similar machines. Not every single one is a rip-off, but more than two-thirds are, and some of the markups are pretty egregious. DealNews finds that the University of Virginia sells a first-generation iPad mini for a staggering 135% more than the $199 sale price the site found on more than one occaision over the summer. The $469 price the campus store is charging is so high that even if you wanted to buy the newer model iPad mini, you could get it straight from Apple for $70 less.
The Future of College? - I strapped on a headset, leaned into a microphone, and experienced what had been described to me as a type of time travel to the future of higher education. In a small room, I was flanked by a publicist and a tech manager from an educational venture called the Minerva Project, whose founder and CEO, the 39-year-old entrepreneur Ben Nelson, aims to replace (or, when he is feeling less aggressive, “reform”) the modern liberal-arts college. Minerva is an accredited university with administrative offices and a dorm in San Francisco, and it plans to open locations in at least six other major world cities. But the key to Minerva, what sets it apart most jarringly from traditional universities, is a proprietary online platform developed to apply pedagogical practices that have been studied and vetted by one of the world’s foremost psychologists, a former Harvard dean named Stephen M. Kosslyn, who joined Minerva in 2012.
Under Obama, Private Debt Troubles Ebb—Except Among Students - Much has improved in American creditworthiness since the darkest days of the recession. Foreclosures have plunged, along with the number of debtors seriously behind on their car and credit-card payments. There’s one big exception: Student borrowers, who are by far the fastest growing segment of troubled debtors. As college costs mount, so has the number of borrowers squeezed between soaring debt loads and a tight job market. The numbers are dramatic. At the height of the recession in early 2009, the sum of mortgages considered seriously delinquent topped $225 billion, while student loans in that category tallied $13 billion. As of June, the value of mortgages with payments more than 90 days past due had fallen to $52 billion, while the total of delinquent student loans had nearly doubled, to $25 billion. The Obama administration is taking steps now to ease that burden, but in ways critics say could worsen the problem. In March, the administration proposed further broadening access to federal loan-forgiveness programs that limit monthly payments to a set percentage of one’s income. Beyond capping payments, the programs forgive remaining debts after a set period of between 10 and 20 years, depending on the borrower’s type of employment.The number of student borrowers seeking loan forgiveness under federal programs has soared over the past year, according to federal data. In June 2013, 950,000 Americans with a combined $52.2 billion in debt were enrolled in the government’s two main forgiveness programs. By this June, the number had swelled to 1.91 million Americans holding more than $101 billion in student loans—nearly a tenth of all outstanding federal student debt. Perhaps coincidentally, a slightly higher percentage of student loan debt—10.92%–is now more than 90 days delinquent, according to data from the New York Federal Reserve. That is more than three times the delinquency rates for holders of mortgages, home-equity loans or car loans.
Biology Student Faces Jail Time for Publishing Scientist’s Thesis on Scribd --A Colombian biology student is facing up to 8 years in jail and a fine for sharing a thesis by another scientist on a social network. Diego Gómez Hoyos posted the 2006 work, about amphibian taxonomy, on Scribd in 2011. An undergraduate at the time, he had hoped that it would help fellow students with their fieldwork. But two years later, in 2013, he was notified that the author of the thesis was suing him for violating copyright laws. His case has now been taken up by the Karisma Foundation, a human rights organization in Bogotá, which has launched a campaign called “Sharing is not a crime”. “It is a really awful, disturbing case, for the complete lack of proportionality of the trial,” says Michael Carroll, director of the Program on Information Justice and Intellectual Property at the American University and member of the board of directors of the Public Library of Science. “In copyright systems all over the world we see authors of extreme claims but most other countries would filter out this case,” he adds. Colombian copyright law was reformed in 2006 to meet the stringent copyright protection requirements of a free trade agreement that the country signed with the United States.
The Lawsuit That Could Legalize Pay-To-Play For Pension Funds - Yves Smith - Recall that there is a long-term campaign by conservatives and much of Wall Street to get government out of the pension/social safety net for the aged business. The most visible element is the long-standing effort to privatize Social Security. But public pensions have also been under attack. Even though financial firms make very nice living off their backs, the fees retail pays as a percent of invested assets is higher on smaller accounts. So how does the pay-to-play litigation factor in? As David Sirota has been dutifully chronicling, first at Pando, now at International Business Times, there are lots of suspect, and in some cases, obviously corrupt, dealings between elected officials (who sometimes are also public pension fund trustees) and these retirement funds. As Lambert points out, we’ve written about one spectacular example at CalPERS, that of over $50 million of placement agent fees paid in connection with fundraising for a handful of private equity firms, that led to the indictment of and guilty plea from CalPERS’ former CEO. The criminal case against the placement agent is underway.What do you think happens if this suit prevails? In a very short time, the political graft will be off the charts.
How Your Pension Fund Became a Casino - Yves Smith - In September 1974, Congress passed a law aimed at ensuring that U.S. companies could fulfill the vast pension promises they had made to millions of employees. In 1978, though, the Labor Department made an adjustment that has had vast consequences. Responding to political pressure and influenced by new academic thinking on portfolio theory, it reinterpreted the so-called prudent-man rule of fiduciary duty. Fund managers would be judged not on the risk of their individual investments, but on the risk profile of their investment portfolio as a whole. The result was that the pension funds, which had long been limited to safe assets such as corporate bonds and Treasury securities, could put some money into riskier investments such as stocks and venture capital -- on the assumption that diversification, both by asset class and within each asset class, would reduce risk in the broader portfolio. Unfortunately, over-reliance on the power of diversification has led fund managers to be less attentive to the hazards of particular investments. Consider two examples: private-label mortgage securities, which are issued without government guarantees, and private-equity partnerships, which acquire public companies with the aim of restructuring them and selling at a profit. Seduced by AAA ratings, fund managers often ignored the extraordinary complexity of mortgage securitizations, which typically involve hundreds of pages of documents defining the circumstances under which different investors get paid or suffer losses. As a result, they failed to notice some significant pitfalls. Because the servicers were often the same banks that had made other loans to the borrowers, and because they could make more money by foreclosing than by fixing troubled loans, they had strong incentives to act against the investors' (and the borrowers') best interests.The evidence is overwhelming that servicers abused their powers. They gave their own loans preference in making modifications and when counseling borrowers on what to pay first. They increased their profits by precipitating foreclosures and by forcing borrowers to buy insurance. They skimmed extra fees from money that they were supposed to pass on to investors.
Early Look at 2015 Cost-Of-Living Adjustments and Maximum Contribution Base - The BLS reported this morning: The Consumer Price Index for Urban Wage Earners and Clerical Workers (CPI-W) increased 1.9 percent over the last 12 months to an index level of 234.525 (1982-84=100). For the month, the index fell 0.1 percent prior to seasonal adjustment. CPI-W is the index that is used to calculate the Cost-Of-Living Adjustments (COLA). The calculation dates have changed over time (see Cost-of-Living Adjustments), but the current calculation uses the average CPI-W for the three months in Q3 (July, August, September) and compares to the average for the highest previous average of Q3 months. Note: this is not the headline CPI-U, and is not seasonally adjusted (NSA). Since the highest Q3 average was last year (Q3 2013), at 230.327, we only have to compare to last year.
Teachers groups say health costs skyrocket -- Insurance premiums for many of the 650,000 teachers, state employees, retirees and their dependents on the State Health Benefit Plan could skyrocket next year, according to a new analysis by a teacher group. That’s contrary to what the Department of Community Health said last week when it approved expanded coverage options and premiums for 2015. DCH officials said many plan members would see their rates decrease or remain the same. DCH officials did not provide reporters with the actual rates at the time they were approved. But members of Teachers Rally to Advocate for Georgia Insurance Choices - which has been fighting changes in the health care plan throughout 2014 - analyzed the new rates over the weekend. The group found that some members currently in two of the three plans being offered by Blue Cross and Blue Shield of Georgia will see premiums jump 20 percent to 180 percent if they move to some of the new plans being offered. It also saw major price differences - based on which companies members choose - in the cost of HMO and supplemental Medicare coverage
Aging Americans Boost Share of Population Who Receive Government Benefits - More Americans than ever before are tapping government benefits. But this time the baby boomers may be responsible for the slight uptick. Nearly half of Americans, 49.5%, lived in a household where at least one person was receiving some type of government benefit in the fourth quarter of 2012, according to Census Department data. That number ticked up slightly from 49.2% at the end of 2011. The share of Americans receiving government benefits has risen steadily during the recession and sluggish recovery. The types of benefits run the gamut, from Social Security to unemployment compensation to food stamps. Over the last few years, the number has mostly risen from more people turning to programs designed to help the poor, such as food stamps, Medicaid (the health-insurance program for the poor and disabled) and the Temporary Assistance for Needy Families program, commonly known as welfare.But from 2011 to 2012, that picture may be shifting. In late 2012, 35.4% of Americans lived in a home that received help from a means-tested, poverty-assistance program. That number didn’t budge from 2011. In fact, the slight uptick from 2011 appears to be mostly due to the aging population in the U.S. Some 16.8% of Americans resided in a household receiving Social Security benefits at the end of 2012, up from 16.3% a year earlier. And 15.8% of Americans lived in a home tapping Medicare benefits, up from 15.1% a year earlier.
Merging Finance and Health Care Leadership – Robert Rubin Proteges Running DHHS, Spouse of Hedge Fund Magnate Running the FDA -- Yves here. This post describes a pair of examples in the mistaken assumption that financiers, or at least people with connections to financiers, are the best people to put in charge of anything. Of course, whether people actually believe that assumption, or use that as a cover to curry favor with the 0.1% remains to be seen. But there is evidence that at least some people in positions of influence actually do believe it. For instance, during the famed auto bailouts, for instance, that the government brought in a dealmaker, Steve Rattner, whose investment banking experience was concentrated in media companies. And the crisis showed that the Masters of the Universe were better at lining their pockets rather than doing the job that ostensively justifies their elevated position and outsized pay: allocating capital efficiently, to the best outcomes for society as a whole.
Obamacare Manufacturing Facts: 85% of Firms Raise Premiums, 91% Raise Deductibles, 74% Raise Out of Pocket Maximums, 38% Lower Coverage, 27% Decrease Network Choices, 15% Decrease Employment -- A special question on the impact of Obamacare on businesses in the August Philly Fed Manufacturing Survey shows the stunning failure of Obamacare. Here are the results in table form. I added the net results in red. As always, I encourage everyone to look on the bright side: A net 2.9% of manufacturing firms cover a higher percentage of the lower number of employees they have.
Audit: 'Obamacare' Tax Not Meeting Revenue Target - An "Obamacare" tax on medical devices is falling short of its revenue target because thousands of companies aren't paying it, according to a government audit released Tuesday. The audit by the Treasury inspector general for tax administration says the IRS needs to do a better job policing the tax. The tax agency, however, doesn't have adequate tools to identify which companies owe it, the audit said. The report could add fuel to efforts to repeal the tax, which is opposed by Republicans and many Democrats. While the IRS has taken steps to educate companies about the tax, the agency "faces challenges to definitively identify manufacturers subject to the medical device excise tax reporting and payment requirements," said the inspector general, J. Russell George. To help pay for President Barack Obama's health law, Congress enacted a 2.3 percent tax on the sale of medical devices used chiefly by doctors and hospitals, such as pacemakers and CT scan machines. Consumer items are exempted, including eyeglasses, contact lenses and hearing aids. The tax took effect in January 2013. For the first six months of that year, the IRS estimated it would collect $1.2 billion from the tax. The audit said the IRS collected only $913 million — 24 percent less than the estimate.
1000s Of Firms Aren't Paying An "Obamacare Tax", IRS Audit Finds 24% Shortfall -- It appears Sen. Orin Hatch's comment that "everything from this ill-conceived tax's structure to its implementation has been a disaster," are coming true. As AP reports, an "Obamacare" tax on medical devices is falling short of its revenue target because thousands of companies aren't paying it, according to a government audit released Tuesday. An audit found the IRS received only 5,107 returns (against expectations of over 9,000) with a 24% shortfall in revenues. The tax is projected to generate $29 billion over the coming decade, so a 24 percent shortfall - if it were sustained - would be significant.
The Obamacare Medical Device Tax is Not Working as Planned - The Treasury Inspector General for Tax Administration released a report this week on significant challenges with enforcing the Affordable Care Act’s Medical Device Tax. The medical device tax is a 2.3 percent excise tax on the sale price of qualifying medical devices. Generally, taxable medical devices are things like pacemakers and defibrillators. The tax explicitly exempts things like eye glasses, contact lenses, or things generally purchased directly by consumers. The two major issues is that the medical device tax is raising about 25 percent less revenue than expected and that taxpayers seem to be having trouble complying with the complex tax. According to the report, the IRS processed 5,107 returns and raised $913 million between January 2013 and June 2013. The original estimates were much higher. The IRS first estimated receiving between 9,000 and 15,000 returns and $1.2 billion during that period. These are collections about 23 percent below original estimates. First Half of 2013 Return Filings and Medical Device Tax Revenues IRS EstimatesActual Returns9,000 - 15,0005,107 Revenues$1.2 billion$913.4 million Source: Treasury Inspector General for Tax Administration In addition, TIGTA found that there was a high amount of error both on the part of businesses and the IRS. According to the TIGTA review of medical device tax returns, there was a total of $41.6 million in overpayments, and $76.2 million in underpayments.
TPP: The “Trade” Deal that Could Inflate Your Healthcare Bill -- Much has been said about how the Trans-Pacific Partnership (TPP) threatens to raise medicine prices in TPP developing countries, thanks to the deal's proposed expansion of monopoly protections for pharmaceutical corporations. Less has been said about the proposed TPP rules that could increase medicine prices in the United States. Americans pay far more for healthcare than people in any other developed country, even though U.S. life expectancy falls below the average for developed countries. U.S. drug prices increased more than 70 percent faster than prices for other healthcare goods and services over 2006-2010. As a result, millions of Americans cannot afford the medicines they need to live healthy lives. Soaring drug prices also drive up the amount that taxpayers must pay to fund public health programs such as Medicare, Medicaid and programs covering the U.S. military and veterans. To try to combat the twin problems of unaffordable healthcare and unsustainable deficits, U.S. federal and state governments already use several tools to tamp down the cost of drugs – for Medicare, Medicaid and for military healthcare under TRICARE and the Department of Veterans Affairs (VA). Many more such cost containment policies have been proposed.Yet, the TPP threatens to chill such proposals and even roll back existing policies to rein in exorbitant medicine prices. Leaked draft TPP texts – an intellectual property chapter, investment chapter and healthcare annex – contain expansive rules that would constrain the ability of the U.S. government to reduce medicine prices. Getting these terms into the TPP was a key objective of large U.S. pharmaceutical corporations that stand to reap monopoly profits from expansive patent terms and restrictions on government cost containment efforts. This incentive may explain why pharmaceutical corporations have lobbied Congress for the TPP more than any other industry.
Resistance Taking Sting Out of Top Malaria Drug - —Resistance to the world's most effective drug against malaria is becoming widespread in Southeast Asia, a recurrent pattern that threatens global efforts to control the mosquito-borne infectious disease, a new study shows. Resistance to the drug, artemisinin, in the most deadly form of malaria-causing parasite, Plasmodium falciparum, is established in northern and western Cambodia, Thailand, Vietnam and eastern Myanmar, according to the study published Thursday in the New England Journal of Medicine. The research, coordinated by the Mahidol Oxford Tropical Medicine Research Unit in Bangkok, analyzed blood samples from 1,241 malaria patients in 10 Asian and African countries between 2011 and 2013. Fear is growing that resistance would spread from Asia to Africa—where progress has been made in reducing deaths from malaria—in a way that neutered previous treatments. So far, three African sites included in the study—in Kenya, Nigeria and Congo—showed no signs of resistance. "There's no evidence that it's spread to Africa but we need to be vigilant," Nicholas White, senior author of the study, told The Wall Street Journal. "It may not have got to India yet. But if it does, we may not be able to stop it."
Transplant Brokers in Israel Lure Desperate Kidney Patients to Costa Rica - — Aside from the six-figure price tag, what was striking was just how easy it was for Ophira Dorin to buy a kidney.A broker who trades in human organs might seem a difficult thing to find. But Ms. Dorin’s mother began making inquiries around the hospital where she worked, and in short order the family came up with three names: Avigad Sandler, a former insurance agent long suspected of trafficking; Boris Volfman, a young Ukrainian émigré and Sandler protégé; and Yaacov Dayan, a wily businessman with interests in real estate and marketing. The men were, The New York Times learned during an investigation of the global organ trade, among the central operators in Israel’s irrepressible underground kidney market. For years, they have pocketed enormous sums for arranging overseas transplants for patients who are paired with foreign donors, court filings and government documents show. The brokers maintain they operate legally and do not directly help clients buy organs. Dodging international condemnation and tightening enforcement, they have nimbly shifted operations across the globe when any one destination closes its doors. The supply of transplantable organs is estimated by the World Health Organization to meet no more than a tenth of the need. Although there is no reliable data, experts say thousands of patients most likely receive illicit transplants abroad each year. Almost always, the sellers are poor and ill-informed about the medical risks.
Nigeria sacks 16,000 doctors in midst of rising Ebola concerns - Nigerian President Goodluck Jonathan reportedly(link is external) fired 16,000 resident doctors this week, causing concern as the country fights a number of Ebola cases. The government also reportedly(link is external) suspended the residency training programme in federal hospitals, citing the need to better address challenges currently facing the health sector. The move comes as thousands of doctors are on strike(link is external) throughout the country, calling for better working conditions and increased pay. The Nigeria Medical Association (NMA) Friday demanded(link is external) the immediate reversal of Johnathan's decision, and encouraged those affected not to pick up their termination letters. Online, many in Nigeria expressed concern over what the sacking meant for the country as it battles Ebola, with 11 cases confirmed(link is external) so far.
Nigeria trains 800 volunteers to fight Ebola - Nigeria has said it has trained 800 volunteers to battle Ebola as fears rose that the worst-ever outbreak of the deadly disease could spread across Africa's most populous nation. Authorities in the capital Lagos last week appealed for volunteers to make up for a shortage of medical personnel because of a six-week nationwide doctors' strike over pay. Volunteers have so far been deployed to 57 districts of Lagos state but more are needed, particularly to treat those already infected with the disease, Hakeem Bello, a spokesman for Lagos State Governor Babatunde Fashola. "We have trained some 800 volunteers in the area of contact tracing, sensitisation and treatment of the Ebola disease." said Bello. Four people have died and six more are infected by Ebola in Nigeria as part of the worst-ever outbreak of the deadly virus, which has killed 1,145 people across west Africa this year. Experts say Ebola is spreading out of control in the region, and the UN World Health Organization has declared the epidemic an international health emergency and appealed for global aid.
Mob destroys Ebola center in Liberia two days after it opens « A mob descended on the center at around 5:30 p.m., chanting, “No Ebola in West Point! No Ebola in West Point!” They stormed the front gate and pushed into the holding center. They stole the few gloves someone had donated this morning, and the chlorine sprayers used to disinfect the bodies of those who die here, all the while hollering that Ebola is a hoax. They ransacked the protective suits, the goggles, the masks. They destroyed part of Tarplah’s car as he was fleeing the crowd. Jemimah Kargbo, a health care worker at a clinic next door, said they took mattresses and bedding, utensils and plastic chairs. “Everybody left with their own thing,” she said. “What are they carrying to their homes? They are carrying their deaths.”
Mob Destroys Ebola Center In Liberia: Patients Flee into City: A mob descended on an Ebola clinic in Liberia earlier today. They were armed, and they broke into the clinic with clubs. In the chaos, many bed sheets and mattresses were stolen. Unfortunately, some of these mattresses were being used by individuals who have been infected by Ebola (or were suspected to have been in contact with the virus). The patients were forced to flee into the city to escape the mob. At least 17 of the 29 patients are still missing and are believed to be somewhere in the city. In an impoverished area that does not have access to necessary sanitary conditions, this is not a good thing. The fact that the patients are missing in the populace is worrying enough; however, Ebola is spread through bodily fluids (like blood, sweat, and vomit), and the fact that sheets, mattresses, and similar items were stolen makes the situation extremely dire. Richard Kieh, a local resident, asserts that some of the looted items were visibly stained with blood, vomit, and excrement. Notably, the West Point neighborhood is home to an estimated 60,000 to 100,000 individuals, and sanitary conditions are highly questionable. As a result, Liberian officials now fear that Ebola will spread throughout the capital’s largest slum. Recent figures released by the World Health Organization (WHO) showed that Liberia has recorded more Ebola deaths – 413 – than any of the other affected countries. This is largely because the area lacks access to necessary medical supplies, which makes it difficult to ensure that patients stay hydrated and that medical personnel do not contract Ebola.
Ebola patients flee as Liberia clinic looted - An Ebola quarantine centre in Liberia has been looted by a gang who reportedly took bloodstained sheets and forced 17 patients to flee, raising the chances of the virus spreading. The attack happened at a unit in the West Point area of Monrovia late on Saturday. Rebecca Wesseh, who witnessed the attack, told the AFP news agency on Sunday that the gang were mostly young men armed with clubs. Wesseh said she heard the attackers shouting anti-government slogans and insisting there was "no Ebola" in Liberia. "They broke down the door and looted the place. The patients have all gone," she said.The head of Health Workers Association of Liberia, George Williams, said the unit had housed 29 patients who were receiving preliminary treatment before being taken to hospital. "Of the 29 patients, 17 fled last night. Nine died four days ago and three others were taken by force by their relatives," he said. "They had all tested positive for Ebola."
India, Spain Testing Suspected Ebola Patients; Liberian Quarantine Center Raided - While the Ebola outbreak in west Africa has long since left the "under control" stage, things are about to go from worse to inconceivable for the poverty stricken African nations, after Liberian officials said they Ebola could soon spread through the capital's largest slum after residents raided a quarantine center for suspected patients and took items including blood-stained sheets and mattresses. And speaking of spreading, what many have feared may have come to pass after Spain announced it was investigating a suspected case of Ebola after a Nigerian man presented symptoms of the virus at a hospital in Alicante several days after flying in from the West African country. But even that is nothing compared to what may transpire if what the Times of India reported moments ago, turns out to be accurate: three persons from Ebola-affected Nigeria, who arrived here Saturday morning, have been admitted to the Ram Manohar Lohia Hospital for screening and treatment if required.
Ebola's spread to US is 'inevitable' says health chief - Ebola's spread to the United States is "inevitable" due to the nature of global airline travel, but any outbreak is not likely to be large, US health authorities has said. Already one man with dual US-Liberian citizenship has died from Ebola, after becoming sick on a plane from Monrovia to Lagos and exposing as many as seven other people in Nigeria. More cases of Ebola moving across borders via air travel are expected, as West Africa faces the largest outbreak of the hemorrhagic virus in history, said Tom Frieden, the head of the US Centers for Disease Control and Prevention. The virus spreads by close contact with bodily fluids and has killed 932 people and infected more than 1,700 since March in Sierra Leone, Guinea, Nigeria and Liberia. "It is certainly possible that we could have ill people in the US who develop Ebola after having been exposed elsewhere," Frieden told a hearing of the House Subcommittee on Africa, Global Health, Global Human Rights and International Organizations. R"We are all connected and inevitably there will be travellers, American citizens and others who go from these three countries - or from Lagos if it doesn't get it under control - and are here with symptoms," he said. "But we are confident that there will not be a large Ebola outbreak in the US."
US Hospitals Have Had 68 Ebola Scares, CDC Says - ABC News: American hospitals and state labs have handled at least 68 Ebola scares over the last three weeks, according to the U.S. Centers for Disease Control and Prevention. Hospitals in 27 states alerted the CDC of the possible Ebola cases out of an abundance of caution amid the growing outbreak in Guinea, Liberia and Sierra Leone. Fifty-eight cases were deemed false alarms after CDC officials spoke with medical professions about patient exposures and symptoms, but blood samples for the remaining 10 were sent to the CDC for testing, the agency told ABC News today. Seven of the samples tested negative for the virus and results for the remaining three are pending, the agency said. Once a hospital or state lab notifies the CDC of a possible Ebola case based on travel history and symptoms, CDC officials talk to someone familiar with the suspected patient’s history to determine whether blood testing for the virus is necessary, said CDC spokeswoman Kristen Nordlund. They discuss symptoms and determine whether the patient may have been exposed to the virus. Exposure can happen if the patient is a health care worker, has buried someone with Ebola, has lived in a house with someone who had Ebola or has lived in a place where Ebola is spreading.
WHO Urges "Exit Screening" Of All Travelers In Ebola-Infected Countries As Reported Cases Go Parabolic - In its strongest-worded statement yet, the World Health Organization is urging strengthened international cooperation to stop transmission of Ebola to other countries. Most critically, WHO urges: "Affected countries are requested to conduct exit screening of all persons at international airports, seaports and major land crossings, for unexplained febrile illness consistent with potential Ebola infection." Falling short on banning international travel, WHO does warn non-affected countries to strengthen the capacity to detect and immediately contain new cases. Of course, in the interests of avoiding panic, they reiterate the risk of infection on a flight is low - which seems odd given that we get a cold every time we fly...
Glimmer of hope seen in Ebola outbreak (CNN) - Three health care workers who were given the experimental Ebola drug ZMapp in Liberia have shown "very positive signs of recovery," the Liberian Ministry of Health said Tuesday. Medical professionals treating the workers have called their progress "remarkable." The good news comes as the number of deaths from the outbreak in West Africa climbed to 1,229, according to the World Health Organization. The Liberian government also reported that all 17 patients who fled a local clinic after it was attacked earlier this week have been accounted for. Those who tested positive for Ebola are now being treated at another medical center. The government met with local community leaders and concluded the attack stemmed from a misunderstanding; locals thought the clinic was "importing Ebola victims from the rest of the country," according to health officials. Looters who took a generator, mattresses and critical medical supplies have promised to return the items. There are other small signs of hope amid the largest Ebola outbreak in recorded history. WHO has seen "encouraging signs" from Nigeria and Guinea that positive action can rein in the deadly disease. The current outbreak began in December. The situation in Lagos, Nigeria, where the country's first case was detected in July, "looks reassuring," WHO said Tuesday.
Liberia Battles Ebola Epidemic - In West Africa, more than 2,200 people have contracted Ebola since March, and 1,200 of them have died from the virus. Liberia has suffered the most deaths to date, with teams of undertakers wearing protective clothing now collecting victims from all over the capital of Monrovia. Poor sanitation, close living quarters, and a lack of education have contributed to the spread of the virus. Among some, a belief has grown that the epidemic is a fraud, and that people are dying from other causes, leading to confrontations between citizens and health workers. Burial teams have been turned away while trying to retrieve bodies from neighborhoods, and isolation wards have been vandalized or overrun by mobs believing the Ebola virus is a hoax. Getty Images photographer John Moore has spent the past week in Liberia, documenting the situation as the country battles to halt the spread of Ebola while struggling to handle the huge rise of infectious, sick, and dying patients. [32 photos]
Ebola update -- Overnight Ebola news on Ebola was not too bad. A suspected case has appeared in Berlin but is low probability: A female patient in Berlin is currently awaiting tests to determine whether she has Ebola, but spokespeople from the Charité hospital where she is being treated say it is unlikely she has the virus. Another suspected case in Spain has tested negative. In Africa, Liberia has rounded up the various patients dispersed by the recent lunatic ransacking of a border clinic: Liberia has found all 17 suspected Ebola patients who fled a quarantine centre in Monrovia at the weekend and transferred them to another clinic, the country’s information minister said on Tuesday. The second American that has been treated with ZMapp is also recovering: The husband of an American missionary under treatment for Ebola at Emory University Hospital said Monday his wife is gaining strength, while three ill Liberian doctors who were given an experimental drug also showed signs of improvement. Four Ebola patients in Nigeria were also recovering. Meanwhile the latest statistics show no slowing in the West African outbreak:
Ten Killed From "Ebola-Like Symptoms" In Africa's Second Largest Country - While the world awaits the test results from an Ebola suspect in Sacramento to learn if Ebola has now officially entered the US, the epidemic in Africa has now drifted away from the confines of its original hotspots of Guinea, Liberia and Sierra Leone, and after spreading to Africa's most populous nation Nigeria, and the third most populated city in the world, Lagos, it appears to have just entered the second largest country in Africa by area, and fourth most populous African nation: the Democratic Republic of the Congo.
"Isolation Procedures Put In Place" After Ebola Suspect Dies In Ireland; Ebola-Like Disease Claims 70 In Congo - Last week Ireland rushed to deny that a man with Ebola-like symptoms who was being tested in Dublin, did not have the disease. It may find such a refutation more difficult this time after Irish Times reported that a man was found dead last night in Donegal, after working in Sierra Leone, the epicenter of the current Ebola outbreak, and where "it is understood that a number of colleagues had contracted the virus." The deceased was taken to Letterkenny General Hospital where the HSE is carrying out tests to see whether the death resulted from Ebola. From the Irish Times: “The public health department was made aware earlier today of the remains of an individual, discovered early this morning, who had recently travelled to the one of the areas in Africa affected by the current Ebola virus disease outbreak,” it said. “The appropriate national guidelines, in line with international best practice, are being followed by the public health team dealing with the situation. This means that the body of the deceased has been isolated to minimise the potential spread of any possible virus.”
Liberian Police Open Fire On Ebola Protesters - Police in the Liberian capital fired live rounds and tear gas on Wednesday to disperse a stone-throwing crowd trying to break an Ebola quarantine imposed on their neighbourhood. As Reuters reports, at least four people were injured in clashes with security forces, witnesses said, though it was unclear whether anyone was wounded by the gunfire. Liberian authorities introduced a nationwide curfew on Tuesday and put the West Point neighbourhood under quarantine to curb the spread of the disease. "The soldiers are using live rounds," said army spokesman Dessaline Allison, adding: "The soldiers applied the rules of engagement. They did not fire on peaceful citizens." Locals are angry, "I don't have any food and we're scared," screamed one, adding, "it is inhumane."
Ebola crisis: This is why '75%' of victims are women - About 75 per cent of people contracting Ebola are women because they are often the primary care-givers, nurses and traders within their communities, health officials have said.The disease, which has claimed the lives of at least 1,229 people across Guinea, Liberia, Sierra Leone and Nigeria, is disproportionality infecting women as the outbreak spreads across West Africa. Julia Duncan-Cassell, Liberia’s minister for gender and development, said health teams at task force meeting in Liberia found three-quarters of those who were infected or died from Ebola were female. “Women are the caregivers — if a kid is sick, they say, ‘Go to your mom.' “The cross-border trade women go to Guinea and Sierra Leone for the weekly markets, [and] they are also the caregivers. Most of the time when there is a death in the family, it’s the woman who prepares the funeral, usually an aunt or older female relative.” The Ministry of Health in Liberia also said about 75 per cent of the Ebola deaths it has counted so far have been women, Buzz Feed reports.
Consumer Reports Finds Eating Tuna Too Risky for Pregnant Women - Eat more fish. It’s a ubiquitous bit of dietary advice you hear over and over. For pregnant and nursing mothers, it’s something that the U.S. Food and Drug Administration (FDA) specifically recommends. To lots of people, “fish” equals tuna. It’s canned. It’s cheap. It’s easy. But new analysis from one of the country’s most trusted resources when it comes to product safety, Consumer Reports (CR), concludes that tuna’s high levels of mercury outweigh its potential benefits for expecting mothers. The report, The Great Fish Debate, relies on data from the FDA and U.S. Environmental Protection Agency (EPA), but directly conflicts with the agencies’ latest recommendations on seafood, which state that a medium amount of tuna is okay for consumption as the health benefits outweigh the effects of consuming mercury. It’s a touchy subject for the agencies, which recently set a minimum level for the amount of fish people should consume weekly. In fact, after CR pointed out to the FDA that its own data indicated elevated risks, the agency replaced a chart that ranked seafood according to mercury levels with a new one that lists species in alphabetical order, in what would seem to be an attempt to obfuscate the contradictory data.
The High Cost of Cheap Meat: Christine Chemnitz and Shefali Sharma enter the nightmare of factory-style livestock production. - Factory-style livestock production is a critical driver of agricultural industrialization. Its remorseless expansion is contributing to climate change, deforestation, biodiversity loss, and human-rights violations – all to satisfy Western societies’ unhealthy appetite for cheap meat. Europe and the United States were the largest meat consumers in the twentieth century, with the average person eating 60-90 kilograms (132-198 pounds) annually – far more than is required to meet humans’ nutritional needs. Though Western consumption rates are now stagnating and even declining in some regions, they remain far higher than in most other regions in the world. Meanwhile, in emerging economies – especially the so-called BRICS (Brazil, Russia, India, China, and South Africa) – members of the burgeoning middle class are changing their diets to resemble those of their rich-country counterparts. In the coming decades, as incomes continue to rise, so will demand for meat and dairy products. To meet this demand, the world’s agribusiness firms will attempt to boost their annual meat output from 300 million tons today to 480 million tons by 2050, generating serious social challenges and ecological pressures at virtually every stage of the value chain (feed supply, production, processing, and retail).
U.S. farmers fight poisonous wheat fungus with cleaning, waiting (Reuters) - Dave Wiechert of Nashville, Illinois, does good business most years cleaning seed for farmers in preparation for planting season. But this year, Wiechert is doing big business after harvest: cleaning fungus off wheat so farmers can sell it. The "head scab" fungus can produce vomitoxin, a chemical that is poisonous to humans and livestock when consumed at high levels. This year, soft red winter wheat has been hit badly by the fungus, which develops when it rains during the crop's key growing period. Head scab, which scientists call fusarium head blight, can hit profits of farmers and grain handlers hard, while raising costs for bread and cereal makers. Previous outbreaks cost the U.S. wheat and barley industry $2.7 billion from 1998 to 2000, then another estimated $4.4 billion in 2011. It is too soon to know the full economic losses for 2014. In addition, unsellable wheat has been competing for storage space with bumper corn and soybean crops about to arrive in the autumn harvest. Cleaning the wheat reduces vomitoxin levels as it sifts out damaged grain, but it can cost about $1 per bushel for farmers. Wheat currently sells at around $5 per bushel. "This is the worse I've ever seen it," said Wiechert, owner of Wiechert Seed Inc., 50 miles southeast of St. Louis, Missouri, near the epicenter of a vomitoxin outbreak.
'Outrage' Follows USDA's Advancement Of New Genetically Engineered Crops: Watchdog groups are denouncing the U.S. Department of Agriculture’s recommendation on Wednesday to approve new varieties of genetically engineered corn and soybeans as a path towards more toxic pesticides that threaten the environment and public health. “We are outraged,” stated Marcia Ishii-Eiteman, PhD, senior scientist with Pesticide Action Network, adding that the “USDA has turned its back on America’s farmers and rural communities.” The new crops are Dow AgroScience’s 2,4-D- and glyphosate-tolerant corn and soybeans. They are made to be used with Dow’s Enlist Duo herbicide, which contains 2,4-D and glyphosate and is also under review by the USDA. The decision to advance the crops towards full deregulation flies in face of warnings by food and environmental groups, doctors, scientists, 50 members of Congress, as well as thousands of public comments to the USDA. The calls not to green-light the crops focus on the dangers of 2,4-D, whose use the USDA admits will increase at least three-fold with the Enlist package. Writing at Environmental Working Group’s (EWG) AgMag blog, Mary Ellen Kustin and Soren Rundquist detail the group’s analysis showing that over 5,600 American schools are within 200 feet from a field where 2,4-D could be sprayed if the Enlist Duo package is fully approved, a particularly noteworthy finding as 2,4-D has been linked to Parkinson’s, non-Hodgkin’s lymphoma, cancer and other health problems.
Argentina Farmers Struggle to Finance Crops After Default: The Argentinian Association of Experimental Regional Agricultural Consortium (CREA) says that the farm business in the country already pays an average of 40% annual rates. CREA also forecasts that the corn acres would fall up to 25% in the next season from the current 10.62 million acres. Corn is the most expensive crop, while the current price does not seem to be attractive. As an alternative to banks, nearly 50% of Argentina's farmers use the local stocks exchanges and about 25% use grains as a currency and the "silo-bags as savings accounts" - keeping most of the grain in the field until it reaches the highest price, according to the Rosario Board of Trade. Approximately 39% of grain farmers in Argentina will need to finance the next crop. The trend is that soybean stocks start to be sold faster soon, so that they get can the money to buy the inputs. "The indebted farmers and the least capitalized would sell it soon. Just the most capitalized would still keep waiting for the best soybean price", explains to Agriculture.com Lorena D'Angelo, an independent analyst from Rosario, a port city in the Northeast of the country.
Adaptation Gaps Mean African Farmers Fork Out More Money for Reduced Harvests - In Cameroon’s Northwest Region, Judith Muma walks 9km from her home to her 300-square-metre farm. The vegetables she grows here are flourishing thanks to the money she has borrowed from her njangi (thrift group) and a local credit union to finance a small artisanal irrigation scheme. “I think we must spend in farming today if we want to adapt to climate change,” Muma tells IPS. Cameroon’s economy is primarily agrarian and about 70 percent of this Central African nation’s 21.7 million people are involved in farming. Changes in temperature and precipitation pose a serious threat to the nation’s economy where agriculture contributes about 45 percent to the annual GDP. In the northern parts of Cameroon, the semi-arid lowlands and hills are mostly dependent on rainfall and groundwater. The impact of forest clearance on hydrological processes has also aggravated climate change impact in these areas. Muma explains that even small-scale subsistence farmers like her now need to invest money in their livelihoods to ensure a minimal output. She says as a result of her investment, most of her harvest — 60 percent — is sold at a local vegetable market. According to the World Bank, agriculture in Africa declined in absolute terms from eight billion dollars in 1984 to 3.5 billion dollars in 2005. There was also a decline in development cooperation policies and in national budget allocations for agriculture.
100,000 elephants killed in Africa, study finds (AP) — Poachers killed an estimated 100,000 elephants across Africa between 2010 and 2012, a huge spike in the continent's death rate of the world's largest mammals because of an increased demand for ivory in China and other Asian nations, a new study published Monday found. Warnings about massive elephant slaughters have been ringing for years, but Monday's study is the first to scientifically quantify the number of deaths across the continent by measuring deaths in one closely monitored park in Kenya and using other published data to extrapolate fatality tolls across the continent. The study — which was carried out by the world's leading elephant experts — found that the proportion of illegally killed elephants has climbed from 25 percent of all elephant deaths a decade ago to roughly 65 percent of all elephant deaths today, a percentage that, if continued, will lead to the extinction of the species.
California Now Suffering Worst Drought Ever, 2014 Hottest Year On Record - While most headlines are focused on the devastating drought in California, which by some measures is the worst on record, there is another 'factor' that has exploded to record highs - the heat. As Bloomberg reports, the California heat this year is like nothing ever seen, with records that go back to 1895 and with 70 percent of the state’s pastures rated “very poor to poor,” according to the USDA, things do not appear to be about to get better any time soon as The International Panel on Climate Change warns this "hot weather" is becoming simply "weather."
'Severe' drought covers nearly 99.8% of California, report says: Drought conditions may have leveled off across California, but nearly 100 percent of the state remains in the third-harshest category for dryness, according to the latest measurements. For the past two weeks, California's drought picture has remained the same, halting a steady march toward worse. But the breather has allowed the state to recover only ever so slightly. In May, 100 percent of California was experiencing "severe" drought - the third harshest on a five-level scale - but since things have leveled off, that figure has only improved to 99.8 percent, according to the U.S. Drought Monitor report. Meanwhile, nearly 82 percent of California continues to suffer "extreme" drought, and within that area, more than half the state is under the driest "exceptional" drought category. The figures come as the state Water Resources Control Board authorized strict fines for water wasters in July as part of the latest conservation effort. As cities across California start enforcing penalties with renewed gusto for over-watering, residents have felt the consequences - some incurring huge fines, others annoyed with browning neighborhood lawns. In Santa Cruz, residents who incur penalties can even attend one-time classes instead of paying fees - the water equivalent of traffic school. As images of dry lake beds and muddy streams continue to proliferate, forecasters warn hope for relief has dimmed somewhat. The latest long-term forecast shows the chances of a wet El Nino weather pattern starting this fall has decreased to about 65 percent, and if it does arrive, it will probably be weaker than originally expected.
California drought stings bees, honey supplies --— California's record drought hasn't been sweet to honeybees, and it's creating a sticky situation for beekeepers and honey buyers.The state is traditionally one of the country's largest honey producers, with abundant crops and wildflowers that provide the nectar that bees turn into honey. But the lack of rain has ravaged native plants and forced farmers to scale back crop production, leaving fewer places for honeybees to forage.The historic drought, now in its third year, is reducing supplies of California honey, raising prices for consumers and making it harder for beekeepers to earn a living."Our honey crop is severely impacted by the drought, and it does impact our bottom line as a business," .The drought is just the latest blow to honeybees, which pollinate about one third of U.S. agricultural crops. In recent years, bee populations worldwide have been decimated by pesticides, parasites and colony collapse disorder, a mysterious phenomenon in which worker bees suddenly disappear.The drought is worsening a worldwide shortage of honey that has pushed prices to all-time highs. Over the past eight years, the average retail price for honey has increased 65 percent from $3.83 to $6.32 per pound, according to the National Honey Board.
Drought in California – in pictures - As the severe drought continues for a third year, water levels in the state’s lakes and reservoirs are reaching historic lows
California Has Given Out Rights To Five Times More Water Than It Actually Has -- According to a new study, the water rights given out by California amount to five times the amount of surface water the state’s ecosystem can actually provide. The analysis, published Tuesday in the journal Environmental Research Letters, found that water rights issued since 1914 add up to 370 million acre-feet of water annually, while the surface water that actually flows through the state adds up to just 70 million acre-feet in a good year for precipitation. An acre-oot of water is roughly enough to supply two households for one year, and 300 million acre-feet of water is enough to fill Lake Tahoe two-and-a-half times over. The study arrived at its numbers by crunching public data from the State Water Resources Control Board, the state agency that administers the water rights. The L.A. Times reported that 16 of California’s 20 major rivers face a rights allocation that exceeds the natural supply, including the San Joaquin River, the Kern River, and the Stanislaus River.
63 trillion gallons of groundwater lost in drought, study finds -- The ongoing drought in the western United States has caused so much loss of groundwater that the Earth, on average, has lifted up about 0.16 inches over the last 18 months, according to a new study. The situation was even worse in the snow-starved mountains of California, where the Earth rose up to 0.6 inches.Researchers from UC San Diego’s Scripps Institution of Oceanography and the U.S. Geological Survey estimated the groundwater loss from the start of 2013 to be 63 trillion gallons — the equivalent of flooding four inches of water across the United States west of the Rocky Mountains. The study, published online Thursday by the journal Science, offers a grim accounting of the drought’s toll. “We found that it’s most severe in California, particularly in the Sierras,” said coauthor Duncan Agnew, professor of geophysics at UC San Diego’s Scripps Institution of Oceanography. “It’s predominantly in the Coast Ranges and the Sierras showing the most uplift, and hence, that’s where we believe is the largest water loss.” That’s also about how much ice is lost from the Greenland ice cap every year from global warming.
Epic Drought in West Is Literally Moving Mountains -- Climate change is driving the Greenland Ice Sheet to melt, which is contributing to sea level rise. But imagine that the same amount of water melting from Greenland each year is being lost in California and the rest of the West because of the epic drought there. What happens? The land in the West begins to rise. In fact, some parts of California’s mountains have been uplifted as much as 15 millimeters (about 0.6 inches) in the past 18 months because the massive amount of water lost in the drought is no longer weighing down the land, causing it to rise a bit like an uncoiled spring, a new study shows. For the first time, scientists are now able to measure how much surface and groundwater is lost during droughts by measuring how much the land rises as it dries. Those are the conclusions of the new study published Aug. 21 in the journal Science by researchers at the Scripps Institution of Oceanography at the the University of California-San Diego. The drought that is devastating California and much of the West has dried the region so much that 240 gigatons worth of surface and groundwater have been lost, roughly the equivalent to a 3.9-inch layer of water over the entire West, or the annual loss of mass from the Greenland Ice Sheet, according to the study. While some of California’s mountains have risen by about 0.6 inches since early 2013, the West overall has risen by an average of about 0.157 inches.
California Drought: Bay Area loses billions of gallons to leaky pipes - As Bay Area residents struggle to save water during a historic drought, the region's water providers have been losing about 23 billion gallons a year, a new analysis of state records reveals. Aging and broken pipes, usually underground and out of sight, have leaked enough water annually to submerge the whole of Manhattan by 5 feet -- enough to meet the needs of 71,000 families for an entire year. Bay Area water agencies have lost from 3 to 16 percent of their treated water, according to this newspaper's analysis of the latest reports on water that disappears before the meter. The figures are especially irritating for residents who are being forced to cut up to 20 percent of their water use and contend with the first-ever statewide restrictions on outdoor watering. Leaks not only waste one of California's most precious resources but damage property and cost money through lost revenue for utilities and higher rates for water users. This newspaper's analysis of reports submitted voluntarily to the Department of Water Resources for 2010 -- the latest year statewide records are available -- shows a wide range of estimated losses. They range from 3.5 percent in Antioch and 5.2 percent in Santa Clara to 13 percent in Los Altos and 15.75 percent in Hayward. Leaks, breaks and overflows cost the East Bay Municipal Utility District 9.2 percent, or 6.028 billion gallons, of its total water production in 2012, the district declared in a more recent report.
India in danger of moving towards water scarcity condition: Asian Development Bank - India is in danger of moving towards water scarcity conditions as per capita availability of water is reducing in the country, a Asian Development Bank official said today. He further said that the situation in India is challenging in the light of growing population. "The situation in India is also particularly challenging given the size of the population, its expected growth and having only about four per cent of the world's fresh water resources," Rana Hassan, Principal Economist, India Resident Mission, Asian Development Bank said. He was addressing the gathering at an international seminar on water risk and water stewardship here today. Citing projections, he said that the per capita average annual water availability was reducing, which may lead to water scarcity conditions. "In fact, with the projections that we have before us, per capita average annual water availability is reducing and we are steadily in danger of moving towards water scarcity conditions," he added. He also noted that variations in rainfall and increase in demand for water from industries are a few factors compounding to the situation.
Peak Water Infographic - Big Picture Agriculture
Renewed signs of an El Nino event in 2014: An El Nino remains a possibility in 2014 after renewed signs of the weather event were detected in the Pacific, according to the Bureau of Meteorology. The normally easterly trade winds have weakened in the past two weeks and temperatures are again picking up in a broad region of the central and eastern equatorial Pacific, the bureau said in its fortnightly update. If the winds remain weak, “there could be a renewed push to an El Nino”, said Robyn Duell, a senior climatologist at the bureau. “It’s still a real possibility for 2014.” El Nino years often see above-average temperatures across southern Australia and below-average rainfall across the south and eastern inland parts of the country. The El Nino-Southern Oscillation phenomenon is watched closely by weather agencies around the world because of the dominant role El Nino and its counterpart, La Nina, play in setting global conditions. Two weeks ago, the bureau downgraded the prospect of an El Nino this year to about a 50-50 chance, a shift echoed since by the US Climate Prediction Centre although it rates the likelihood as about a 65 per cent possibility.
Jet Stream Changes Driving Extreme Weather Linked Again To Global Warming, Arctic Ice Loss - California is suffering through its worst drought on record, while the East Coast sees off-the-charts flooding. Both types of extremes are worsened by global warming as scientists have explained for decades. But in recent years you may have noticed a disproportionate increase in record-smashing extreme weather and suspected that’s also linked to global warming. A new study from a team of scientists from the Potsdam Institute for Climate Impact Research (PIK) says you’re right. The PIK release explains: Weather extremes in the summer — such as the record heat wave in the United States that hit corn farmers and worsened wildfires in 2012 — have reached an exceptional number in the last ten years. Man-made global warming can explain a gradual increase in periods of severe heat, but the observed change in the magnitude and duration of some events is not so easily explained. It has been linked to a recently discovered mechanism: the trapping of giant waves in the atmosphere. A new data analysis now shows that such wave-trapping events are indeed on the rise. A number of studies in recent years have linked this quantum jump in extreme weather to global warming and the warming-driven loss of Arctic ice (see here and here). Jennifer Francis of Rutgers University’s Institute of Marine and Coastal Sciences has been at the forefront of this research. She explains her findings in this video.
What Climate Change in the Rockies Means for its Water - In the West, Colorado is known as a “headwaters” state because most of the region’s biggest rivers begin in the Colorado Rocky Mountains. The Colorado River. The Arkansas River. The Rio Grande. The San Juan River. The Platte River — North and South. Altogether, they provide 19 states with drinking and irrigation water, including the cities of Los Angeles, Phoenix and Denver, among many others. All of the water in those rivers comes from one source: the Rocky Mountains’ snowpack, which is expected to shrink as temperatures rise in a warming climate. That’s why a new report by Colorado’s state water authorities showing how climate change will affect water supply there is so important. How much water is going to be coursing down these rivers in a warming world is highly uncertain, and that means the millions of people downstream of Colorado have a lot at stake. “Already, snowmelt and runoff are shifting earlier, our soils are becoming drier, and the growing season has lengthened,” Jeff Lukas, lead author of the report released by the Colorado Water Conservation Board and the Western Water Assessment, said in a statement. “Wildfires and heat waves have become more common, too. Climate projections suggest those trends — all of which can affect water supply and demand — will continue.”
Water scarcity and climate change through 2095 -- What will a global water scarcity map look like in 2095? Radically different, according to scientists at Pacific Northwest National Laboratory, depending on the type and the stringency of the climate mitigation policies chosen to reduce carbon pollution. In a first of its kind comprehensive analysis, the researchers, working at the Joint Global Change Research Institute, used a unique modeling capability that links economic, energy, land-use and climate systems to show the effects of global change on water scarcity. When they incorporated water use and availability in this powerful engine and ran scenarios of possible climate mitigation policy targets, they found that without any climate policy to curb carbon emissions, half the world will be living under extreme water scarcity. Some climate mitigation policies, such as increasing growth of water-hungry biofuels, may exacerbate water scarcity. Water scarcity may pose a significant challenge to our ability to adapt to or mitigate climate change. Why? For example, growing bioenergy crops to replace fossil fuel sources, an important component of many technology strategies that reduce greenhouse gas emissions, rely on plentiful water. Thus, water availability could impose severe limits on both emissions mitigation and climate adaptation.
Heavy rain and floods: The 'new normal' with climate change? - As people clean up after torrential rains and heavy flooding in cities in the Midwest and along the Atlantic Coast, the events highlight what many climate researchers say is a new "normal" for severe rainfall in the US. Quite apart from what long-term changes in precipitation say about global warming, these events also provide a reality check on the ability of urban areas to cope with flooding from intense downpours in a warming climate. They "definitely can tell us a lot about where our vulnerabilities are and what types of things might be on the checklist for fixing," says Joe Casola, staff scientist with the Center for Climate and Energy Solutions in Arlington, Va. During the past 110 years, average precipitation has increased over much of the continental US. During the past 54 years, the amount of rain or snow falling from the top 1 percent of intense storms has increased in every region, with the Northeast and Midwest recording the largest increases, according to the latest National Climate Assessment from the federal government's US Global Change Research Program, released in May. Those trends are expected to continue as the climate warms, with the wet areas generally growing wetter and the dry regions growing still more arid.
Hurricanes Also Wash Away Income Growth - Tropical storms may pass over an area in less than a day but the economic impact on the ravaged areas can last for two decades. That’s the finding of a new study that looked at the impact on long-run income growth from a cyclone (called a typhoon in the Pacific and a hurricane in the Atlantic). The implications are great as the world grapples with a changing climate. In the paper “The Causal Effect of Environment Catastrophe on Long Run Economic Growth: Evidence from 6,700 Cyclones,” Solomon Hsiang, et al examined the economic performance of nations hit by tropical cyclones from 1950 through 2008. To measure a storm’s intensity, Messrs. Hsiang and Jina used wind speed. What they found is that the popular idea that disasters stimulate growth and economic losses are made up quickly isn’t true. Storms cause a long-running reduction in per capita real gross domestic product. The researchers found if during the course of a year each location in a country experienced maximum cyclone wind speeds of 9.4 meters per second (m/s) above average (about an extra 21 miles per hour), this would result in national income being 3.6% lower in 20 years than it would have been without the storm. The more severe the storm, the bigger the extended damage. “Fifteen years after a strike, GDP is 0.38 percentage points lower for every additional 1 m/s of wind speed exposure and exhibits no sign of recovery after twenty years,” they write. In the study, a once-every-10-year hurricane triggered a 7.4% drop in income. The top 1% severest cyclones caused a 14.9% decline.
Tibet's glaciers at their warmest in 2,000 years - report: (Reuters) - The Tibetan plateau, whose glaciers supply water to hundreds of millions of people in Asia, were warmer over the past 50 years than at any stage in the past two millennia, a Chinese newspaper said, citing an academic report. Temperatures and humidity are likely to continue to rise throughout this century, causing glaciers to retreat and desertification to spread, according to the report published by the Chinese Academy of Sciences' Institute of Tibetan Plateau Research. "Over the past 50 years, the rate of temperature rise has been double the average global level," it said, according to the report on the website of Science and Technology Daily, a state-run newspaper. Glacier retreat could disrupt water supply to several of Asia's main rivers that originate from the plateau, including China's Yellow and Yangtze, India's Brahmaputra, and the Mekong and Salween in Southeast Asia. In May, Chinese scientists said Tibetan glaciers had shrunk 15 percent - around 8,000 square km (3,100 square miles) - over the past 30 years. The new report said a combination of climate change and human activity on the plateau was likely to cause an increase in floods and landslides there. However, rising temperatures had also improved the local ecosystem, it said.
Danger to Great Barrier Reef growing as reports reveal site's health is declining -- The outlook for the Great Barrier Reef looks grim, with many of the threats to its environmental health worsening over the past five years and expected to deteriorate further as climate change intensifies, two major reviews have found. In worrying signs for the future of the world heritage site, two reports released by the federal government on Tuesday have warned the reef is under significant stress. The first report is a five-yearly outlook report by the Great Barrier Reef Marine Park Authority, the agency that oversees the reef’s marine parks. The second is a strategic assessment prepared by the federal and Queensland governments as part of a request by the United Nations world heritage body to have the site better looked after.
July Checks In as 4th Warmest on Record Worldwide -- If you spent your summer in the Midwest or almost anywhere in the U.S. south of New York where the season was mild, it may have been easy to miss that most of the rest of the world was baking last month. New National Climatic Data Center (NCDC) data show that last month was the fourth-warmest July on record worldwide, even though two giant cool spots in the Northern Hemisphere — one over Siberia and the other over the U.S. Midwest — made it easy for people living there to think that summer 2014 has been a mild one. The world’s fourth-warmest July comes just after the globe’s warmest June, which was driven mostly by the hottest ocean temperatures since recordkeeping began 130 years ago. 2014 is on track to become the earth’s third-warmest year in on record. The combined average temperature over land and ocean surfaces last month was 1.15°F above the 20th century average of 60.4°F, NCDC data show. Sea surface temperatures last month were about 1°F above the 20th century average, tying 2009 as the warmest July on record. The global land surface temperature was the 10th highest for July since recordkeeping began, but the coolest since 2009.
July Ocean Temperature Hits Record High—Again - Last month, Earth’s ocean surfaces tied the previous record for the hottest July during the 130 years the U.S. government has been compiling data. The National Climatic Data Center of the National Oceanic and Atmospheric Administration (NOAA) reported that the average temperature was 62.56 degrees Fahrenheit, 1.06 degrees above the 20th-century average. The ocean surfaces also reached that temperature in July 2009. It’s the third straight month this year that ocean surface temperatures set a record. Other July statistics from the NOAA:
- The combined average temperature over global land and ocean surfaces for July 2014 was the fourth highest on record for July, at 1.15°F above the 20th-century average of 60.4°F.
- The global land surface temperature was 1.33°F above the 20th-century average of 57.8°F, marking the 10th warmest July on record.
- The combined global land and ocean average surface temperature for the January–July period (year-to-date) was 1.19°F above the 20th-century average of 56.9°F, tying with 2002 as the third warmest such period on record.
July 2014 Shows Hottest Ocean Surface Temperatures on Record as New Warm Kelvin Wave Forms -- According to NOAA’s Climate Prediction Center, July of 2014 was the 4th hottest in the 135-year global temperature record. Land surface temperatures measured 10th hottest in the global record while ocean surface temperatures remained extraordinarily hot, tying July of 2009 as the hottest on record for all years on measure over the past two centuries. Overall, land temperatures were 0.74 C above the 1950-1981 average and ocean surface temperatures were 0.59 C above the same average. These new record or near record highs come after the hottest 2nd quarter year in the global temperature record where combined land and ocean temperatures exceeded all previous global high temperatures in the measure. Though the atmosphere failed to respond to a powerful Kelvin Wave issuing across the Pacific earlier this year, stifling the development of a predicted El Nino, it appears a new warm Kelvin Wave is now beginning to form. Moderate west wind back bursts near New Guinea initiated warm water down-welling and propagation across the Pacific Ocean during July and early August. The down-welling warmth appeared to link up with warm water upwelling west of New Guinea and began a thrust across the Pacific over the past week. As of the most recent sub-sea float analysis, anomalies in the new Kelvin wave ranged as warm as 4-5 C above average:
Snowpack atop Arctic sea ice has dwindled since 1950s -- Snow atop Arctic sea ice has thinned dramatically since the mid-20th century, declining by more than a third in the western Arctic and by more than half in the Chukchi and Beaufort seas, reports a new study led by researchers at the University of Washington and NASA. The study crunched numbers collected in a variety of ways over the decades -- from simple handheld meter sticks poked into snow at Soviet ice stations as early as 1937; from modern, depth-recording poles thrust into the snow by researchers traveling to the ice pack in recent years; from measurements taken from instruments on buoys mobilized by the Cold Regions Research and Engineering Laboratory; and from a sophisticated aerial radar system used by NASA’s Operation IceBridge program. The results? Spring snowpack on sea ice in the western Arctic went from average depths of about 14 inches in the 1954-1991 period to about 9 inches in the 2009-2013 period. On the Chukchi and Beaufort seas, the decrease was bigger, from 13 inches to 6 inches. The study has been accepted for publication in the Journal of Geophysical Research and is available online in a draft form.
Federal government puts polar briefings on ice: Federal scientists who keep a close eye on the Arctic ice would like to routinely brief Canadians about extraordinary events unfolding in the North. But newly released federal documents show the Harper government has been thwarting their efforts. In 2012, as the Arctic ice hit the lowest point ever recorded, scientists at the Canadian Ice Service were keen to tell Canadians about the stunning ice loss. “Less ice doesn’t mean less danger. In fact the opposite is true and there is greater need for ice information,” Leah Braithwaite, the service’s chief of applied science said in an August 2012 memo to Norman Naylor, a strategic communications adviser at Environment Canada. Braithwaite and her colleagues — aware of the national and international interest in the shrinking polar ice — wanted to hold a “strictly factual” technical briefing for the media to inform Canadians how the ice had disappeared from not only the Northwest Passage but many normally ice-choked parts of the Arctic. The briefing never happened. Nine levels of approval — from the director of the ice service up to the environment minister’s office — were needed for the “communication plan,” according to the documents released to Postmedia News under the Access to Information Act.
Swamped by Rising Seas, Small Islands Seek a Lifeline - The world’s 52 small island developing states (SIDS), some in danger of being wiped off the face of the earth because of sea-level rise triggered by climate change, will be the focus of an international conference in the South Pacific island nation of Samoa next month. Scheduled to take place Sep. 1-2, the conference will provide world leaders with “a first-hand opportunity to experience climate change and poverty challenges of small islands.” For low-lying atoll nations particularly, the high ratio of coastal area to land mass will make adaptation to climate change a significant challenge. According to the United Nations, the political leaders are expected to announce “over 200 concrete partnerships” to lift small islanders out of poverty – all of whom are facing rising sea levels, overfishing, and destructive natural events like typhoons and tsunamis. “We are working with our partners – bilaterally and multilaterally – to help resolve our problems,” said Ambassador Ali’ioaiga Feturi Elisaia, permanent representative of Samoa to the United Nations. “You don’t have to bring the cheque book to the [negotiating] table,” he added. “It’s partnerships that matter.” The issues on the conference agenda include sustainable economic development, oceans, food security and waste management, sustainable tourism, disaster risk reduction, health and non-communicable diseases, youth and women.
Greenland And West Antarctic Ice Sheet Loss More Than Doubled In Last Five Years - A new study finds that both the Greenland ice sheet and West Antarctic Ice Sheet (WAIS) have seen an astonishing increase in ice loss in just the past five years. This first-ever extensive mapping of the two great ice sheets using the CryoSat-2 satellite confirms the findings of several recent studies that “suggest that the globe’s ice sheets will contribute far more to sea level rise than current projections show,” as NASA glaciologist Eric Rignot said recently. Comparing the current CryoSat-2 data with “those from the ICESat satellite from the year 2009, the volume loss in Greenland has doubled since then.” Coauthor and glaciologist Prof. Dr. Angelika Humbert further explained in the news release: “The loss of the West Antarctic Ice Sheet has in the same time span increased by a factor of 3. Combined the two ice sheets are thinning at a rate of 500 cubic kilometres per year. That is the highest speed observed since altimetry satellite records began about 20 years ago.” So we are at record rates of ice loss now. What is particularly stunning is that a major international study found in 2012 that Greenalnd’s ice loss was up by a factor of five since the mid-90s, while Antartica’s was up 50 percent in the prior decade. We are seeing ice sheet loss at rates not imagined even a few years ago. Back in May, two studies provided evidence that the West Antarctic Ice Sheet has begun an irreversible process of collapse, in part because its key glaciers are grounded below sea level and are melting from underneath.
World's largest ice sheets melting at fastest rate ever recorded - twice as fast as five years ago! --Researchers from the Alfred Wegener Institute, Helmholtz Centre for Polar and Marine Research (AWI), have for the first time extensively mapped Greenland’s and Antarctica’s ice sheets with the help of the ESA satellite CryoSat-2 and have thus been able to prove that the ice crusts of both regions momentarily decline at an unprecedented rate. In total the ice sheets are losing around 500 cubic kilometres of ice per year. This ice mass corresponds to a layer that is about 600 metres thick and would stretch out over the entire metropolitan area of Hamburg, Germany's second largest city. The maps and results of this study are published today in The Cryosphere, an open access journal of the European Geosciences Union (EGU).“The new elevation maps are snapshots of the current state of the ice sheets. The elevations are very accurate, to just a few metres in height, and cover close to 16 million km2 of the area of the ice sheets. This is 500,000 square kilometres more than any previous elevation model from altimetry,” says lead-author Dr. Veit Helm, glaciologist at the Alfred Wegener Institute in Bremerhaven. ...Scientists did discover that the East Antarctica is gaining volume – this gain is not enough to compensate for the larger losses elsewhere.
Antarctica May Lift Sea Level Faster in Threat to Megacities - Antarctica glaciers melting because of global warming may push up sea levels faster than previously believed, potentially threatening megacities including New York and Shanghai, researchers in Germany said. Antarctica’s ice discharge may raise sea levels as much as 37 centimeters (14.6 inches) this century if the output of greenhouse gases continues to grow, according to a study led by the Potsdam Institute for Climate Impact Research. The increase may be as little as 1 centimeter, they said. “This is a big range, which is exactly why we call it a risk,” Anders Levermann, the study’s lead author, said in a statement. “Science needs to be clear about the uncertainty so that decision-makers at the coast and in coastal megacities can consider the implications in their planning processes.” The Antarctic ice sheet contains enough water to raise sea levels by over 58 meters (190 feet) though even at the current rate of warming it would take thousands of years to melt, according to the United Nations. The southern continent contributed on average about 0.3 millimeters per year to sea-level rise from 1993 through 2010 -- or about 10 percent of the yearly total, the UN says. NASA said in May that the glacier melt in the Amundsen Sea region of Western Antarctica may have become “unstoppable.”
California Is ‘Woefully Unprepared’ For Sea Level Rise, Says A New Report -- California is facing a possible loss of billions to its economy thanks to sea level rise — an outcome for which it is “woefully unprepared” according to a new report from the state’s legislature. The report, picked up by the San Francisco Examiner, was recently released by the Assembly Select Committee on Sea Level Rise and the California Economy. This committee held a string of hearings around the state to collect testimony from scientists and industry leaders on just what the state can expect from sea level rise, and what the consequences could be for its economy and infrastructure. In particular, the report highlighted data from the United States’ oldest operating sea level gauge, which sits at Fort Point in the San Francisco Bay. It shows a seven-inch rise in the local sea level over the last one hunted years. The report then pointed to a 2012 analysis by the National Research Council, which said California should prepare for another three feet of sea level rise by 2100 — and that low-lying areas such as the San Francisco International Airport could start flooding within decades. Sea level rise can in fact occur at different speeds from region to region, and California in particular faces a faster pace than surrounding states. That’s because of likely higher local sea levels driven by El Niño climate patterns, and because portions of the state south of Cape Mendocino are subsiding thanks to tectonic plate movement.
Will it be extinction or 'translocation' as impacts of climate change increase? - Climate change is altering the way some scientists are trying to save endangered plant and animal species from extinction. For nearly 100 years, conservationists have focused preservation efforts on maintaining species' historical ranges and reintroducing captive-bred species to boost dwindling populations. Now, some scientists are experimenting with a new approach. "What's changed over the years is we introduce [species] into areas where they have never been before," said Philip Seddon an associate zoology professor at Otago University in New Zealand. "It's acknowledging that there are no pristine habitats, it's not feasible to have them locked away from people." The approach is called conservation translocation. Scientists move endangered species that are unable to shift their habitats on their own into new locations. That can mean moving species into areas closer to humans. Translocation is also used to correct an ecological void created by the extinction of another species, said Seddon, the lead author of a paper on translocation published in the journal Science last month. As temperatures and sea levels rise, endangered species are especially vulnerable to losing habitat. An estimated 20 to 30 percent of the world's species will be at risk for extinction if global temperatures rise 2 to 3 degrees Celsius above preindustrialized levels in the next century, according to a report by the Intergovernmental Panel on Climate Change (IPCC).
Earth sliding into ‘ecological debt’ earlier and earlier, campaigners warn -- Humans have used up the natural resources the world can supply in a year in less than eight months, campaigners have warned. The world has now reached “Earth overshoot day”, the point in the year when humans have exhausted supplies such as land, trees and fish and outstripped the planet’s annual capacity to absorb waste products including carbon dioxide. The problem is worsening, with the planet sliding into “ecological debt” earlier and earlier, so that the day on which the world has used up all the natural resources available for the year has shifted from early October in 2000 to August 19 in 2014. In 1961, humans used only around three-quarters of the capacity Earth has for generating food, timber, fish and absorbing greenhouse gases, with most countries having more resources than they consumed. But now 86% of the world’s population lives in countries where the demands made on nature - the nation’s “ecological footprint” - outstrip what that country’s resources can cope with. The Global Footprint Network, which calculates earth overshoot day, said it would currently take 1.5 Earths to produce the renewable natural resources needed to support human requirements.
I'd be happier if I didn't write this stuff! - For years my father--who is a really great guy--has been telling me that I'd be a happier person if I didn't write about all the converging threats bearing down on the human race. Turns out he's right! Here's what a new study said on the matter: Recent evidence suggests that a state of good mental health is associated with biased processing of information that supports a positively skewed view of the future. Depression, on the other hand, is associated with unbiased processing of such information. Let me translate: If you fool yourself about what you are really seeing in the world and convince yourself that it will lead to a good future for you and whomever else you care about, you'll maintain good mental health. If, on the other hand, you look reality squarely in the eye, you are more likely to get depressed. Life, as it turns out, isn't a bed of roses. Now, I would put the "positively skewed" person in the same category as turkeys. A farmer feeds this turkey every morning. Using inductive reasoning, the turkey becomes more and more convinced each day that the morning feedings will extend indefinitely. One day the farmer appears with an ax, demonstrating the weakness of inductive reasoning. It's easy to see that the turkey is happier up to the point of slaughter NOT knowing what is coming. (I'm assuming the turkey, in this case, would be powerless even with foreknowledge to prevent his own demise.) Not knowing, he is better adjusted to his surroundings, and he's not busily writing columns about the impending turkey slaughter that all turkeys should be aware of. This lack of knowledge certainly prevents stress and stress-related diseases, both mental and physical. One has to admit that the turkey has a good life (for a turkey) up to a certain point.
Dark Age America: A Bitter Legacy -- John Michael Greer -- Civilizations normally leave a damaged environment behind them when they fall, and ours shows every sign of following that wearily familiar pattern. Human technologies almost always start off their trajectory through time as environmental disasters looking for a spot marked X, which they inevitably find, and then have the rough edges knocked off them by centuries or millennia of bitter experience. When our species first developed the technologies that enabled hunting bands to take down big game animals, the result was mass slaughter and the extinction of entire species of megafauna, followed by famine and misery; rinse and repeat, and you get the exquisite ecological balance that most hunter-gatherer societies maintained in historic times. Any brand new mode of human subsistence is thus normally cruising for a bruising, and will get it in due time at the hands of the biosphere. That’s not precisely good news for modern industrial civilization, because ours is a brand new mode of human subsistence; it’s the first human society ever to depend almost entirely on extrasomatic energy—energy, that is, that doesn’t come from human or animal muscles fueled by food crops. In my book The Ecotechnic Future, I’ve suggested that industrial civilization is simply the first and most wasteful of a new mode of human society, the technic society. Eventually, I proposed, technic societies will achieve the same precise accommodation to ecological reality that hunter-gatherer societies worked out long ago, and agricultural societies have spent the last eight thousand years or so pursuing. Unfortunately, that doesn’t help us much just now.
China’s Actions to cut Carbon Emissions - China’s 12th five-year plan (2011-2015) announced a compulsory target of a 17% reduction of carbon emissions per GDP unit from a 2010 baseline. In addition, an energy consumption target called for cities all over China to take concrete measures to reduce their carbon footprint and improve energy efficiency. To steer such a transformation, city governors first need to be able to quantify the carbon emissions of their respective city in a measurable, consistent and verifiable manner. Such quantification can pave the way for implementing the necessary actions to achieve reductions and help to monitor their impact along the way. China is the place to make a big difference for climate change. Besides the fact that China is among the world’s largest carbon emitters, Chinese policy-makers have strong influencing power (and cash) for action on reduction. This can be seen in China’s stimulus plan to upgrade its infrastructures to a higher level of energy efficiency by 2015, investing €1,000 billion. It might be argued that variable scenarios will have to go into the development of China’s climate change policy, but it is almost certain that any policy will include a mechanism to measure carbon emissions accurately and in a way that is aligned with international standards. Indeed, China’s climate change policies could be the most progressive and they have the capacity to result in the most dramatic reductions in carbon emissions anywhere in the world.
Hopes for Algae Biodiesel are Fading | Big Picture Agriculture: For all of the hope surrounding algae biofuels, surrounding Craig Venter’s big algae project, and then, surrounding Sapphire – one of the last algae games left in town, we get news that Sapphire Energy’s CEO has been replaced. Some read this as a significant and negative sign. It would seem that we’ve been putting a lot of false hope into algae as a “sustainable” savior for liquid fuels. The requirements to grow it and to get it to produce oil are not so little as it turns out. Nor can living cells be manipulated to produce a lot without requiring a lot in return. A new emphasis may be emerging from fledgling algae start-ups, and that is to produce an Omega-3 oil human nutrient product instead of crude oil, something that might actually be a profitable venture. I’ve had a post on the back burner for a very long time, and this seems like a good time to run it. Captain T. A. “Ike” Kiefer wrote a paper titled “Twenty-First Century Snake Oil: Why the United States Should Reject Biofuels as Part of a Rational National Security Energy Strategy” in January 2013. The remainder of this post is the excerpt on algae for biodiesel, written by Kiefer and republished with his permission.
In Australia, Businesses Are Getting Hit With A $500 Fee Designed To Kill Solar Power -- The government of Queensland, Australia is just beginning to implement a new energy policy that changes the way businesses are charged for electricity, a policy that the solar industry says is designed to make sure businesses have no reason to install commercial-scale rooftop solar panels. According to a report in RenewEconomy, the policy reduces the price of actual energy consumption for businesses, but increases the price for energy service in general. That “service fee” has made it so businesses that were originally charged $42 dollars a day are now being charged $488 a day. With the area’s Goods and Services Tax, that amounts to a charge of $533 every day for electricity use. Prices on energy consumption have fallen to 10.4 cents per kilowatt hour from 11.6 center per kilowatt hour, the report said. This fee is “horrifying” members of the solar industry, the report said, because now businesses have no monetary incentive to lower their electricity consumption by installing solar panels or investing in energy efficiency machinery and lighting.
Tony Abbott's push to ditch renewables could hand coal and gas industry $10bn - Coal and gas generators will reap $10bn in extra profits over the next 15 years if the Abbott government pares back the renewable energy target (RET), and the nation’s electricity bills will not fall, according to new research. Coal and gas generators have been among the most vocal supporters of reducing the RET, which requires 41,000 gigawatt hours of power to be sourced from renewables by 2020, but the research by Jacobs found reducing the target would also be in those companies’ interest. Reducing the RET – one of the most likely options being considered by a review that is about to report to the government – would deliver $8bn in additional profits to coal generators and $2bn to gas generators. This would include $1.9bn for EnergyAustralia, which runs the Yallourn brown coal power stations in Victoria, $1.5 billion for Origin, owner of the huge Eraring black coal power station in NSW and $1 billion for AGL, which owns the brown coal Loy Yang A station in Victoria. AGL’s windfall would be much larger if it acquired Macquarie Generation. In that event AGL would gain by $2.7bn.
Japan may guarantee price for nuclear power to prop up industry (Reuters) - Japan will consider guaranteeing prices for electricity generated by nuclear plants to help the country's struggling utilities, which have lost about $35 billion in the three years since the Fukushima disaster saddled them with extra costs. Japan's nuclear plants are in shutdown with no schedule for restarts after the meltdown at Fukushima in 2011, leading the country's utilities to turn to expensive fossil fuel imports. But even if they can get their reactors running they face higher costs to meet new safety requirements just as the government is pushing through plans to allow more competition in the industry. They also face possible costs for decommissioning older units that are too costly to upgrade. The move was floated by a trade ministry panel as an example of supporting the nuclear industry financially like Britain's "Contracts for Difference" scheme, which guarantees nuclear operators fixed rates for power. The panel, which is in charge of making detailed policies in line with the government's basic energy plan, did not give a schedule for finalising the scheme. Propping up nuclear power, promoted for decades by Japan's ruling Liberal Democratic Party as cheap, safe and reliable, is likely to be at odds with public sentiment which has turned against atomic energy since Fukushima. If the market price of electricity falls below a pre-set level, consumers would pay the gap to the utilities
No One Wants You to Know How Bad Fukushima Might Still Be -- Last month, when the Tokyo Electric Power Company (TEPCO) announced it would move forward with its plan to construct an “ice wall” around the Fukushima Daiichi nuclear power plant’s failed reactors, it seemed like a step backwards. In June, the utility company in charge of decommissioning the plant—which was ravaged by a tsunami in March 2011—indicated that its initial attempt at installing a similar structure had flopped. Its pipes were apparently unable to freeze the ground, despite being filled with a -22°F chemical solution. Aside from TEPCO’s unwillingness to consider other engineering solutions, his main point of criticism about Japan’s largest utility company is rooted in one that countless others have voiced since the earthquake (and subsequent tsunami): a suspicious disregard for keeping the public informed. But it’s hard to give TEPCO the benefit of the doubt when misinformation, lying, and a sub-par approach to safety culture have been central to this quagmire since before the natural disasters. While it’s rarely constructive to point fingers in a time of crisis, it’s worth noting that TEPCO has been reprimanded by the Japanese government, international scientists, peace-keeping organizations, global media outlets, and both anti- and pro-nuclear advocates for its unwillingness to disclose key details at a time when they are desperately needed. Coupled with the unmitigated radiation still pouring into Pacific waters, this helps explain why a Japanese judicial panel announced in late July that it wants TEPCO executives to be indicted.
Oregon Rejects Key Permit for Coal Export Terminal -- The state of Oregon stood up to dirty coal exports today by denying a key dock-building permit. This denial is a major victory for residents and climate activists who have waged a huge, high-profile campaign against coal exports. Oregon’s decision today shows that our state leadership values clean air, our climate and healthy salmon runs. As American use of coal declines, the Pacific Northwest is threatened by industry trying to maintain profits by exporting the coal that is too dirty to burn here. At its peak, Oregon and Washington faced six coal export proposals. Three proposals were withdrawn by the companies and today’s decision marks the first time a Pacific Northwest state agency formally rejected a coal export permit. Two coal export terminals remain on the table in Washington and face intense public opposition, led by Power Past Coal, an alliance of health, environmental, businesses, clean-energy, faith and community groups working to stop coal export off the West Coast.
Proposed Coal Export Terminal In Oregon Suffers Major Setback - Oregon has dealt what could be a fatal blow to a proposal to build a coal export facility on the Columbia River, dismissing the plan by Australia-based Ambre Energy as “not consistent with the protection, conservation and best use of the state’s water resources.”The long-awaited decision was issued by Oregon’s Department of State Lands and blocks Ambre from building a dock in Boardman, OR to transfer coal mined from public lands in the Powder River Basin in Wyoming and Montana from coal trains to river barges. The agency denied Ambre’s request for what is known as a removal-fill permit for its proposed terminal at the Port of Morrow. The proposed export dock would have handled almost 9 million tons of coal a year. Barges would have carried the coal for loading onto ships at an existing facility further downstream in Clatskanie, OR. Ambre can appeal the decision but if it chooses to abandon the project there would be just two coal export terminal proposals still in the works in the Pacific Northwest, both in Washington state and both of which have attracted strong opposition. Though U.S. coal producers have been eyeing Asian markets as a way to buffer them from the steady decline in U.S. coal consumption resulting from competition from natural gas and renewables and environmental restraints, three other export projects in the northwest have fallen through. Opponents of building coal export facilities on the West Coast who have formed a broad coalition stretching from southeastern Montana through numerous small towns in the northern Plains to the Pacific hailed the decision by the Oregon agency.
Buy The Drip: Thousands Of Gallons Of Oil Spill Into Ohio River Upstream Of Cincinnati -- Lately it is not just trains blowing up across the country in the ongoing effort to prove just how safer rail transport is for crude oil transit compared to pipelines: as citizens of Cincinatti found out this morning, their drinking water may come with an added kick after thousands of gallons of diesel fuel spilled out onto the Ohio River after an incident at a power plant early Tuesday. According to WCPO, the Coast Guard said it estimated about 8,000 gallons of fuel spilled out from Duke Energy’s W.C. Beckjord power station outside of Cincinnati. The bad news for Ohians, especially those living in Cincinatti, is that the spill took place upstream, and rather close to the city: The spill was first reported at about 12:20 a.m. Tuesday. The plant is about 20 miles southeast but upstream of Cincinnati. Duke Energy later released a statement saying the spill happened at about 11:15 p.m. Monday. The company said the spill happened during a routine transfer of fuel oil. Duke estimated about 5,000 gallons was discharged into the river. Crews were able to stop the release by 11:30 p.m. Duke said it notified local, state and environmental agencies promptly to take action.
Duke Energy plant fuel spill: EPA says drinking water safe after diesel spilled into Ohio River - Story: – Cincinnati Mayor John Cranley said Tuesday the region's drinking water is safe despite thousands of gallons of diesel fuel spilling into the Ohio River late Monday.Tony Parrott, head of Greater Cincinnati Water Works, said the department was notified of the spill just after midnight. Parrott said crews shut down the Ohio River intakes quickly so the spill was not taken in. He said the fuel reached Water Works at about 7 a.m. Duke Energy officials expect the fuel to pass the region's intakes by late Tuesday night. This is the second time this year a foreign substance has invaded the Ohio River, causing local intakes to close. In January, a chemical leak from West Virginia made its way to the Tri-State. Greater Cincinnati Water Works officials identified that chemical as Crude MCHM, or 4-Methylcyclohexanemethanol. The U.S. Coast Guard is also still considering whether it will allow oil and gas companies to ship fracking waste on barges down the Ohio River and other rivers under its jurisdiction. Officials are mining through public comments from supporters who think barges are the most efficient way to move the chemical-and-sand-infused byproduct, and from opponents who fear the waste could spill into drinking water.
Mining Spill Near U.S. Border Closes 88 Schools, Leaves Thousands Of Mexicans Without Water - An acid spill from a large copper mine in northern Mexico is keeping 88 schools closed starting Monday due to uncertainty over the safety of drinking water. The 12-day-old spill, which sent 10 million gallons (40,000 cubic meters) of toxic wastewater into portions of the Bacanuchi and Sonora rivers, may keep schools closed for over a week according to the Associated Press. The Buenavista copper mine, one of the largest copper mines in the world, is located in Cananea, Sonora, about 25 miles south of the U.S. border near Nogales, Arizona. The mine is operated by Grupo Mexico, one of the world’s largest copper producers. Grupo Mexico’s American subsidiary, Asarco, is nearing a deal to gain full ownership of the Silver Bell copper mine across the U.S. border in Marana, Arizona and has been subject to major environmental misconduct charges in the past relating to its mining operations. Mine officials have been criticized for not reporting the massive acid spill to authorities for around 24 hours, with residents downstream detecting the spill the next day as it turned dozens of miles of river orange. According to Carlos Arias, director of civil defense for the northern state of Sonora, the spill was caused by defects in a new holding pond, where overflow from acids used to leach metal out of the crushed rock is stored. Arias said a pipe either blew out or lost its positioning on August 7th, sending the sulfuric acid downstream.
Fracking may be coming to the Chihuahua border, Mexican officials say - Mexico energy officials said Chihuahua and three other northern border states are ripe for fracking, a controversial and widespread method that is used to extract shale gas and oil from the ground. Pemex (Petroleos Mexicanos), the state-owned oil company, previously identified Tamaulipas, Coahuila and Nuevo Leon, in addition to Chihuahua, as the states where fracking could be used to obtain new energy sources. The other Mexican states officials identified are Puebla, Oaxaca and Veracruz. Mexican officials said Pemex has drilled nearly 30 exploratory wells along the border with Texas, near Ojinaga and Presidio. In Texas, fracking is taking place in the Eagle Ford oil field that straddles the border with Mexico. According to the Texas Railroad Commission, the oil and shale gas field is about 50 miles wide and 400 miles long and has an average thickness of 250 feet. Critics say the process requires huge amounts of water and may be linked to spikes in small earthquakes.
The Fracking Media Circus - A new study from Stanford University scientists finds no direct evidence of water contamination from hydraulic fracturing in Wyoming, but points out concerns that some fracking is being undertaken at very shallow depths, and sometimes through underground sources of drinking water.As generally happens with independent studies—or any ‘significant’ body of literature from the beginning of time—those with black and white polarization tendencies, espoused through the media, can skew the study to one or the other side of the fracking debate, which has taken on circus-like proportions, much like the climate change debate. Most recently, Colorado state senator Randy Baumgardner, a Republican, told media that based on his knowledge obtained from “a lot of fracking seminars”, methane gas—a potent, highly flammable greenhouse gas released during fracking operations—did not pose a risk to water supplies, as proven by its ancient use by Native American Indians. “They talk about methane in the water and this, that, and the other,” Baumgardner was quoted as saying, “but if you go back in history and look at how the Indians traveled, they traveled to the burning waters. And that was methane in the waters and that was for warmth in the wintertime. So a lot of people, if they just trace back the history, they’ll know how a lot of this is propaganda.” At the same time, environmental watchdogs are hitting back with reports that energy companies are illicitly using thousands of gallons of diesel in fracking processes, skipping the federally required permit process.
Potential oil window is last gasp for Utica Shale - Jim McKinney, senior vice president and general manager from EnerVest, a Houston-based company, said his company believes that with changes in drilling techniques, activity will increase in the oil-rich northern part of the Utica Shale, which includes Trumbull County. “When companies first drilled, they were using the same techniques they were using in the dry- and wet-gas areas of the Utica,” he said. EnerVest has found in Tuscarawas and Guernsey counties that by using more water and sand in the fracking process, there can be success in the oil-rich portions of the Utica, McKinney said. “Oil has different molecules than gas,” he said. Companies were using 200 feet to 250 feet spacing between injections, but for the oil area it needs to be shorter, about 150 feet, McKinney said. “It allows the oil to move more freely toward the well bore,” he said. If the tests for EnerVest are successful, there will be companies interested in leasing land in Trumbull and Stark counties, McKinney said. Trumbull and Stark counties are thought to be areas with oil-rich shale. The sections of the Utica can be divided into the dry-gas area, which is located around Belmont, Harrison and other counties in the southeast part of the state. Then there is the wet-gas area, which includes Carroll County and the sections of Ohio where most of the drilling activity has taken place. Finally, there is expected oil-rich section on the edge of the shale, which no company has successfully exploited at this time.
Study: Ohio could add 16000 jobs, $2.68 billion to the state economy - An update on lawmaker action and other activities at the Ohio Statehouse related to horizontal hydraulic fracturing:
- • New Study: A report by ICT International and EnSys Energy and touted by the American Petroleum Institute projected that Ohio could add nearly 16,000 jobs and $2.68 billion to the state economy by 2020 “if restrictions on U.S. crude exports were lifted.” “Restrictions on exports only limit our potential as a global energy superpower,”
- • State Land Frack Plan: A Democratic state lawmaker reiterated his calls for an investigation of Gov. John Kasich’s administration after public records revealed meetings to develop a marketing plan for horizontal drilling on state-owned lands continued after officials said they had abandoned the idea.
- • Not Enough: Policy Matters Ohio, a liberal think tank, released a report showing that a plan to reform the state’s tax rates on horizontal drilling would reduce related collections by millions of dollars. HB 375 passed the Ohio House but was not moved in the Senate before lawmakers broke for their summer recess.
- • Frack Penalty Bill Stalled: The severance-tax legislation wasn’t the only oil and gas-related bill to stall.
Lawmakers also have not yet acted on HB 490, which would expand the Ohio Department of Natural Resources’ authority to revoke or suspend drilling and related activities of those who break the state’s environmental regulations.
Protest dismissed, but no drilling in Wayne anyway -- The U.S. Department of the Interior has dismissed a protest against oil and gas drilling in the Wayne National Forrest but also has decided against allowing any such drilling. In 2011, five parcels within the Wayne were listed in a Competitive Lease Sale Notice, drawing 34 letters of protest against the inclusion of this land in lease sales for potential drilling. A month later in 2011, the U.S. Forest Service asked the Bureau of Land Management, within the Department of the Interior, to withdraw those parcels, and just days after that, they were deleted from the sale. This history of events was not relayed to various Athens County officials and area anti-fracking protesters until a letter from the BLM dated July 21, 2014 and noted as received by the city of Athens on Aug. 1. The letter explains that the protest of the leasing of these parcels has been dismissed as moot because the parcels in question were deleted from the sale. "There is no other decision that can be provided," the letter states. Potential leasing of land for drilling in the Wayne National Forrest was opposed by Athens city and county officials, anti-fracking activists, and Ohio University, where President Roderick McDavis sent a letter saying that OU was "unable to support a practice that is not strictly regulated and highly accountable."
Ohio Oil and Gas Energy Education Program for teacher training avoids Radio Disney dustup - Interest in an oil and gas industry-funded program for teachers keeps growing. As Ohio’s Utica shale fuels unprecedented oil and gas drilling in the state, more Ohio teachers are interested in a workshop put on by the organization funded by the state’s oil and natural gas companies. But with the fracking-fueled industry’s growth comes increasing opposition from people worried about the industry’s impact on the environment. The group, the Ohio Oil and Gas Energy Education Program, came under fire earlier this year for its affiliation with Radio Disney. Critics accused OOGEEP of trying to indoctrinate kids with pro-drilling propaganda. But the group’s leader says she’s not had similar pushback with the teachers’ workshop. “There’s no propaganda,” Executive Director Rhonda Reda told me. “They have to learn about porosity and permeability, period. They have to learn about geology, period. These are things that are required.”
Brine firm sues over biblical fracking billboard - (AP) - An Ohio man who uses a biblical reference and a statement against "poisoned waters" on billboards opposing wells for disposal of gas-drilling wastewater is fighting a legal threat from the Texas well owner on free-speech grounds. Austin, Texas-based Buckeye Brine alleges in a July lawsuit that the billboards paid for by Michael Boals, of Coshocton in eastern Ohio, contain false and defamatory attacks against its two wells, which dispose of contaminated wastewater from oil and gas drilling. The complaint by the company and Rodney Adams, who owns the land and operates the well site, contends the wells are safe, legal and meet all state safety standards. The parties object to statements on two billboards along U.S. Route 36, including one that "DEATH may come." "The accusation that the wells will cause 'DEATH' is a baseless and malicious attempt to damage the reputations of the plaintiffs," according to the complaint. "The billboards are also defamatory because they state or imply that Mr. Adams and Buckeye Brine are causing 'poisoned waters' to enter the drinking water supply."
Austin fracking disposal firm calls Ohio billboards defamatory --An Austin-based company that disposes of contaminated wastewater associated with fracking is suing an Ohio man who posted billboards decrying the disposal operations there. Buckeye Brine sued Mike Boals in late July after he erected signs in Ohio that said the disposal operation “contaminates and destroys” the water supply. The defamation suit was filed in Coshocton County, in eastern Ohio. Boals says the suit is an attempt to bully him. One billboard says Coshocton is “Home To: waste Injection Wells (You Just passed them). They pump POISONED WATERS under the feet of America’s Citizens.” Another quotes Biblical scripture, about waters being “made bitter.” Neither billboard mentions Buckeye Brine by name, but one does name Rodney Adams, the company’s site supervisor for the wells. When oil and gas are extracted through underground drilling, large amounts of fluids, or brine, are brought to the surface, according to the suit. The suit says the brine is harmful to the environment only if it is discharged into lakes or rivers or onto land. The suit says Buckeye Brine injects brine deep enough underground to trap it under thousands of feet of rock. The suits says that since the wells went into operation two years ago they have been routinely inspected by state officials and “there have been no findings of environmental harm whatsoever, much less any contamination of underground freshwater.”
'Poisoned waters' billboard sparks Ohio well fight: – An Ohio man who uses a biblical reference and a statement against "poisoned waters" on billboards opposing a local deep-injection gas well is fighting a legal threat from the Texas well owner on free-speech grounds. Austin, Texas-based Buckeye Brine alleges in a July lawsuit that the billboards paid for by Michael Boals, of Coshocton, contain false and defamatory attacks against its two wells, which dispose of contaminated wastewater from oil and gas drilling. The complaint by the company and Rodney Adams, who owns the land and operates the well site, contends the Coshocton well is safe, legal and meets all state safety standards. The parties object to statements on two billboards along U.S. Route 36, including one that "DEATH may come." "The accusation that the wells will cause 'DEATH' is a baseless and malicious attempt to damage the reputations of the plaintiffs," according to the complaint. "The billboards are also defamatory because they state or imply that Mr. Adams and Buckeye Brine are causing 'poisoned waters' to enter the drinking water supply." Shale oil and gas drilling employing hydraulic fracturing, or fracking, produces millions of gallons of chemical-laced wastewater. The liquid, called brine, is a mix of chemicals, saltwater, naturally occurring radiation and mud. It's considered unsafe for ground water and aquifers, so Ohio regulations require waste liquid to be contained and injected deep underground.
Critics: Ohio case fits wider pattern of quieting fracking foes -- A lawsuit filed by an Ohio company last month seeks to remove two anti-fracking billboards near a wastewater site it operates. While the case is a test of free speech, critics say it also reflects a broader reluctance for businesses and regulatory agencies in the state to adequately inform citizens about shale gas activities and address their concerns. Ohio’s regulatory environment is allowing rapid expansion of the shale gas industry. The state’s natural gas production nearly doubled from 2012 to 2013. And shale wastewater injection for 2013 was up more than 2 million barrels from the previous year. Critics say the system fast-tracks permits for activities related to shale gas at the expense of public comment and citizen input. Growth in the industry is “happening in a way that communities are not necessarily always well-informed,” said Megan Lovett, a lawyer with Fair Shake Environmental Legal Services in Pittsburgh. Lovett believes that situation makes it even more important to defend concerned citizens’ right to speak out. Her firm is currently consulting with defense counsel in the Ohio lawsuit.
Environmentalists split over green group's fracking industry ties - In 2012, when Ohio’s Senate passed a controversial hydraulic fracturing bill that was supported by the oil and gas industry, environmental groups lined up against it, saying it would endanger public health. But during hearings on the bill, it gained one seemingly unlikely supporter: the Environmental Defense Fund (EDF), one of the nation’s largest green groups. The bill supported renewable energy development but it also contained several items other environmental groups said were giveaways to the industry: It allowed fracking companies to keep private the chemicals they used in fracking, changed the required distance for contamination testing around a well from 300 feet to 1,500 feet, and prevented doctors from sharing information that might be considered trade secrets, even if it was in the interest of public health. But a new report suggests that at least in some cases, environmental organizations’ work with the industry may cross ethical lines, and at worst become tacit support of industry-backed positions. The new report, released by Buffalo-based non-profit Public Accountability Initiative, focuses on one group called the Center for Sustainable Shale Development, which is a partnership between gas drilling companies, environmental groups and other nonprofits. Among the report’s findings: the group’s executive director, Susan Packard LeGros, is a former oil industry lawyer who worked with oil, gas and chemical companies. One of the group’s board members, Jared Cohon, also worked at a similar group called the Center for Indoor Air Research, which was found to have strong ties to tobacco companies. And one of the group’s new supporters, the Claude Worthington Benedum Foundation, was started by a titan of the oil and gas industry.
Environmental Defense Frauds Back Boehner Parrot -- The Rent-a-Green Environmental Defense Frauds who brought us the Sustainable Shale Shamstitute, are now running industry funded green-washing campaign ads in favor pseudo pro-environmental Republicans, including Boehner Parrot Chris Gibson. The EDF gets donations from the frackers, then run ads in favor of pro-fracking Congressman – that’s how green-washing works. As even a casual political observer knows, the era of the moderate Republican is over, especially in the House of Representatives. The Republican House has made a fetish of attacking the environment. It has passed innumerable bills to strip the EPA of its authority and funding and to handicap the regulatory process. And so it was bewildering on Thursday when the Environmental Defense Action Fund (EDF Action), the Environmental Defense Fund’s campaign arm, began dropping $250,000 on ads supporting Rep. Chris Gibson, a Republican from upstate New York who is facing a self-financing Democratic challenger, Sean Eldridge. (Eldridge is the husband of Facebook cofounder andNew Republic publisher Chris Hughes.) This is just the beginning of EDF Action’s efforts to help elect Republicans. As Politico notes, “The Environmental Defense Action Fund is rolling out a seven-figure ad campaign to aid green-minded Republicans in the midterm elections, part of a longer-term effort to find GOP partners on priorities like climate change. … The group hasn’t publicly identified other Republicans it plans to support in its 2014 effort, which it says is worth around $1 million so far.”
FEMA halts flood assistance for properties with gas leases - — In fall 2011, about a month after the flooded Meshoppen Creek spilled over its banks and into their basement, Pete and Sharon Morgan applied for federal flood assistance to help them move out of their home. They won’t get it, at least not anytime soon, due to a little-known policy the Federal Emergency Management Agency issued May 5. It’s because of their gas lease with Chief Oil & Gas LLC. FEMA indefinitely banned the use of hazard mitigation assistance money for properties that could eventually host horizontal drilling and hydraulic fracturing, even if the leases don’t allow for development on the surface. Under its hazard mitigation assistance program, FEMA pays to acquire properties in flood zones or reduce flood risks by raising or relocating structures. The agency creates these incentives so it doesn’t have to return with disaster dollars after every flood event. The property title usually goes to local governments, which can use it as open space, allowing floodplains or wetlands to act as natural flood buffers. The Morgans are one of eight households in Pennsylvania — five in Wyoming County and three in Lycoming County, according to the state Emergency Management Agency — whose applications for hazard mitigation assistance won’t yield payouts because of their gas leases.
Doctors Outraged By Claims That Health Officials Ignored Residents Sickened By Drilling - Pennsylvania doctors, nurses, and health policy experts are calling for a statewide investigation into claims that the state Department of Health has a policy of telling its employees never to talk to residents who complain of negative health effects from fracking, according to letter sent to state Gov. Tom Corbett and other elected officials on Tuesday. The letter — spearheaded by the groups Physicians for Social Responsibility, Alliance of Nurses for Health Environments, and PennEnvironment Research & Policy Center, and signed by more than 400 individual health professionals — says doctors and nurses statewide are “very concerned” about a story published in NPR’s StateImpact Pennsylvania this June. In that story, two retired employees of the health department said they were instructed not to return phone calls from citizens who said they may be experiencing sickness from fracking and other natural gas development. The letter calls for an independent investigation into the claims, and reform of the health department’s response procedures. “When it comes to fracking, the DOH has done little to prevent exposure or lead policy development,” “The PA DOH does not provide accurate data to address the health needs of fracking communities, thereby hindering research, and permitting poor decisions to be made based on inaccurate information.” According to the groups’ letter, the DOH has not done enough since StateImpact’s revelations that the agency may be mishandling citizen complaints.
Fracking could threaten air quality, workers' health, latest report says - Maryland’s latest report on the impact of proposed natural gas exploration in the western part of the state said drilling could pose a threat to air quality and workers in a region that is ecologically pristine.But the report, presented to a state commission Monday, said the process called hydraulic fracturing would pose little threat of earthquakes, which were triggered recently in central Oklahoma by gas-drilling operations, according to researchers, and are of concern to environmentalists.The report is the second of three called for under Gov. Martin O’Malley’s 2011 executive order to study hydraulic fracturing, an unconventional horizontal drilling process also referred to as fracking. O’Malley (D) said studies of drilling impacts were required before a natural gas well could be built in Maryland. A third and final study funded by the Natural Resources and Environment departments is expected soon. Several oil and gas companies have sought drilling permits and leased private land in hopes of exploring natural gas opportunities in remote Garrett County, home to the popular Deep Creek Lake. Their aim is to build wells in the Marcellus Shale, a 95,000-square-mile rock formation that stretches from Ohio to Virginia, where gas has been entombed for about 380 million years.
How Fracking In Maryland Would Threaten The Health Of Anyone Who Breathes Nearby - Fracking in Maryland would pose a risk of harmful air pollution and would bring jobs that could be dangerous for workers, a new report has found. The report, published by the University of Maryland and commissioned by a 2011 executive order by Gov. Martin O’Malley, looked at the risks that fracking would bring to Maryland, a state that so far doesn’t have any natural gas wells. The report ranked the likelihood that several risks associated with fracking, including dangers to air quality and occupational health as well as the prospect of worsening noise and the threat of earthquakes, will pose problems in Maryland. The report is the second of three reports on fracking in the state, with the third, which will be funded by the Department of the Environment and the Department of Natural Resources, expected soon. The reports are part of Gov. O’Malley’s Marcellus Shale Safe Drilling Initiative, which aims to uncover the costs and benefits natural gas drilling would bring to Maryland. The report singled out worker health a concern for the prospect of fracking in Maryland. Though fracking would bring jobs to Maryland, the report reads, those jobs are more dangerous than others, promising a “greater risk of harmful occupational exposures than many other industries in Maryland.” “Of particular concern are exposures to crystalline silica, hydrogen sulfide, and diesel particulate matter, as well as fatalities from truck accidents, which accounted for 49% of oil and gas extraction fatalities in 2012,” the report reads. It goes on to cite the social dangers the fracking industry poses, including “mental distress, suicide, stress, and substance abuse.”
Fracking Fluids More Toxic Than Previously Thought - A new study of the fluids used in the controversial practice of hydraulic fracturing, or fracking, shows that several of them may not be as safe as the energy industry says they are, and some are downright toxic. A team of researchers at the Lawrence Berkeley National Laboratory and University of the Pacific looked at more than just the process of fracking – which involves injecting water mixed with chemicals into underground rock formations to extract gas and crude oil. In their report, the researchers list the chemicals that are most often used, based on industry reports and databases. Among them were “gelling agents to thicken the fluids, biocides to keep microbes from growing, sand to prop open tiny cracks in the rocks and compounds to prevent pipe corrosion.” The story so far has been that fracking is an environmentally safe way to extract oil and gas from underground deposits trapped in shale. Yet fracking has also been met with opposition because of reports of contaminated well water and increased air pollution around drilling sites. Further, the injection of wastewater into disposal wells at fracking sites has been linked to earthquakes. Stringfellow’s team found that fracking fluid is, in fact, mixed with plenty of food-grade and other non-toxic materials, but some of them may not be safe. At the recent 248th National Meeting & Exposition of the American Chemical Society (ACS), the team reported that eight of the compounds are toxic to mammals. “There are a number of chemicals, like corrosion inhibitors and biocides in particular, that are being used in reasonably high concentrations that potentially could have adverse effects,” Stringfellow said. “Biocides, for example, are designed to kill bacteria. It’s not a benign material.”
Study Finds 8 Fracking Chemicals Toxic to Humans -- Fracking is once again in trouble. Scientists have found that what gets pumped into hydrocarbon-rich rock as part of the hydraulic fracture technique to release gas and oil trapped in underground reservoirs may not be entirely healthy. Environmental engineer William Stringfellow and colleagues at Lawrence Berkeley National Laboratory told the American Chemical Society meeting in San Francisco that they scoured databases and reports to compile a list of the chemicals commonly used in fracking.Such additives, which are necessary for the extraction process, include: acids to dissolve minerals and open up cracks in the rock; biocides to kill bacteria and prevent corrosion; gels and other agents to keep the fluid at the right level of viscosity at different temperatures; substances to prevent clays from swelling or shifting; distillates to reduce friction; acids to limit the precipitation of metal oxides. Some of these compounds—for example, common salt, acetic acid and sodium carbonate—are routinely used in households worldwide. But the researchers assembled a list of 190 of them, and considered their properties. For around one-third of them, there was very little data about health risks, and eight of them were toxic to mammals.
At Least 10 Percent Of Fracking Fluid Is Toxic -- At least 10 percent of the contents of fracking fluid injected into the earth is toxic. For another third we have no idea. And that’s only from the list of chemicals the fracking industry provided voluntarily. That’s according to an analysis by William Stringfellow of Lawrence Berkley National Laboratory, reported in Chemistry World. Hydraulic fracturing, or fracking, is the practice of injecting fluid at high pressure into the earth, which breaks up oil- and gas-filled rock formations that is then extracted to the surface. The contents and makeup of that fluid have been a subject of controversy, largely because drilling companies are able to keep what’s in it a secret, and because the fluid has been known to leak and spill on a regular basis. Stringfellow mostly used FracFocus’ voluntary registry of 250 fracking chemicals provided by the industry to check against existing toxicology information. He found that about 10 percent of the chemicals are known to be hazardous “in terms of mammalian or aquatic toxicology,” Stringfellow said at the a meeting of the American Chemical Society. But for almost a third of those 250 chemicals, there’s no publicly available information on their toxicity to humans or other life. And that’s not even counting the chemicals that the industry can simply choose to keep a secret. FracFocus was in the news last week when drilling companies came under scrutiny for injecting diesel fuel into the earth to frack oil and gas, something for which they are supposed to have a permit. When that came to light, many companies simply went back and removed past mentions of injecting diesel.
Texas Judge Throws Out Family’s Lawsuit That Blames Nosebleeds, Asthma On Fracking Fumes -- A Texas family claiming they were severely sickened by air pollution from two companies’ hydraulic fracturing operations near their home had their lawsuit against the companies thrown out last week, in the second high-profile decision to come down this year alleging sickness from fracking operations in the state.In a ruling reported by Inside Climate News, District Judge Stella Saxon agreed with Marathon Oil Corp. and Plains Exploration & Production that Mike and Myra Cerny did not have enough scientific or medical proof that emissions of benzene, methane, and 14 other chemicals alleged to be contaminating their air were causing their myriad health problems, which included frequent nosebleeds, bone pain, and rashes. The Cernys’ home sits atop the Eagle Ford Shale in Karnes County, Texas.The ruling comes just a few months after a different family won $2.95 million in a separate Texas court on a lawsuit with similar claims. In that case, a jury decided that fracking operations near Bob and Lisa Parr’s home, located atop the Barnett Shale in Allison, Texas, were responsible for symptoms such as chronic nose bleeding, irregular heartbeat, muscle spasms, and open sores.
Oklahoma Gets Hit With 20 Earthquakes In One Day - Oklahoma’s Geology Survey recorded an unprecedented 20 small earthquakes across the state on Tuesday, highlighting the dramatic increase of seismic activity that has occurred there as the controversial process of hydraulic fracturing — otherwise known as fracking — has spread across the state. Though 18 out of the 20 earthquakes that occurred Tuesday were below Magnitude 3, rendering them mostly imperceptible, the largest one registered as a 4.3 near Guthrie, a city of more than 10,000 residents. And while U.S. Geological Survey scientists have said that Oklahoma is historically known as “earthquake country,” they also warn that quakes have been steadily on the rise; from 1978 until 2008, the average rate of earthquakes registering a magnitude of 3.0 or more was only two per year. “No documented cases of induced seismicity have ever come close to the current earthquake rates or the area over which the earthquakes are occurring,” the Oklahoma Geology Survey said in a recent presentation addressing the alarming increase in quakes. By “induced seismicity,” the OGS is referring to minor earthquakes that are caused by human activity, whether that be fracking, mass removal mining, reservoir impoundment, or geothermal production — anything that could disrupt existing fault lines.
Earthquakes near deep-earth wells raise concerns - — A series of small but unusual earthquakes near a well being pumped full of liquid drilling waste north of Denver has reignited a debate about the impacts of oil and gas development near homes.Colorado isn't normally earthquake territory, but aggressive drilling and pumping here and across the country may be changing that, contributing to the debate about what costs we're willing to bear to achieve energy independence. "What we have seen since about 2009 has been a steady increase of the rate of earthquake activity in parts of the country that normally are seismically quiet," said Bill Ellsworth, a seismologist with the United States Geological Survey. "This is something very anomalous and we have no natural analogue of what's going on in the rest of the world." The rise of small quakes, most too small to be felt, appears to mirror the country's booming petroleum production. Oklahoma and Texas have both seen unusual "swarms" of quakes that scientists say appear to be linked to oil production efforts, even though most experts are reluctant to draw direct connections.
Despite Compromise, Colorado’s Fracking Fight Rages On — An 11th-hour compromise brokered by Colorado Gov. John Hickenlooper (D) to keep contentious oil and gas measures off the November election ballot may simply delay the day of reckoning for both sides in the battle over how tightly the booming industry is regulated. That epic battle, pitting the oil and gas industry and Colorado’s mainstream political establishment against activists concerned that drilling and fracking have gotten out of hand in Colorado, had been building for months, with the airwaves awash in pro-industry advertising seeking to characterize the industry as benign and economically valuable. One prominent pollster predicted that industry spending on the issue through the November election would be in the range of $30 to $40 million, three times what oil and gas interests spent to defeat a 2008 ballot question that would have raised their taxes. But the electoral clash was averted as Hickenlooper and ballot question backer Rep. Jared Polis (D) declared a truce. Key to the deal is the appointment of an 18-member commission — expected to be named as early as this week — that will have the delicate task of recommending to the legislature ways to resolve conflicts between the oil and gas industry and citizens increasingly alarmed by energy development close to their homes and communities. But any consensus recommendations that emerge from the commission — composed of six representatives each of the industry, civic leaders, and people directly affected by oil and gas development — will have to be approved by what is likely to be a deeply divided state legislature.
Commentary: BLM selling out ranchers to make way for Big Oil?: Rangeland health, drought, wild horse management and oil exploration are interconnected and inter-dependent on water in Northeastern Nevada, as well as other regions of the U.S. With varying allotments budgeted by BLM, I have grave concerns during these drought times for BLM’ s priorities. Are our permitted grazing allotments being tagged as potential oil exploration allotments? Is BLM seeing $$$ signs for the oil and gas competitive lease sales? Currently competitive BLM lease sales numbered 44 parcels in Elko County and 102 parcels or 174,021.36 acres in Battle Mountain. How many oil exploration allotments will compromise current grazing allotments and natural habitat for sage grouse? From Sunset Magazine, April 2014: “In the Monterrey Shale assessment, the BLM auctioned their mineral rights to Vintage Production California, a subsidiary of Occidental Petroleum.” There is not enough water for the ranchers or the wine growers in the area so where is their priority of water placed? Since quantities of water are needed for both grazing allotments and oil exploration allotments, I wonder if pushing cattle off allotments clears the way for better lease sales to oil companies who will need large quantities of water? They certainly are not going to fence the grazing allotments to keep cattle off their roads. I am told that there is multiple use for our federal lands and that grazing and oil exploration can happen side by side. Sure they can if there is enough water for both and the oil trucks won’ t run down the cattle.
Michigan landfill taking other states' radioactive fracking waste -- As other states ban landfills from accepting low-level radioactive waste, up to 36 tons of the sludge already rejected by two other states was slated to arrive in Michigan late last week. Wayne Disposal landfill located between Willow Run Airport and I-94 near Belleville is one of the few landfills in the eastern and Midwestern U.S. licensed to accept the radioactive waste, which has been collected by a Pennsylvania hydraulic fracking operation. As regulations tighten in other states, companies are turning to Michigan as the radioactive sludge’s dumping ground. It was unclear Monday whether the waste had arrived and multiple messages seeking comment from Wayne landfill officials were not returned. State environmental regulators were not involved with the delivery but said that the companies appeared to be following carefully prescribed regulations. Though the radiation is considered low-level and the landfill licensed by the state to handle it, nearby residents and environmentalists still worry over its potential to leak into rivers, lakes or groundwater over long periods of time.
Michigan Is Taking The Radioactive Fracking Waste That Other States Rejected - Michigan is accepting the radioactive fracking waste that other states’ regulations prevent them from keeping. Up to 36 tons of low-level radioactive waste from fracking operations in Pennsylvania were scheduled to arrive in Michigan last week. The waste was collected from Range Resources drilling operations, and the waste was already rejected by a landfill in Pennsylvania due to its radiation content. It was then slated to go to a landfill in West Virginia, a state that used to be able to accept unlimited amounts of radioactive fracking waste in its landfills, but the waste wasn’t accepted there either, since West Virginia is in the process of strengthening its rules on radioactive waste disposal. Pennsylvania landfills have had radiation detectors since 2002, and Ohio has also strengthened its regulations on the acceptance of radioactive fracking waste. That leaves Michigan, a state that doesn’t have strict rules on radioactive fracking waste, and whose Wayne Disposal landfill got the state’s Departnment of Environmental Quality’s approval to accept radioactive fracking waste in 2006. According to Range Resources, the waste that’s slated to arrive in Wayne Disposal has has shown radioactivity levels of somewhere between 40 and 260 microrems per hour, and that the radioactivity is not detectable a few feet away from the waste. The Detroit Free Press notes that, according to the EPA, continued exposure to radiation of up to 100 microrems over a period of months can result in “changes in blood chemistry, nausea, fatigue, vomiting, hair loss, diarrhea and bleeding.” “This is basically a load of sludge that came from storage tanks that were cleaned out and had accumulated over time,” “It comes from the water used in hydraulic fracturing, and when it’s stored, the solids tend to sink to the bottom and become a sludge.”
EDITORIAL: Override of fracking veto responsible choice: New Jersey’s reputation as a dump preceded Gov. Chris Christie, but he isn’t helping matters. Christie’s administration has long brushed off concerns about landfill emissions and contaminated soil. Now he’s telling us we don’t have to worry about the radioactive waste that’s produced when energy companies pour a toxic mix of chemicals, sand and water deep into the ground in order to fracture the shale and extract natural gas. Although New Jersey isn’t sitting on enough natural gas to make it worthwhile for energy companies to try to extract it at this time, Pennsylvania has more than 6,000 active fracking wells — many in the northeastern part of the state. Most of Pennsylvania’s wastewater has been disposed of in Ohio, but environmentalists there have sought tighter regulations after a pair of earthquakes believed linked to the wells that are used to dispose of fracking waste. Last week, up to 36 tons of waste was set to arrive at a Michigan landfill after being rejected by Pennsylvania and West Virginia. Given New Jersey’s efforts to shake off its bad reputation, the state should be the first to refuse to be the dumping ground for another state’s radioactive refuse. But this month Christie vetoed a bill that would prohibit fracking waste from being dumped here, arguing that such a ban would violate the U.S. Constitution’s Interstate Commerce Clause. That’s just not true. The Office of Legislative Services, a nonpartisan panel, said as much in its analysis of the ban: “It imposes the same restrictions on interstate and intrastate businesses, and the burden on commerce is incidental in relation to the putative local benefits if the legislation were enacted into law.”
Fracking the Arctic -- For hundreds—if not thousands—of years, the Mountain Dene people have been traveling upstream to salt licks that draw caribou, moose and mountain sheep down from the high country in the early fall. For the Dene, it’s the best opportunity to stock up on wild game, fish and berries for the long winter.Many Dene people living in Sahtu and in other parts of the Canadian North are concerned that this way of life may be at risk now that two energy companies have been given the go-ahead to begin horizontal fracking in a region just south of the Arctic Circle. Conoco-Phillips has already fracked two test wells in the Sahtu, and the company has plans to frack several more in the future. With several other companies ready with plans of their own, the stakes are high. No one knows yet exactly how much shale oil and gas there is in the Yukon, Northwest Territories and territory of Nunavut. But the government of the Northwest Territories estimates that the Canol Shale underground deposit, which extends from the mountains along the Yukon border several hundred miles east towards Colville and Great Bear lakes, contains 2 to 3 billion barrels of recoverable oil, as much or more than in the highly productive Bakken formation in North Dakota.
Shale gas in Argentina: Dead-cow bounce - Economist -- Argentina boasts the world’s second-biggest shale-gas reserves, most of them in Vaca Muerta. A survey by the US Energy Information Administration (EIA) suggests that the field holds 16.2 billion barrels of shale oil and 308 trillion cubic feet (TCF) of shale gas. That is more shale oil than Mexico and more shale gas than Brazil. It is enough to satisfy Argentina’s current energy demand for over 150 years, and could make the country an exporter once again. Neuquén is readying itself for a boom. Shopping centres have sprung up; so have clean new hotels that boast English-speaking staff and American-style food. Horacio Quiroga, the city’s mayor, compares its residents to expectant diners who have tied on their bibs. Argentina’s president, Cristina Fernández de Kirchner, is equally hopeful. “I shall no longer call [it] Vaca Muerta,” she said last year. “I shall call it Vaca Viva (‘Living Cow’).” But there are several catches. The EIA can be wrong: it has downgraded its estimates for Chaco-Paraná, another Argentine basin, from 164 TCF to 3 TCF. But initial trials at Vaca Muerta have been encouraging. In May Exxon Mobil announced that 770 barrels a day had begun to flow from an exploratory well there. Chevron and YPF, Argentina’s state oil firm, have formed a $1.4 billion joint venture to develop a concession which currently produces 24,000 barrels of oil equivalent a day. Vaca Muerta’s geology helps. Its shale is thicker than in most formations, which means that companies can produce more from a single site. As firms become familiar with the field, budgets are already dropping: YPF says it has reduced costs from $11m per well in 2011 to $7.5m.
Gazprom says Ukraine's unpaid gas bill tops $5 billion - (Reuters) - Russian natural gas exporter Gazprom said on Thursday that Ukraine's outstanding debt for gas supplies stood at $5.3 billion (3.2 billion pounds) as of Aug. 1 and called on Kiev to ensure that gas continues to transit without disruption to Europe. "Gazprom counts on Naftogaz of Ukraine to stick to its obligations on redemptions of arrears for the supplied gas and provision of smooth gas transit via Ukraine's territory," Gazprom spokesman Sergei Kupriyanov said. Russia cut off gas supplies to Ukraine on June 16 in a dispute over unpaid bills. However, Russian gas shipments to Europe via Ukraine have flowed without
Ukraine’s Next Crisis? Economic Disaster - Ukraine’s next crisis will be a devastatingly economic one, as violent conflict destroys critical infrastructure in the east and brings key industry to a halt, furthering weakening the energy sector by crippling coal-based electricity production.The Ukrainian military’s showdown with separatists in the industrial east has forced coal mines to severely cut production or close down entirely. This has led to an electricity crisis that can only be staunched by cutting domestic production along with exports to Europe, Crimea, and Belarus — or worse, getting more imports from Russia. In the coal centers of Ukraine’s industrial east—Luhansk and Donetsk—fighting has forced the full closure of an estimated 50 percent of coal mines, while overall coal production has fallen 22 percent over the same period last year. Key industry sources say they will potentially run out of coal in less than three weeks.For Ukraine, the second largest producer of coal in Europe, this will have a devastating impact on the energy sector, which is in a state of emergency, unable to get coal to thermal power plants that provide some 40 percent of the entire country’s electricity. In the wider energy picture, the halt of coal production sets Ukraine back a decade. The plan was to rely more on coal in order to reduce dependence on Russian natural gas. But the new reality has insiders wondering how Ukraine will produce more of its own natural gas, after the implementation earlier this month of an amended tax code that targets private gas producers with a tax so high that they will significantly reduce production through the end of the year and beyond that is anyone’s guess.
The Big Contradiction: American Bombs Dropping On Extremist Group Funded By U.S. Allies - President Barack Obama recently announced that he authorized the United States military to begin bombing the Islamic State of Iraq and Syria (ISIS) in Iraq, where the radical Islamist group has taken over large swathes of territory. But what Obama didn’t mention in his speeches on why he began military operations again in Iraq is that citizens of U.S. allies, mostly in Gulf Arab states, have helped the rise of ISIS. This is deeply embarrassing to the U.S. America’s closest allies, like Kuwait, Qatar, Saudi Arabia, Turkey and Jordan, have played a role in financing the activities of ISIS, which has declared an Islamic “caliphate” stretching across the borders of Syria and Iraq and which has killed those they deem enemies of Islam, like Shiites and Yazidis. Turkey, in particular, gave ISIS an easy way into Syria through the border between the two countries. ISIS transited weapons and fighters from Turkey into Syria to fight in the ongoing civil war there—a civil war that has allowed ISIS to gain valuable battlefield experience. That U.S. allies play a dual role in the “war on terror” is an old story. In public, they pay lip service to battling extremism, but have not taken bold steps to halt the flow of private financing to extremist groups in Syria and across the Middle East. Saudi Arabia, a key U.S. ally, is adept at playing this game. The Saudis want to use radical Sunnis in their war against Iran and Shiites, but also do not want these extremists to attack their own country, as Patrick Cockburn recently pointed out. Fifteen of the hijackers who flew jetliners into the World Trade Center and Pentagon on September 11, 2001 were from Saudi Arabia. The 9/11 Commission Report said that Saudi Arabia was the main source of financing for Al Qaeda. But Al Qaeda has also attacked Saudi Arabia itself. More than a decade later, little has changed
Sunni Awakening in Iraq and the future of IS Asia -- Sunnis ruled Iraq since the country's creation after World War I. That state of affairs was overturned, unjustly and unwisely in their view, in 2003 when Saddam Hussein was ousted and a Shia majority came to power shortly thereafter. Though composing only about 16% of the population, the Sunnis are nonetheless angered by their loss of power and marginalization. Recent events are playing into Sunni aspirations for greater power. The Shia army and state are ineffectual, the Kurds are seeking independence, and countries in the region are breaking apart into statelets. The Baghdad government desperately needs help against the Islamic State (formerly known as the Islamic State of Iraq and Syria, among other names) and the Sunnis have the forces and organization to turn the tide against it. They proved their ability to defeat foreign jihadis in the Sunni Awakening beginning in 2005, and they are capable of effecting a second one. However, they will demand substantial political and financial concessions from the Shia government that will alter the landscape of Iraq and possibly form a new state in western Iraq and eastern Syria as well. Despite being 60% of the population, the Shia have had great difficulty in building stable coalitions as they are deeply divided along tribal lines. Had they not been so divided, Sunni rulers could never have stayed in power as long as they did. Shia parties and their militias fought each other almost as much as they did the Sunnis during the sectarian warfare after 2003. The new army, purged of many Sunni officers and NCOs, is riven by tribalism and corruption and is no longer able to hold the country together, neither as a national symbol nor as a repressive force. Baghdad has abandoned western and northern parts of the country to the Islamic State and Sunni insurgents, and the Kurds may soon declare independence.
Why ISIS Wants a Confrontation with the United States -- The Islamic State of Iraq and al-Sham (ISIS), which is also called the Islamic State, is on the march. Two months after first sweeping through northern and central Iraq, it has started to push onward to Erbil, the seat of the Kurdish Regional Government. Along the way, it triggered a severe humanitarian crisis among Iraq’s Yezidi and Christian minorities and caused massive panic across the Kurdish autonomous region, which forced a reluctant United States to intervene. ISIS has also used its momentum to continue its expansion in Syria and, for a few days, even managed to hold parts of the Lebanese border city of Arsal. More confident than ever, ISIS is taking on a broad array of enemies, including the Iraqi, Syrian, and Lebanese militaries; Iraqi and Lebanese Shia militias; Kurds from Iraq, Syria, and Turkey; and Islamist and secular Syrian opposition forces. Now even U.S. air power is joining the fray. From a military perspective, ISIS’ willingness to fight so many groups on so many fronts is impressive. In part, its boldness was made possible by the weakness of many of its rivals. The huge store of deadly, high-quality weapons that the group picked up on its march through Iraq has helped as well. Finally, ISIS has also demonstrated a surprising ability to rearrange and redeploy forces as the group’s operational needs change. Its reputation for military prowess (and brutality) has only grown, which in turn has further weakened resistance to its moves and sent civilians running whenever ISIS forces got close.
How cheap is “cheap” oil? -- Everyone seems to agree that the world is running out of cheap oil. But how cheap is cheap? Until we know it’s hard to say exactly what the world is running out of, or indeed if it’s running out of it at all. Clearly what is needed is for someone to put a dollar value on cheap oil, and here I do my best to come up with a number. Before we can start we need a definition of “cheap”. Webster’s defines it as “worth more than the price paid”, which is probably as good a definition as any, so we will use it. But how do we define when oil is no longer worth more than the price paid, i.e. not cheap? When the world stops buying it. There is of course no exact point at which this occurs; in theory oil will become progressively less “cheap” as the price rises and consumption growth will decrease progressively as a consequence. However, there will come a point at which the oil price becomes high enough to turn consumption growth negative, and for the purposes of analysis I’ve picked this as the “cheap” oil threshold. Using this criterion we will now look briefly into the question of where this threshold might occur.
India’s Quest for Energy in Central Asia - India is the world’s fourth largest energy consumer, with its energy demand perpetually rising in parallel with national power shortages and an insufficiently developed energy infrastructure. There has been a recognition in New Delhi’s diplomatic circles of the need for greater energy diversification and Central Asia, with its abundant oil, gas, and uranium reserves as well as hydroelectric potential, is key to reducing its energy dependency on the Middle East. Yet India’s energy footprint is barely visible in the region. India’s trade with its CAR neighbors stands at a paltry $500-760 million. Its flagship investment in Kazakhstan’s Caspian Satpayev field (a 25 percent stake controlled by India’s Oil and Natural Gas Corporation), whilst in some ways a geopolitical success in showcasing a growing presence in the region, will yield limited dividends and is estimated to hold only 3 percent of Kazakhstan’s known reserves. In contrast, India’s regional rivals China and Russia possess vast economic resources and more efficient state machinery that they can galvanize to project their economic power and access the region’s energy market. Beijing’s capacity to rapidly mobilize resources in developing communication, transport and pipeline infrastructure in Central Asia is unrivalled in scope, scale and speed. It is often said that whereas India spends millions, China spends billions.
Shale gas revolution stalls in China as projected output halved -- China's National Energy Administration (NEA) in a recent meeting to propose the nation's 13th five-year development plan said that by 2020 national production of shale gas and coalbed methane (also known as coal seam gas) will reach 30 billion cubic meters, only around half of what it proposed in the 12th five-year plan in 2012, Shanghai's China Business News reports, citing NEA director Wu Xinxiong. The new projection indicates the previous forecast was too optimistic, signaling that China's shale gas revolution still has a long way to go. Two years ago, the NEA said the nation's shale gas reserves totaled 2.5 trillion cubic meters, with the agency projecting production to reach 6.5 billion cubic meters a year in 2015, and 60 billion to 100 billion cubic meters by 2020. Why has the projected production been cut by half in just two years? In 2013, actual shale gas production jumped to 200 million cubic meters from only 25 million cubic meters in 2012. In 2014, the government set a production target of 1.5 billion cubic meters, but it lagged far behind the original goal of 60 billion cubic meters set for 2020. "I believe 30 billion cubic meters is a more objective number," said one unnamed expert at the state-run oil giant CNPC, whose production target of shale gas is 2.6 billion cubic meters in 2015. At present, 80% of China's shale gas resources are controlled by four petrochemical giants led by CNPC and Sinopec. Investments in shale gas are huge and take a long time to recover. As of April 2014, China's combined investments in shale gas exceeded 15 billion yuan (US$2.4 billion).
Reform vs seasonality in Chinese GDP stats - We had feared that one of most famous of Chinese statistical quirks might have abandoned us forever. The reported combined GDP of China’s provinces came in only slightly above its national GDP in the first quarter, amid reports that more than 70 smaller Chinese cities were dropping GDP as a performance metric. Perhaps as China stopped evaluating its local government officials on a narrow GDP basis, the officials would stop doing the obvious and fiddling their GDP numbers. That would in turn stop the sum of China’s regional GDPs always coming in ahead of the national figure… as well as helping with things like unequal income distribution, problems with the social welfare system and environmental costs. But let’s stick with the GDP thing for now. From Gavekal’s Chen Long and Thomas Gatley: Lo and behold, April’s Q1 GDP numbers showed combined provincial GDP was only 3.7% higher than the national figure, compared to a gap of nearly 11% in 2013. Clear evidence that local officials are no longer putting GDP growth first, right?Wrong. It turns out the gap between provincial and national GDP is subject to a dramatic and bizarre seasonal pattern. It is always low in Q1, always spikes up in Q2-3, and usually retreats a bit in Q4 (see chart below). This pattern, clearly observable every year for the past decade, held again this year: in Q2, combined YTD provincial GDP exceeded the national number by 12.5%.
China's property prices skid further in July - --The average price of new homes in 70 Chinese cities fell for the third straight month in July, as property developers continued to cut prices to reduce inventories amid the market downturn. The average price of new homes in 70 cities slid 0.89% in July from June, according to calculations by The Wall Street Journal, based on data released Monday by the National Bureau of Statistics. This compares with a 0.47% on-month fall in June and a 0.15% fall in May, which was the first drop in two years. On an annual basis, the average price in July rose 2.43%, moderating from the 4.05% increase recorded in June. Real estate and construction are important drivers of growth in the Chinese economy, accounting for more than 20% of gross domestic product in the world's second largest economy, when cement, steel, chemicals, furniture and other related industries are factored in, analysts estimate. Excluding public housing, private sector home prices fell in 64 of the 70 cities in July, up from the 55 cities that posted declines in June. Home prices only rose in coastal Chinese city Xiamen and Dali, a city in southwest China, and were flat in the remaining four cities. Housing sales have slipped this year, falling 10.5% in the first seven months and analysts expect further price cuts as the local governments and property developers continue to grapple with a glut of apartments and tight credit environment. Some property developers have also issued profit warnings on their first half earnings in recent weeks.
Further signs of China's slowing property markets - China's official housing index now shows home price appreciation slowing faster than some had anticipated. Other indicators are also pointing to weakness in China's housing markets. For example the number of cities with falling prices has spiked sharply. Furthermore, the steel rebar futures in Shanghai - an imporant real-time indicator of construction demand - remain under pressure. Jan steel rebar futures in Shanghai (barchart.com) Related to this trend, China's commercial floor space and the number of commercial buildings sold has declined materially (based on official reports). There is no question that Beijing has the wherewithal and the will to support the housing market should things unravel faster than the government likes. Nevertheless, given how pervasive property markets are in the nation's overall economy, concerns among global investors are rising with respect to China's housing slowdown. Scotiabank: - On the theory that where there’s smoke there's fire (and it’s not just because I’m BBQing), weak company financing and concerns surrounding potential defaults in the shadow banking sector coupled with — and likely driven by — further evidence of falling property prices will only amplify the concerns.
China Home Prices Fall in Most Cities on Weak Demand - China’s new-home prices fell in July in almost all cities that the government tracks as tight mortgage lending deterred buyers even as local governments eased property curbs. Prices fell in 64 of the 70 cities last month from June, the National Bureau of Statistics said today, the most since January 2011 when the government changed the way it compiles the data. Beijing prices fell 1 percent from June, posting the first monthly decline since April 2012. “The falling trend of China’s property market has no sign of improving,” . “The key issue is the mortgages, despite all types of local government easings. The high rate is damping sentiment of owner occupiers.” China’s property market has become a drag on the world’s second-biggest economy, prompting cities to start easing local curbs in June. Thirty-six cities had loosened measures as of the end of last week, according to Centaline Property Agency Ltd., while developers have cut prices since March to lure buyers. The International Monetary Fund has urged China to target slower expansion in 2015, saying the economy faces a “web of vulnerabilities” from rising debt and financial institutions’ exposure to real estate.
Abandoned Homes Swell Bad Debt in China’s Wenzhou, Weekly Says - Falling property prices in China’s eastern city of Wenzhou triggered 6.4 billion yuan ($1 billion) of bad loans as buyers abandoned homes and stopped making mortgage payments, the Economy & Nation Weekly reported. Purchasers of 1,107 properties halted payments as prices dropped for 34 straight months, the Xinhua News Agency-affiliated magazine said yesterday on its website, citing data from the local banking regulator. A press officer at the Wenzhou branch of the China Banking Regulatory Commission declined today to confirm the data. China’s slumping property market is a drag on the world’s second-biggest economy and banks’ profits, with lenders’ soured loans increasing for almost three years. New-home prices fell last month in 64 of 70 cities tracked by the government. In Wenzhou, about 56 percent of the homes were abandoned due to falling values and most were high-end apartments, according to the report. Homes were also abandoned by borrowers left with liabilities after making guarantees for companies in financial trouble, the report said. Real-estate lending accounts for 26 percent of outstanding bank loans in Wenzhou, 8 percentage points higher than the national level, according to the report, which didn’t specify a time period for the data.
China Manufacturing PMI Treads Water -China is once again treading water, barely above contraction according to the HSBC Flash China Manufacturing PMI. Key points;
- Flash China Manufacturing PMI™ at 50.3 in August (51.7 in July). Three-month low.
- Flash China Manufacturing Output Index at 51.3 in August (52.8 in July). Three-month low.
Economists React: China Set for a Summer Slump After All - A couple of months ago, there were signs that China’s economy was back on track – exports were doing well, growth hit the government’s 7.5% target in the second quarter, and it seemed that a slump in the real-estate sector would be contained. Alas, it was too good to last. July’s figures showed weakness in industrial production, investment and retail sales, a strange, sudden drop in lending, and a continued plunge in home prices. The first piece of data from August, the preliminary or “flash” purchasing managers’ index released by HSBC, dropped from 51.7 to 50.3 – barely above the 50-line that separates expansion from contraction. Economists weigh in (edited for style): The setback in the PMI data came after the weak financing and economic data last month, showing that the overall economic situation has not improved in August. Production continued to slow down after a short period of upbeat growth…It will fuel further expectation for government policy easing such as reserve-requirement ratio cuts or even an interest-rate cut. China’s first-half economic growth was only 7.4%, slightly short of the full-year target of 7.5%. It is challenging to accomplish the target if the economic situation continues to worsen like the past two months. – Today’s PMI reading suggests that conditions in the manufacturing sector have cooled on the back of moderating policy support…The sharp drop in the PMI is perhaps not surprising given last month’s disappointing activity and lending data. After rushing to shore up growth in the second quarter, it seems that policymakers are now taking a more hands-off approach, with support from infrastructure spending beginning to level off. –
Biggest Risk for China Could Be Failure to Change, Economists Say - China’s economy is looking shaky again, with a widely watched indicator of manufacturing activity the latest to turn southward, prompting some experts to call for more government stimulus measures.The country should meet its economic growth target this year, but a downturn in home prices coupled with slow movement on economic reform poses big risks in the longer term, according to an informal China Real Time poll of 14 economists.The median growth forecast for this year is 7.5%, bang on the government’s target. Policy makers have made it clear that they don’t intend to miss the target. Next year, the median forecast is for a gentle slowdown to 7.3%. The property market was most widely cited by the 14 economists as the biggest risk to China’s economy this year and next. Over the past decade, the country has seen a monster building boom fueled by migration into the cities, the replacement of rundown housing and heavy demand for real estate as an investment (analysts suspect that many apartments are empty). In fact, Japanese investment bank Nomura estimates that as little as 22% of China’s current urban housing was built before the turn of the millennium.After years of soaring prices, the market has hit a peak, at least temporarily. Average homes prices fell for a third straight month in July, according to the China Real Estate Index System, a private-sector data provider.
The Great Chinese Exodus - Today, China's borders are wide open. Almost anybody who wants a passport can get one. And Chinese nationals are leaving in vast waves: Last year, more than 100 million outbound travelers crossed the frontiers. Most are tourists who come home. But rapidly growing numbers are college students and the wealthy, and many of them stay away for good. A survey by the Shanghai research firm Hurun Report shows that 64% of China's rich—defined as those with assets of more than $1.6 million—are either emigrating or planning to. The decision to go is often a mix of push and pull. The elite are discovering that they can buy a comfortable lifestyle at surprisingly affordable prices in places such as California and the Australian Gold Coast, while no amount of money can purchase an escape in China from the immense problems afflicting its urban society: pollution, food safety, a broken education system. The new political era of President Xi Jinping, meanwhile, has created as much anxiety as hope. First-generation businessmen—the ones who powered China's economic rise—now dream of a secure retirement. That means legal safety in places like the U.S. and Canada. Last year, the U.S. issued 6,895 visas to Chinese nationals under the EB-5 program, which allows foreigners to live in America if they invest a minimum of $500,000. South Koreans, the next largest group, got only 364 such visas. Canada this year closed down a similar program that had been swamped by Chinese demand.
Chinese Fleeing PRC: The Hotel California Effect - There's an excellent article at the WSJ concerning wealthy Chinese leaving the PRC...for good. It is fairly common for wealthy people in poor countries to secure overseas residences in the event trouble breaks out at home. That is, they have safety nets if, say, the Communist Party starts persecuting capitalist roaders by tossing the in jail or packing them off to reeducation camps. You never can tell when the Communists have an urge to start acting communistic. What I was not aware of, however, is that a fairly large exodus is already underway even in these years of PRC prosperity. After all, there is not much to enjoy living in your Beijing mega-palace when the air is so bad and so is the traffic. So, there's a push for (literally) greener pastures: But rapidly growing numbers are college students and the wealthy, and many of them stay away for good. A survey by the Shanghai research firm Hurun Report [of "Rich List" fame] hows that 64% of China's rich—defined as those with assets of more than $1.6 million—are either emigrating or planning to.What's new is that they are planning to leave the country in its ascendancy. More and more talented Chinese are looking at the upward trajectory of this emerging superpower and deciding, nevertheless, that they're better off elsewhere.They are leaving in pursuit of things money can't buy: The elite are discovering that they can buy a comfortable lifestyle at surprisingly affordable prices in places such as California and the Australian Gold Coast, while no amount of money can purchase an escape in China from the immense problems afflicting its urban society: pollution, food safety, a broken education system. What is most interesting though is how China's sprawling Maoist-Marxist-Leninist apparatus still keeps tabs on those who have chosen to leave. To ensure that the PRC isn't defamed and that its erstwhile residents act as good ambassadors for the CCP and what it represents, no effort is spared. As the final stanza of the "Hotel California" goes, you can check out any time you like, but you can never leave:
Money Laundering or Investment? Chinese Buy Oz Property - What is capitalism? What is state-driven capitalism? The blurred distinction between the two gives rise to now-frequent crackdowns on Chinese businesspersons during Xi Jinping's current drive to supposedly reduce corruption in the PRC. Unless you're a die-hard Marxist--property is theft, more so in a "Communist" state--the distinction isn't so clear. In an earlier post, I described how many Chinese are hedging their bets by seeking residences abroad should the purge in China reach Cultural Revolution proportions. While that's a remote possibility, you never know. Apparently, one of the choice destinations for the Chinese is Australia. Closer than Europe or North America, it is still relatively affordable. Throw in a large and growing Chinese communities in several destinations and you have an attractive deal: More wealthy Chinese are moving their money out of China to invest in Australia's property market as a corruption crackdown in the world's second biggest economy gathers momentum, property consultants and lawyers said. They said their clients had told them they had legitimate funds to invest but were concerned about being caught up in an investigation, which in China often delves into the affairs of dozens of associates of the main target, and losing that wealth"
To RMB or not to RMB? Lessons from Currency History: China is the world’s largest trader and (on a purchasing power parity basis) is about to surpass the United States as the world’s largest economy (see chart). China already accounts for about 10% of global trade in goods and services, and over 15% of global economic activity. ... So, as China takes its place as the biggest economy on the globe, will its currency, the renminbi (RMB), become the most widely used international currency as well? Will the RMB supplant the U.S. dollar as the leading reserve currency held by central bankers and others, or as the safe-haven currency in financial crises? . This issue is not an immediate one because the RMB is not freely convertible into other currencies. Nevertheless, there are good reasons to look ahead. Promoted by the Chinese government, international use of the RMB has picked up rapidly in recent years. It is now the second most important currency (with an 8.7% share) in trade finance – ahead of the euro, but still far behind the U.S. dollar (with an 81.1% share). Its presence in foreign exchange markets has grown commensurately, rising in rank from #17 in 2010 (with a 0.9% share) to #9 in 2013 (with a 2.2% share). Again, the U.S. dollar is still by far the most traded currency, with an 87% share. And, the RMB now ranks #7 as a settlement currency (accounting in mid-2014 for about 1.6% of all transactions through SWIFT), up from rank #35 less than four years ago (see chart). Assuming, as China’s leadership seems to intend, that RMB convertibility is on the horizon within a decade, how far will this internationalization go and how fast?
How Significant is the BRICS New Development Bank? - Yves Smith - Quite a few readers have contended that the commitment by the BRICS countries to create a developing country challenger to the World Bank represents a serious blow to the dollar hegemony. While rising anger against the US use of its currency/banking system dominance to further geopolitical ends is well warranted, translating that into effective counter-measures is something else completely. This article does a solid job of explaining the focus the new development bank, which is infrastructure projects, and lowering expectations as far as shaking up the current international financial architecture is concerned. But it can still make considerable progress on issues that are important to its sponsors.
South Korea’s Exports to China: Game Over? - South Korea’s boom in exports to China appears to be finally fizzling out. In an unusually candid trade report early this month, the trade ministry said it was “concerned” about a sustained fall in exports to China, Seoul’s biggest trade partner. Shipments shrank 7% in July from a year earlier, the third-straight monthly drop that began with a steep 9.4% slide in May. Officials at the ministry attribute the decline to China improving its own supply capacity and therefore needing to take in fewer Korean goods. Korean firms largely export partly-finished products for Chinese manufacturers to assemble into finished products destined for third countries. Chinese firms are now producing more of those so-called intermediary goods on their own. Among the worst-hit Korean industries is the petrochemical sector. Exports to China in that industry fell 5.9% in July. State-funded think tank Korea Institute for International Economic Policy noted in July that China has been ramping up its own production capacity for petrochemicals and has less demand of its own for finished products because of moderating economic growth. The slump in export demand from China appears to be sending shockwaves to Korean businesses. Capro Co., the only South Korean manufacturer of caprolactam—an organic compound used to make nylon—shut down one of its three plants last year due to a lack of orders from China, according to Seoul-based JoongAng Ilbo newspaper.
Despite Collapsing Economy, Japanese PMI Surges To 5-Month High; China PMI Tumbles, Misses By Most On Record -- Following New Zealand's biggest monthly plunge in consumer confidence in over 2 years, Japan's Manufacturing PMI surged to its highest since March at 52.5 (handily beating expectations of 51.5). Almost the entire suite of subindices were positive except JPY weakness-inspired margin compression as output prices tumbled and input prices surged. All of this in the face of collapsing and disappointing hard data. Meanwhile, China Manufacturing PMI plunged to 51.5, missing by the most on record, as China's apparent 'hard' data shows improvement. Perhaps it is time to recalibrate the seasonal magic in these PMIs...
Japan PMI "Strongest Since March": Does That Mean "Strong"? - The spin in media reporting, in both directions (but typically bullish), is pervasive. Here is a case in point. Markit reports Japan PMI Points to Strongest Manufacturing Expansion Since March. Does "strongest since March" mean "strong"?Here are the Key Points:
- Flash Japan Manufacturing PMI™ at 52.4 (50.5 in July). Modest improvement in growth registered in August.
- Flash Japan Manufacturing Output Index at 53.2 (49.8 in July). Output increased at solid pace.
Overlooked Data Shows Japan Wages Rising - Is Japan’s economic revival experiment still on track? One crucial gauge: whether worker pay is rising. Fresh, little-noticed data out this week makes the picture look a bit brighter. Revised numbers now show employee earnings rose in June for the fourth straight month, the longest such streak since 2010 — and at the fastest pace in four years. Here’s why it matters. Bank of Japan Gov. Haruhiko Kuroda likes to talk of a self-sustaining, self-reinforcing “virtuous cycle” of faster growth lifting corporate production, profits, and prices, in turn feeding higher worker pay and spending. That’s supposed to replace the vicious cycle of deflation — falling prices, falling wages, falling spending — that gripped Japan for more than a decade before Mr. Kuroda unleashed his massive stimulus program just over a year ago. BOJ forecasts — generally more optimistic than those by private economists — rest heavily on a rosy view of the labor market. Falling unemployment is supposed to trigger higher pay as desperate employers confront labor shortages. Higher wages are meant to sustain household spending, offsetting a recent sales-tax hike aimed at curbing the government’s swollen debt. They’re also supposed to push companies to raise prices and lift inflation toward the central bank target, even as other factors that have fueled inflation over the past year (mainly a weaker yen making imports more costly) wear off.
Japanese Trade Deficit Streak Hits 40 Months, Biggest Miss Since October - Any day, week, month, year now... Japan's adjusted trade balance missed expectations by the most since October 2013 (back over a JPY1 trillion deficit) as the QQE-ing, j-curve-any-minute-now nation awaits the arrival of the competitive pickup for the 40th month in a row. Exports beat expectations (which we are sure will be the headline crowed about by all) but imports surged by 2.3% (against expectations of a 1.5% drop). It appears you single-handedly devalue yourself to prosperity in an interconnected world after all - whocouldanode? As we said before, "Monetary debasement does NOT result in an economic recovery, because no nation can force another to pay for its recovery."
Japan’s Export Lift No New Dawn - Japan’s exports perked up in July in line with firmer global demand. But there’s little chance the nation will return any time soon to its status as an export powerhouse. Exports rose 3.9% on year after two consecutive months of declines. Exports to the European Union climbed 10.2%, in part due to a weaker yen to the euro. Exports to the U.S. grew 2.1%, and were 3.4% higher to Asian nations. Sales of motor vehicles and electrical machinery were strong. Goldman Sachs said a recovery in the U.S. economy is pushing global demand higher, which should lead to a gradual improvement in Japan’s exports over time.But the bank cautioned that Japan’s exports are unlikely to boom, despite the yen’s over 5% decline against the U.S. dollar in the past 12 months. In part, this is because Japanese companies have moved production to cheaper offshore bases, like China. Export volumes also have remained weak even as values have picked up.Despite the improvement in exports, Japan’s trade balance notched a Y964 billion deficit in July, up from Y823 billion in June. (On a seasonally adjusted basis it narrowed a touch to Y1.02 trillion from Y1.08 trillion.) In July, imports grew 2.3% on year, which was slower than 8.4% in June, the result of lower domestic demand in the wake of Japan’s April 1 sales-tax hike. But the level of imports still is relatively elevated as Japan remains dependent on overseas fuel because of delays in restarting nuclear power plants at home. The country is also importing more electrical machinery from China – an area in which it used to be only an exporter.
Asian Banks Face Dearth of Deposits - Asian banks are finding deposits harder to come by, posing a risk to economies increasingly dependent on credit for growth. Year-on-year growth in monthly deposits at banks in Asia — excluding China and Japan — has slowed in the past six months from above 12% to 10%, said HSBC ’s co-head of Asian economic research, Frederic Neumann. Banks in Asia typically offer deposit rates only slightly better – or sometimes below — the rate of inflation, which economists blame for a tendency among the region’s savers to invest heavily in property and other riskier investments. “Part of the explanation might be that depositors are finding more rewarding opportunities for their cash, such as equity, property, or, in some cases, shadow bank products,” . With China’s deposit rates fixed at 3.3% and inflation at 2.3%, for example, investors in China have piled 12.65 trillion yuan ($2.04 trillion) into wealth-management products promising to pay around 5% a year on average. Many help fund projects economists worry may never yield such returns, including local government infrastructure or projects and property developments. In several Asian countries, deposit growth is no longer keeping pace with new lending. Bank credit has been climbing relative to gross domestic product since the global financial crisis, with HSBC estimating that the pace of credit growth relative to GDP growth rose last year to new highs in every country but Taiwan. As a result, bank credit in Asia excluding Japan now exceeds the combined size of the region’s GDP, according to the bank.
Chartporn: 18 Charts Exploring How The Ageing World Will Shape The Global Economy - Curious how the demographics of an aging world increasingly impact the economy, the spending, consumption and saving patterns, the earnings and wealth potential of various age groups, and the amount of pension funds available to satisfy an ever growing pie of future welfare recipients? Then the following 18 charts are for just you.
Economists React: Thailand GDP - Thailand’s economy avoided a recession in the second quarter, growing 0.4% on year and 0.9% on quarter. The performance, which beat expectations, was due to firmer local demand. Consumer spending perked up after a military coup on May 22 ended months of political protests. The junta have also begun to spend, further aiding growth.Some economists say the economy will do better in the second half. But there are worries. Investment remained weak in the quarter. And high household debt means that consumption is unlikely to grow that strongly for the remainder of the year. Here’s what economists had to say: J.P. Morgan: “Domestic demand stages a comeback… Domestic demand accelerated 10.8% quarter-on-quarter on a seasonally-adjusted basis in 2Q, the strongest sequential print since mid-2012, supporting the overall expansion in growth through the quarter. In over-year-ago terms, domestic demand subtracted 4.9% points from headline GDP, though a drawdown in inventories was partly responsible.”
Barclays: “Net exports continued to make a positive contribution to growth, though this factor remains driven by import compression for the time being, with imports falling a further 1.0% quarter-on-quarter on seasonally adjusted basis… Overall, domestic demand looks poised to recover further in the second half. We expect private consumption and investment demand to improve in coming months.”
ANZ: “Thailand averted a technical recession in Q2 … GDP (growth) confirms the stabilization in economic activity that monthly private consumption and investment indicators have suggested as the political outlook turns constructive… We expect the unlocking of fiscal spending to manifest itself in a V-shaped recovery for Thailand in H2 2014.”
Now it’s time for Silicon Valley to profit from the new Indian ecommerce laws it helped shape - Late last month, the tech industry cheered two huge back-to-back investments into India’s fledgling e-commerce sector: India e-tailer Flipkart.com raised $1 billion from global venture capital firms, the largest venture investment ever into an Indian Internet company, and 2014’s second largest investment round after Uber. Less than 24 hours later, Jeff Bezos one-upped Flipkart by announcing that Amazon would invest $2 billion into building up Amazon.in’s operations, the largest investment to date by an e-commerce company in India. The numbers are impressive, and to the uninitiated, these latest multibillion dollar e-investment announcements in India might read like Silicon Valley Triumphalism —confirmation of the New Economy’s inexorable march forward, whether Luddite dead-enders like it or not. For months now, Pando has been reporting on the merging of political interests between India’s newly-elected ultranationalist leader, Narendra Modi, and Silicon Valley heavyweights, led by eBay billionaire Pierre Omidyar, pushing to enter India’s closed and largely undeveloped e-commerce sector. Earlier this summer, Pando reported on Modi’s plans to open up India’s e-commerce sector to foreign direct investment (FDI) as one of his first major policy moves, with representatives from eBay/PayPal, Amazon and Google working hand-in-glove with Modi’s new government in drawing up those plans. The US State Department had placed Modi on a visa blacklist from 2005 until his election this year, over his role in the brutal anti-Muslim pogroms in 2002, which left some 2000 Muslims murdered, and hundreds of thousands internally displaced.
A World Economy Made of BRICS: Brazil, Russia, India, China and South Africa (BRICS) recently announced the formation of a Contingent Reserve Arrangement (CRA), which will provide loans to member countries if their foreign exchange reserves run dangerously low. This fund is supposed to show the world that the BRICS can survive without the International Monetary Fund (IMF) and its main patron, the U.S., and that countries are taking concrete steps to shake their reliance on the U.S. dollar. Upon close inspection, it appears that the structure is in place, but it’s coupled with nothing more than an empty bank account and a lot of caveats. The CRA is a protective, yet flimsy wall made of paper maché instead of solid brick and mortar. The treaty that brought the CRA to life calls for funding the new entity with $41 billion from China, $18 billion each from Russia, India, and Brazil, and $5 billion from South Africa, although no money will change hands anytime soon. The accord also states that each country retains sole possession and control of their contribution until such time as there is a call for funding. In essence, each country pledged money, but doesn’t have to put up any cash. This way the five members get political credit for nothing more than a signature. And it gets better.
India and China: Strangers by choice | The Economist - The past half-century has produced mostly squabbles, resentment and periodic antagonism. India felt humiliated by its utter defeat at the hands of Mao’s army in the 1962 war. China’s long-running close ties to Pakistan look designed to antagonise India. In return India is developing ever warmer relations with the likes of Vietnam and Japan. An unsettled border in the Himalayas, periodic incursions by soldiers into territory claimed by the other side and China’s claim—for example—that India’s Arunachal Pradesh is really a part of Tibet, all suggest that happier relations will be slow in coming. Even a booming bilateral trade relationship is as much a bone of contention as a source of friendlier ties, given India’s annoyance at a yawning deficit.
India and ASEAN: Beyond ‘Looking East’ -- As expected, the South China Sea issue once again grabbed the headlines in the latest round of Asian regional summitry held in Myanmar earlier this month. Less in the limelight, but no less consequential, was India’s first engagement of the Association of Southeast Asian Nations (ASEAN) since its new Prime Minister Narendra Modi was elected last month. Despite India’s oft-cited cultural and civilizational links with Southeast Asia and some notable advances in its much-touted Look East Policy since 1991, both sides agree that ASEAN-India ties are far from reaching their full potential. Southeast Asia – with the exception of Myanmar – had also been conspicuously absent in Modi’s foreign policy statements, which have largely focused on neighboring South Asian states and major powers like China and the United States. The new Indian government’s first foray into a formal ASEAN gathering produced some encouraging signs. At the India-ASEAN meeting, External Affairs Minister Sushma Swaraj focused her remarks on “connectivity,” the reigning mantra in Modi’s regional policies which refers to a host of infrastructure projects to speed up Asian integration. That suggests a strong economic bent in the relationship that would both help New Delhi to develop its Northeastern states and Southeast Asia to form a more united ASEAN Economic Community over the next few years. ASEAN, for its part, said both sides will likely sign a long-delayed free trade agreement in services and investments later this month and proposed strengthening cooperation in several areas, including agriculture, energy, and science and technology.
Across Asia's borders, labor activists team up to press wage claims (Reuters) - Labor leaders behind the biggest strikes in Cambodia's $5 billion garment industry knew last year they had a strong case for higher wages: they had already compared notes with activists in neighboring countries. The result was a 25 percent increase in the minimum pay for an estimated 600,000 garment workers, to $100 a month, the biggest jump in around 15 years. Now, they're asking for more. Negotiations over pay and working conditions have typically remained within national borders, but activists are now bringing more muscle to the table and putting more pressure on employers and governments by using shared experiences in nearby markets. For global companies that have shifted production to Southeast Asia's low-cost manufacturing hub, this could mean less room for wage bargaining, a squeeze on profits and maybe even higher price tags on anything from shoes and clothing to cars and electronics appliances. "I see a trend towards more and stronger collaboration among labor leaders that can take different shapes and forms, from exchanging information to partnerships," said Peter van Rooij, director of the International Labor Organization (ILO) in Jakarta, noting ties would likely strengthen with next year's planned economic integration by the 10-member Association of Southeast Asian Nations (ASEAN).
International Minimum Wage Comparisons - How does the level of the minimum wage relative to other wages compare across higher-income countries around the world? Here are a couple of figures generated from the OECD website, using data for 2012. As a starter, here's a comparison of minimum wages relative to average wages. New Zealand, France, and Slovenia are near the top, with a minimum wage equal to about half the average wage. The United States (minimum wage equal to 27% of the average wage) and Mexico (minimum wage equal to 19% of the average wage) are near the bottom. However, average wages may not be the best comparison. The average wage in an economy with relatively high inequality, like the United States, will be pulled up by the wages of those at the top. Thus, some people prefer to look at minimum wages relative to the median wage, where the median is the wage level where 50% of workers receive more and 50% receive less. For wage distributions, which always include some extremely large positive values, the median wage will be lower than the average--and this difference between median and average will be greater for countries with more inequality. Here's a figure comparing the minimum wage to the median wage across countries. The highest minimum wage by this standard is Turkey (71% of the median wage) followed by France and New Zealand (about 60% of the median wage). The lowest three are the United States (38%), the Czech Republic (36%) and Estonia (36%).
Report: The Rising—and Falling—Stars of Global Manufacturing -- According to a new report from the Boston Consulting Group—which for several years has tracked the competitiveness of global producers—the old assumptions of low cost versus high-cost regions is outdated. That view held large swaths of the globe, mainly in Asia, Latin America and Eastern Europe, held an unbeatable cost advantage over richer, established economies. But no more, says BCG. “The new map increasingly resembles a quilt-work pattern of low-cost economies, high-cost economies, and many that fall in between, spanning all regions,” the report said. BCG analyzed the cost structure of 25 leading exporters, focusing on wages, productivity, the price of energy and exchange rates. The consulting group estimates these countries account for nearly 90% of global exports of manufactured goods. It found some economies long thought of as low-cost hubs are under pressure. For instance, Poland, the Czech Republic and Russia, all have seen erosion in their cost competitiveness over the past decade. Mexico is now cheaper than China and the U.K. has emerged as a low-cost manufacturer relative to most of its European neighbors, according to the BCG calculations. Brazil, meanwhile, has become one of the world’s priciest places to make things; its cost structure is tied with those of Italy and Belgium in the BCG rankings. Brazil’s average costs went from 3% lower than in the U.S. in 2004 to 23% higher today. BCG notes Brazilian factory wages more than doubled over the decade, while productivity growth faltered. The cost of buying electricity for factories in that South American country have doubled, while natural gas prices have leapt nearly 60%.
Developing Nations Anxiously Watch Fed at Jackson Hole: merging markets used to be for the few brave investors willing to trade high risk for high rewards. Countries even riskier, like Zambia and Pakistan, were for the real cowboys. No longer. Since the financial crisis spurred central bankers to hold down interest rates, investors have poured billions of dollars into emerging and frontier markets. Now, all eyes are on the U.S. Federal Reserve and its annual conference in Jackson Hole, Wyoming, which begins Friday and will feature speeches by Federal Reserve Chairwoman Janet Yellen and European Central Bank President Mario Draghi. The Fed is expected to end its stimulus program this fall and start raising interest rates next year; any sign that Yellen is changing course and raising rates sooner could rattle investors, not only in emerging markets, but across all assets. As developed economies stagnated after the financial crisis, the Fed pushed more money into the system to try to spur growth. Interest rates on safer assets in the United States and Europe fell and investors started looking for higher returns from riskier assets. That's how they ended up buying bonds from Ivory Coast, Cyprus, Ecuador, and similar nations. The IMF estimates that investments in bonds from emerging-market countries like Brazil, China, and South Africa have more than doubled over the past few years. Since 2010, foreign holdings of emerging-market debt have expanded from $400 billion to $1 trillion. Frontier markets, a rough set of countries even newer to the international market than "emerging" countries, are also expanding like never before. That group, which includes Kenya and Ecuador, sold $20 billion worth of bonds last year, according to the Financial Times -- twice what was issued in 2012. Fourteen countries issued their first bonds in 2010 or later, for a total of $8.5 billion worth of debt, according to a recent IMF paper.
Citibank could lose Argentina banking license -- If the banking giant obeys a US judge’s order, it risks losing its banking license in Argentina — and the $2 billion it has in local deposits. But if it follows Argentine law, it risks violating a US federal court order. Citi finds itself in this precarious position after Manhattan federal court judge Thomas Griesa — who is overseeing the bitter battle between hedge-fund mogul Paul Singer and Argentina over an estimated $3 billion due on bonds defaulted upon in 2001 — ordered the bank not to pay out on some of the country’s locally issued bonds. Griesa initially exempted Citi’s Argentine law bonds from his sweeping order — stopping payouts to exchange bondholders unless Argentina also paid Singer and other holdout bondholders who demanded full payment. But Griesa changed his mind last month after learning that some of the bonds for which Citi is custodian were also exchange bonds. . Citi has until Sept. 30 to fall in line. The bank’s appeal was fast-tracked last week; a hearing is scheduled for Sept. 18.
Argentina Proposes End Run Around U.S. Court in Bond Dispute -- Argentina has proposed a way to pay its bondholders in a move that would bypass a United States court ruling that has blocked its payments and sent the country spiraling into default last month. The government said on Wednesday that it had sent a draft bill to Congress that would allow foreign investors holding Argentine debt to swap their defaulted bonds for new ones subject to local law. “It’s not an obligatory change of jurisdiction but a method for Argentina to keep repaying its debt,” Axel Kicillof, Argentina’s economy minister, said during a press conference in Buenos Aires. “It’s a change in the place where payment is collected.” The move comes as the country has arrived at an impasse. It is fighting a court order by Judge Thomas P. Griesa of the Federal District Court in Manhattan that prevents the government from making payments to bondholders until it reaches a deal with a group of hedge funds that is demanding more than $1.3 billion in payments on bonds that the country defaulted on in 2001.
Argentina to Pay Bondholders in Local-Law Swap to Skirt Court Ruling - Argentina’s bonds sank to a two-month low after the government said it plans to pay foreign-currency notes locally to sidestep a U.S. court ruling that blocked payments and caused its second default in 13 years. The government will submit a bill to Congress that lets overseas debt holders swap into new dollar-denominated bonds governed by domestic law, President Cristina Fernandez de Kirchner said in a nationwide address yesterday. Payments will be made into accounts at the central bank instead of through Bank of New York Mellon Corp., the current trustee. Fernandez’s move flies in the face of orders from U.S. District Judge Thomas Griesa that a swap would be illegal. He has said the nation must pay $1.5 billion to holders of debt defaulted on in 2001 or reach a settlement before resuming payments on restructured notes. JPMorgan Chase & Co. and Credit Suisse Group AG said the offer reinforces Argentina’s unwillingness to negotiate with the holdout creditors on a deal that would allow it to return to overseas capital markets.
Argentina moves to cut out US hedge funds - Argentina has risked deepening its isolation among international lenders with a proposal to cut out a group of US hedge funds from sovereign bond payments. President Cristina Fernández de Kirchner announced on Tuesday that the government was replacing its New York intermediary bank with the state-run Banco de la Nación. This would allow it to circumvent a New York judge's ruling that blocked bond payments to all creditors, after the country refused to reimburse a group of hedge funds which are demanding payment of their bonds in full. The new plan would allow Argentina to pay the so-called haircut bondholders who agreed to restructure their payments in 2005 and 2010 but have been unable to receive payments since the court ruling. The bond market meanwhile reacted negatively to the proposed change in jurisdiction, which the New York court may see as an attempted evasion of its decisions. Argentina's portion of the JP Morgan Emerging Markets Bond Index Plus widened by 22 basis points to 786 over US treasuries, marking an increase in risk perception. Argentina's plan for making payments on its sovereign bonds via a local bank aims to protect the vast majority of creditors who participated in two debt restructurings, the government said.
Argentina Stuns Bondholders With Scorched-Earth "Cramdown" Plan - With the impasse over the latest Argentina default going nowhere fast, late last night president Kirchner stunned its creditors when she announced what amounts to a cramdown plan for holdouts, in which all bonds would be stripped of their existing indentures and converted to local law bonds. Or, as some would call it, a "scorched earth" transaction that burns all bridges, and goodwill, with the international creditor community and likely leaves Argentina unable to access global capital markets for the foreseeable future.
Escalating to Nowhere? -- Here is the proposed law rerouting payments under the restructured, now-defaulted Argentine bonds away from New York. Contrary to reports, the big news is not the swap, but the unilateral attempt at firing Bank of New York Mellon and substituting Banco Nacion in Buenos Aires (or an alternative, if voted by the bondholders). Bondholders could then show up in Buenos Aires or wherever Nacion sends their money to get paid. The proposal would also reopen the 2010 swap to the remaining holdouts.*Correction/Clarification*: Everyone would be invited to go into the swap on 2010 terms under Argentine law and jurisdiction. Since 2010 terms are old news and local law FX bonds are subject to the injunction pending appeals, I am not sure how this helps ... not to mention the transaction costs. Although the ultimate beneficial holders are not bound by the court orders, it is hard to see how most would get their hands on the FX without the help of entities that would either be clearly bound by or worried about New York court orders (banks, payment and clearing systems with a presence in New York). Some might show up in BA, but I am not holding my breath for a large turnout. The move is obviously a violation of the court orders (so I guess that would be double contempt?), and not exactly in line with the indenture, which requires any replacement trustee to be a New York financial institution. But this is unremarkable--Argentina's actions so far have not exactly been about clever ways to comply (see full-page ads and ICJ lawsuit).
Argentina's default strategy raises debt acceleration risk (Reuters) - Argentina's plan to restructure its external debt to skirt a U.S. ruling that prevented it paying its creditors boosts the risk of investors demanding the accelerated payment of their bond holdings. Its second default in little over a decade opened Latin America's No. 3 economy to the possibility of creditors declaring the principal value of their bonds and interest due immediately - a process known as acceleration. An acceleration could leave Argentina facing claims of up to $30 billion, more than the government holds in foreign reserves. true Argentina slid into default last month after a U.S. court blocked an interest payment owed to holders of debt restructured in the wake of the country's record 2002 default until it had settled with a group of hedge funds that rejected the haircut. Wall Street had been split over the risk of an acceleration, with some fund managers, including those holding Argentine debt, arguing it would only harden Argentina's stance against the holdouts when there remained hope for a negotiated settlement. But President Cristina Fernandez's announcement late on Tuesday that Argentina would push to make payments on its sovereign bonds via a state-controlled bank poured cold water on any lingering expectations of a deal that would allow the resumption of the debt service payments blocked by a U.S. court.
U.S. judge calls Argentina debt row hearing amid contempt calls (Reuters) - The U.S. judge who barred Argentina from servicing its debt until it settled with investors demanding full payment on their bonds scheduled a new hearing on Thursday, after the country unveiled plans to sidestep his ruling that led it to default for the second time in a dozen years. Argentina missed a June interest payment after District Judge Thomas Griesa blocked a coupon payment owed to holders of debt issued under U.S. legislation that was restructured after the country's 2002 default on $100 billion in debt. President Cristina Fernandez, steadfast in her refusal to pay the hedge funds face value on their bonds, this week sent to the Argentine Congress a bill that would allow her government to resume payment to holders of exchanged bonds in defiance of Griesa's court. true In a letter to Griesa filed late on Wednesday, NML Capital Ltd, one of a group of plaintiffs known as holdout creditors, said the measures announced by Fernandez on Tuesday were a "grave affront" on the judge's ruling. "The express purpose of these maneuvers is to render this court's orders a nullity,"
Argentina slams U.S. judge as 'imperialist,' peso halts rout (Reuters) - Argentina on Friday accused the U.S. judge who called the country's new debt restructuring plan illegal of making "imperialist" comments against the South American nation. Latin America's No. 3 economy tipped into its second default in 12 years in July after U.S. District Judge Thomas Griesa blocked payments to holders of issued under U.S. law that was restructured following its record $100 billion default in 2002. Griesa ruled that measures proposed by Argentina's president late on Tuesday to make debt payments locally and push bondholders to bring their debt under Argentine law violated past court rulings. But he stopped short of holding the country in contempt. true President Cristina Fernandez's measures, if enacted and executed, would potentially allow Argentina to skirt Griesa's court orders and thus resume interest payments on an estimated $29 billion in restructured bonds. Argentine Cabinet Chief Jorge Capitanich said Griesa's choice of words was "unfortunate, incorrect and even, I would say, imperialist expressions".
The WSJ’s Editorial Posing as “News” about Ecuador-- William K. Black -- Greetings from Bogota where I’m participating in an economic conference and teaching two class sessions. Under the banner “Latin America News” the Wall Street Journal has poured out its pain that the people of Ecuador might reelect President Rafael Correa. The article is actually an editorial attacking Correa and the people of Ecuador for potentially voting to reelect Ecuador’s most successful President in the modern era. The issue is term limits. I have always opposed term limits as an obstruction to democracy and competence. The U.S. had no presidential term limits for most of its history and the only president the population chose to elect to more than two terms was Franklin Delano Roosevelt – one of our greatest presidents. Term limits are an issue on which reasonable people should be able to disagree without rancor. Rupert Murdoch and his reporters do not fall within that category and they despise Correa Ecuador’s success and Correa’s popularity falsify their ideological claims that democratic government is the problem and plutocracy is the solution. The WSJ is enraged that that Ecuador’s democratically-elected parliament might remove term limits for public officials. The faux “news” story launches this fact-free smear: “Mr. Correa, whom opponents characterize as a semi-authoritarian leader who controls all levers of power.” It turns out that the “opponents” that the WSJ tries to dredge up are political opponents who define winning democratic elections as “authoritarian.”
Russia economic funk ripples out through ex-Soviet states | Reuters: To paraphrase the adage: when Russia sneezes, the rest of the ex-Soviet Union catches a cold. Storm clouds were also gathering over the Russian economy well before the Ukraine crisis took hold late last year, with long-range official projections weakening alarmingly. But Western sanctions over its role in Ukraine's conflict have undermined it further. Russia now faces recession this year and countries with post-Soviet economic ties face the fallout as Kiev breaks away to the West. Across the Commonwealth of Independent States (CIS) bloc, memories linger of 2008, when Russia's economic slump played out across the region of 300 million people, causing recession, triggering housing crashes and bank debt defaults. "There is a very strong transmission channel from Russian economic weakness to surrounding areas," said Christopher Granville, managing director at consultancy Trusted Sources, who describes Russia's economy as being in a state of "slow strangulation". "Russia's recession in 2009 was a major blow to the CIS..all in all, it's a bleak outlook for the whole region."
Ukraine factories equip Russian military despite support for rebels— Deep into a conflict that has sundered decades-old ties between Ukraine and Russia, Ukraine is still selling military gear over the border to its neighbor, Ukrainian defense industry officials say.Ukraine’s new leaders have vowed to stop the flow of these defense products, which include key parts for ship engines, advanced targeting technology for tanks and upkeep for Russia’s heaviest nuclear missiles. New laws passed this week bolster their powers to do so. Kiev says helping to arm Russia is tantamount to equipping an enemy during wartime when Moscow is sending support to separatist rebels, a charge the Kremlin has denied. But Kiev’s pleas for an end to trade ties have run into strong resistance from workers at companies like Motor Sich, here in Ukraine’s industrial heartland, where 27,000 employees build engines tailor-made for Russian military helicopters and planes. Most senior executives here grew up as part of the same Soviet military-industrial club as their Russian peers. “We have our own party, the party of Motor Sich,’’ company spokesman Anatoliy Malysh said.
What Do the World Bank and IMF Have to Do With the Ukraine Conflict? -- The relationship with international financial institutions changed swiftly under the pro-EU government put in place at the end of February 2014 which went for the multi-million dollar IMF package in May 2014. Announcing a 3.5 billion dollars aid programme on May 22, World Bank president Jim Yong Kim lauded the Ukrainian authorities for developing a comprehensive programme of reforms, and their commitment to carry it out with support from the World Bank Group. He failed to mention the neo-liberal conditions imposed by the Bank to lend money, including that the government limit its own power by removing restrictions that hinder competition and limiting the role of state control in economic activities. The rush to provide new aid packages to the country with the new government aligned with the neo-liberal agenda was a reward from both institutions. The East-West competition over Ukraine, however, is about the control of natural resources, including uranium and other minerals, as well as geopolitical issues such as Ukraine’s membership in the North Atlantic Treaty Organization (NATO). The stakes around Ukraine’s vast agricultural sector, the world’s third largest exporter of corn and fifth largest exporter of wheat, constitute a critical factor that has been overlooked. With ample fields of fertile black soil that allow for high production volumes of grains, Ukraine is the breadbasket of Europe.
Europe risks deeper economic crisis as Russia buckles and defaults mount in Ukraine - German bond yields plummeted to record lows and stock markets sold off across the world after Ukraine and Russia came to the brink of war, threatening to set off a financial shock and push Europe into deep recession. Flight to safety sent yields on German 10-year Bunds tumbling to 0.97pc after Ukraine said its artillery had destroyed a “significant” part of a Russian armoured column that crossed the border into the Donbass. Yields on two-year notes turned sharply negative, implying that large investors are willing to pay the German state to look after their money. NATO chief Anders Fogh Rasmussen said the crisis had reached danger point, but stopped short of calling it an invasion. “I can confirm that last night we saw a Russian incursion, crossing of the Ukrainian border,” he said. European foreign ministers warned that they would tighten the sanctions noose yet further unless Russia draws back. The dramatic actions by Russia came as the Ukrainian armed forces surrounded Donetsk and Luhansk, and appeared close to a final assault on rebel strongholds. The Russian foreign ministry accused Ukraine of trying to block the entry of a humanitarian relief convoy, calling it a “provocation”. The escalating clash is now haunting the European economy, already on the brink of fresh recession, with a string of southern states in debt-deflation. Italy has collapsed back into a triple-dip recession, and Germany is contracting. Marcel Fratzscher, head of the German Economic Research Institute (DIW) warned of “technical recession” after manufacturing orders to the rest of the eurozone fell 10.4pc.
Walls Come Tumbling Down -- Yesterday I quickly commented the disappointing growth data for Germany and for the EMU as a whole, whose GDP Eurostat splendidly defines “stable”. This is bad, because the recovery is not one, and because we are increasingly dependent on the rest of the world for that growth that we should be able to generate domestically. Having said that, the real bad news did not come from Eurostat, but from the August 2014 issue of the ECB monthly bulletin, published on Wednesday. Thanks to Ambrose Evans-Pritchard I noticed the following chart ( page 53): The interesting part of the chart is the blue dotted line, showing that the forecasters’ consensus on longer term inflation sees more than a ten points drop of the probability that inflation will stay at 2% or above. Ten points in just a year. And yet, just a few pages above we can read: According to Eurostat’s flash estimate, euro area annual HICP inflation was 0.4% in July 2014, after 0.5% in June. This reflects primarily lower energy price inflation, while the annual rates of change of the other main components of the HICP remained broadly unchanged. On the basis of current information, annual HICP inflation is expected to remain at low levels over the coming months, before increasing gradually during 2015 and 2016. Meanwhile, inflation expectations for the euro area over the medium to long term continue to be firmly anchored in line with the aim of maintaining inflation rates below, but close to, 2%. The ECB is hiding its head in the sand, but expectations, the last bastion against deflation, are obviously not firmly anchored. This can only mean that private expenditure will keep tumbling down in the next quarters. It would be foolish to hope otherwise.
Worse than the 1930s: Europe’s recession is really a depression -- As I was arguing last week, it's time to call the eurozone what it really is: one of the biggest catastrophes in economic history. There have been plenty of those lately. And it's not just the Great Recession. It's the way we've struggled to make up the ground we lost since. The United States, for one, has had its slowest postwar recovery. Britain has had its slowest one, period. But, six and a half years later, Europe has distinguished itself by not having much of a recovery at all. And, as you can see above, that's about to make it worse than the worst of the 1930s. I've taken the chart above from Nicholas Crafts, and extended it a bit to put Europe's depression in, well, even more depressing perspective. Eurozone GDP still hasn't gotten back to its 2007 level, and doesn't look like it will anytime soon. Indeed, it already wasn't clear if its last recession was even over before we found out the eurozone had stopped growing again in the second quarter. And not even Germany has been immune: its GDP just fell 0.2 percent from the previous quarter. It's a policy-induced disaster. Too much fiscal austerity and too little monetary stimulus have crippled growth like almost never before. Europe is doing worse than Japan during its "lost decade," worse than the sterling bloc during the Great Depression, and barely better than the gold bloc then—though even that silver lining isn't much of one. That's because, at this rate, it'll only be another year until the eurozone is well behind the gold bloc, too. So how is Europe making the Great Depression look like the good old days of growth? Easy: by ignoring everything we learned from it.
Blogs Review: The Forever Recession - What’s at stake: As the recovery takes hold in the US, Europe appears stuck in a never-ending slump. With the ECB systematically undershooting its inflation target and recent signs that inflation expectations could become de-anchored, the bulk of commentators in the blogosphere are again calling for more monetary actions. Noticeably, some have completely lost hope in the ability of the European institutions to turn this situation around and are now calling for countries to simply break away from the EMU trap.The Economist writes that this week’s figures for the euro-zone economy were dispiriting by any measure. An already feeble and faltering recovery has stumbled. Output across the euro area was flat in the second quarter. The new GDP figures are yet more evidence that the euro-zone economy is in a bad way. It is not only that growth is evaporating; inflation is also extraordinarily low. Matt O’Brien writes that it’s been six-and-a-half years, and eurozone GDP is still 1.9 percent lower than it was before the Great Recession began. It “only” took the U.S. economy seven years to get back to where it’d been before the Great Depression hit. Eurointelligence writes that until earlier this year, the eurozone’s macroeconomic development was a core vs. periphery story. If that had continued, the eurozone would have gone through a somewhat painful adjustment. But with core economies growth and inflation also low and falling, this is not happening. Brad DeLong writes that in the middle of 2011 it was possible to say that Germany had recovered from the crisis, that the remaining problems of southern Europe were the result of their own fecklessness, and that German growth was about to resume–it was wrong to say that, but it was possible. But we will soon have three years of no industrial production growth in Germany.
The Euro Catastrophe - Paul Krugman --- Matt O’Brien points out that Europe really is doing worse than it did in the Great Depression. Meanwhile, Francois Hollande — whose spinelessness and willingness to buy into austerity doomed his presidency and quite possibly the European project — is finally, tentatively, suggesting that maybe further austerity isn’t the answer. Simon Wren-Lewis thinks that the European embrace of austerity was a historical contingency; basically, the Greek crisis strengthened the hand of the austerians at a critical moment. I don’t think it’s that easy to explain; my sense was that there was powerful anti-Keynesian sentiment in Europe even before the Greek crisis, that macroeconomics as Anglo-Saxon economists understand it never had a real constituency in Europe’s corridors of power. Whatever the explanation, we are now, as O’Brien says, looking at one of the great catastrophes of economic history.
Balanced-budget fundamentalism: Europeans, and particularly the European elite, find popular attitudes to science among many across the Atlantic both amusing and distressing. In Europe we do not have regular attempts to replace evolution with ‘intelligent design’ on school curriculums. Climate change denial is not mainstream politics in Europe as it is in the US (with the possible exception of the UK). Yet Europe, and particularly its governing elite, seems gripped by a belief that is as unscientific and more immediately dangerous. It is a belief that fiscal policy should be tightened in a liquidity trap. In the UK economic growth is currently strong, but that cannot disguise the fact that this has been the slowest recovery from a recession for centuries. Austerity may not be the main cause of that, but it certainly played its part. Yet the government that undertook this austerity, instead of trying to distract attention from its mistake, is planning to do it all over again. Either this is a serious intention, or a ruse to help win an election, but either way it suggests events have not dulled its faith in this doctrine.
The Italian Runaway Train - There has been lot’s of debate in the press and in academic circles over the last week or so about whether Italy’s latest contraction constitutes a triple dip recession or simply a continuation of what’s been going on over many many years. This is an interesting theoretical nicety, but in fact what is happening in Italy at the moment goes a lot further than problems faced by a recession dating committee. The real issue that arises in the context of the Euro Area at the moment is a far more specific one. Will the ECB do QE? And if it does when will it push the button? And what could happen if it doesn’t. Perhaps a case study of the Italian case is worth the effort here. What is likely to happen to Italian debt if there is no ECB intervention soon? Let’s take a look at the dynamics. By now almost everyone and their grandad knows that Italy is back in recession following the 0.2% GDP contraction in the second quarter. Not only did this result suggest that Italy was now in a triple dip recession (or a twenty year decline), it also meant that GDP was back at the same level it had in 2000, when the country entered the Euro currency union.The problem is that Italy has an appallingly low trend GDP growth rate – possibly negative at this point – and nothing which has happened since the financial crisis ended suggests it is going to to improve radically anytime soon, in fact there are good reasons to think that growth could even deteriorate further.
Europe pessimistic on income equality as Americans cling to dream - FT - Most Europeans think their societies are far less equal than they are, while Americans are unusual in believing that their country is somewhat more equal than it really is. A German report sheds new light on the political challenges involved in tax, income distribution and social fairness and raises fresh questions in the equality debate recently revived by French economist Thomas Piketty. “The results of the study suggest that, in the political debate on income distribution, it is often not the facts that count but [perceptions],” says Professor Michael Hüther, director of the Cologne-based IW economic institute, which carried out the research. Judith Niehues is due to present her findings this week at Germany’s Lindau economic conference, attended by Nobel laureates. She compared actual and perceived income levels in the US and 23 EU countries, using economic data and an international social attitudes study based on polling about 1,000 people in each country. She found that people in Europe underestimate the proportion of middle-income earners and overestimate the proportion of the poor, commonly defined as people on incomes of 60 per cent or less of the median. Only the US has a more unequal income distribution than its citizens imagined, with many more poor people.
Spain Dips 37% Into Social Security "Piggy Bank", Fund Depleted in 4 Years at Current Rate; What, Me Worry? - The "recovery" news in Spain keeps piling up. Via translation from El Economista, Government has already taken 37% of the total 'pensions piggy bank'. If extractions continue at the current rate, the fund would be exhausted in 4 years. The Government of Mariano Rajoy has released 24.65 billion euros of the Social Security Reserve Fund in less than two years. Such amount represents nearly 37% of the total 66.815 billion fund accumulation. That figure marks the highest cumulative piggy bank draw-down in history, following its commissioning in 2000 and after eleven years in which successive governments did not need to dip into it. The situation changed dramatically with the height of the crisis. The current government has broken into the social security bank twelve times since 2012. The total amount withdrawn exceeds 24.6 billion euros while 54.69 billion remains. This implies "at the current depletion rate, in a period of four years or so, the fund would be exhausted". I am sure glad no one sees a problem here. As we all know, problems vanish if you ignore them. It's
Golden Dawn neo-nazis: The militia arm of the systemic establishment!” -- New evidence of the connection between the neoliberal leading party and Golden Dawn in Greece. “A provincial branch of the neonazi Golden Dawn party was bankrolled by a wealthy businessman who was a member of New Democracy and it enjoyed immunity from the police, a Golden Dawn defector has told a leading US human rights organisation. The unidentified man told Human Rights First that the businessman gave financial backing to Golden Dawn because he wanted it to do well in the 2012 elections so that New Democracy could end its uneasy coalition with socialist Pasok and team up with Golden Dawn instead.”“'Golden Dawn is the militia arm of New Democracy,' the businessman told the defector, who will be a witness in the forthcoming criminal case against leading Golden Dawn figures, which is due to start in November. He said the businessman also spent more than $1,500 (€1,100) on military outfits for its cadres.“The defector also told Human Rights First that his Golden Dawn unit enjoyed immunity from the police. 'The police had specific orders not to touch us,' he said, adding that when four Golden Dawn members attacked two Pakistani migrants and beat them 'really, really badly', he received a phone call from the local police chief who had ties to the local Golden Dawn boss and told him the case would not be investigated. 'Once they realised they could operate with impunity, they turned to intimidation for profit, evicting recalcitrant tenants and collecting debts,' the report continues.”
Europe Fears Banks Lack Cash Cushion to Cover Bad Loans - As Europe slogs through its latest round of bank stress tests, a growing number of analysts have already reached their own conclusion: Eurozone banks need additional cash.To buttress their case, some analysts have dusted off an obscure American bank metric that highlights the extent to which Europe’s increasing number of nonperforming loans is threatening to overwhelm existing bank cushions.The measure, called the Texas ratio, was developed by an analyst who covered troubled United States banks during the late 1980s and early 1990s. During that period, numerous Texas-based financial institutions collapsed under the weight of faulty real estate loans.Part of what has made the Texas ratio attractive to analysts and regulators is its simplicity. When the ratio of bad loans to equity and cash set aside exceeds 100 percent, it suggests that the bank is either ready to fail or is in desperate need of new capital — as was the case with Texas banks in the 1980s.“We found it to be a very good guide telling you which banks would fail,” “It’s a ratio that everyone can understand.”Now as the European Central Bank prepares to become the primary bank regulator in the eurozone, the extent to which lenders in troubled economies like Spain, Italy, Portugal and Greece have sufficient cash to protect against ever-rising bad loans has emerged as a crucial question for investors, banks and regulators.
Europe’s Lousy Bank Loans Expose the “Recovery” Myth -- William K. Black - One of the great lies of the financial industry is that it is the engine of Main Street’s growth. Giving the finance industry an enormous share of total business profits was supposed to super charge Main Street’s growth. It has never delivered on this promise. The truth is the opposite. The efficiency condition for a middleman like finance is that its size and profits should be minimized. Finance’s fraud epidemics blew up the world economy and devastated Main Street. Finance is a parasite that saps Main Street. The latest example of this comes in a New York Times article about European bank’s bad loans.The article contains this distressing sentence: “Since 2010, European regulators have sponsored two comprehensive stress tests, both of which were discredited after banks failed soon after each was completed.” Yes, just as stress tests for Fannie, Freddie, AIG, the big three Icelandic banks, the Irish banks, and Lehman failed to predict those failures. Gosh, it’s almost like stress tests were PR exercises involving no reliable review of asset quality or liabilities.“[Mr. Bastian noted] that in the March BlackRock report, nonperforming loans in Greece were estimated at 28 percent.Now, he says, ‘we are way beyond that level and have passed above the 34 percent threshold, totaling approximately 75 to 77 billion euros.’” To put those figures about the risking level of nonperforming loans during Greece’s “recovery” in perspective, a few percent default rate will normally cause a bank to fail if it is not bailed out. The nonperforming loans in Greece are very likely to default.
ECB's Draghi: Unemployment in the euro area - From ECB President Mario Draghi at Jackson Hole: Unemployment in the euro area No one in society remains untouched by a situation of high unemployment. For the unemployed themselves, it is often a tragedy which has lasting effects on their lifetime income. For those in work, it raises job insecurity and undermines social cohesion. For governments, it weighs on public finances and harms election prospects. And unemployment is at the heart of the macro dynamics that shape short- and medium-term inflation, meaning it also affects central banks. Indeed, even when there are no risks to price stability, but unemployment is high and social cohesion at threat, pressure on the central bank to respond invariably increases. The key issue, however, is how much we can really sustainably affect unemployment, which in turn is a question – as has been much discussed at this conference – of whether the drivers are predominantly cyclical or structural. As we are an 18 country monetary union this is necessarily a complex question in the euro area, but let me nonetheless give a brief overview of how the ECB currently assesses the situation.The first point to make is that the euro area has suffered a large and particularly sustained negative shock to GDP, with serious consequences for employment. This is visible in Figure 1, which shows the evolution of unemployment in the euro area and the US since 2008. Whereas the US experienced a sharp and immediate rise in unemployment in the aftermath of the Great Recession, the euro area has endured two rises in unemployment associated with two sequential recessions.


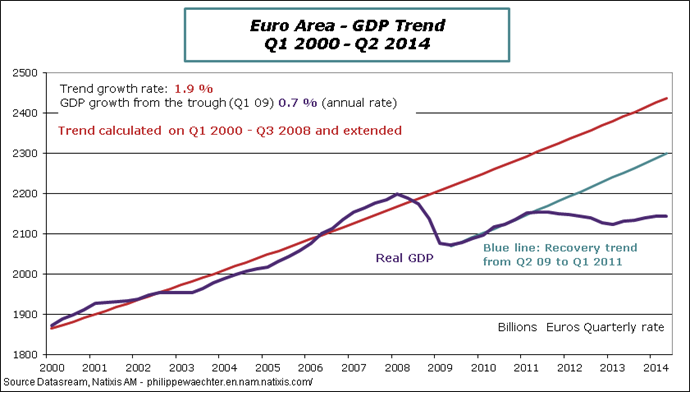
No comments:
Post a Comment