Fed's Balance Sheet Contracts In Latest Week (Dow Jones)- The Fed's asset holdings in the week ended Jan 4. stood at $2.920 trillion, down from $2.928 trillion reported a week earlier, the central bank said in a report released Thursday. Holdings of U.S. Treasury securities fell to $1.663 trillion on Wednesday from $1.672 trillion a week before. The central bank's holdings of mortgage-backed securities rose to $837.74 billion from $837.30 billion. Total borrowing from the Fed's discount lending window was $8.98 billion, down from $9.08 billion a week earlier, according to the report. There was no discount window borrowing by commercial banks, down from $42 million a week earlier. The Fed report showed that U.S. marketable securities held in custody on behalf of foreign official accounts was $3.402 trillion this week, down from $ 3.411 trillion the previous week. Meanwhile, U.S. Treasurys held in custody on behalf of foreign official accounts decreased to $2.671 trillion from $2.679 trillion the previous week. Holdings of agency securities fell to $731.31 billion, from the prior week's $ 731.80 billion.
FRB: H.4.1 Release--Factors Affecting Reserve Balances--January 5 2012
FOMC Minutes: Agreement to provide "projections of appropriate monetary policy" in January - From the Fed: Minutes of the Federal Open Market Committee, December 13, 2011 and conference call on November 28th. Excerpts: In their discussion of the economic situation and outlook, meeting participants agreed that the information received since their previous meeting indicated that economic activity was expanding at a moderate rate, notwithstanding some apparent slowing in global economic growth. Regarding the economic outlook, participants continued to anticipate that economic activity would expand at a moderate rate in the coming quarters and that, consequently, the unemployment rate would decline only gradually. The factors that participants cited as likely to restrain the pace of the economic expansion included an expectation that financial markets would remain unsettled until the fiscal and banking issues in the euro area were more fully addressed. Other factors that were expected to weigh on the pace of economic activity were the slowdown of economic activity abroad, fiscal tightening in the United States, high levels of uncertainty among households and businesses, the weak housing market, and household deleveraging. In assessing the economic outlook, participants judged that strains in global financial markets continued to pose significant downside risks.
Fed to Publish a Forecast of Rate Moves, Guiding Investors — The Federal Reserve will begin later this month to publish the predictions of its senior officials about their own decisions, hoping to increase its influence over economic activity by guiding investor expectations. The change was approved at the most recent meeting of the Fed’s policy-making committee, in December, but was kept secret until Tuesday afternoon, when the Fed released an account of the meeting after a standard three-week delay. The inaugural forecast, set for Jan. 25, will show the range of predictions made by Fed officials about the level of short-term interest rates in the fourth quarter of 2012, 2013 and 2014, although it will not list individual predictions. It also will summarize when they expect to start raising short-term rates, which they have held near zero since late 2008. And it will describe their plans for the Fed’s investment portfolio. According to the meeting minutes, “a number of members” of the 10-person committee “indicated that current and prospective economic conditions could well warrant additional policy accommodation, but they believed that any additional actions would be more effective if accompanied by enhanced communication.”
Fed Announcement on Communications Shift -- The minutes from the latest Federal Reserve meeting included an announcement about a shift in the central bank’s communications strategy. This is the relevant section of the release.
FOMC Decides to Focus on the Rudder, Not the Destination - The FOMC minutes from the December meeting reveal that starting this month the Fed will start publishing conditional long-term forecasts for the federal funds rate in its Summary of Economic Projections (SEP): At the conclusion of their discussion, participants decided to incorporate information about their projections of appropriate monetary policy into the SEP beginning in January. Specifically, the SEP will include information about participants' projections of the appropriate level of the target federal funds rate in the fourth quarter of the current year and the next few calendar years, and over the longer run; the SEP also will report participants' current projections of the likely timing of the first increase in the target rate given their projections of future economic conditions. So what to make of this new policy? One view is that it provides more certainty about the future path of the target policy interest rate. Consequently, it would easier to make long-term investment decisions and that added certainty by itself might add some stimulus to the economy. The long-term forecast could also be used as a back-door way to provide more monetary stimulus to the economy. The Fed could do this by lowering its long-term forecast of the target federal funds rate which could be interpreted as indicating greater than expected monetary stimulus in the future. This, in turn, would improve the economic outlook and thereby encourage households and firms to increase their spending today. In short, a lower forecast of the future target federal funds rates could raise current aggregate demand.
Confused about Communication about Improving Communication - Apparently the Fed do a poor job of communicating its new communications policy. David Altig tries to clear things up: In the interest of precision, by David Altig: As you may have heard, the minutes of the December 13 meeting of the Federal Open Market Committee (FOMC) contained the news that, starting with this month's meeting, committee members will be jointly publishing not only their personal projections for gross domestic product growth, unemployment, and inflation, but also the monetary policy assumptions that underlie those forecasts. In an article published earlier this week, the enhancement to these projections, known as the Summary of Economic Projections (SEP), was described in the Wall Street Journal this way (with my emphasis added): "Federal Reserve officials this month will begin detailing their plans for short-term interest rates, a move that could show that the central bank's easy-money policies will remain in place for years and give the economy a boost."I added the emphasis in both of those passages because I think the highlighted language isn't quite right. ... The minutes are pretty clear about what this information is intended to convey… and what it is not intended to convey (here too, emphasis added):...The broader point is that the new information in the SEPs, according to the minutes, is not intended to be a device for signaling the policy path that the FOMC, by official vote, intends to pursue.
Fed Watch: Still Cautious Heading Into 2012 - I have been hesitant to embrace the recent positive data flow - once bitten, twice shy perhaps. Something about the current dynamics that seems a little too familiar. Indeed, I felt something of relief when FT Alphaville came to a similar conclusion in the waning days of 2011. Cardiff Garcia reports on a Nomura research note that details a new bias in the seasonal adjustment process, noting: Up next, writes Nomura, you can expect exaggeratedly strong readings from the Chicago PMI later this month and the next ISM manufacturing survey at the start of January. I imagine it is premature to call the readings "exaggerated," but both did surprise on the upside, as much data has of late. Read the whole piece - it is worth the time. It seems reasonable to expect, at least as a baseline - a slow "recovery" that is really more of an adjustment to what appears to be the economy's new equilibrium path, one that is decisively subpar to the pre-recession trend. I don't believe that such an adjustment is necessary, as in my view it simply reflects a shortfall of aggregate demand. That said, the longer the cyclical downturn grinds on, the more likely it is that we will indeed see a new equilibrium path. A greater percentage of the cyclical unemployment will become structural unemployment or permanent shifts in the labor force participation rate. In addition, investments will go unmade as firms hoard cash. And, increasingly, policymakers will manage policy along the new equilibrium path, forgetting entirely the pre-recession path.
Latest Fed Transparency Move Draws Mixed Response - The Federal Reserve‘s latest move to open up the policy-making process is getting mixed reviews from economists, who are struggling to make sense of what the central bank is in fact planning to do, as well as what it can accomplish. On Tuesday, the minutes from the Fed’s December monetary policy meeting said the institution will now release its projections of its overnight fed-funds target rate, the traditional focal point of policy making. The forecasts will be made available four times a year, beginning with the Federal Open Market Committee meeting scheduled for the end of the month. The interest-rate outlook will join the projections of GDP, inflation and unemployment the Fed already releases.
Fed Primary-Dealer Survey Predicts Rate Increase in Second Quarter of 2014 - The Federal Reserve Bank of New York’s survey of primary dealers conducted before policy makers’ Dec. 13 meeting showed the firms expected the Fed to raise its benchmark interest rate during the second quarter of 2014. Respondents saw a 45 percent chance the first rate increase would occur in the second quarter of 2014 or later, according to the results posted today on the New York Fed’s website. The median among the predictions for the timing of the first increase was the second quarter of 2014, the bank said in a statement. The Fed has kept its benchmark interest rate near zero since December 2008. The December survey asked primary dealers the probability that central bankers would make changes to their public communications within the next year. Fed officials decided at the last meeting of the Federal Open Market Committee to start publishing their own forecasts for the central bank’s key interest rate, according to minutes of the gathering released yesterday. “While most dealers did not expect any policy changes at the December meeting, some suggested the FOMC could change its communication strategy, and a few saw a change in the guidance on the future path of the federal funds rate as likely,”
Large Banks Uncertain about Economy, Certain about QE3 - Fed - Some of the nation's most influential financial institutions might not know what U.S. GDP growth, inflation and employment data will look like in 2012, but they do know this: no matter what, the Federal Reserve will be there to keep pumping trillions into the world's financial system. A survey of primary dealers conducted by the Federal Reserve Bank of New York -- and released to the public Wednesday -- showed a great deal of uncertainty among the 21 large banks that act as counterparties to the Fed's open market transactions, with the survey noting the firms largely admitted their predictions for GDP growth, inflation and the unemployment rate in 2012 were slightly on the optimistic side. But by the same token, firms were nearly unanimous in believing the U.S. central bank's accommodative zero-interest rate monetary policy would last for at least 30 more months. Furthermore, the survey showed a strong belief that a new round of quantitative easing - the central bank's practice of flooding the financial system with cash by buying up illiquid securities - would occur within the year: the median view held the possibility of this happening in the next 12 months was 60 percent.
Here Is The Real Biggest News Out Of The FOMC Today - The biggest FOMC news released today was not the December minutes - there was absolutely no surprise there. The biggest news, by far, is that as we wrote a few weeks ago, the composition of the FOMC voting members changes drastically as of January 1, with Hawks Fisher, Kocherlakota and Plosser now out of the voting rotation, and replacing them will be the gaggle of ferocious doves Pianalto, Lockhart and Williams. In fact the only hawk left in the Fed as of today through the end of the year is Richmond Fed's Jeffrey Lacker who has shown substantial dovishness in the past. In other words, from a rotation of 7 and 3, the Fed is now uber-dovish by a 9 to 1 majority. So does this mean that printing is imminent? Stay tuned and find out in 3 short weeks: the January FOMC statement comes out on January 25. The only good news: Charles "the fire hydrant" Evans is finally out.
NY Fed to Release Advisory Panel Agendas, Minutes - Capping a week in which various parts of the central bank either announced or followed through on new efforts to disclose information, the Federal Reserve Bank of New York took another step along that path Thursday. The central bank’s most important regional arm announced it will start releasing agendas and meeting minutes from the host of advisory groups associated with the New York Fed. A number of those panels have little relationship to financial markets. But the ones that do include economic and monetary policy groups, as well as the Foreign Exchange Committee and others related to the plumbing of bond markets and the payment system. There could be a lot for Fed watchers to digest.
The Fed and Forward Guidance - The news from the December 13 FOMC minutes is in the very last part, following the policy decision, and relates to "forward guidance," i.e. information that comes from the FOMC about the future path for policy instruments. Here's the relevant passage in the minutes: After the Committee's vote, participants turned to a further consideration of ways in which the Committee might enhance the clarity and transparency of its public communications. The subcommittee on communications recommended an approach for incorporating information about participants' projections of appropriate future monetary policy into the Summary of Economic Projections (SEP), which the FOMC releases four times each year. In the SEP, participants' projections for economic growth, unemployment, and inflation are conditioned on their individual assessments of the path of monetary policy that is most likely to be consistent with the Federal Reserve's statutory mandate to promote maximum employment and price stability, but information about those assessments has not been included in the SEP....Following up on the Committee's discussion of policy frameworks at its November meeting, the subcommittee on communications presented a draft statement of the Committee's longer-run goals and policy strategy. Participants generally agreed that issuing such a statement could be helpful in enhancing the transparency and accountability of monetary policy and in facilitating well-informed decisionmaking by households and businesses, and thus in enhancing the Committee's ability to promote the goals specified in its statutory mandate in the face of significant economic disturbances.
Small and Large Footprints: Reserves and the Fed - As most economists are well aware, financial institutions in the United States currently hold a very large stock of reserves - deposit accounts with the Fed. The first chart shows the stock of reserves for the last five years. Before the financial crisis, the primary role of reserves was as a means of payment among large financial institutions. Commercial banks of course have to fulfill reserve requirements, but given financial innovation that allows banks to essentially bypass the requirements, it is most useful to think of reserve requirements as irrelevant in the United States. Pre-financial crisis, a stock of $5 billion to $20 billion in reserves was sufficient to support all intraday financial payments and settlement in the United States. It is important to note that this small quantity of reserves was funding a huge quantity of daily payments. Indeed, in 2008, the average daily value of transactions on Fedwire (using reserves) was $2.7 trillion, so the intraday velocity of reserves is immense. Since the financial crisis, as can be seen in the chart, reserves have grown to the neighborhood of $1.6 trillion - more than 100 times the typical stock of reserves in the pre-crisis period. What implications does this have? The typical view was that we were in the middle of unusual circumstances requiring unusual monetary policy interventions, but that these interventions would eventually be unwound.
Central banks: Crazy aunt on the loose - THERE was a time when the Federal Reserve wouldn’t say whether it had changed interest rates. Soon it will say where it thinks rates will be years from now. Beginning with its policy meeting on January 24th-25th, Fed officials will disclose when they expect to start raising their short-term interest-rate target, which is at near-zero now, and what they expect its path to be over the coming years. Behind such radical transparency is a grim fact: at the start of a fourth successive year of extraordinarily low short-term rates and a still-moribund economy, the Fed is desperate for new ways to stimulate demand. It is not alone. Of the rich world’s four major central banks, Britain’s and Japan’s already have their policy rates stuck near zero and the fourth, the European Central Bank (ECB), is likely to get there this year. Meanwhile, the balance-sheets of all four institutions have ballooned as they expand the volume and range of assets and loans they hold (see charts). Central banks have never been comfortable with unconventional monetary policies such as verbal interest-rate commitments and quantitative easing (QE), the purchase of assets by printing money. QE is “best kept in the locker marked ‘For Emergency Use Only’”, is how Charlie Bean, the Bank of England’s deputy governor, put it in 2010.
Question for Market Monetarists and MMTers: What Happens if IOR Goes to Zero? - For the non-cognoscenti: "IOR" is interest on reserves. Banks keep money in their accounts at the Fed. In October, 2008 the Fed started paying .25% interest on those accounts. The Fed's also engaged in "quantitative easing," a.k.a. open-market purchases on steroids, creating new money and using it to buy $1.6 trillion dollars worth of bonds from banks. The money is deposited in banks' reserve accounts. The result: banks have $1.6 trillion dollars in excess reserves (in excess of what they're required to hold) sitting in their accounts at the Fed. This is the heart of the "pushing on a string" argument -- giving the banks more reserves (making their holdings more "liquid") doesn't (necessarily) increase real-economy transaction volumes (on consumption or investment), either directly through spending by the banks or via bank loans to people and businesses who will spend it. This $1.6 trillion in new money issued by the Fed is effectively stuffed in an electronic mattress. So I'm curious what would happen if the Fed no longer paid IOR. I asked Scott Sumner this a while back: He gave a somewhat less than satisfactory answer: The IOR question is a good one, and at the risk of being annoying I’m going to slightly dodge the question. I do think it would be expansionary, but it’s hard to know how much, because it’s almost inconceivable to me that it would be done by itself, without any other policy changes. It could be slightly expansionary, or if accompanied by other moves, wildly expansionary.
Fed Secretly Bailing Out Europe - Former Vice President of the Federal Reserve bank of Dallas, Gerald ODriscoll, says that the Fed is secretly bailing out Europe: O’Driscoll wrote in a Wall Street Journal editorial: America’s central bank, the Federal Reserve, is engaged in a bailout of European banks. Surprisingly, its operation is largely unnoticed here. The Fed is using what is termed a “temporary U.S. dollar liquidity swap arrangement” with the European Central Bank (ECB). There are similar arrangements with the central banks of Canada, England, Switzerland and Japan. Simply put, the Fed trades or “swaps” dollars for euros. The Fed is compensated by payment of an interest rate (currently 50 basis points, or one-half of 1%) above the overnight index swap rate. The ECB, which guarantees to return the dollars at an exchange rate fixed at the time the original swap is made, then lends the dollars to European banks of its choosing.The two central banks are engaging in this roundabout procedure because each needs a fig leaf. The Fed was embarrassed by the revelations of its prior largess with foreign banks. It does not want the debt of foreign banks on its books. A currency swap with the ECB is not technically a loan.
ECB/Fed Support for the European Banking System – 750 billion USD, and counting - One point that I have been shouting from the proverbial roof tops in my research, to partners and colleagues is that 2012 may well be the year when all major central banks will be conducting both conventional and unconventional monetary easing at the same time. I think this is a very strong testament not only to the severity of the ongoing debt crisis in the developed world, but also to the propensity of central banks to choose inflation as the desired route to recovery. We need not initially discuss whether they are deploying the proper set of policies or even whether such policies represent moral hazard or a Ponzi scheme on government debt. The main thing is to realise that this is an unprecedented global monetary experiment. My message to investors in 2012 would then be not to underestimate this inflation bias by part of global central banks. Inflating your way out of too much debt won’t work in the long run without considerable defaults and/or economic stress (hyper inflation). Events since 2008 are ample evidence of this, but the simultaneous inclination to create inflation and debase your currency (to generate more inflation and exports) by all major central banks will continue to exert a profound effect on asset prices and the global economy.
Presenting The Exchange Stabilization Fund In 5 Parts: Is This The Real "Plunge Protection Team"? - When it comes to the fabled President's Working Group on Capital Markets, also known as the Plunge Protection Team, the myths about the subject are certainly far greater than any underlying reality. To be sure, vast amounts of popular folkflore has been expounded into the public arena, with most of it being shot down simply due to it assuming conspiracy theories of such vast scale that the human mind is unable to grasp the complexity, and ultimately the inverse Gordian Knot makes an appearance with the claim that vast conspiracies are largely untenable simply because it is impossible to keep a secret from so many people for so long. Yet what if the secret is not a secret at all but is fully out in the open, and is only a matter of interpretation, and contextualizing? Why just 3 years ago it would appear preposterous to allege the capital markets are a ponzi and that the Fed does everything in its power to keep stocks higher. Well, what a difference three years make: now the Chairman himself in a Washington Post OpEd has admitted that the sole gauge of Fed success is the loftiness of the Russell 2000, neither unemployment nor inflation really matter now that the Fed's third mandate has been fully whipped out. Furthermore, Keynesian economics, and the entire top echelon of the educational system have also been accurately represented as a paradigm which merely perpetuates the status quo as the alternative is the realization that the whole system is a house of cards. As for the global capital markets being nothing short of a ponzi, we merely point you to the general direction of Europe, the ECB and the continent's banks, where the monetary interplay is nothing short of the world's biggest pyramid scheme.
Bernanke Tells Lawmakers More Action Needed to Fix Housing - The U.S. Federal Reserve on Wednesday called for more action to stabilize the nation’s ailing housing market, warning that failure to do so could harm the broader economy. In a 26-page white paper sent to Congress, the Fed outlined several potential ways to stabilize the housing market, many of which are already under discussion or being implemented by the Obama administration and housing regulators. “Restoring the health of the housing market is a necessary part of a broader strategy for economic recovery,” Bernanke said in a letter to the top lawmakers on the Senate Banking and House Financial Services committees. The paper noted “there is unfortunately no single solution for the problems the housing market faces,” as tight standards for mortgage lending, a 33% decline in home prices since 2007 and a huge number of vacant foreclosed homes on the market make it hard for the housing market to recover. “Continued weakness in the housing market poses a significant barrier to a more vigorous economic recovery,” the paper said. Without action, the paper warned, “the adjustment process will take longer and incur more deadweight losses, pushing house prices lower and thereby prolonging the downward pressure on the wealth of current homeowners and the resultant drag on the economy at large.”
Fed’s Dudley: Housing and Monetary Policy Are Complements - In a speech calling for a host of policy actions to aid the housing market, a top Federal Reserve official also said Friday the central bank may have to provide more stimulus to help the economy. “Because the outlook for unemployment is unacceptably high relative to our dual mandate and the outlook for inflation is moderate, I believe it is also appropriate to continue to evaluate whether we could provide additional accommodation in a manner that produces more benefits than costs, regardless of whether action in housing is undertaken or not,” Federal Reserve Bank of New York President William Dudley said. He noted that as the Fed tries to aid the economy, and address the central role the weak housing market plays in impeding the recovery, the institution cannot go it alone. He said, “monetary policy and housing policy are much more complements than substitutes.”
Fed’s Bullard: Central Bank ‘Very Close’ to Adopting Inflation Target - The U.S. central bank may well get an inflation target this year, a top Federal Reserve official said Thursday. “We are very close” to tying monetary policy explicitly to some measure of overall inflation, Federal Reserve Bank of St. Louis president James Bullard said. He said the Fed may also be near making a collective statement about what level of unemployment is the natural rate, below which inflation pressures tend to rise. Bullard was interviewed Thursday on Bloomberg radio. The official isn’t currently a voting member of the monetary policy setting Federal Open Market Committee. Bullard has been skeptical of the need for additional stimulus for the economy, even as many in the markets believe the odds remain high the Fed will provide more stimulus at some point over the next year. He spoke in the wake of the release this week of the meeting minutes from the Fed’s December meeting. That document said that starting at the end of the month, the Fed will begin making public its forecasts of future Fed interest rate policy, joining the projections it already makes available on growth, employment and inflation.
Is Joblessness a Skills Problem or an FOMC Problem? - Among Lacker’s duties as President of Richmond Federal Reserve Bank is writing a message in the bank’s quarterly publication Region Focus, the third quarter edition of which I found in my mailbox yesterday. Knowing that Lacker has just become one of the most important people on the planet, I was curious to find out his thoughts at the start of his year on the FOMC. My reading of Lacker’s message in the second quarter Region Focus was not exactly an uplifting experience (see this post from October), but I try to look for glimmers of hope wherever I can find them. Sadly, Dr. Lacker’s message, entitled “Is Joblessness Now a Skills Problem?” offers nothing hopeful. Lacker begins by painting a bleak picture of the plight of the long-term unemployed. Today long-term unemployment – that is, unemployment lasting six months or longer – is at a record high. The share of unemployed Americans whose job searches have lasted this agonizingly long is 43.1 percent, a figure that is unprecedented since the Bureau of Labor Statistics began keeping records in 1948. His explanation? A growing number of observers have argued that this state of affairs is caused in significant part by a mismatch between available jobs and available workers, especially a mismatch in skills.
Senate Republicans Could Delay Fed Confirmations Over Recess Appointment Fight - President Barack Obama‘s contentious decision to use a recess appointment to install the first director of a new consumer financial agency could result in delays to Senate confirmations of two recently announced appointees to the Federal Reserve Board, two Senate Republican leadership aides said. A top GOP member of the Senate Banking Committee stopped short of saying he would personally block the confirmations of the two Fed nominees, but predicted there would be a Republican reaction to the move by Obama that could affect outstanding nominees. “Clearly, this is a very bold and extraordinary, unconstitutional move, and it’s going to provoke a reaction from Republican senators,” Sen. David Vitter (R., La.), who sits on the banking panel, said in an interview. “It brings up all sorts of possible reactions, including [delaying confirmation of] the nominations that may have otherwise have happened.”
How to Save the Global Economy: Whip Up Inflation. Now. Recovery from a debt crisis is always painfully slow, for reasons both economic and political. Creditors need to rebuild their balance sheets and are unwilling to make potentially risky loans. Debtors need to boost savings to cover their debts and are unwilling to resume spending. At the same time, debt-ridden countries collapse into political conflict over the question of who will pay to get them out of the red: Should it be taxpayers, bankers, public workers, or investors? A bit of inflation can help on all these fronts. So long as the debts are denominated in national currency and interest rates are kept low by monetary policy, inflation reduces the real debt burden. This is, to be sure, a forced restructuring that puts some of the onus on creditors -- but that is almost always the outcome of more explicit negotiations in any case. When most of the debts are household debts, as they are in the United States and parts of the eurozone, it is not really feasible to renegotiate millions of mortgages and consumer loans; inflation takes care of that for the whole economy. It mitigates some of the political conflict and lessens some of the economic burden.
A Call for Action: Conditional Inflation Targetting - Menzie Chinn - [We need] inflation -- just enough to reduce the debt burden to more manageable levels, which probably means in the 4 to 6 percent range for several years. The Fed could accomplish this by adopting a flexible inflation target, one pegged to the rate of unemployment. Chicago Fed President Charles Evans has proposed something very similar, a policy that would keep the Fed funds rate near zero and supplemented with other quantitative measures as long as unemployment remained above 7 percent or inflation stayed below 3 percent. Making the unemployment target explicit would also serve to constrain inflationary expectations: As the unemployment rate fell, the inflation target would fall with it.Today our highest priority should be to stimulate investment, growth, and employment. Raising the expected inflation rate will lower real interest rates and spur investment and consumption. It will also make it difficult for the de facto dollar peggers, such as China, to sustain their policies. The resulting real depreciation of the dollar would stimulate production of U.S. exports and domestic goods that compete with imports, boosting American production. The United States would get faster growth, an accelerated process of deleveraging, a quicker recovery, and a firmer foundation upon which to address long-term fiscal problems.
Menzie Chinn Explains it All for You: Demand Inflation Now! - Whether it's Market Monetarist NGDP targeting or Menzie's recommendation of Conditional Inflation Targeting with a notably higher target, everything tells us that somewhat higher inflation is the current path to greater and more widespread long-term prosperity. Raising the expected inflation rate will lower real interest rates and spur investment and consumption. It will also make it difficult for the de facto dollar peggers, such as China, to sustain their policies. The resulting real depreciation of the dollar would stimulate production of U.S. exports and domestic goods that compete with imports, boosting American production. The United States would get faster growth, an accelerated process of deleveraging, a quicker recovery, and a firmer foundation upon which to address long-term fiscal problems. Like the market monetarist approach, Chinn's proposal is basically for an automatic stabilizer based on unemployment levels, that anchors expectations:Making the unemployment target explicit would also serve to constrain inflationary expectations: As the unemployment rate fell, the inflation target would fall with it.As I said a while back: Automatic stabilizers are the key to effective 1) policy and 2) expectation-setting. Because 1) They happen, and 2) People know they’re gonna happen. In other words: Demand Inflation Now! Up the Real Economy
Looking Forward in the New Year: Crowding Out and Hyper-Inflation Watch - Menzie Chinn - In my previous post, I cited Jeff Frieden's and my proposal for a conditional inflation target. Yet, according to several observers, we are either on the brink of crowding out due to elevated government deficits [0], or high to hyperinflation, due to monetary base expansion [1]. As has been noted, none of these outcomes have yet materialized, despite months of such warnings. [2] [3] Here, I wanted to evaluate where market expectations stand on these views. As of December 28, constant maturity yields on five and ten year Treasury bills are at an all time (post-War) low. According to the Fisherian relationship, the nominal interest rate is the sum of the ex ante real interest rate and the expected inflation rate. What do real interest rates look like? One can proxy real interest rates by examining yields on Treasury inflation protected securities (TIPS).Well, it is likely that real interest rates would be lower in the presence of smaller deficits. However, with long term real interest rates negative (and persistently so for the bulk of 2011), it’s not clear that would be such a wonderful thing if lower deficits are associated with less economic activity.
Fractional Money Multipliers - Rebecca Wilder - Money multipliers – the stock of money divided by a measure of base money (generally reserves plus currency in circulation) – are dwindling to fractions of what they used to be. FT Alphaville draws our attention to this fact on the Euro area (EA) using SocGen’s analysis. The money multiplier is a representation of how much credit is leaving the banking system via lending and growth (or inflation) enhancing monetary activities. As FT Alphaville points out, the EA M3 multiplier is just over 3/4 its average 2007-2008 level, 7.67 vs 10. But this is global!. The US M2 money multiplier is a little over 2/5 the size of its average 2007-2008 level, 4.1 vs. 9.3. By this simple measure, I’d say that the US is in worse shape than is the EA. Of note, my visual is a bit different from that in FT Alphaville. Specifically, I don’t agree with SocGen’s estimates that the EA money multiplier drops in December to roughly 6. Given that December 2011 EA base money has been published, a 6.2 M3 multiplier implies that M3 dropped by 15% in 1 month. That’s unlikely.
Foreign central banks cut US treasuries - Holdings of US Treasuries by foreign central banks has fallen by a record amount over the past four weeks according to the latest Federal Reserve data. The net $69bn drop in Treasury holdings registered at the Fed by foreign official institutions comes as benchmark yields ended 2011 near record low levels and when the US central bank is conducting Operation Twist, its $400bn programme to sell shorter-lived Treasury bonds and buy those with longer maturities. The decline in foreign holdings of Treasuries in recent weeks has not resulted in higher yields and lower prices because other investors have sought the safety of US debt. “Given where the 10-year Treasury is ending the year, it’s difficult to say the flows are a bearish move,” . The yield on 10-year notes was set to end 2011 below 1.90 per cent on Friday and the Barclays Capital index of long-dated Treasuries has rallied nearly 30 per cent this year, its best annual performance since 1995. “While other buyers have willingly taken up the torch up to this point, it seems clear that this [foreign official flows] source of demand has waned since Operation Twist took yields to these levels and this investor base has little interest in sub-2 per cent 10-year yields,” .
Top 5 Economic Charts of 2011 - As the year draws to a close, Real Time Economics takes a look back at five of our favorite charts from the WallStreetJournal in 2011. These graphics look at the most recent year as well as the past to give us some insight into the future. Click on any image for larger version.
Smithianism and Its Discontents - Matt Yglesias pens an extremely readable version of the Smithian view on the near future of the US economy. What will this recovery look like in concrete terms? Total bank credit, which collapsed during the crisis, is growing again and will keep growing. That will make it easier for Americans to buy new cars and reverse the four years of growth in the average age of America’s passenger vehicles. Families will also invest in other kinds of durable goods—refrigerators, washing machines, etc.—that they’ve been hesitant to upgrade or replace. The housing bust, meanwhile, has been followed by an epic construction slump that’s actually left us with a shortage of homes. But every downward tick in the unemployment rate is another twentysomething moving out of his parents’ basement, stimulating a return to a more normal level of construction. Multifamily housing starts are already up 80 percent over the past year to accommodate the likely coming flood of renters, and there’ll be more to come once people have more cash in their pockets. Not everyone is convinced. Kelly Evans writes Along with nascent signs of recovery in the housing market, it is tempting to forget about 2011′s disappointments and think 2012 will be the year economists aimed not too high, but too low. Trouble is, recent history suggests it usually turns out the other way around.
I Just Got Here, but I Know Trouble When I See It — From 6 Economists, 6 Ways to Face 2012 : BELIEVE it or not, times are getting better. At least that’s what the dry statistics keep telling us. Industrial production, G.D.P.1 — the kind of figures that Washington and Wall Street sweat over — suggest that the economy is on the mend. Yet if we go beyond the Beltway and the Battery, to where most of American life is lived, the numbers don’t always add up. Yes, the Great Recession officially ended in 2009. But many millions of Americans are out of work or cannot find full-time jobs. Home prices are wobbly. The foreclosure crisis drags on. And the Occupy movement’s campaign against “the 1 percent” has underscored the ravages of income inequality2. It was, as always, a year of ups and downs in business. Washington said the nation’s AAA rating was safe, but Standard & Poor’s concluded that it wasn’t. Europe insisted that its currency was sound, but investors worry that it isn’t. Wall Street seemed perpetually on edge. After so many wild days, the American stock market ended 2011 about where it began. On this side of the Atlantic, aftershocks of the financial crisis of 2008-9 are still reverberating, though the worst has passed. Now, how Europe’s economic troubles play out may determine whether job growth here finally picks up enough to make up for all the lost ground — and whether that 401(k)3 is richer or poorer next Jan. 1.
In With The New: Part III of As Economic Growth Fails, How Do We Live? -- Part I of this series of three articles addressed the four major challenges we now face, there dubbed "The Four Horsemen of the Economic Apocalypse": 1) Too Much Debt; 2) Resource Limits; 3) Destruction and Decay of Infrastructure; and 4) Greed. Bottom line: this crisis is much deeper and more permanent than we've been led us to believe. "Recovery" to former patterns of growth simply won't happen. We must now adapt to new realities, as individuals and as a society. Part II of this series, "Out With The Old", discussed the end of seven "Dead End" unsustainable practices that will falter and decline. We won't pay our unpayable debts or keep impossible promises. We can't keep importing more than we export and borrowing the difference. Our Empire will shrink back. Our use of fossil fuels will decline as we experience Peak Oil and Peak Coal . We must cure Sick Care. We will repeal laws that mandate opulence and forbid prosperity. Finally, we will "drop the shopping" for worthless junk and refocus on the best of what it means to be human. In this third and final article in this series, we will discuss seven new ways of living which we can adopt as economic growth fails. They are not revolutionary (revolutions never achieve their utopian visions because of something called "human nature"). Rather, they may allow us to "muddle through" the best we can right now with what we already know how to do.
PIMCO Outlook - Towards the Paranormal - Bill Gross - How many ways can you say “it’s different this time?” There’s “abnormal,” “subnormal,” “paranormal” and of course “new normal.” Mohamed El-Erian’s awakening phrase of several years past has virtually been adopted into the lexicon these days, but now it has an almost antiquated vapor to it that reflected calmer seas in 2011 as opposed to the possibility of a perfect storm in 2012. The New Normal as PIMCO and other economists would describe it was a world of muted western growth, high unemployment and relatively orderly delevering. Now we appear to be morphing into a world with much fatter tails, bordering on bimodal. It’s as if the Earth now has two moons instead of one and both are growing in size like a cancerous tumor that may threaten the financial tides, oceans and economic life as we have known it for the past half century. Welcome to 2012.
Welcome to the Paranormal Economy: Why One Investor Says the ‘New Normal’ Is Over - Bill Gross, the prominent bond fund manager who is credited with popularizing the phrase a little more than two years ago, says he may be done using the term. What phrase does Gross prefer to describe the current state of our money affairs? The Paranormal economy. In a letter to investors that came out this week, Gross says we may be leaving The New Normal behind. Gross says he used The New Normal to describe the deleveraging, i.e. getting rid of our debts, that needed to go on in the aftermath of the financial crisis, and everything that went with it. For consumers, money that was going toward buying a new car or second house was now going to be used to pay down debt. So more frugal customers. Banks would make fewer loans, and less profit, because no one was going to trust borrowers again. Houses would lose their value, due to a lack of mortgages and a pile up of foreclosures as borrowers walked away from their home loans. Renting, too, would become part of The New Normal. So what makes Gross believe we are entering The Paranormal economy? Basically the fact that interest rates have remained low for such a long period of time, and it appears may stay that way for some time. And here comes the paranormal: Typically, low-interest rates spur more borrowing. But Gross says not so this time around. That’s because banks won’t want to make loans. Low-interest rates, not just for short-term loans but for ones that don’t have to be paid back for 5 or 10 years, will make lending unprofitable. It might make investing not all that attractive either. Why risk your money in the market when it’s not going to go anywhere.
GEAB N°60 is available! Global systemic crisis – USA 2012/2016: An insolvent and ungovernable country: As announced in previous GEABs, in this issue our team presents its anticipations on the changes in the United States for the period 2012-2016. This country, the epicentre of the global systemic crisis and pillar of the international system since 1945, will go through a particularly tragic in its history during these five years. Already insolvent it will become ungovernable bringing about, for Americans and those who depend on the United States violent and destructive economic, financial, monetary, geopolitical and social shocks. If the United States today is already very different from the "super-power" of 2006, the year the first GEAB was published, announcing the global systemic crisis and the end of the all-powerful US, the changes we anticipate for the 2012-2016 period are even more important, and will radically transform the country's institutional system, its social fabric and its economic and financial weight. In addition we also detail our recommendations on foreign currencies, gold, stock exchanges and the consequences of the United Kingdom’s marginalization within the EU (3) on the Pound, Gilts and UK debt and we set out some advice on developments of the American institutional system (4). In this public communiqué we have chosen to present an excerpt from our anticipation on the changes in the United States for the 2012-2016 period. But before addressing the American case, we wish to review the situation in Europe (5).
2012 Forecast: Bang and Whimper - On close examination, the industrial world underwent complete zombification in 2011. Its member states and their institutions are now lurching across the stage of history like so many walking dead. Whole European nations are dead, their citizens squirming around the ruined bones of failed speculative condo projects, housing estates, and luxury hotels like botfly larvae. The USA lies in complete moral ruin despite the exertions of ten thousand evangelical preachers in dusty back-road tilt-up chapels from Texas to Carolina, several new museums of Creation Science, and the shining example of former Senator Rick Santorum. Just look at how we behave, from the cloakrooms of Congress to the piercing parlors of West Hollywood to the 7-Elevens of suburban Maryland: a nation of thieves, racketeers, reality TV sluts, wannabe road warriors, light-fingered gangsta-boyz, and crybabies living in an anomie-drenched decrepitating demolition derby landscape of failure. When everybody is a zombie, whose brains are left to eat? Echo answers.... On to the predictions for 2012 then.
Goldman's Jim O'Neill: 'What Can Go Wrong, Will Go Wrong' - Jim O'Neill, Chairman of Goldman Sachs Asset Management, is out with his latest Viewpoints From The Office Of The Chairman letter. He published his 11 predictions for 2012 back in mid-December, but he spends nearly a third of his new note dwelling on 2011. To cover his bases, he points out a few things that could potentially go wrong this year. By definition, lots of things could go wrong, possibly including a fresh rise in crude oil prices, especially if Iran plans to cause a lot of fun and games early this year. Against this, and read Roger Altman in today’s London Financial Times for an up- to-date view, the energy supply response in recent months is probably still much stronger than many people realize. I suspect that, short of a major problem in the Gulf, this is an overhyped topic – yet again. As for Europe, I shall leave much of this until coming days and weeks as there is so much out there. Of things that really can go wrong, the Greek debt restructuring strikes me as one of the most likely. As for the coming downgrades, I am not sure they will really matter much, and I would certainly suggest the generosity of the ECB’s pre-holiday 3-year LTRO (Long Term Refinancing Operation) to be much more important in keeping things afloat. Plenty more on this topic to come. His note also discusses the recent positive global economic data and addresses a recent BRIC paper authored by Goldman's Dominic Wilson. You can read his whole letter at GSAM.
Euro Zone Isn’t Only Potential 2012 Boogey Man - For those obsessed with the euro-zone debt crisis and its impact on 2012, keep this in mind: so much else could go wrong. Here are three more to add to the list. First, U.S. consumers pull back again. U.S. households have been resilient which has lifted global producers. But future spending will depend on better job growth and incomes growing ahead of prices. If payroll gains disappoint, or energy or food costs spike again, then consumers will have to pull back on other spending. Slower demand will not only hurt U.S. companies, but also fall back on foreign producers who count America as their biggest market. Second, a U.S.-China trade war breaks out. China has slowed down. If growth drops more than expected and social unrest increases, Beijing might react by blaming U.S. regulations for the loss of work. Trade skirmishes are bad anytime, but they will be more dangerous in a year when Washington politicians will want to look tough on China. A full-blown trade war also risks higher U.S. interest rates if China slows its purchases of Treasury debt. Last but not least, fiscal policy blunders big-time. Never underestimate the ability of Washington to screw up the economy if political points can be scored.
2012 As 1937 Redux? - Why, with all the talk of America's need to get its spending under control, would radical austerity be a problem? The answer can be structured in many ways, but today we'll go with a historical lesson, circa 1937. Back in 1937, the deleveraging process was even longer and harder in every measure than it is today. By 1937, modest growth had returned, and while unemployment remained stubbornly high at just under 10 percent, that was down from a peak in 1932-33 of 25 percent. At this point, both the Fed and the Roosevelt administration—giving in to orthodoxies that still haunt US economic thought—made terrible, independent errors. FDR acceded to Treasury advisors who declared the recovery self-sustaining and pushed for spending cuts. FDR, by now in complete control of the congressional agenda after a landslide reelection in 1936, duly cut government spending by 10 percent in an effort to balance the federal budget. The Federal Reserve, meanwhile, had been rattled by recent gyrations in commodity prices, particularly in corn and wheat—crops devastated by the Midwestern Dust Bowl. Acting to tame what it saw as the threat of hyperinflation, the Fed raised interest rates sharply. Various economic schools assign different weight to these two decisions, but the overall math is devastatingly clear. By 1938, joblessness had shot back toward 15 percent, industrial production fell by 37 percent, and the worst double dip in US history had begun.
The Peltzman Effect: Why Economic Growth Has Slowed in the US Over Time - In recent years, there have been a number of studies showing that generational income mobility is particularly low in the US. To quote this 2006 study by Tom Hertz: By international standards, the United States has an unusually low level of intergenerational mobility: our parents’ income is highly predictive of our incomes as adults. Intergenerational mobility in the United States is lower than in France, Germany, Sweden, Canada, Finland, Norway and Denmark. Among high-income countries for which comparable estimates are available, only the United Kingdom had a lower rate of mobility than the United States. Hertz provides this handy chart: Most of the "big government" countries that compare favorably with the US on intergenerational mobility also do pretty well on measures of entrepreneurship. The following snapshot comes from this paper by Acs and Szerb: While studies are, no doubt, imperfect, I've seen similar results before and they seem credible to me. The studies note, essentially, that the US is not, for many, the land of opportunity it is touted to be, and is now being beaten out by countries like Denmark and Canada. Big government countries, countries where Americans seem to believe people aren't motivated to get off their duff, are actually quite entrepreneurial and offer offer their citizens a lot of opportunity.
First Core Dump of 2012 - Auto Sales Seem to have ended the year strong but not quite as strong as I might have thought. I was looking for continued gain, up to 13.8M SAAR or so and it doesn’t look like we will see that. Construction ended the year completely as expected, up slightly mainly on residential multifamily. Public construction seems to have stopped falling and this is consistent with my view going forward. We should see sales tax receipts improve for state and local governments and with that a willingness to fund more projects. Non-residential construction will probably continue to be driven by oil exploration well into 2012. The office market just doesn’t feel ready to come back. Though we might see increased hospital construction. I would have to look more into that. Oil: Kevin Drum makes the point that the global economy is energy constrained. I think that is correct and it underlies some of views about US energy policy. I don’t think we are likely to see “many" wild swings in oil prices, though. Such swings generate a huge arbitrage opportunity. To take advantage of it what you need is a place to store excess capacity. Oil – being the accommodating resource that it is – provides that naturally. We call it the ground.
US economic data sees ‘reversion to mean’ - From a Europe mired in an unresolved sovereign debt crisis and in the midst of trying to recapitalise its banking sector, all this positive US economic data is frankly just irritating. In fact it’s been so good in terms of positive employment and manufacturing metrics that the Rates & Currencies team at BofAML published a piece entitled “The USA a safe haven again” with this line in it: In the US, the correlation between strong data and the USD has flipped, where now positive US data surprises are good for the USD given European concerns. Flipping the correlation around?! All sorts of strategies break when people make ridiculous assumptions and bake them into models that happens. But anyway, the Economics team at BofAML have a few reasons why you should think twice before boarding the optimism train. First, from a note published on Thursday: With economic shocks from Japan’s tsunami and the Arab spring fading alongside a modest abatement of the uncertainty from Europe and the US, businesses have increased hiring to meet the underlying pick-up in final demand. The confluence of the employment data released for December – better ISM, stronger confidence, lower jobless claims, and better than expected ADP – is consistent with a steady improvement in the labor market… In other words, think more “recovery from shocks”, and add to that the easing off from the higher commodity prices seen at the beginning of 2011.
As Good as It Gets for the Economy? - The economy was weak in 2011, but it ended better than it started, with growth up from its lows and unemployment down from its highs. The question now is whether that progress will continue into 2012. We wish we could say yes, but unless policy makers are incredibly lucky or remarkably adept — certainly not the description that comes to mind when thinking of, say, Congress — the answer is no. When data is released later this month, economists expect growth of around 3 percent for the last quarter of 2011, compared with 1.2 percent on average in the first three quarters. But there is little in the latest growth spurt to signal a self-reinforcing recovery going forward. Holiday shoppers had more cash to spend because of the decline in oil prices, not a rise in wages. A drop in the jobless rate was driven by a mix of new hiring and a large number of potential workers who gave up futile job searches. Signs of life in the housing market, including more sales, were dampened by falling prices as foreclosures continued. The way to revive sustainable growth is with more government aid to help create jobs, support demand and prevent foreclosures. As things stand now, however, Washington will provide less help, not more, in 2012.
The decline of the American empire - The US has the world's biggest economy, the most influential culture, and the most potent military machine, with a budget that equals that of all other nations combined. It is the only power with a global project defended and supported by more aircraft carriers, Fortune 500 companies, and more successful media-tainment conglomerates than any other. But the last decade has been problematic for the world's only superpower. America's post-Cold War optimism has given way to pessimism, forecasting a declining power and more crucially, the end of "the American era". The rise of new regional and global powers, coupled with Washington's recent war fiascos and financial crisis have worsened the outlook for the future of the US.
Leading Indicators Index Gets Overhaul - Private research group the Conference Board said Thursday that it’s putting in place some major changes in how it compiles a closely watched report that seeks to provide clues to the economy’s future direction. The release in question is the long-running monthly index of Leading Economic Indicators, which is getting its first big overhaul since 1996. The index is made up of a mix of already-announced statistics, and in a bid to make the report more reliable, the Conference Board is swapping out some of the old components and replacing them with new data points. The changes take effect in the report scheduled for release Jan. 26. “These adjustments have been designed to make the U.S. Leading Economic Index an even stronger predictor of peaks and troughs in the business cycle, while recognizing changes in the functioning and drivers of the economy in the short and medium term,” Conference Board chief economist Bart van Ark said in a press release. The firm said it will remove the M2 money supply measure and replace it with something entirely new, which it dubbed the “Leading Credit Index.” The Conference Board said the Leading Credit Index is made up financial market indicators including bond market yield curve data, interest rate swaps and data extracted from a periodic Federal Reserve survey of bank lending.
Tim Duy on the Output Gap - He writes The trend of nondruable goods spending is tracking the pre-recession trend. So, at this point, we are seeing overall consumption supported by a rebound in durable goods spending that offsets a deterioration in the path of spending on services. The bounce in durable goods spending will come to an end at some point, as 16 million units is likely an upper bound for auto sales. Will service spending accelerate to compensate? Or will we see a new normal, with a constrained consumer spending at a path and rate below those prior to the recession? But that still is not a story that rapidly returns the economy to potential output. These are the trends but I don’t know exactly what to make of them. For one, looking at PCE services is a nightmare because so much is housing, finance and medical care. Most of which consumers do not pay for directly and none of which is chosen on a month-by-month basis. The larger issue though has to do with why we think the economy is depressed. If you think that practically speaking the nominal interest rate is too high then is hard to see a world where autos come back to 16 million units, construction comes back to 1 million units and the economy, the Fed is accommodative and the economy is not booming.
Let's Build a Second Measure of Economic Strength - Here's a tale of two equations that represent human exchange. The first is the standard macroeconomist's recipe for an economy: Y = C+G+I+NX. It says: output equals consumption, plus government expenditure, plus investment, plus net exports. Now here's a crude approximation of what eudaimonia might look like: W = N+F+I+H+S+E+O. It says: real human welfare equals natural capital, plus financial capital, plus intellectual capital, plus human capital, plus social, emotional, and organizational capital. Not all these kinds of wealth are created equal; I'd suggest that higher-order wealth, to the right, is scarcer, stickier, more enduring, and more productive. The first equation might be said to neatly represent the industrial-age paradigm of business: the implicit question it answers is maximizing the volume of output or "product." But the second answers a very different question. It's our economy's real balance sheet.
Global financial fiasco: End of the age of US economic dominance - In the spring of 2008, the real estate bubble popped in the United States and it triggered a financial tsunami that engulfed the entire globe. This catastrophe provided an opportunity for change, change that was necessary to restructure the economic architecture of the US Despite the hefty promises made by President Obama during his election campaign, upon taking office he did the complete opposite of what was expected, or to be precise, hoped for, and succumbed, as his predecessors did, to the same interests that were responsible for the catastrophe. Instead of seizing the opportunity, all policies implemented after 2008, were geared towards maintaining the status quo. These polices have exacerbated the magnitude of a crisis that will take effect anytime after 2012.After the 1907 panic, influential bankers agreed to establish the Federal Reserve by 1914. The Fed is a “private” central bank that controls U.S monetary policy, acts as the lender of last resort and its shareholders consists of corporate banks. In addition, it is excluded from independent audits and congressional oversight. The monetary policy of the Fed is the core factor why the US economy is currently on an unsustainable path.
New Asian Union Means The Fall Of The Dollar - One of the most frustrating issues to haunt the halls of alternative economic analysis is the threat of misrepresentative terminology. For instance, when the U.S. government decided to back the private Federal Reserve in lowering the interest rates on lending windows to European banks last month, they did not call this a bailout, even though that’s exactly what it was. The chain of financial events taking place over the past decade in Asia have been correspondingly mislabeled and misunderstood. What some economists see as total collapse is actually a new and decidedly prophetic (or engineered) transition. What some naively see as the “natural” progression of globalism, is actually a distinctly deliberate program of centralization meant to further the goals of world economic and political totalitarianism. Asia, and most especially China, is a Petri dish for elitist psychopaths. What we see as suffocating collectivism in this region of the world today is the exact social schematic intended for the West tomorrow. Call it whatever you will, but on the other side of the Pacific, like the eerie smile of a sinister clown, sits fabricated fate.
Euro could become world's leading currency: Noyer (Reuters) - The euro could become the world's leading currency in the next decade if leaders of the single-currency bloc succeed in tightening fiscal integration, European Central Bank policymaker Christian Noyer said in an article to be published in the Journal du Dimanche. European leaders struck a historic deal at an emergency summit in Brussels on December 9 to draft a new treaty for deeper economic union, in an attempt to stem the debt crisis that is threatening to cause the collapse of the single currency. The news temporarily calmed markets. But concerns quickly resurfaced as the final details of the agreement have yet to be determined and a new treaty could take up to three months to negotiate. Ratings agency Fitch has said it doubts a comprehensive solution to the crisis can be found and urged more decisive action from the ECB. "If we implement all the decisions taken at the Brussels summit we will emerge stronger," Noyer said in the article, due to be published to coincide with the 10-year anniversary of the euro on January 1.
Dream of Universal Currency Just Won't Die - The euro zone maelstrom refuses to end. Thanks to the debt crisis, some Greek officials are contemplating dumping the common currency for the drachma. Meanwhile, Italy and Spain teeter. A decade after the shared currency was heralded as a 21st-century tool for peace and prosperity, it turns out that currency unions aren’t such a hot idea. Not so fast, though. This is undeniably a period of epic turmoil, and many economists will tell you that sovereign states need sovereign currencies—full stop. But this notion ignores a fundamental truth: Countries with their own currency may have monetary independence, but in reality—as gun battles in Libya, CDOs in the US, and tsunamis in Japan have taught us—we are only becoming more economically intertwined, regardless of what our coins look like. Step back from the current crisis to consider the long view, and currency unions—or even a single global currency—have a fair share of appeal. A universal medium of exchange could eliminate currency risk and jack up trade. It would mean speculators couldn’t short an individual country’s currency. Exporters wouldn’t have to fret over the gap between a price on a contract and the value of the payment. A single currency could halt spastic swings in prices and end conversion fees, leaving more of the pie for little stuff like R&D and employee health insurance. Oh—and it could put an end to international disputes over currency manipulation. Hello? China?
Dollar’s Demise Exaggerated as 13% Gain Since 2008 Proves Currency’s Value - Moves by the Federal Reserve to flood the world with dollars are doing little to dent the currency’s value, bolstering the appeal of U.S. assets at a time when the government needs the support of foreign investors the most. The U.S. Dollar Index (DXY) has appreciated 13 percent from a record low in March 2008 even as the Fed kept interest rates at about zero and printed cash to buy $2.3 trillion of Treasury and mortgage-related bonds, and is little changed since 1991. The International Monetary Fund said Dec. 30 that the greenback’s share of global foreign-exchange reserves rose in the third quarter by the most since 2008. That long-term stability shows America’s currency is a store of value and may help explain why the U.S. is attracting record demand for the unprecedented amount of bonds the Treasury Department is selling to finance a budget deficit exceeding $1 trillion. Even though Standard & Poor’s stripped the U.S. of its AAA rating in August, investors see the nation as a refuge from slower global economic growth and Europe’s sovereign-debt crisis. “The safe-haven function of the dollar is still alive,” “The dollar will be strong in 2012,”
U.S. Dollar & Currencies: Review and Outlook - In 2012, policy makers around the world may be driven by the realization that the theme of 2011 was not a Euro-specific crisis, but simply another stage in a global financial crisis. Central bankers may ramp up their printing presses in an effort to limit “contagion” concerns. As such, the currency markets may be the purest way to take a view on the “mania” of policy makers. Market movements may continue to be largely driven by political rhetoric, rather than company earnings announcements or economic data. We don’t believe this trend will abate over the foreseeable future, especially given the likely leadership changes throughout several G-7 nations. The primary motivating force behind politicians’ decision-making may be quite different, and more often than not, at odds with those of the broader market or sound economic fundamentals. Moreover, we have witnessed an unprecedented period of political posturing and increased polarization of views. This has only served to underpin the increased levels of market volatility experienced in 2011. Central banks of the U.S., Japan and the U.K. have shown they are most willing to put in place expansionary policies. For one, there will be a more dovish composition of Federal Open Market Committee (FOMC) voting members in 2012. Many Western and Asian policy makers have already begun to ease. From a currency perspective, we believe these dynamics will serve to benefit the currencies of commodity producing nations, while underpinning Asian economic growth.
What Is a Safe Asset? - Rebecca Wilder - Last month, David Beckworth at Macro and Other Market Musings had some interesting thoughts on the global shortage of safe assets. His essay got me thinking about what is a safe asset? Beckworth alludes to three definitions of ‘safe’: (1) a credit being AAA-rated, (2) satisfying a certain level of liquidity to be used in repo markets (an important aspect of US credit transactions), and (3) backed by a sovereign with sufficient (and targeted) aggregate nominal income. I would agree with (2) and (3) in a broader context, but not necessarily (1). Why does a ‘safe’ asset need to be AAA? To be sure, the share of AAA sovereigns of 76 developed and developing/emerging sovereigns fell by 3% in 2011 compared to 2007. This should hardly be surprising, given the weak recoveries and leverage that exists in the developed markets. But it’s liquidity, and to a lesser extent, sovereign risk that matters, not the rating, per se. Furthermore, ‘safe’ is a matter of perspective. Liquidity is a pre-requisite for a ‘safe asset’ so that investors can purchase this asset in even the harshest of times. The United States runs the most liquid bond and currency market in the world; it can satisfy demand from flight-to-safety in times of stress. But one can think of liquidity in another manner: the ability to print fiat currency that is used to honor the debt instrument (asset). The US government issued just 8% of its external government debt position in non-dollar form. Better put: the US is a ‘safe’ assets because it’s a market large enough to satisfy broad demand and the US government is always going to be able to honor its debts. Liquidity is the most important definition of a safe asset, rather than the rating.
Peak Money Arrives - The world is running out of money. If money is credit, and credit relies on confidence, there is not enough confidence in the financial system to supply the world with the money it needs. Since the initial credit crisis struck in 2008, credit and money have been withdrawn from the system in such staggering amounts that international trade can no longer grow. The world’s central banks are playing a rear guard action by acting as lender of last resort to banks that no longer trust each other and have stopped lending in the interbank market. As liquidity flows out from the system, the rottenness that has corrupted the foundations of global finance is now exposed for all to see. This was especially evident in the bankruptcy of MF Global. For over 100 years the futures exchanges have bragged that no customer on an exchange has lost money due to a broker-dealer’s default. No longer. This is how confidence is lost in the financial system – investors are surprised by large losses from institutions or products thought to be impregnable. When confidence in the financial system is lost, people don’t trust their money to banks nor to the financial markets. Banks in turn don’t trust their money to anybody but the safest of risks. You then have the making of a large-scale financial collapse, particularly at a time like this, when the world’s economy is heavily dependent on ever-increasing amounts of debt. Since the new debt is essential to repaying the old debt, old debts turn into a default, and as one default leads to another, an economic depression ensues. Credit becomes scarce, and so money disappears. The question is: How will this play out?
The Great Ricardian Equivalence Debate of 2011: Do Mainstream Economists Agree on Anything? - Krugman started it, in response to Lucas. Everyone piles on. Plutocracy Files has the list of links. (Plus don't miss Nick Rowe's, which includes a long comment thread.) Here's what wows me: all these world-classical economists are accusing each other of contradicting "textbook economics," and circling through extraordinary contortions in their efforts to reconcile that school of economics with some version of reality. There is no consensus. None. Every one of these folks is bought into classical assumptions, or at least into the Keynesian/classical "synthesis" that's embodied in the IS-LM model (a model that was created explicitly to render Keynes classical, i.e. without the the Keynes, and was later disavowed by its own creator, John Hicks, as nothing more than a "classroom gadget"). And they're all trying to do intergenerational macro in their heads, as a bunch of stylized and simplified thought experiments. Given that several of the world's most notable "textbook" economists can't agree on how to define what in physics would be the equivalent of angular momentum, some of us have to wonder if the whole discipline as taught today offers any useful macro-level insight or modeling utility at all.
US Closes 2011 With Record $15.22 Trillion In Debt, Officially At 100.3% Debt/GDP, $14 Billion From Breaching Debt Ceiling - While not news to Zero Hedge readers who knew about the final debt settlement of US debt about 10 days ahead of schedule, it is now official: according to the US Treasury, America has closed the books on 2011 with debt at an all time record $15,222,940,045,451.09. And, as was observed here first in all of the press, US debt to GDP is now officially over 100%, or 100.3% to be specific, a fact which the US government decided to delay exposing until the very end of the calendar year. We wonder, rhetorically, just how prominent of a talking point this historic event will be in any upcoming GOP primary debates. And yes, technically this number is greater than the debt ceiling but it excludes various accounting gimmicks. When accounting for those, the US has a debt ceiling buffer of... $14 billion, or one third the size of a typical bond auction.
The True Federal Debt - In our personal lives, we all understand that debts may take different forms. They aren’t limited only to credit cards or loans taken out from banks; they consist of various promises and financial obligations as well. These might include commitments to pay for a daughter’s wedding or a child’s graduate school education, to provide the down payment on a sibling’s house or to care for aged parents. While these debts may not show up on anyone’s formal balance sheet, families are well aware of them, and failure to live up to them can be very costly indeed. So, too, with the federal government. The national debt, which is the object of almost obsessive attention these days, is like a bank loan. It is an important part of national indebtedness, but only a small part. The vast bulk of the true debt is in the form of commitments to pay future benefits to retired federal employees, veterans, and Social Security and Medicare beneficiaries. These commitments are generally invisible because the federal government operates on a cash basis. The federal budget is concerned only with income and outgo between two points in time — from Oct. 1 to Sept. 30, the fiscal year. Promises to pay benefits in the future generally show up in the budget only when those benefits are actually paid.
Nobody Understands Debt, by Paul Krugman - In 2011, as in 2010, America was in a technical recovery but continued to suffer from disastrously high unemployment. And through most of 2011, as in 2010, almost all the conversation in Washington was about something else: the allegedly urgent issue of reducing the budget deficit. This misplaced focus said a lot about our political culture, in particular about how disconnected Congress is from the suffering of ordinary Americans. But it also revealed something else: when people in D.C. talk about deficits and debt, by and large they have no idea what they’re talking about — and the people who talk the most understand the least. Deficit-worriers portray a future in which we’re impoverished by the need to pay back money we’ve been borrowing. They see America as being like a family that took out too large a mortgage, and will have a hard time making the monthly payments. This is, however, a really bad analogy in at least two ways. First, families have to pay back their debt. Governments don’t — all they need to do is ensure that debt grows more slowly than their tax base. The debt from World War II was never repaid; it just became increasingly irrelevant as the U.S. economy grew, and with it the income subject to taxation. Second — and this is the point almost nobody seems to get — an over-borrowed family owes money to someone else; U.S. debt is, to a large extent, money we owe to ourselves.
US Net Investment Income - Krugman - I’ve been arguing that the nature of US debt now is not, despite appearances, all that different from debt post-World War 2, when we pretty much entirely owed the money to ourselves. Now, of course, some of the money is owed to foreigners; but as I pointed out, America has large assets abroad, not too much less than its liabilities. But wait, there’s more. American assets. often taking the form of foreign subsidiaries of US corporations, earn a higher rate of return than US liabilities — especially now, when there’s a lot of foreign money parked in Treasuries, but this was true even before the crisis. As a result, income from US-owned assets abroad — the blue line below — consistently exceeds payments on foreign-owned assets in the United States, the red line: Again, if your image is that we’re deeply in hock to foreigners, that our extravagance has condemned us to a future of debt peonage, you’re wrong.
On the burden of government debt - I didn't have time for a lengthy discussion of this issue, so will have to settle for some quick links of interest. Paul Krugman and Dean Baker argue that government debt is not as big a burden on future generations as is often argued, to which Nick Rowe and Don Boudreaux respond. I would also add that Krugman acknowledges that debt owed to foreigners, and the high marginal tax rates necessary to meet interest payments on domestic or international debt, can certainly be a burden. And Krugman does not worry much, whereas I do, about the possibility that future creditors will doubt the willingness of the U.S. to raise taxes or cut spending sufficiently to meet the interest burden, the result of which could of course prove to be a huge problem.
Is debt a burden on future generations? Depends. - Does government debt impose a burden on future generations? Paul Krugman says no. Nick Rowe says yes. But they're talking about different things. Paul Krugman asks: If we wake up in 2012 and find ourselves with $9 trillion in government debt, are we any worse off than if we wake up and find ourselves with zero government debt? Assuming that all of our government debt is held domestically (so that we don't have to slave away for foreigners), and assuming that we don't default on our debt (which causes economic disruption), the answer is "no." Some people (creditors) are better off and some are worse off, but overall it's a wash. Nick Rowe asks: If, starting now in 2012, we rack up some more debt over the next decade, will that make our descendants in 2042 worse off than they would be if we didn't rack up any more debt? And the answer, assuming the debt grows faster than GDP, is "yes." To show how this works, Rowe makes an "overlapping generations" model in which a government uses debt to give extra consumption to the older generation, then taxes the younger generation to pay back the debt. Voila! A burden is imposed on the young.. What matters is not debt, it's intertemporal choice. The important question is not how much debt we rack up, but whether we want to move consumption from the future into the present or from the present into the future. In the real world, the way we move consumption around through time is through investment. In Nick Rowe's toy model there is no investment (because all consumption goods are perishable), but in the real world, the way we move consumption into the future is by investing in productive assets, like buildings or machines or education or ideas. The way we move consumption from the future to the present is by reducing investment and consuming more today.
Understanding tax distortions and Ricardian equivalence - Krugman is writing today in his column: “Federal debt isn’t at all like a mortgage on America’s future doesn’t mean that the debt is harmless. Taxes must be levied to pay the interest, and you don’t have to be a right-wing ideologue to concede that taxes impose some cost on the economy, if nothing else by causing a diversion of resources away from productive activities into tax avoidance and evasion.” I can only agree with this statement as long as the government is using distortionary taxes and there is no obvious reason to do so. It’s about the breakdown of Ricardian equivalence. Under distortionary taxation, debt and taxes are no longer equivalent. Barro (1979) showed that public debt should then be used to smooth out the distortions of taxation over time. However, distortionary taxes are levied for a reason: income redistribution. If governments would not be interested in redistribution of income at all, they would levy non-distortionary non-individualized lump-sum taxes instead. But for lump-sum taxes we know that Ricardian equivalence can hold.
Matt Yglesias, spilt milk, and the debt burden -- Matt Yglesias was defending Paul Krugman's recent posts on the burden of the past debt and the desirability of current deficits. I visit Matt Yglesias' house. I drink one litre of milk from his fridge. I write Matt an IOU for one litre of milk.
- 1. If Matt subsequently tears up that IOU, then I am richer and he is poorer. Taking the two of us together, in aggregate we are neither richer nor poorer if Matt tears up the IOU. Tearing up the IOU doesn't bring the milk back.
- 2. Therefore there is no aggregate cost to me and Matt of me drinking more milk from Matt's fridge and writing Matt another IOU.
1 is of course true. But 2 does not follow from 1. 2 is false. We can't do anything about the existing stock of national debt. "It's no use crying over spilt milk", even if it was spilled down my throat rather than spilled on the floor. But that doesn't mean there is no cost to spilling more milk. True, there's also a benefit, if I'm thirsty, and it's spilled down my throat rather than on the floor. But there's a cost too. If the government runs a deficit now, there is a cost to future taxpayers. Sure, there's a benefit too, depending on what the government does with the funds it borrowed. And we should compare those benefits to those future costs. But we shouldn't pretend those costs don't exist.
Debt does not matter. Spending and taxes do. - Paul Krugman makes the point that government debt matters less than most people think because in some cases we simply owe money to ourselves. He is right and what he has in mind is the notion that government debt is (in many countries) mostly held domestically. Japan is an extreme case where more than 90% of the government debt is held by its nationals but even in the US the majority of government debt is held by US citizens or institutions. For some it is debt but for others it is an asset, they cancel out from a national point of view. We can think of an extreme case where government bonds are held by all taxpayers in proportion to their income - in a way that mimics tax rates. In that case, government debt is not imposing a future burden on anyone, it simply cancels out with the assets that all investors/taxpayers have.What matters is not debt but who enjoys the spending that the government does and who pays for it. Debt is just a vehicle that can be used to transfer resources across different individuals or generations. Debt is not a problem, the problem, from a generational point of view, is the potential mismatch between spending and taxes (even if future taxpayers are also the holders of government bonds when they are paid back).
Sad Things (Wonkish and Trivial) - Krugman - I see that some people out there don’t like me. A couple of odds and ends: John Cochrane weighs in on the Ricardian equivalence debate, sort of. I say “sort of” because he defines Ricardian equivalence as the theorem that stimulus does not work in a well-functioning economy which isn’t at all what it means to the rest of us, and certainly not what Ricardo meant (for the record, it’s the proposition that the timing of taxes doesn’t matter for consumer spending, so that temporary tax cuts don’t change spending). And then he “explains” that government spending can’t increase demand because of … Say’s Law! Which, of course, Keynesian economists have never thought of. It’s quite remarkable. And I mean that in the worst way: 80 years of hard thinking about economics, completely forgotten. Meanwhile, Powerline attacks Keynesian economics, and me, because … Keynes once said something anti-Semitic.
Understanding the Chicago Anti-Stimulus Arguments: A Response to Kantoos » Brad DeLong - Kantoos claims that I did not deal with the real arguments underlying John Cochrane's February 2009 claims that fiscal stimulus would be counterproductive: three years ago, in early 2009, when I read John Cochrane’s piece on fiscal stimulus . It is a little convoluted, unfortunately, but an interesting read nonetheless. I would have loved to read a proper response by Paul or Brad DeLong, but only found unjustified rants that had little to do with John’s arguments – if you actually read the whole piece. I thought I had. But let's try again. The problem is that I have a hard time pulling a coherent argument out of it. But I had thought that I had tried hard to deal with it, and I focused on the arguments that Cochrane had placed in the traditional places you put your main thesis--at the start and at the end:
The Nonsense Problem - Paul Krugman - Brad DeLong does a lot of work meeting a challenge from Kantoos, who insists that neither Brad or I have done justice to John Cochrane’s arguments. And what Brad finds is … nothing that makes a bit of sense. This indicates, I think, a key problem in these debates. People like Kantoos or Tyler Cowen start from the presumption that when people with the right credentials, like Cochrane, or Jean-Claude Trichet, or Robert Lucas make strong statements, that they must have a defensible model behind their assertions. And so if someone like me or Brad says that there is no such defensible model, we must be engaged in a “rant”, treating these people unfairly. But sometimes people with impressive credentials do talk complete nonsense — and on fiscal policy in the Lesser Depression, that has been more the rule than the exception. So what purports to be a demand for fair-minded argument ends up, in practice, being a demand that we pretend to find a coherent position where none exists, that we basically invent a high-minded debate out of thin air. I understand that many people find the notion of a world in which Nobel Laureates and ECB presidents declare that 2+2=5 very unappealing, and that they wish we lived in a different and better world. But we don’t — and it’s not my job to create the illusion that we do.
Outside the Bubble, Public Investment Is Disappearing - These two stories need to get together in a room and talk:
1) Demand for US debt is really high.
2) Government (net) investment is at a 40-year low.
Notice that neither of these facts plays any noticeable role in the policy debates that dominate the US political scene. There we’re offered a choice of competing visions between radicals who claim that current levels of government spending and investment represent the collapse of free civilization, and conservatives who seem to think that we have the share of public investment more or less right (give or take a few dollars for green energy).
Actual ARRA Spending Over the 2009-2011 Period Quite Close to CBO’s Original Estimate - CBO Director's Blog - Almost three years have passed since the enactment of the American Recovery and Reinvestment Act of 2009 (ARRA). Back in November 2009, we reported in a blog post that actual spending in fiscal year 2009 of funds provided by ARRA was about 1 percent higher than CBO’s estimate for that year. How did ARRA spending turn out over the 2009–2011 period (that is, from February 2009 through September 2011), and how do those results compare with CBO's original estimates? Key Points:
- Total ARRA spending through fiscal year 2011 totaled about $494 billion—$20 billion (4 percent) higher than CBO’s original estimate.
- Our projections were very close in many cases—particularly those for outlays of the Departments of the Treasury, Transportation, and Energy.
- The higher-than-anticipated spending resulted primarily from the costs of two programs that were noticeably affected by economic developments that differed from projections: unemployment-related benefits administered by the Department of Labor, and nutrition assistance administered by the Department of Agriculture.
- More than two-thirds of total anticipated ARRA spending has been recorded, with expenditures peaking in 2010.
Washington Isn't Spending Too Much - Austan Goolsbee - To hear the GOP candidates tell it, spending under President Obama explains the deficit, explains America's long-run fiscal problem, and explains why new taxes cannot be tolerated. Congressional Republicans have the same outlook. The deficit is up thanks to government spending, so we must cut spending right now in every form. Yet the long-run fiscal problem facing the country—which is real—has almost nothing to do with the reasons that the deficit is currently large or that spending is abnormally high. They are high for the same reason taxes are abnormally low: because of the economic downturn. We should debate the real issues, not try to pretend the recession never happened.The Congressional Budget Office forecast a $1.2 trillion deficit before the Obama administration even came into office. The stimulus added only around $250 billion a year, and more than one-third of that came from tax cuts, especially the tax credit in the stimulus bill's "Making Work Pay" provision. Most of the increase in the deficit during a downturn doesn't come from new policies in Washington. The deficit rises because both spending and taxes automatically adjust when the economy struggles. Unemployment insurance payments rise and more people qualify for Medicaid and food stamps. Incomes fall so people pay less taxes.
Reminder: $1.2 Trillion Spending Cut Starts A Year From Yesterday - The $1.2 trillion "sequester" spending cut that was triggered in late November when the anything-but-super committee failed to agree on a deficit reduction plan will occur on January 2, 2013. As I noted several weeks ago, 2012 is likely to be the "Year of Figuring Out How To Stop the Sequester." In the meantime...mark your calendar now.
Robert Samuelson's Incredibly Misguided View Of The Federal Budget - The Washington Post published a column by Robert Samuelson on December 30 that has been troubling me ever since it appeared in print. I'll leave it to Dean Baker and others to argue with Samuelson's take on other issues. My complaint is about this incredibly incorrect paragraph: But given an aging baby-boom population and increasingly high health costs, spending on the elderly is already crowding out other important government programs and threatening steep tax increases on working Americans. I plead guilty to making this point repeatedly. Annual spending on Social Security already exceeds defense spending; Medicare is approaching the level of “non-defense discretionary spending,” a catchall of everything from highway spending to foreign aid to education. There are several big problems with virtually everything here. First, there is no evidence that spending on the elderly is crowding out other "important" programs. Second, saying that annual spending on Social Security "already exceeds" defense spending implies that the Pentagon should always spend more and it's somehow wrong or inappropriate when that doesn't occur. Third, the same can be said about Samuelson's statement about Medicare: The fact that it may be "approaching the level of non-defense discretionary spending" is a completely meaningless warning. Finally, what in the world does Samuelson mean when he says that spending on the elderly is "threatening steep tax increases on working Americans"? Isn't Pentagon spending and interest on the national debt just as responsible for the deficit as other programs?
'True Revolution' Ahead for US Fiscal Future: Greenspan - The United States faces a "true revolution" in the choices it will have to make to secure its fiscal future now that the welfare state has run up against a "brick wall of economic reality," former Federal Reserve Chairman Alan Greenspan said Wednesday. In an opinion piece for the Financial Times, Greenspan argued that the political landscape in the United States was more divided than ever, resulting in political paralysis as the Tea Party’s influence had created "an effective veto of new legislation before the current heavily Republican House of Representatives". The failure last year of the Super Committee — a congressional committee tasked with finding spending cuts to reduce the United States’ ballooning budget deficit — to reach a deal underscores this shift in U.S. politics, Greenspan said. "A political tsunami has emerged out of our past in the form of the Tea Party, with its ethos reminiscent of rugged individualism and self-reliance," Greenspan wrote. The Tea Party "has so altered the distribution of votes within Republican Party’s House caucus that the party’s center has moved closer to the Tea Party," he added. “Congress, having enacted increases in entitlements without visible means of funding them, is on the brink of stalemate," Greenspan wrote. The only viable long-term solution appears to be "a shift in federal entitlements programs to defined contribution status" — programs that require employees to make a set contribution to their pensions, Greenspan said.
Obama signs defense bill, pledges to maintain legal rights of terror suspects - The Washington Post: President Obama expressed misgivings about several provisions of a sweeping defense bill he signed into law on Saturday, pledging that his administration will use broad discretion in interpreting the measure’s legal requirements to ensure that U.S. citizens suspected of terrorism are not detained indefinitely by the military. The $662 billion National Defense Authorization Act provides funding for 2012 at $27 billion less than Obama's request and $43 billion less than Congress authorized in 2011.The bill also contains several detainee provisions that civil liberties groups and human rights advocates have strongly opposed, arguing that they would allow the military greater authority to detain and interrogate U.S. citizens and non-citizens and deny them legal rights protected by the Constitution. Obama initially had threatened to veto the legislation. In a signing statement released by the White House on Saturday, Obama said he still does not agree with everything contained in the legislation. But with military funding due to expire Monday, Obama said he signed the bill after Congress made last-minute revisions at the request of the White House before approving it two weeks ago.
Obama Signs Defense Spending Law, With Notes - President Barack Obama, signing into law a $662 billion defense spending plan today, attached his own legal interpretation to several sections that the White House had contested with Congress, including a provision that requires suspected members of al-Qaeda be kept in military custody. “The fact that I support this bill as a whole does not mean I agree with everything in it,” Obama said in a signing statement appended to the measure. “In particular, I have signed this bill despite having serious reservations with certain provisions that regulate the detention, interrogation and prosecution of suspected terrorists.” The National Defense Authorization Act for Fiscal Year 2012 seeks to curb cost overruns of Lockheed Martin Corp. (LMT)’s F-35 fighter jet for the fiscal year that began Oct. 1. Lawmakers frustrated by delays and cost overruns ordered the Pentagon to make Lockheed Martin absorb costs if it exceeds a negotiated target in a forthcoming sixth F-35 production contract. The Defense Department is currently negotiating the fifth contract for the F-35. At $382 billion, it’s the Pentagon’s largest weapons program. The defense authorization law calls for spending $27 billion less than Obama sought, and $43 billion less than fiscal 2011. It also tightens sanctions on Iran by denying access to the U.S. financial system to any foreign bank that conducts business with the Central Bank of Iran.
The Worst Part of the Signing Statement: Section 1024 - As I explained here, Obama’s signing statement on the defense authorization was about what I expected. He included squishy language so as to pretend he doesn’t fully support indefinite detention. And he basically promised to ignore much of the language on presumptive military detention. But there was one part of the signing statement I (naively) didn’t expect. It’s this: Sections 1023-1025 needlessly interfere with the executive branch’s processes for reviewing the status of detainees. Going forward, consistent with congressional intent as detailed in the Conference Report, my Administration will interpret section 1024 as granting the Secretary of Defense broad discretion to determine what detainee status determinations in Afghanistan are subject to the requirements of this section. Section 1024, remember, requires the Defense Department to actually establish the provisions for status reviews that Obama has promised but not entirely delivered.
United Bases of America - U.S. military bases around the world: graphic
Panetta to Offer Strategy for Cutting Military Budget —Defense Secretary Leon E. Panetta is set this week to reveal his strategy that will guide the Pentagon in cutting hundreds of billions of dollars from its budget, and with it the Obama administration’s vision of the military that the United States needs to meet 21st-century threats, according to senior officials. In a shift of doctrine driven by fiscal reality and a deal last summer that kept the United States from defaulting on its debts, Mr. Panetta is expected to outline plans for carefully shrinking the military — and in so doing make it clear that the Pentagon will not maintain the ability to fight two sustained ground wars at once. Instead, he will say that the military will be large enough to fight and win one major conflict, while also being able to “spoil” a second adversary’s ambitions in another part of the world while conducting a number of other smaller operations, like providing disaster relief or enforcing a no-flight zone.
Obama to unveil austere Pentagon strategy — President Obama is scheduled to make a rare visit to the Pentagon on Thursday to unveil details of a strategic review for the U.S. military that will consolidate missions and downsize the ambitions of the armed forces as they adjust to a new era of austerity, officials said. Obama, who will be joined by Defense Secretary Leon E. Panetta and Gen. Martin Dempsey, chairman of the Joint Chiefs of Staff, will place his personal imprint on a new military strategy that Pentagon officials have been preparing for months in anticipation of the largest cuts to the defense budget since the end of the Cold War. The document will call for a greater shift toward Asia in military planning and a move away from big, expensive wars like Iraq and Afghanistan, which have dominated U.S. operations for most of the past decade, said a senior military official. In particular, the plan calls on the military to invest in weaponry to overcome efforts by potential adversaries such as China to use long-range missiles and sophisticated radar to keep U.S. forces at bay. The strategy is different from past Pentagon reviews in that it establishes clear priorities for the military, the official said, speaking on the condition of anonymity because the plan had not been publicly released.
Pentagon’s “Austerity Budget” Ignores Second-Round Trigger Cuts - The President made some brief remarks at the Pentagon during the introduction of the new “austerity” defense budget. He stressed that the US will still have the most powerful fighting force in the world, that even after the cuts the defense budget would grow over the next five years, and that the overall budget will still amount to as much as the next ten largest militaries combined. So it’s hard to make the turn, given all those facts, that this is a real sacrifice on the part of the military. And the fact that the weapons systems will stay while the personnel to manage them will get cut just re-emphasizes that. Panetta’s not even talking about cuts to the F-35, just delays in purchases. And the aircraft carrier number would stay the same. And most important to this whole strategy, the cuts announced today only incorporate those from the first half of the debt limit deal. They do not take into account the trigger. So the purpose, it seems to me, is to cry poor about the military, claim that the cuts are “painful but manageable,” so as to head off the bigger cuts mandated by the debt limit deal, and put forward a strategy of nullifying them.
Military Contractors Should Be More Concerned About 2013 And Beyond - The fact that the Obama administration’s proposed Pentagon spending reductions are not likely to be enacted in 2012 should bring little comfort to the contracting community. Even if they’re not put in place this year, reducing the military budget from current baseline levels will be hotly debated this year and be a campaign issue. This is likely to change the budget debate that has occurred since at least 2001 from how much should 2 military spending rise to which reductions are most acceptable. That’s a significant change. Without an external shock that alters this outlook such as a terrorist attack or new overseas contingency, this changed debate will last at least until a significant deficit reduction plan is adopted, and, regardless of who gets elected and which political party controls each house of Congress, it will make the Pentagon as much a part of that discussion as Medicare and Medicaid.
Continuing Resolution For DOD 2013 Is Even More Likely Because Of Obama Pentagon Changes - Not only are the Obama administration’s $450 billion-over-10-years military spending cuts not likely to be enacted before the 2012 election, but no significant deficit reductions of any kind should be expected to be enacted this year. The witches’ brew of hyper-partisan politics, the 2012 election, the influence within the GOP of it’s tea party wing and the narrow majorities in the House and Senate will combine this year to do what they did in 2011: Make a deal on any aspect of the budget impossible to achieve. More energy and effort will be expended this year on avoiding, delaying, or reducing the sequester’s military spending cuts than in developing an agreement on any additional Pentagon reductions. In addition, given the narrow majorities in both houses, the spending reductions that were outlined by Pentagon officials today will provide the representatives and senators from the congressional districts and states that would be harmed with ample opportunities to make life miserable for the Democratic and Republican leaders. As a result, a fiscal 2013 Department of Defense appropriation is now even less likely than it was before, and it wasn’t that likely to begin with. A continuing resolution that keeps Pentagon spending at or near current levels and keeps existing policy in place is the most likely outcome until at least a lame duck session.
Obama Pentagon Spending Cuts Will Change The Budget Debate Long Before They Reduce The Budget - There are five reasons why it was virtually inevitable the White House would make military spending an issue this year.
- 1. The Pentagon Has Become Increasingly Unpopular.
- 2. The President’s Focus On The Deficit Made A Close Look At The Pentagon Impossible To Avoid. This is simple math more than complex politics.
- 3. The GOP Is Already On Record In Favor Of Cutting Military Spending.
- 4. There Is Ample Hi-Level GOP Expert Opinion That Pentagon Spending Can Be Cut Without Sacrificing National Security. As Heather Hurlburt pointed out in an excellent piece today in the Huffington Post, a number of highly respected Republican military experts are on record with ideas about how the Pentagon can and should be cut. This includes Colin Powell, Robert Gates, Dov Zakheim and even Donald Rumsfeld, all of who have all offered specific plans for cutting one or more parts of the military budget.
- 5. The War In Afghanistan Is Increasingly Unpopular. The polls indicate an overwhelming preference for reducing or eliminating the spending associated with activities in Afghanistan rather than on virtually any domestic activity.
Editorial: Phantom defense cuts -Where's the peace dividend? American troops now are mostly out of Iraq. And their numbers are declining in Afghanistan, with about a third of the 98,000 troops scheduled to come home by summer. Yet, defense spending is not declining despite tough budget times and a federal deficit of $1.3 trillion for fiscal year 2011-12. This reality is obscured by supposed "cuts" being made in the Pentagon budget. Defense Secretary Leon Panetta this week will lay out the Obama administration's defense goals and budgets for the future. Reported the New York Times, "Mr. Panetta is expected to outline plans for carefully shrinking the military – and in so doing make it clear that the Pentagon will not maintain the ability to fight two sustained ground wars at once. "Instead, he will say that the military will be large enough to fight and win one major conflict, while also being able to 'spoil' a second adversary's ambitions in another part of the world" About $450 billion in cuts over the next decade generally have been agreed on by the Pentagon and the White House, the Times reported. Mr. Panetta believes that further cuts would hurt national security.But the cuts really aren't there, Christopher Preble told us; he's vice president for defense and foreign-policy studies at the libertarian Cato Institute. It's the old trick of "cutting" the baseline budget – as the baseline rises. He said the "cuts" would "put us back to 2010 – hardly a lean year as far as Pentagon spending is concerned
2011, The Year Washington Lost -- With yet another high-profile fight between Congress and the White House coming down to the wire, 2011 ended with a sense of deja vu. This time, President Barack Obama survived the cable news carnage with a two-month extension of the payroll tax cut and unemployment benefits -- a victory in political terms, but little more than a stopgap as a matter of actual policy. This has been the story on jobs legislation all year: small-bore, short-term or substantively irrelevant. On economic policy, 2011 was a lost year. Just one year ago, Obama sparked a tremendous outcry from progressives for offering up a one-year payroll tax cut and unemployment benefits extension in exchange for two years of the Bush tax cuts for the wealthy. As 2010 drew to a close, the payroll tax cut -- which provides an average of $1,000 a year to 160 million Americans -- was viewed as woefully insufficient compared to the potential job-creating revenue from new taxes on the wealthy. Those meager provisions likely prevented the economy from falling back into recession, but in the year since Obama cut that deal with congressional Republicans, economic growth has averaged a pathetic 1.2 percent. The unemployment rate has fallen from a horrific 9.8 percent to a merely terrible 8.6 percent. But much of that progress is illusory -- millions of out-of-work Americans have simply given up all hope of finding a job, a situation that isn't captured by the unemployment statistics.
Obama, Romney, Jobs - Krugman - Greg Sargent is rightly outraged by Romney’s claim that Obama is a job destroyer: Romney’s claim that two million jobs were lost under the Obama presidency is based on the idea that there’s been a net loss of jobs since he took office. In other words, Romney is taking into account the fact that the economy continued hemorraghing jobs at a furious rate after Obama took office — before Obama’s stimulus passed. But the figures show that once it became law, monthly job loss declined over time, and turned around in the spring of 2010, after which the private sector added jobs for over 20 straight months, totaling around 2.2 million of them. I think this benefits from a figure: Does this look to you like a president who “lost jobs”, or like a president who inherited an economy in free fall? You can accuse Obama of not doing enough to promote recovery — and I have (although the biggest villain here was Romney’s own party). But to claim that Obama caused the job loss is indefensible.
Eric Cantor, "60 Minutes," And Taxes - Nothing happening right now in Iowa is as important or as revealing (not to mention as entertaining) as the outburst by Eric Cantor's press secretary during a 60 Minutes interview that aired on Jan. 1. You won't find it on Politico's home page (yet), but it really happened. Scroll to the bottom of this item to watch the relevant portion (assuming you have the patience to sit through a commercial first). Here's the transcript:
Wall Street Beware: Boehner May Need To Tank Payroll Tax Extension To Keep His Job - The best way to understand why House Speaker John Boehner (R--OH) is in trouble with other House Republicans on the payroll tax extension is to refer back yet again to my experience late last February when I spoke at the first meeting of the House tea party caucus. The whole story is here for those who didn't read or don't remember it. If you're pressed for time...two of the most important things I heard at that meeting were that the tea partiers said very explicitly they didn't trust Boehner or Majority Leader Eric Cantor (R-VA), and that the biggest mistake Newt Gingrich (R-GA) made in 1995 and 1996 when he was fighting Bill Clinton on budget issues is that he gave-in too early. He would have gotten much more they said had he just held out until the very last minute. Nevertheless, in light of the anger the tea party wing of the House GOP apparently feels after Boehner's unilateral decision in late December to end the fight with the White House over the payroll tax extension, the GOP members believe the speaker caved too early. From their perspective, he/they didn't get the best possible deal.
Enjoy the payroll tax break while it lasts - Last week, after a needlessly-contentious process, Congress approved a two-month extension of the payroll tax break. As part of the agreement, a conference committee will try to come up with an agreement to extend the cut through the end of 2012. I’ve been rather pessimistic about the likelihood of success, and yesterday, the odds got worse. The Senate Republican leader announced Friday that he had chosen three of his colleagues to try to thrash out a bipartisan deal on payroll taxes, unemployment benefits and Medicare. The three Republican senators will join four Democratic senators and 13 House members on a conference committee... The newly named Republican conferees are Senators Jon Kyl of Arizona, Michael D. Crapo of Idaho and John Barrasso of Wyoming. These are three senators you’d appoint to a conference committee if you want to be destructive. Kyl, for example, was instrumental in sabotaging the super-committee process... Crapo and Barrasso, meanwhile, are two far-right senators who’ve never demonstrated any willingness to accept concessions on anything. What’s more, note that the House GOP leadership has already announced its conferees, most of whom have already said they don’t want a payroll-cut extension no matter what concessions Democrats are willing to make...
How is the U.S. tax system different? - Clive Crook reports: A new report by the Organization for Economic Cooperation and Development shows that in the middle of the last decade — i.e., after the Bush tax cuts were introduced — the U.S. income tax was about as strongly redistributive as income taxes in Canada, Denmark, Finland, the Netherlands and Sweden. You might have noticed that the CBO report on top incomes was widely quoted, but one finding got less attention: Between 1979 and 2007, “the federal individual income tax became slightly more progressive.” [TC: note that this last sentence can mean a number of different things/] The awkward truth is that the U.S. income tax system is anomalous not because it taxes the rich lightly but because it taxes everybody else lightly.
More on Taxation and High Incomes - Looking a bit more into this question of the link between higher income tax rates and lower levels of inequality, I stumbled on this paper examining precisely this correlation from the perspective of executive pay. Check out these two figures, which appear to tell a pretty clear story.. In both the top slide and the left-hand panel in the bottom one, the negative correlations between high tax rates and executive compensation are clear. And the right panel provides an interesting contrast—you don’t really see much of a correlation at all when it comes to middle managers. So there does seem to be a clear inequality linkage here.On the other hand, correlation is not causation, and the statistical analysis in the article doesn’t find evidence that compensation responds to tax changes in the short run. The authors wonder if maybe such things just take a while to evolve over time, as social norms adjust in such a way that tolerates more inequality, lower taxes on the wealthy, and the very large growth in the gap between the compensation of executives and that of the typical worker. They hypothesize that perhaps: “social pressure prevented firms from aligning pay with tax rates mid-century, but as these norms changed, compensation packages became more flexible to adapt to tax advantages.”
Rick Santorum’s Tax Plan - With Rick Santorum surging in Iowa, it is a good time to take a look at his tax agenda. While his revenue plan has received almost no attention, it plays a major role in his “faith, family and freedom” campaign. His playbook: lower rates for individuals and corporations, substantially cut taxes on capital, and increase the personal exemption for dependent children. The Tax Policy Center has not yet formally modeled the former Pennsylvania senator’s tax platform. However, because it cuts rates significantly but does not eliminate tax preferences—and even expands a few—it would very likely add trillions of dollars to the federal deficit. Looked at from that prism, it is not so different from the ideas raised by most of his GOP rivals. Like other Republican tax planks, Santorum’s would benefit corporations and high-income individuals. No surprise there. But unlike his rivals, he’d also cut taxes for many families with children. Santorum is no bleeding heart, however. Even as he’d cut their taxes, he’d shred direct government spending for programs aimed at assisting these same households. As part of his plan to cut federal spending by $5 trillion over five years, he’d immediately slash many domestic programs to 2008 levels, and freeze for five years spending for social programs such as Medicaid, housing subsidies, food stamps, education, and job training.
Romney’s Tax Plan: Big Benefits for the Wealthy and Higher Deficits - A new Tax Policy Center analysis finds that Mitt Romney’s tax plan would cut taxes for millions of households but bestow most of its benefits on those with the highest incomes. At the same time, it would significantly cut corporate taxes and add hundreds of billions of dollars to the deficit. Compared to current law (assuming the Bush/Obama tax cuts expire as scheduled at the end of this year), Romney would cut taxes by $600 billion in 2015 alone. Relative to a world where those tax cuts remained in place, he would add about $180 billion to the deficit in that year. In many ways, Romney’s tax plank is a fairly mainstream Republican offering. No major tax reform. Certainly no 9-9-9-like proposal to replace the current revenue system with a consumption levy. And while Romney is proposing huge tax cuts, they are more modest than those of his rivals. Newt Gingrich’s tax package, for instance, would add $1 trillion to the deficit in 2015. Still, a $600 billion tax cut is worthy of note.
Romney's Tax Plan--good for the wealthy, not so good for everybody else - The Tax Policy Center has done an analysis of Romney's plan for US taxation. See The Romney Plan. It doesn't look bad at all for the wealthy. In adding at least $600 billion to the U.S. deficit by 2015, Romney would
- reduce the statutory corporate tax rate from 35% to 25% immediately (apparently with no need for offsets).
- eliminate the US system of taxation of worldwide income in favor of a "territorial" tax system. this will be especially beneficial for multinational corporations and their owners and managers, and will tend to speed up the offshoring of US manufacturing and service jobs.
- reduce the maximum individual rate from 35% to 25% immediately (apparently with no need for offsets). This will benefit the wealthiest of the wealthy, who already enjoy a very compressed income bracket progression.
- Eliminate the estate tax. This will benefit the wealthiest of the wealthy, who are the only ones who pay the estate tax now.
- Retain the 15% rate for capital gains. This will benefit the wealthy, since the top of the income distribution owns most of the financial assets.
- Eliminate the capital gains tax for those with income of $200,000 or below.
Mitt Romney Plan Raises Taxes On Poor Families, Helps Millionaires: Study: Republican Mitt Romney's tax plan would increase taxes on low-income families while cutting taxes for the middle-class and the rich, according to an independent study released Thursday. On average, households making less than $20,000 would see their taxes increase by more than 60 percent, said the Tax Policy Center, a Washington research group that studied the Romney plan. Households making between $50,000 and $75,000 would get small tax cuts, averaging 2.2 percent, or about $250, the study said. People making more than $1 million would get tax cuts averaging 15 percent, or about $146,000. "Virtually everybody with a big income is getting a tax cut," said Roberton Williams, a senior fellow at the Tax Policy Center. Overall, Romney's plan would reduce tax revenues by $180 billion in 2015, adding to the federal budget deficit, the study said. Romney's campaign disputes the estimate, saying tax cuts in the plan would help improve the economy, leading to more revenue.
Competing GOP Tax proposals Graphic - An organization that is called: American Institute of Certified Tax Coaches has put up a summary graphic of the various tax proposals ofthe GOP candidates. It not only notes the major points of their plans, but what their plans would cost. It is presented in a sort of game board race layout. The Institute introduces it thusly: The US tax code is so complexeven those who write the law don’t understand all of it. Infact, few members of Congress prepare their annual tax returnsaccording to a survey by the congressional newspaper, “The Hill.” Politicians cite the complexity of the tax code as the primary reasonleading them to turn to professionals for help. Even the Commissioner of the IRS can’t prepare his own tax returns! So there’sno easier way for a politician to gain approval than to say thecurrent system should be eliminated. It’s no surprise the Republican presidential candidates have come out with somewide-ranging tax proposals. Even deciphering the content ofthese plans can be a challenge, so we took it upon ourselves toidentify how the GOP hopefuls’ differ and just what is in them.
Marginalizing Ron Paul - Ron Paul is not worthy of serious consideration, according to a New York Times editorial; “Ron Paul long ago disqualified himself for the presidency by peddling claptrap proposals like abolishing the Federal Reserve, returning to the gold standard, cutting a third of the federal budget and all foreign aid and opposing the Civil Rights Act of 1964.” That last item, along with the decade-old racist comments in the newsletters Paul published, is certainly worthy of criticism. But not as an alternative to seriously engaging the substance of Paul’s current campaign—his devastating critique of crony capitalism and his equally trenchant challenge to imperial wars and the assault on our civil liberties that they engender. Paul is being denigrated as a presidential contender even though on the vital issues of the economy, war and peace, and civil liberties, he has made the most sense of the Republican candidates. And by what standard of logic is it “claptrap” for Paul to attempt to hold the Fed accountable for its destructive policies? That’s the giveaway reference to the raw nerve that his favorable prospects in the Iowa caucuses have exposed. Too much anti-Wall Street populism in the heartland can be a truly scary thing to the intellectual parasites residing in the belly of the beast that controls American capitalism. It is hypocritical that Paul is now depicted as the archenemy of non-white minorities when it was his nemesis, the Federal Reserve, that enabled the banking swindle that wiped out 53 percent of the median wealth of African-Americans and 66 percent for Latinos, according to the Pew Research Center.
Enemy Of The State - Especially to the self-selected group that comes to the Iowa Republican caucuses, Paul’s positions are pulse quickening. If you are antitax, Paul has that sentiment nailed more than any other candidate. If you are antiwar, Paul is right there with you. If you fear for your personal freedoms, Paul has you covered. And if you want a sweeping philosophy, deeply grounded in fundamental texts (Hayek, von Mises, Rothbard), Paul is your man. Nobody has a better claim to be a protest candidate. He’s the only one who has ever run for office from a third party. He’s not about passing bills; he’s about root-and-branch change. His popularity, even if it’s temporary, demonstrates that all politics isn’t necessarily local—that big ideas can exert a pull on voters, too.
Ron Paul and the Banks - Simon Johnson - We should take Ron Paul seriously. The Texas congressman had an impressive showing in the Iowa caucuses on Tuesday and his poll numbers elsewhere are resilient – he is running a strong third among Republicans nationally and is currently second in New Hampshire polling. He may well become the Republican candidate with populist momentum and energy in the weeks ahead. Mr. Paul also has a clearly articulated view on the American banking system, laid out forcefully in his 2009 book, “End the Fed.” This book and its bottom-line recommendation that the United States should return to the gold standard – and abolish the Federal Reserve System – tend to be dismissed out of hand by many. That’s a mistake, because Mr. Paul makes many sensible and well-informed points. But there is a curious disconnect between his diagnosis and his proposed cure, and this disconnect tells us a great deal about why this version of populism from the right is unlikely to make much progress in its current form.
Crowd-sourcing the revolving door - This chart of Venn Diagrams (New Year’s Day links) is a nifty visualization[1] that shows how many, many people, through the operations of Washington’s revolving door, have held high-level positions both in the Federal government and in major corporations. To take but one example, the set of all Treasury Secretaries includes Hank Paulson and Bob Rubin, which overlaps with the set of all Goldman Sachs COOs. The overlapping is pervasive. Political scientists and the rest of us have names for such cozy arrangements — oligarchy, corporatism, fascism, “crony capitalism” — but one name that doesn’t apply is democracy. On the flip, you’ll find a larger version of the chart (and a discussion of its provenance).
Americans’ Confidence in Its Leaders Hits New Low - The 2011 National Leadership Index indicates that Americans’ confidence in its leaders has hit new low points: the overall index has fallen from 101.4 in 2005 to 89.4 in this month’s survey, even below the 2008 level in the midst of the financial meltdown. (100 is the normative level of confidence.) The index is highly reliable as it is based on interviews of 1,065 Americans and conducted by the Center for Public Leadership, headed by Professor David Gergen at Harvard Kennedy School. These results are very worrisome to me, as without trust and confidence in our leaders, America cannot recover the energy and optimism required to restore its domestic economy and global leadership. The survey indicates that 77% of Americans believe the U.S. has a leadership crisis. Without better leaders, America will decline as a nation, according to 77% of those interviewed. Seventy-six percent disagree with the proposition that our country’s leaders are effective and do a good job. Among leadership categories, military and medical leaders continue to top the list, scoring at 112 and 105, respectively. At the very bottom are Congressional and Wall Street leaders, with ratings of 73 and 71, both down sharply from the upper 90’s in 2005. Business leaders fare slightly better at 87, with the White House at 84.5 and media at 84.
A Christmas Message From America's Rich - Matt Taibbi - Asked if he were willing to pay more taxes in a Nov. 30 interview with Bloomberg Television, Blackstone Group LP CEO Stephen Schwarzman spoke about lower-income U.S. families who pay no income tax. “You have to have skin in the game,” said Schwarzman, 64. “I’m not saying how much people should do. But we should all be part of the system.”This incredible statement gets right to the heart of why these people suck. Why? It's not because Schwarzman is factually wrong about lower-income people having no “skin in the game,” ignoring the fact that everyone pays sales taxes, and most everyone pays payroll taxes, and of course there are property taxes for even the lowliest subprime mortgage holders, and so on. It’s not even because Schwarzman probably himself pays close to zero in income tax – as a private equity chief, he doesn’t pay income tax but tax on carried interest, which carries a maximum 15% tax rate, half the rate of a New York City firefighter. The real issue has to do with the context of Schwarzman’s quote. The Blackstone billionaire, remember, is one of the more uniquely abhorrent, self-congratulating jerks in the entire world – a man who famously symbolized the excesses of the crisis era when, just as the rest of America was heading into a recession, he threw himself a $5 million birthday party, featuring private performances by Rod Stewart and Patti Labelle, to celebrate an IPO that made him $677 million in a matter of days (within a year, incidentally, the investors who bought that stock would lose three-fourths of their investments). Apparently, we’d all be in much better shape if the poor were as motivated as Steven Schwarzman is to make America a better place. But it seems to me that if you’re broke enough that you’re not paying any income tax, you’ve got nothing but skin in the game. You've got it all riding on how well America works.
Here Are Some Rich New Yorkers Whining About Feeling Poor - In the mood for some class rage? (Of course you are.) Gothamist points us to message board on uptight parenting forum UrbanBaby asking, "What's your hhi [household income] and do you FEEL poor, middle class, upper middle class or rich where you live. No judging. Ha ha, "no judging." As if this discussion existed for any other purpose. (Well, judging and trolling.) For your judgmental pleasure: UrbanBaby's most harrowing tales of economic hardship and financial woe:
- $700,000 poor. NYC
- $350K, so, so, so poor. Not being dramatic or anything, really poor. We totally struggle every day. UES.... Obviously we are totally over extended. If we could get out of this mess, we would, but we can't.
- 500,000. DH spends to much so I feel poor
- 2012 will be about 400k. Fell mc. HHI is down since 2009. Live on the UWS.
- $275K, on the poor side of middle class, NYC.
- 180K Greenwich Village. I feel like I am doing my child a disservice when she cried at age 4 because I told her we will NEVER buy a country house.
- Last year $650k. This year $375-450k depending on bonus. I know rationally we are doing well, but we still feel pinched.
A Financial Transaction Tax Could Weed Out All The Pointless Trading: In an editorial published in the Wall Street Journal (“Taxing Stock Trades Will Hurt Main Street") the authors inadvertently make the case for imposing a stock trade tax rather than opposing it. Their argument against a tax boils down to the claim that a fee of 0.25% on each trade (which is the amount a bill going through the Senate would levy) would depress stock prices 10%, which in turn would have a cataclysmic effect on our economy. But based on their own evidence the tax would not depress stock prices, and in my opinion would provide large indirect benefits. I have made a living since 1986 in high frequency trading and a tax of .25% would drive me out of business as I know it. However I have long recognized the potential benefits of such a tax, my own personal situation notwithstanding. To wit, a tax would reduce superfluous trading volume, volume which in and of itself does little for our nation’s prosperity. Dime store economists will argue that volume provides liquidity for securities markets, which I agree is an undeniable good for an economy. But at some point the marginal gain in volume doesn’t provide increased liquidity or any other benefit--it’s just churn.
"An Elegant Core of Sensible Ideas" - Colleen Murray at Treasury Notes, the blog at the US Treasury, writes: ...the current calls to repeal the Dodd-Frank Act are a significant cause of the uncertainty that responsible business leaders are seeking to avoid. Once it is fully implemented, the Dodd-Frank Act will improve market certainty, strengthen the financial system, and help boost the economy. They are fighting against attempts to roll back financial regulation. I have no problem with that -- just wish they'd also noted that Dodd-Frank should be the beginning rather than the end of our efforts to reform the financial system. More is needed.
Report: Regulators missing a slew of Dodd-Frank deadlines - Regulators have missed roughly three-quarters of the deadlines for implementing the Dodd-Frank financial reform law through 2011, according to a new report. So far, 200 deadlines for drafting rules to implement the Wall Street overhaul have come and gone, and regulators have met only 51 of them, according to the law firm of Davis Polk. Another 200 rulemaking requirements stemming from the law still await regulatory action. All told, regulators have implemented less than a quarter of the sweeping law. Just 21.5 percent of the rulemaking requirements have resulted in finalized rules, while 38.75 percent currently have proposed rules. Another 39.75 percent of rules that ultimately will have to be implemented to make the law a reality have yet to be proposed. Regulators have spent much of the last year and a half struggling to draft huge numbers of rules implementing the new law, even as lawmakers argue over whether to expand their budgets to help address their expanded responsibilities.
Whither Volcker Rule and Other Options for Reining in Big Bad Banks - Yves Smith - Gerry Epstein of PERI speaks to the Real News Network about the out of the headlines negotiations on Volcker rule implementation as well as other ideas for bringing major banks to heel. It’s worth noting that Epstein is not aware of the fact that Occupy Wall Street’s Occupy the SEC group has a subgroup that is providing extensive comments on the Volcker (their first set was on the proposed repo exclusion).
Financial Regulation: Back to the good ol’ days of 2008 - Immediately after the GOP took the House last year, Alabama Republican and chairman of the House banking committee Spencer Bachus made the mistake of saying what he actually believes about financial regulation. “In Washington, the view is that the banks are to be regulated,” he told the Birmingham News, “and my view is that Washington and the regulators are there to serve the banks.” This view is consistent with thirty years of Republican-backed financial deregulation as well as with the conservative explanation of what went wrong in the financial crisis. And if the Republicans manage to take both elected branches of the government next year, this is likely to be the spirit in which they’ll approach the post-Dodd-Frank era. Going forward, the Republicans’ intentions with respect to Dodd-Frank are already clear: in Congress, they have introduced repeal legislation, and every major Republican presidential candidate has pledged to repeal Dodd- Frank in its entirety. It’s fair to take them at their word.
The $18 Trillion Threat Of The Unregulated Shadow Banking System - When you add together the assets in hedge funds, ETFs, money market mutual funds, sovereign wealth funds and family investment offices(think Soros) t he total amount of assets that are subject to oversight and regulation appears to be $18 trillion, down from $25 trillion before the 2008 meltdown. This money is what we call “the shadow banking system.” And is where the most “games” are being played using other people’s money. Risk taking, I have been warned , has moved to the “shadow banking system,” which utilize flow of funds accounts that are outside the purview of the Dodd-Frank Act, Basel III, and even the ministrations of t he Federal Reserve. None of these regulators have the obligation of overseeing the re-use of this pledged collateral, which are being supplied by asset managers to other dealers or players who “mine” this collateral for other purposes than were first intended. You want to worry about money you can’t see– and don’t know where it is located? Then, worry big-time about some $5.8 trillion of the “shadow banking” system that are in some kind of crazy-quilt daisy chain where they are pledged by some huge unregulated hedge fund or sovereign wealth fund, and then end up as collateral being used by yet another financial dealer. There’s no central collateral clearing desk or depositary– where all of these transactions can be observed. It means long term savings can be turned into short-term transactions that are part of the counter-party web of global financial markets.
Psychopaths Caused the Financial Crisis … And They Will Do It Again and Again Unless They Are Removed From Power - Bloomberg notes: The “corporate psychopaths” at the helm of our financial institutions are to blame [for the financial crisis]. Clive R. Boddy, most recently a professor at the Nottingham Business School at Nottingham Trent University, says psychopaths are the 1 percent of “people who, perhaps due to physical factors to do with abnormal brain connectivity and chemistry” lack a “conscience, have few emotions and display an inability to have any feelings, sympathy or empathy for other people.” As a result, Boddy argues in a recent issue of the Journal of Business Ethics, such people are “extraordinarily cold, much more calculating and ruthless towards others than most people are and therefore a menace to the companies they work for and to society.” How do people with such obvious personality flaws make it to the top of seemingly successful corporations? Boddy says psychopaths take advantage of the “relative chaotic nature of the modern corporation,” including “rapid change, constant renewal” and high turnover of “key personnel.” Such circumstances allow them to ascend through a combination of “charm” and “charisma,” which makes “their behaviour invisible” and “makes them appear normal and even to be ideal leaders.”
Bring Back Boring Banks - CENTRAL bankers barely averted a financial panic before Christmas by replacing hundreds of billions of dollars of deposits fleeing European banks. But confidence in the global banking system remains dangerously low. To prevent the next panic, it’s not enough to rely on emergency actions by the Federal Reserve and the European Central Bank. Instead, governments should fully guarantee all bank deposits — and impose much tighter restrictions on risk-taking by banks. Banks should be forced to shed activities like derivatives trading that regulators cannot easily examine. The Dodd-Frank financial reform act of 2010 did nothing to secure large deposits and very little to curtail risk-taking by banks.In fact, an overwhelming proportion of the “quick cash” in the global financial system is uninsured and prone to manic-depressive behavior, swinging unpredictably from thoughtless yield-chasing to extreme risk aversion. Much of this flighty cash finds its way into banks through lightly regulated vehicles like certificates of deposits or repurchase agreements. Money market funds, like banks, are a repository for cash, but are uninsured and largely unexamined. Relying on the Fed and other central banks to counter panics is dangerous brinkmanship. A lender of last resort ought not to be a first line of defense.
Peter Schiff interviews Ann Barnhardt (video) Farmers and ranchers have had their operating capital stolen by JP Morgan. Former CEO of Barnhardt Capital Management, Ann Barnhardt shut her firm down in the wake of MF Global's collapse to protect her customers. She calls for a general strike against the financial markets. Ouch!
Interview with Attorney James Koutoulas on the Legal Battle with MF Global and JP Morgan - MF Global has now become the 8th largest bankruptcy in history; resulting in the loss of over one billion customer funds. Jim discusses the broad importance of this case with the attorney representing 8000 affected clients regarding his legal battle with MF Global and JP Morgan.
MF Global sold assets to Goldman before collapse: sources (Reuters) - MF Global unloaded hundreds of millions of dollars' worth of securities to Goldman Sachs in the days leading up to its collapse, according to two former MF Global employees with direct knowledge of the transactions. But it did not immediately receive payment from its clearing firm and lender, JPMorgan Chase & Co , one of the sources said. The sale of securities to Goldman occurred on October 27, just days before MF Global Holdings Ltd filed for bankruptcy on October 31, the ex-employees said. One of the employees said the transaction was cleared with JPMorgan Chase. At the same time MF Global, which was run by former Goldman Sachs head Jon Corzine, was selling securities to Goldman to raise badly needed cash, the futures firm was also drawing down a $1.2 billion revolving line of credit it had with JPMorgan, according to one of the former MF Global employees. JPMorgan spokeswoman Mary Sedarat said the bank did not withold money because of the line of credit. She declined further comment on details of the transactions.
MF Global Sold Assets to Goldman While It Was Looting Their Customer Accounts - It turns out that MF Global sold hundred of millions in assets to Goldman in the last two business days before its bankruptcy. It is not clear that MF Global actually received the payment for the sale, or if the funds were held by their clearing agent and banker, JP Morgan, who knew that they were going to be bankrupt. That revolving line of credit at JPM of $1.2 Billion is about the size of the missing customer funds. I wonder if JPM withheld payment on the sale of Goldman assets, and took customer assets as collateral for the credit line. As MF Global's banker they were at the center of most if not all of these transactions. The idea that the customer money was 'missing' is ludicrous. It would be more correct to say that the ownership of the money was disputed, and was in the hands of JP Morgan and perhaps Goldman. These are serious offenses. But it becomes even worse if JPM afterwards sought to withhold the stolen funds and cover up the transactions, impeding an official investigation. And then their legal maneuvering afterwards to cut the customer interests in the courts is of course beneath contempt.
Yes, Virginia, Brokerage Firms Keeping Client Ripoff Provisions in Customer Agreements in the Wake of MF Global - Yves Smith - In the wake of the collapse of MF Global, and the evaporation of funds in customer accounts, even ones with no margin lending, investors big and small have become duly concerned about the safety of their funds. For those of you who are not brokerage customers, one of the big achievements of the 1930s security law reforms was their success, up until now, in putting rules in place that protected customer assets. Numerous broker/dealers have failed but their clients’ funds were recovered. Needless to say, old market hands like Jesse have reacted with alarm: One would think that the customers should be paid first out of all MF Global creditors. But I suspect that where it is possible, their loss will be subordinated to the unsecured creditors like JPM who have a powerful influence with this Trustee and the courts. The customers of consequence, like the Koch brothers, appear to have been tipped off weeks in advance. This is the perversity of law without justice. If that happens, then nothing is safe. If a customer in cash and Treasuries can be robbed, and then be made to stand in line with unsecured creditors, then your 401(k)s are not savings but loans to the custodians of your plans. Now may be the time to exit all arrangements not specifically guaranteed directly by the government, and bring your money home. If they steal from one unpunished, they can steal from any and all almost at will. You are not an insider, and there is no honor among thieves. You are prey.
MF Global Probe: Congress Presses Rating Firms - Congressional investigators are stepping up their inquiry into how deeply credit-rating companies examined the disastrous bet that sank MF Global Holdings Ltd. and whether the firms overlooked crucial information in their evaluations, according to people familiar with the matter.The chairman of the House Financial Services subcommittee on oversight and investigations sent letters to Moody's Corp. Chief Executive Raymond McDaniel and Standard & Poor's Ratings Services President Douglas Peterson seeking detailed information about the firms' procedures for determining MF Global's credit worthiness. The letters, sent Dec. 27 by Rep. Randy Neugebauer (R., Texas) and reviewed by The Wall Street Journal, show investigators are focusing on whether the rating firms missed signals that MF Global was making overly risky bets on European government bonds. The letters indicate that government officials plan to delve deep into the decision-making processes at the rating companies in the months and days leading up to MF Global's demise. The rating firms played a central role in the events that led to MF Global's sudden downfall. In late October, the firms downgraded MF Global's credit ratings amid rising concerns about the European bet, helping trigger a run on the firm that eventually led to its Oct. 31 bankruptcy filing.
MF Global Inquiry Turns to Its Primary Regulator - Federal authorities investigating the collapse of MF Global have expanded their inquiry to include the actions of the CME Group, the operator of the main exchange where the commodities brokerage firm conducted business, according to people briefed on the matter.CME, which also served as MF Global’s primary regulator, has come under heavy criticism after $1.2 billion in customer money disappeared from MF Global. The Commodity Futures Trading Commission, the government agency leading the case, is scrutinizing CME’s conduct in the days before MF Global filed for bankruptcy on Oct. 31. In particular, the commission is reviewing whether CME’s efforts to verify the safety of customer money were sufficient, the people said. CME, for its part, has said that MF Global may have intentionally produced inaccurate documents related to customer accounts. If the federal regulator finds that CME did not meet the standards of so-called self-regulatory organizations, it could fine or sanction the exchange. The commission could also revoke CME’s status as a self-regulator, though that is unlikely. Experts say it is rare for the government to hand down any manner of sanction against a self-regulatory body.
SEC: Yes, Banks WILL Still Be Able To ‘Neither Confirm Nor Deny’ Wrongdoing - The SEC issued a statement today that's been jumped on by some outlets as a major policy change in how the agency settles complaints. Turns out, it's mostly semantics. In the statement, SEC enforcement director Robert Khuzami said the SEC's new policy will be to drop "neither confirm nor deny" language only when a defendant has already admitted guilt in a criminal case. NCND will remain in use for settlements involving civil liability. "This policy change does not affect our traditional 'neither admit nor deny' approach in settlements that do not involve criminal convictions or admissions of criminal law violations," he said. The goal of the change is to eliminate confusion about the language applying to cases involving parallel criminal and civil complaints. Khuzami says it will apply only to a minority of cases, and will not affect the agency's appeal of Judge Jed Rakoff's November Citigroup decision.
Bank of America severing some small-business credit lines - Bank of America Corp., under pressure to raise capital and cut risks, is severing lines of credit to some small-business owners who have used them to stay afloat. The Charlotte, N.C., bank is demanding that these customers pay off their credit line balances all at once instead of making monthly payments. If they can't pay in full, they are being offered new repayment plans for as long as five years, but with far higher interest rates than their original credit lines had. Business owners complain that BofA's credit squeeze is abrupt and could strain their small companies and even put them out of business. The credit cutoff is coming at a time when the California economy can't seem to catch a break, and bucks what the financial industry says is a new trend of easing standards on business loans. One such customer, Babak Zahabizadeh, was told in a letter that the $96,000 debt carried by his Burbank messenger service must be repaid Jan. 25. A loan officer offered multiple alternatives over the phone that Zahabizadeh called unaffordable, including paying off the debt at 12% interest over two years. That's about $4,500 a month, nearly 10 times his current interest-only payment.
More Awful PR For Bank Of America As They Start Cutting Off Credit To Mom And Pop - Apparently Bank of America has totally given up on winning hearts and minds. Because according the L.A. Times, the embattled bank is cutting off credit to small businesses in droves — maybe even in the hundreds of thousands. Take, for instance, Babak Zahabizadeh, the owner of a Burbank, California messaging service. He was told in a letter that he needed to pay off his $96,000 loan by January 25th or (another option) he could pay it off in 2 years at a 12% interest rate. That would make his payment 10 times his current payment. Zahabizadeh said he was not notified beforehand of the changes to his loan. Bank of America, on the other hand, said they started informing affected customers as early as 2010.All that aside, this story simply looks awful. And it looks even worse in the midst of a series of recent Bank of America fails:
- There was that story about BofA harassing a little old lady about her deceased husband's debt.
- There was the $335 million they agreed to pay out to settle a Department of Justice suit against Countrywide (Countrywide was discriminating against black and Latino clients by forcing them to pay higher rates).
- And, of course, the 22 year old who protested BofA's proposed debit card fees by cutting up her card on video.
Maryland Courts Require More Proof in Debt Collection Cases, Ringing in Some Debt Collection Cheer - In many states, a creditor or debt collector can easily obtain a default judgment with just a person’s name, last known address and Social Security number, and the judgment can follow the person around for years despite that the debt was never proven. Due to a flood of uncontested debt collection cases in Maryland, its high court has just ruled that for all cases filed on or after January 20, 2012, collectors and creditors must produce actual proof that the debtor incurred the debt. This can be done by producing a copy of a signed bill or contract, or other evidence of the debt. Debt buyers also must prove they actual hold the debt through a valid purchase, a common stumbling block for collecting debt buyers. In making this decision, the Maryland Court of Appeals (which is Maryland’s high court) took into consideration that many cases end in default judgments, a problem Nationwide. The decision also evidences a distrust of those pesky (often fraudulent) affidavits. Let’s hope other states decide to follow suit and put collectors to their proof.
More Bank Chicanery: Double Charging on Escrow Fees - As we have reported repeatedly, based on independent reports from numerous consumer attorneys and investors, servicer engage in numerous form of petty larceny which they pass off as “mistakes” when caught out. The problem with this excuse is that servicers are set up to be highly routinized environments, so any reasonably widespread error is not a mistake, but policy. However, it is remarkably difficult for borrowers to get servicer internal records, even in litigation, and even then, borrowers need to incur considerable costs (as in hire an expert witness) to dispute the accuracy of the bank’s charges. Despite the general “missing in action” posture of bank regulators, one office has taken a tough stance of abuses, namely, the US Bankruptcy Trustee. A New York Post story by Catherine Curran reports that the Trustee is investigating double dipping in the New York City area by Wells Fargo and GMAC (now Ally). Borrower attorneys contend this practice is common at all servicers: Many homeowners opt to pay part of their property taxes and homeowners insurance with their mortgage every month. The funds are then put into an escrow account and used to periodically pay the taxes and insurance. But after falling behind on a few payments, troubled borrowers in Chapter 13 often find that their bank or mortgage servicer tries to collect twice on the escrow funds — once as part of the overall mortgage payment, and again as a separate “escrow shortage” charge. The average double charge is about $2,000, said forensic accountant Jay Patterson of Full Disclosure in Arkansas, who sees escrow issues in half the cases he examines.
Buy Here Pay Here Dealerships - The LA Times did a three-part series this fall on what they call "Buy Here Pay Here" car dealerships. (Here is Part One, Part Two, and Part Three). The name, which was new to me, comes from a common requirement that customers return to the lot to make their loan payments. The high-interest-rate loans are usually for aging, high-mileage vehicles to people with ragged credit. The idea of the "pay here" is to provide ample opportunity for dealers to keep track of the car's--and customer's--whereabouts and to increase the likelihood of repayment by customers. One year ago (almost to the day), Credit Slips discussed the repossession rates for auto title loans. Unlike buy here/pay here, auto title loans are not to purchase a car but require a person to pledge their car's ownership if a loan is not paid back. Adam Levitin came up with an estimated rate of 14-18% for repossession on auto title loans but emphasized how difficult it was to get such data. Surprisingly to me, the LA Times managed to get the buy here/pay here industry to not just share--but to gloat--about how this business model works. The key data: 1) About 1 in 4 buyers default. 2) The dealerships make an average profit of 38% on each sale, more than double the profit margin of conventional retail car chains.But the sale of the car is what has helped Buy Here Pay Here dealerships largely elude regulation or enforcement activity. Most states have no special rules for these dealerships, unlike for auto title loans, which several states ban outright.
The CFPB Gets a Director - The CFPB is finally getting a Director, which enables it to exercise its full range of powers. It's good to see this Administration show some backbone. Better late than never, I guess, and Rich Cordray is a great pick. While this is a step forward, I worry that the CFPB and Director Cordray will feel that they have to walk on eggshells so as not to rile Congressional Republicans and draw continued scrutiny. There's a fine line that the CFPB will have to navigate in terms of what fights to pick--there are some fights it needs to have and some that are better to avoid to live to fight another day, but I'm happy to see this as the new problem for the CFPB.
Obama to Make Recess Appointment of Richard Cordray to Head Consumer Financial Protection Bureau - Yves Smith - I have not seen this hit the news wires, but got this via Lisa Epstein, in turn from Our Financial Security, which is part of the Center for American Progress, which is a heavyweight Democrat think tank. This move raises the obvious question: why didn’t Obama make a recess appointment of Elizabeth Warren, either back in the day when she was the de facto head, or after getting her out of the limelight for a bit (so that the Republicans would be less likely, as turned out to be the case, to engage in procedural gamesmanship to thwart a recess installation)? We had discusses this at the time, but the major reasons seemed to be: 1. Obama was never going to do anything that would seriously ruffle the banks, given that that they are a major source of campaign funds; 2. Even if Obama had a weak moment in which he was tempted to ignore consideration 1 (as in Warren might persuade banks that what was good for consumers might be good for them too), an Warren appointment would be over Geithner’s dead body, and Obama was and is dependent on Geithner; and 3. Having Warren run for the Scott Brown seat is useful to the Dems (the Dems lacked a really strong alternative in Mass, she pulls money from other Republican campaigns, and she is likely to become a largely non-threatening ornament). Regardless of the motives, this move proves yet again what Obama’s real priorities are, and they ain’t you and me. Cordray was opportunistic in his anti-bank moves in Ohio and is no substitute for Warren.
No More Mr. Nice Obama - There’s a common and compelling logic to President Obama’s recess appointments today of Richard Cordray to head the Consumer Financial Protection Board and of three appointees to the National Labor Relations Board. In the case of both boards, the appointments were necessary if the boards were to function at al—the very reason that Senate Republicans had made clear their determination to appoint nobody at all to the two boards. In December, Republicans filibustered Cordray’s nomination, stating clearly that they had nothing in particular against Cordray but were opposed to the existence of the board itself, which had come into being as part of the Dodd-Frank Financial Reform Act passed by Congress in 2010. Lacking the votes to repeal the act, Republicans chose instead to kill the board by refusing to confirm a director, without which the board could not fully, or even substantially, function.
Who is Richard Cordray, and what is he going to do? — Cordray first entered public office as a Democratic politician, serving one term as a Ohio state representative in the early 1990s before being redistricted out of office. But he rebounded to serve as treasurer and then attorney general of Ohio — and that’s where he built his reputation as one of the nation’s leading consumer advocates. As attorney general, Cordray aggressively pursued lawsuits3 against some of the country’s biggest financial firms — including AIG, Bank of America and Fannie Mae — for misleading4 the state’s pension funds, ultimately securing a $700 million settlement from AIG over accounting fraud. He also led an early effort to go after so-called “foreclosure mills” that used falsified documents to speed up foreclosures on consumers, suing5 Ally Financial in 2010 and campaigning for big banks to slow down their own foreclosure proceedings. “We pursued many actions against foreclosure rescue scammers who were reaching into the pockets of desperate people in an effort to steal what little remained as they sought to keep their homes,” Cordray told the Senate banking committee in September.
Standing up for consumers - Richard Cordray - Today, I was appointed by President Obama to serve as the first Director of the Consumer Financial Protection Bureau. I am honored by this opportunity to continue my work on behalf of consumers. And I am energized by the responsibilities and challenges facing the Bureau. The importance of this day has less to do with me personally and much more to do with you – and the millions of individuals and families across the country who access consumer financial markets every day to participate in our economy and to pursue their dreams and aspirations. That’s because now, with a Director, the CFPB can exercise its full authorities – with respect to both banks and nonbanks – to help those markets operate fairly, transparently, and competitively.
Recess Appointments: Why Now? - On the news today that Obama will make a recess appointment to Richard Cordray to Head CFPB, Yves Smith says:Obama to Make Recess Appointment of Richard Cordray to Head Consumer Financial Protection Bureau: ...This move raises the obvious question: why didn’t Obama make a recess appointment of Elizabeth Warren...? ... I'd guess the administration would argue that the GOP hadn't yet crossed over some threshold of intransigence, this was part of a more general reelection strategy (plans to make three recess appointments to the NLRB were also announced), the political opportunity wasn't right, or something like that. But it's a good question -- why now instead of then (a question that can also be asked about Peter Diamond's nomination to the Federal reserve Board of Governors)? What it says to me is all that matters is Obama's reelection (see, for example, the pivot to deficit reduction) -- when the timing's right for that, things will happen -- but don't keep your fingers crossed otherwise. If you are unemployed and struggling, the president will try to help if it also helps him get reelected, but helping because it's the right thing to do? Not likely.
Obama Recess-Appointing Only in Dire Circumstances - I think we have found the unifying thread on the President’s recess appointments yesterday. He did not decide to make appointments on key financial regulatory positions, like OCC or FDIC or the Federal Reserve, and some worry that those nominees will now get blocked from confirmation as a result, though they are seen as uncontroversial. The President reserves the right to make those appointments later, but if he’s fed up with Senate obstructionism, why not rip the band-aid off now? The reason is pretty clear. The President is making a distinction between nominees who the various agencies can do without for a spell and nominees whose seating is crucial to the functioning of the agency. The CFPB would not have full regulatory powers without a seated director, including the ability to regulate non-bank financial institutions. Some conservatives are making the argument that a reading of the Dodd-Frank law, which birthed the CFPB, demands that said director be confirmed by the Senate, but that impression is created through the sin of omission, and while the argument may be possible colorable, it’s highly unlikely that a judge would make a distinction between a recess and a regular-order appointment in that matter. So CFPB activates its non-bank authority through the seating of Richard Cordray.
Cordray moves forward despite appointment challenges —Newly installed Consumer Financial Protection Bureau director Richard Cordray 1laid out his agenda Thursday, vowing to press ahead despite political objections and legal questions about his status as a recess appointee. “It’s a valid appointment. I’m now the director of the bureau. . . . We now have our full authority to move forward,” Cordray said in his first public speech as the agency’s director, a day after President Obama used a recess appointment 2to bypass Republicans who had blocked Cordray’s confirmation in the Senate. “The most important thing is to keep our nose to the grindstone and keep doing our work,” Cordray said in remarks at the Brookings Institution. “We will prove our own case, both to people who represent the public and to the public at large.” As for the legal questions about his appointment — which Obama put through in less than 10 days of congressional recess, breaking with precedent — Cordray said he would “leave the details to others.”
GE Leading Borrowers as $620 Billion Comes Due: Credit Markets - General Electric Co. and Ally Financial Inc. lead U.S companies that have $620 billion of bonds and loans coming due in 2012 as borrowing costs start to rise from record lows with the economy strengthening. GE, the world's largest maker of jet engines, faces $78.7 billion of notes maturing in 2012, the most of any U.S. company, according to data compiled by Bloomberg. Detroit-based Ally has $11.7 billion that needs to be repaid, the largest requirement of any speculative-grade issuer. Borrowers must refinance $498 billion of debt in 2013 and $505 billion in 2014, Bloomberg data show. Detroit-based Ally has $11.7 billion that needs to be repaid, the largest requirement of any speculative-grade issuer. Borrowers must refinance $498 billion of debt in 2013 and $505 billion in 2014, Bloomberg data show.
Inside a Banker’s Mind - Isn’t it great that Occupy Wall Street is pretty much over? Though the truth is in some ways, they did us a favor. You know how a magician will gesture wildly with his left hand so you ignore what he’s doing with his right? Well, Occupy was like the magician’s left hand. We need people to ignore what’s happening in Washington—the magician’s right hand--and because people are more interested in demonstrations than the details of government, they’re overlooked what really counts. And, unlike the magician, we didn’t even have to do anything to make it happen. It’s as if the audience distracted itself. Plus, the occasional bad behavior of the Occupy folks and second-guessing the authorities shifted attention from us too. What matters, of course, is that we pull the fangs of the Dodd-Frank Act. Take the Consumer Financial Protection Bureau. If it makes good on the goal of protecting consumers—from us--it may reduce our profits. So far, though, the strategy that we and Congressional Republicans are pursuing to cripple it is working beautifully, and most people haven’t even noticed.
Did Psychopaths Take Over Wall Street Asylum? - It took a relatively obscure former British academic to propagate a theory of the financial crisis that would confirm what many people suspected all along: The “corporate psychopaths” at the helm of our financial institutions are to blame. Clive R. Boddy, most recently a professor at Nottingham Trent University, says psychopaths are the 1 percent of “people who, perhaps due to physical factors to do with abnormal brain connectivity and chemistry” lack a “conscience, have few emotions and display an inability to have any feelings, sympathy or empathy for other people.” As a result, Boddy argues in a recent issue of the Journal of Business Ethics, such people are “extraordinarily cold, much more calculating and ruthless towards others than most people are and therefore a menace to the companies they work for and to society.” How do people with such obvious personality flaws make it to the top of seemingly successful corporations? Boddy says psychopaths take advantage of the “relative chaotic nature of the modern corporation,” including “rapid change, constant renewal” and high turnover of “key personnel.” Such circumstances allow them to ascend through a combination of “charm” and “charisma,” which makes “their behaviour invisible” and “makes them appear normal and even to be ideal leaders.”
Exposing American Banks' Multi-Trillion Umbilical Cord With Europe - One of the reports making the rounds today is a previously little-known academic presentation by Princeton University economist Hyun Song Shin, given in November, titled "Global Banking Glut and Loan Risk Premium" whose conclusion as recently reported by the Washington Post is that "European banks have played a much bigger role in the U.S. economy than has been generally thought — and could do a lot more damage than expected as they pull back." Apparently the fact that in an age of peak globalization where every bank's assets are every other banks liabilities and so forth in what is an infinite daisy chain of counterparty exposure, something we have been warning about for years, it is news that the US is not immune to Europe's banks crashing and burning. The same Europe which as Bridgewater described yesterday as follows: "You've got insolvent banks supporting insolvent sovereigns and insolvent sovereigns supporting insolvent banks." In other words, trillions (about $3 trillion to be exact) in exposure to Europe hangs in the balance on the insolvency continent's perpetuation of a ponzi by a set of insolvent nations, backstopping their insolvent banks.
Goldman's Latest Boiler-Room Stock: America - Taibbi - It seems Jim O'Neill, the head of Goldman's Asset Management department, is predicting that the United States stock market may go up "15 to 20 percent." O'Neill apparently believes Ben Bernanke and the Federal Reserve will resort to another round of money-printing, and finally green-light the long-awaited "Qe3," or third round of "Quantitative Easing." The QE programs involve the Fed printing hundreds of billions of dollars and pumping them into the marketplace, where they ostensibly stimulate the economy (although recent experience tells us that the money mostly ends up being swallowed by the financial services industry). Anyway, Bernanke declined to go ahead with a third QE program in late 2011, but O'Neill apparently thinks we'll get it in 2012. From Bloomberg: "If QE2 doesn’t work, then we’ll get QE3," said O’Neill, who was named chairman of the money manager in September after working as the co-head of global economics research and chief currency economist at New York-based Goldman Sachs Group Inc. since 1995. There’s a "good chance" the S&P 500 will rise 15 percent to 20 percent in the next 12 months, he said. Goldman is building an impressive resume of sweepingly bullish predictions that later on, in retrospect, look more like signals to investors that they should run screaming in the opposite direction.
What will give U.S. bankers ulcers in 2012 - Despite the ongoing economic slump and warnings of burdensome new regulations, the U.S. financial system remained surprisingly robust and resilient through the end of 2011 — in no small part because of the havoc that the Euro crisis wreaked upon other countries. In 2012, the big fights over regulation at home and the Euromess abroad will continue to be front and center, and U.S. financial institutions will largely remain on the defensive. Here are three key issues that will be at stake in the early months of this year:
1) Can Europe pull back from the brink? The fate of the Eurozone will continue to be the most single important factor affecting the global economy and the U.S. financial system. For the moment, Europe doesn’t appear to be headed off a cliff. But everyone will be watching to see if the latest interventions, austerity promises and lending will be enough to restore confidence and liquidity to the continent.
2) What will happen to the most unwieldy, controversial new bank regulation? When it comes to Dodd-Frank, there’s little that concerns U.S. banks more than the Volcker Rule. It’s meant to curb speculative bets that banks make for their own benefit — known as “proprietary trading” — rather than that of their customers. But those in the finance community warn that this could make lending far more difficult.
3) Will Congress pitch another fit over the debt-ceiling and the payroll tax? In principle, both of these should be non-issues on Capitol Hill. But the same conservative Republicans who led the backlash against these measures in 2011 can be expected to do so, to some degree, in 2012.
REPORT: RBS Axing Up To 10,000 Jobs From Its Investment Bank - Yesterday, we learned that RBS was in the process of making some major cuts to its investment banking division. But the details were limited. Now the Financial Times' Patrick Jenkins, Sharlene Goff and Anousha Sakoui report these cuts could include slashing up to 10,000 jobs. The cuts are expected to focus on RBS’s equities business, which has failed to compete in the upper rankings of the industry. This division generated just £623m of the £5bn of revenue produced by the investment bank in the first nine months of last year. One person familiar with the bank’s plan said it was preparing to exit the cash equities business entirely and may also withdraw from equity derivatives, mergers and acquisitions advisory and shrink its structured credit and interest rates business. That would leave RBS’s investment bank – which employs 19,000 staff – barely half its current size, with remaining strengths in debt capital markets, foreign exchange and interest rates, albeit in shrunk form. Read the whole report at FT.com >
MBIA Wins Judgment Ruling Against Countrywide -- Bank of America Corp. lost a ruling in a court fight against MBIA that will help the bond insurer as it tries to recover losses on home loans made by the bank’s Countrywide Financial unit. MBIA, which says it was duped into guaranteeing payment on Countrywide mortgage bonds, needs only to show the lender made misrepresentations about the loans backing the bonds, instead of establishing they caused the losses the insurer is seeking to recover, New York state Judge Eileen Bransten said in a decision issued today. “No basis in law exists to mandate that MBIA establish a direct causal link between the misrepresentations allegedly made by Countrywide and claims made under the policy,” she wrote. The ruling is among legal disputes with bond insurers and investors that “could significantly impact” the potential costs from loans made before the collapse of the U.S. housing market in 2008, Bank of America said in a regulatory filing in August. Defeats on such matters may add as much as $9 billion to what Bank of America owes bond insurers, according to an August estimate by hedge fund Branch Hill Capital, which has bet against the lender’s stock and has invested in MBIA.
Win for MBIA in Ruling Against Countrywide (Updated: Maybe Not Really) - Yves Smith - Bloomberg reports that Countrywide took a major setback in a suit against it by bond insurer MBIA. MBIA has alleged (quelle surprise!) that Country misrepresented the quality of loans it had MBIA guarantee. From Bloomberg: Bank of America Corp. (BAC) lost a court fight against MBIA Inc. (MBI) over the hurdles the bond insurer will have to clear in a lawsuit seeking to force the bank to buy back faulty home loans made by its Countrywide Financial unit. I’m no lawyer, but I find this ruling puzzling, and I expect Bank of America to appeal it. If you are suing someone, you not only have to establish that you did something wrong, but you also need to establish that you were damaged and come up with some sort of basis for arguing how badly you were damaged. Reader MBS Guy has read both rulings, and I will turn the mike over to him: Have read this through finally, and I would conclude it is not the victory it is made out to be. However, here’s how I see it: with respect to MBIA’s common law and NY State Insurance Law fraud claims, the judge rules that MBIA does not need to prove that a direct causal link between the alleged misrepresentations and the loss MBIA suffered. However, the judge notes that MBIA’s burden remains quite high: (1) MBIA must prove that the misrepresentations were material to MBIA’s decision to enter the policies (and that the misrepresentations occurred), (2) that MBIA relied on the information misrepresented, (3) that it would not have issued the policy if not for the alleged misrepresentations, (4) that the alleged misrepresentations materially increased MBIA’s risk, and (5) that MBIA was damaged as a direct result of the material misrepresentations. Then MBIA must prove the amount of its damages.
JPMorgan Chase Sued For $95 Million Over Allegedly Misrepresenting Mortgage Loans - JPMorgan Chase & Co has been sued for $95 million by the trustee for securities marketed in 2005 by the former Bear Stearns Cos over alleged misrepresentations regarding the underlying mortgage loans. US Bank NA wants to force JPMorgan to buy back the mortgage loans because of alleged breaches of representations and warranties regarding the Bear Stearns Asset Backed Securities Trust 2005-4, for which it serves as trustee. It also said JPMorgan has refused to provide the underlying loan, as the trust documents require, so it can investigate the extent of the alleged breaches. The unit of US Bancorp said it made its request at the direction of a majority certificate holder in the trust. US Bank also sued Bear Stearns and its former EMC Mortgage Corp unit. JPMorgan bought Bear Stearns in 2008. A JPMorgan spokeswoman did not immediately respond to requests for comment. The lawsuit was filed on Friday in the New York State Supreme Court in Manhattan, and publicly docketed on Tuesday.
Reis: Office Vacancy Rate declines slightly in Q4 to 17.3% -- From Reuters: Office vacancies fell in Q4 as rents rose: Reis The vacancy rate dipped to 17.3 percent in the quarter from 17.4 percent in the third quarter and 17.6 percent at the end of 2010, Reis said. ... effective rents ... rose 0.5 percent ... Some 12.3 million square feet of new office space came to market last year, it said, the lowest such level in 15 years. This graph shows the office vacancy rate starting in 1991. Reis is reporting the vacancy rate declined to 17.3% in Q4, down from 17.4% in Q3. The vacancy rate was at a cycle high of 17.6% in Q3 and Q4 2010. It appears the office vacancy rate peaked in 2010 and is declining very slowly. As Reis noted, there are very few new office buildings being built in the US, and new construction will probably stay low for several years.
The Most Important Set of Graphics You'll Find in a BIS Speech - I'm still in catch-up mode, but I keep coming back to this presentation (PDF)—four times now. It's a speech by BoJ member Masaaki Shirakawa in Tokyo on the 22nd of December last year to the Board of Councillors of Nippon Keidanren (Japan Business Federation), entitled "Globalization and population aging - challenges facing Japan." Go through the whole thing, but—most especially for U.S. readers—Chart 5. Pay especial attention to Bank Lending and Housing Prices. Then Riddle Me This, as it were: If U.S. housing prices are stable or basically plateaued overall, then there isn't a growing decline in credit quality from that sector (the way there was in Japan over the comparable period). So why is bank lending in the U.S. so low and going lower?
A New Theory of the Role of the GSEs in the Housing Bubble -- Bill Black has an interesting new take on the role of Fannie and Freddie in the housing bubble. He sees their investment in non-prime mortgages as being driven by executive compensation, rather than a fight for market share against investment bank securitization conduits or govt affordable housing policy. The government affordable housing policy point has been repeatedly debunked. Black is not, however, able to disprove the market share theory. What he does point to is that the GSE's involvement with nonprime mortgages was as whole loans kept in portfolio, rather than securitized (and also via purchases of MBS), which he says was a move to increase the short-term yield for the GSEs and thus maximize short-term executive compensation. I think this is an interesting theory, but there are a few data points necessary to make it work, and I'm skeptical that they all support Black. He argues that Fannie and Freddie first tried to goose their returns by increasing the size of their whole loan portfolios and thus taking on massive interest rate risk. Fannie bet the wrong direction on interest rates and this resulted in the Fannie accounting scandal as it tried to cover up its losses. Freddie got the bet right, but then tried to set up a "cookie jar" to cover future losses in order to inflate future earnings. The SEC was having none of it, and forced out the CEOs and mandated accounting restatements. In the wake of these scandals, OFHEO (the GSE's regulator) made the GSEs limit their hedging activities and reduce the size of their portfolios.
Choice words from William Black -- He writes: If one had to pick one person in the private sector most responsible for causing the global financial crisis it would be Wallison. As I explained, he is the person, who with the aid of industry funding, who has pushed the longest and the hardest for the three “de’s.” It was the three “de’s” combined with modern executive and professional compensation that created the intensely criminogenic environments that have caused our recurrent, intensifying crises. He complained during the build-up to the crisis that Fannie and Freddie weren’t purchasing more affordable housing loans. He now claims that it was Fannie and Freddie’s purchase of affordable housing loans that caused the crisis. He ignores the massive accounting control fraud epidemics and resulting crises that his policies generate. Upon reading that Fannie and Freddie’s controlling officers purchased the loans as part of a fraud, he asserts that the suit (which refutes his claims) proves his claims. The piece is long, but worth reading in its entirety.
How small-time house-flippers made the housing bubble much worse - An old pearl of wisdom from the Great Depression held that investors should have known it was time to sell when shoeshine boys started handing out stock tips. Until this past week, I thought of the house-flipping craze of the mid-aughts in the same light. The fact that there were enough speculative, small-time investors in house prices that A&E turned it into a reality show was surely a sign of a market out of control. But what I didn’t realize was that, unlike the shoe-shine tipsters of the ’20s, house-flippers were actually driving the price explosion. New research from the Federal Reserve Bank of New York indicates that flippers were in fact sufficiently numerous and active to make a major impact on prices, and that these facts have interesting implications for both monetary policy and bank regulation in the future. The data let us see that the growth of house prices in the first half of the aughts was closely associated with a sharp rise in the number of people owning multiple homes. In 2000, only 20 percent of mortgages were going to multiple mortgage holders and 75 percent of those were for second houses. By 2006, 35 percent of mortgages were multiples and more than 5 percent of all loans were going to people with four or more mortgages.
Bailout concerns mounting for federal housing agency - Concerns are growing that the Federal Housing Administration will need to be bailed out by taxpayers. The agency's latest monthly outlook report revealed a spike in serious delinquencies for FHA-insured loans, posing a further threat to the agency's already depleted cash reserves. According to the report, the percentage of loans in the FHA's portfolio with three missed payments or more rose to 9.3% in November, up from 8.4% in August. In November, an independent audit of the FHA's finances found that losses from mortgage defaults had depleted the agency's reserve fund to 0.24%, or $2.6 billion, during fiscal 2011 -- well below the Congressionally-mandated 2% level. (The ratio measures the net worth of the reserve fund compared with the value of the loans FHA has insured.) In 2006, the reserve fund stood at 7%. At the time, the agency's auditor warned that if home prices continued to drop, FHA could run through the remainder of its reserves, forcing it to either seek a bailout from the Treasury Department or further increase the premiums it charges borrowers. The FHA doesn't issue mortgages, but instead insures lenders against defaults.
Quelle Surprise! Banks Plan to Fob off Some of the Costs of Multi-State Mortgage Settlement on Investors - Yves Smith - Never underestimate the ability of banks to find new and creative ways to steal. The latest brazen scheme comes in a report from the Financial Times on the current state of play on the so-called multi-state mortgage settlement negotiations. Readers may recall that even though a nominal settlement total of $25 billionish has been bandied about for some time, comparatively little of that is to be in cash. The bulk of the amount is to come from credits for principal modifications. We’ve said this is patently inadequate, since the damage done by servicer driven foreclosures (something yet to be dimensioned adequately), bogus charges to investors, and damage to land records goes way beyond the amount under discussion. Catherine Masto of Nevada got somewhere between $27,000 and $57,000 per homeowner from one servicer, Saxon, which puts the amounts being discussed here to shame. And even though we took issue with how the CFBP came up with its math, it went through an exercise intended to determine how much the servicers should pay as disgorgement. The amount they should pay for damages has never been estimated, and by any logic should be considerably larger. But not only are they not going to pay enough, and not much in hard money, the banks are now trying to shift the cost of their settlement on to investors.
Fed White Paper: "The U.S. Housing Market: Current Conditions and Policy Considerations" - From the Federal Reserve: The U.S. Housing Market: Current Conditions and Policy Considerations. Excerpt on converting REO to rental units: At the same time that housing demand has weakened, the number of homes for sale is elevated relative to historical norms, due in large part to the swollen inventory of homes held by banks, guarantors, and servicers after completion of foreclosure proceedings. These properties are often called real estate owned, or REO, properties. The combination of weak demand and elevated supply has put substantial downward pressure on house prices, and the continued flow of new REO properties--perhaps as high as 1 million properties per year in 2012 and 2013--will continue to weigh on house prices for some time. In contrast to the market for owner-occupied houses, the market for rental housing across the nation has recently strengthened somewhat. Rents have turned up in the past year, and the national vacancy rate on multifamily rental properties has dropped noticeably from its peak in late 2009. Although small investors are currently buying and converting foreclosed properties to rental units on a limited scale, larger-scale conversions have not occurred for at least three interrelated reasons.
Fed offers remedies for US housing market - The US Federal Reserve has offered policymakers about a dozen ideas on how to aid the ailing US property market, warning that if no action is taken, home prices will continue to slump and restrain the current economic recovery.The Fed’s proposals were delivered on Wednesday to the heads of the financial services committees in Congress. In a letter accompanying the report, Ben Bernanke, Fed chairman, told lawmakers that the paper’s goal was to provide legislators with a “framework for thinking about certain issues and trade-offs that policymakers might consider”. Among the ideas is forming a national strategy to facilitate the conversion of foreclosed properties into rentals; allowing banks to rent their repossessed homes rather than forcing lenders to sell them; changing the compensation structure for mortgage servicers, companies that collect payments from borrowers and pursue foreclosures in the event of a default; creating a national online registry of liens to track ownership interests; and altering existing Obama administration policies to allow for more refinancings and mortgage restructurings. Investors would suffer reduced losses, banks would save money, and more homeowners would either get to keep their homes or move into more affordable housing if the Fed’s suggestions were adopted, the central bank says. “The ongoing problems in the US housing market continue to impede the economic recovery,” the Fed said. But, it added, “there is scope for policymakers to take action ... that could ease some of the pressures afflicting the housing market”.
The Fed's Advice on the Housing Crisis - The Federal Reserve tried Wednesday to stir interest among policy makers in the problems afflicting the housing market, sending a white paper to Congress outlining suggestions for easing those problems. The paper makes two basic points: 1. There are no silver bullets. 2. It certainly would be helpful if Fannie Mae and Freddie Mac, which are controlled by the government, gave the health of the housing market greater priority than their own short-term financial condition. The Fed is concerned that the collapse of mortgage lending during the financial crisis is hardening into “a potentially long-term downshift in the supply of mortgage credit.” One reason for this, the paper says, is that Fannie and Freddie, which provide the money for most mortgage loans, are scaring lenders by aggressively seeking refunds on defaulted loans. The policy helps Fannie and Freddie “maximize their profits on old business and thus limits draws on the U.S. Treasury, but at the same time, it discourages lenders from originating new mortgages,” the paper says. In a similar vein, the paper says that Fannie and Freddie — known as government-sponsored enterprises, or G.S.E.’s — have pushed to resell foreclosed properties even when converting properties into rental units makes more sense. The paper calculates that for two-fifths of the properties owned by Fannie Mae, renting could actually reduce its losses.
Fed White Paper discusses REO-to-Rental Program, says Further Modification of HAMP Would "involve additional taxpayer funding, overriding private contract rights" - Inquiring minds are digging into a Fed white paper regarding The U.S. Housing Market: Current Conditions and Policy Considerations. Here are a couple of key snips. Broadly speaking, HAMP emphasizes modifications in which the net present value to the lender of the modification exceeds the net present value of pursuing a foreclosure. However, although policymakers might very well decide that the social costs--while obviously difficult to gauge--are great enough to justify additional loan modifications, lenders are unlikely to be willing to make such modifications on their own. Moving further in this direction is thus likely to involve additional taxpayer funding, the overriding of private contract rights, or both, which raises difficult public policy issues and tradeoffs. REO to Rental Program Design The data cited earlier suggest that a government-facilitated REO-to-rental program has the potential to help the housing market and improve loss recoveries on REO portfolios. The FHFA released a request for information on August 10, 2011, to collect information from market participants on possible ways to accomplish this objective and received more than 4,000 responses. An interagency group in which the Federal Reserve is participating is considering issues related to the design of a program that would facilitate REO-to-rental conversions.
Ben Bernanke Offers A Game-Changing Recommendation For The Housing Industry: A white paper (via @carney) sent from Ben Bernanke to the chairs of the Senate and House committees of banking and financial services and released today is not just a subtle nudge at Congress to do something to address lingering weakness in the housing industry. For the generally tight-lipped Federal Reserve, this sounds a lot like a call to action. In the release, the Fed suggests that the government find a way to convert a significant segment of the stock of real estate owned properties (REOs)—essentially, properties held by banks or other institutions after foreclosure—into rentals. While it refrains from making specific policy recommendations, it emphasizes the importance of doing something to help bear the burden of reviving the housing industry. The challenge for policymakers is to find ways to help reconcile the existing size and mix of the housing stock and the current environment for housing finance. Fundamentally, such measures involve adapting the existing housing stock to the prevailing tight mortgage lending conditions--for example, devising policies that could help facilitate the conversion of foreclosed properties to rental properties--or supporting a housing finance regime that is less restrictive than today’s, while steering clear of the lax standards that emerged during the last decade. In fact, it goes so far at to suggest that the government could screw up the recovery if it doesn't start supporting such housing initiatives:
Ben Bernanke's Solution To The Housing Crisis: Renting Foreclosed Homes: While millions of foreclosed homes languish on the market at lower and lower prices, new data supports the idea that renting out these foreclosed homes could be the long-sought solution to the housing crisis. Rental units are leasing quickly, and the vacancy rate for apartments is at its lowest level in a decade, according to data released Thursday. In many areas, rents are rising. On Wednesday, Federal Reserve Chairman Ben Bernanke got on board, penning a 26-page white paper, arguing that now is an unusually good time to convert foreclosed properties to rental units for three reasons: demand for owner-occupied homes remains low, demand for rental properties is rising, and the problem of banks' continued hesitance to offer mortgages to everyday Americans means that the situation won't change anytime soon. The federal government's recognition of the value of renting foreclosed homes is not entirely new. In August 2011, the Federal Housing Finance Agency, the government body that oversees troubled mortgage giants Fannie Mae and Freddie Mac, requested proposals on how to implement such a program. The agency received over 4,000 responses, and is currently sorting through them as it considers how best to handle Fannie Mae and Freddie Mac's foreclosed properties. The two mortgage companies collectively own roughly half of the nation's foreclosed homes. However, the just-released white paper expands the conversation by identifying obstacles to transitioning foreclosed homes to rental units, challenges that some housing practitioners say are easily surmountable if there is the political will and financial incentive to fix them.
Quelle Surprise! Fed Sees We Have a Big Mortgage Problem - 01/05/2012 - Yves Smith - It certainly is gratifying to see the Board of Governors of the Federal Reserve, via a paper released on Wednesday, “The U.S. Housing Market: Current Conditions and Policy Considerations,” finally acknowledge that US has a mortgage/foreclosure mess that is not going to go away by virtue of QE or other efforts to goose financial asset prices. However, just as the Fed was late to see the global housing bubble (even the Economist was on to it in June 2005), so to is it behind the curve in its take on the housing problem. This paper at best constitutes a good start, when, pace Churchill, the Fed is at the end of the beginning when it really needs to be at the beginning of the end. However, before we get to the housing/mortgage market issues, we wanted to focus on a political element of the paper which may be more important that its analytical content. The Fed is openly crossing swords with the FHFA. Although the document is studiedly neutral in its tone, it makes clear in its coded way that it regards the GSE focus on short term loss minimization as destructive (note the Fed is hardly alone in this view). The Fed argues (with some supporting data) that in a lot of cases, converting REOs to rental would be a better policy, although it bizarrely fails to consider the “own to rent” option of keeping the current borrower in place. The paper is also a bit clueless about the realities of managing rental properties.
More Housing Policy - Today Freddie Mac announced it is extending the period for forbearance for unemployed borrowers. That is probably just the beginning of a series of policy announcements. Three Fed officials discussed some possibilities today (see WSJ article below), and some sort of REO to rental program seems likely. The revamped HARP for refinancing is just ramping up. Also the servicer mortgage settlement will probably be announced in the next month or so. It will be a busy month or two for housing policy. From Freddie Mac: Freddie Mac Now Permits Up To 12 Months Forbearance To Unemployed Borrowers Freddie Mac today announced it is giving mortgage servicers expanded authority to provide six months of forbearance to unemployed borrowers without Freddie Mac's prior approval and up to an additional six months with prior approval. From the WSJ: Three Fed Officials Urge Action to Boost Housing Top Federal Reserve officials ramped up their call for more forceful government action to fix the broken housing market ... "The ongoing weakness in housing has made it more difficult to achieve a vigorous economic recovery," William Dudley, president of the New York Fed, told a bankers' group in Iselin, N.J. "With additional housing policy interventions, we could achieve a better set of economic outcomes."
NY Fed President Dudley Crosses Swords With GSEs and Board of Governors on Housing/Mortgage Mess - Yves Smith - A speech by New York Fed president William Dudley is a bit of a surprise, in that it acknowledges the severity of the deepening mortgage crisis and sets forth some specific policy proposals. I still find these recommendations frustrating, in that they are insufficient given the severity of the problem and also fail to come to grips with widespread servicer abuses (not just servicer driven foreclosures, but also what amounts to theft from investors, via schemes such as double charging fees to borrowers and investors, inflating principal balances, reporting REO as sold months later than the transaction closed, and getting kickbacks on third party charges). But they are more serious than other ideas from senior financial officials. Specifically, the Dudley advocates principal relief via a program of “earned principal reduction” which would allow for put options for all severely underwater borrowers who stay current on their mortgages for three years. But as we will discuss, this proposal is less meaningful than it sounds. It looks at if the NY Fed is trying to provide intellectual leadership in the debate around the housing mess, which given the level of denial and kick the can down the road strategies being offered as alternatives, means this effort stands out in part by virtue of the shoddy alternatives. And this posture put it squarely at odds with the Board of Governors, whose paper published earlier this week pooh-poohs principal writedowns and specifically opposes giving broad scale principal reductions to homeowners with negative equity. One has to wonder whether the Board of Governors paper was released prior to the Dudley speech with the specific aim of undermining it. Similarly, the NY Fed is also in opposition to the GSE’s resistance to offering principal mods, as evidenced by the leak from the mortgage settlement talks, in which the GSEs refused participate in the banks’ scheme to use mods on securitized loans (which would include GSE loans) as a way to reach the settlement target for principal mods.
Fed officials push more help for housing -(Reuters) - Three top Federal Reserve officials aggressively pushed on Friday for more stimulus for the U.S. housing market, saying that other government policymakers as well as the central bank should be looking at ways to help the sector in order to speed the economic recovery. In separate speeches, the Fed officials -- William Dudley, the president of the New York Federal Reserve Bank; Fed Governor Elizabeth Duke; and Eric Rosengren, president of the Boston Fed -- warned that the fragile housing sector threatens to derail a U.S. recovery. Their remarks came even as a robust government jobs report provided fresh evidence that the recovery is gaining. The push for action came two days after the Fed entered the thorny debate over how to use the two main government-run mortgage finance firms, Fannie Mae and Freddie Mac , to turn around the housing market.
Freddie Mac Is Going To Give The Unemployed A Break On Mortgage Payments For Up To A Year: Freddie Mac announced this afternoon that it will allow unemployed Americans up to a 12-month forbearance on their mortgage payments. According to the statement, Freddie Mac will allow mortgage services to extend 6 months of forbearance without approval and up to 12 months with their approval. Freddie Mac says that 10% of delinquencies on its mortgages are tied to unemployment. The new plan takes effect February 1, 2012. Tracy Mooney, an SVP in servicing at Freddie Mac said, "These expanded forbearance periods will provide families facing prolonged periods of unemployment with a greater measure of security by giving them more time to find new employment and resolve their delinquencies. We believe this will put more families back on track to successful long-term Homeownership." The move by the federal agency comes amid increasingly populist rhetoric from the White House.
LPS on Mortgages: "Trend toward fewer loans becoming delinquent has halted" - From LPS Applied Analytics: LPS' Mortgage Monitor Shows Halt in Delinquency Drop; Foreclosure Starts Down in November The November Mortgage Monitor report released by Lender Processing Services, Inc. shows that while mortgage delinquencies at the end of November 2011 were nearly 25 percent less than the January 2010 peak, the trend toward fewer loans becoming delinquent, which dominated 2010 and the first quarter of 2011, appears to have halted. At the same time, new problem loans – those loans seriously delinquent as of the end of November that were current six months prior – have not improved significantly in the last year. According to LPS, 8.15% of mortgages were delinquent in November, up from 7.93% in October, and down from 9.02% in November 2010. LPS reports that 4.16% of mortgages were in the foreclosure process, down from the record 4.29% in October, and up from 4.08% in November 2010. This gives a total of 12.31% delinquent or in foreclosure. It breaks down as:
• 2.33 million loans less than 90 days delinquent.
• 1.81 million loans 90+ days delinquent.
• 2.21 million loans in foreclosure process.
This graph shows the total delinquent and in-foreclosure rates since 1995. The in-foreclosure rate was at 4.16%, down from the record high last month of 4.29%. There are still a large number of loans in this category (about 2.21 million). LPS reported that foreclosure starts were down nearly 30% in November, probably due to process issues.The third graph shows the pipeline ratio (90+ delinquencies and foreclosures, divided by foreclosure sales).
LPS Mortgage Monitor Shows Little Improvement in New Problem Loan Rates, First Time Delinquencies Slowly Rising Since April, Cures to Current Status Decline - The LPS' Mortgage Monitor Report Shows Halt in Delinquency Decline; Foreclosure Starts Down Nearly 30 Percent in November. Via Email ... - The November Mortgage Monitor report released by Lender Processing Services, Inc. hows that while mortgage delinquencies at the end of November 2011 were nearly 25 percent less than the January 2010 peak, the trend toward fewer loans becoming delinquent, which dominated 2010 and the first quarter of 2011, appears to have halted. At the same time, new problem loans - those loans seriously delinquent as of the end of November that were current six months prior - have not improved significantly in the last year. This degree of stagnation indicates that while the situation is not getting markedly worse, it is not improving either, and inventories of troubled loans remain significantly higher than pre-crisis levels across the board. Here are a sampling of charts from the December 2011 Mortgage Performance Observations click on any chart for sharper image
The 18 Best Mortgage Market Charts From 2011
Bank charge of the day, mortgage-payment edition - It makes sense, for lots of reasons, to make your mortgage payment on the day you get paid. Most salaried Americans, however, get paid every two weeks. Which means, to all intents and purposes, that you need to be able to make one mortgage payments out of every two paychecks. And that in turn raises an intriguing possibility: if you take half of your mortgage payment out of every paycheck, you’re going to end up making 13 mortgage payments a year. Which will pay down your mortgage faster, and could save you thousands of dollars.Enter the ever-helpful Citibank, with a product which does just that. It’s called The BiWeekly Advantage Plan®, and it’s essentially an automated mortgage payment, of half your monthly mortgage payment, which comes out of your account every two weeks. Easy. There’s even a Savings Calculator to see how much less money you might be able to end up paying. And then, of course, there’s this: There is a one-time non-refundable enrollment fee of $375 and a transaction fee of $1.50 for each draft. That’s an up-front fee of $375, plus another $39 a year, just for the privilege of making your mortgage payments every two weeks rather than every month.
Principal Write-Down Pilot Program in Massachusetts - A Boston nonprofit, Boston Community Capital, is teaming up with some financial institutions, in particular Bank of America, in a pilot program that has the effect of writing down mortgages to close to home value. BCC says it works with qualifying homeowners and banks to buy underwater homes, either in short sales or at foreclosure, and then sells them back to owners at just above current market value. The nonprofit takes the risk of making the resale and allows those buying back to use their own lender or a mortgage company that BCC works with. BCC is playing a gatekeeping role as far as who qualifies. Also, BCC may have better credibility with distressed homeowners than financial institutions such as B of A do. The pilot is supposed to test whether such a program can be run without promoting “strategic default,” according to the NPR story. Principal write-down is much needed relief to stabilize the housing market and reduce the lose-lose impact of foreclosure, so this is a pilot worth watching. A concern, however, is whether we can trust any reports that come out about it. Also, a supposed fact cited in the NPR story is unattributed and highly doubtful—that 30 percent of private home loan modifications last year involved principal write-down.
The Restatement of Property and the Road to Mortgagocracy - I recently did a string of blog posts of the Permanent Editorial Board for the UCC's Report on the enforcement of negotiable mortgage notes. I'm still planning a final installment there, but I came across another document that just floored me in showing how across another American Law Institute product that just floored me in how deeply captured and compromised part of the legal elite is. The document in quest is section 5.4(c) from the Restatement (2d) of Property. The Restatements are an ALI-only product (unlike the UCC, which is jointly done with NCCUSL), and they are the ALI's signature product. They are meant to "restate" the law, meaning summarize and improve it, sort of the way Yiddish versions of Shakespeare plays were unironically advertised as farbesert un fartaytsht (improved and translated). That is to say the restatements are meant to be positive summaries of the law, but they often have normative spins. Section 5.4(c) appears to stand for a very simple and uncontroversial principle (pace FNMA v. Eaton), that only the obligee of a mortgage note has the right to foreclose on the note: A mortgage may be enforced only by, or in behalf of, a person who is entitled to enforce the obligation the mortgage secures. In other words, a naked mortgage's got nothin' (are you listening AZ Supreme Court?). But then the comments and illustration go off the deep-end.
As Winter Arrives, Occupy Protesters Shift Movement To Saving The 99 Percent’s Homes - Facing both plummeting temperatures and evictions from parks in New York City, Los Angeles, Boston, and elsewhere, Occupy protesters are shifting their actions during the winter season. They are refocusing their energy on protest actions against politicians, creative demonstrations, and tackling the nation’s foreclosure crisis. Around the country, Occupy protesters have moved homeless families into vacant homes, disrupted foreclosure auctions, and outright stopped foreclosures of families’ homes, forcing banks to renegotiate terms. One of the most high-profile victories last month was when Occupy Atlanta protesters descended on the home of Iraq war veteran Brigitte Walker. A few days later, Occupy Fort Lauderdale saved a family from a foreclosure as well. Occupy Our Homes worked with a coalition of local groups to move a homeless family into a home in East New York early last month. In Chicago, anti-foreclosure demonstrators and Jewish activists held a special Hannukah celebration inside of a reclaimed home. Yesterday, Occupy Kingston went door-to-door visiting with homeowners on pre-foreclosure lists, counseling them on how to negotiate with banks. Occupy Our Homes is calling on activists everywhere to help save a family farm in Harrisburg, Pennsylvania and a home in Maui, Hawaii. You can help in both cases by making phone calls and sending faxes (instructions are at both links).
In or Out of Mortgage Trouble? A Study of Bankrupt Homeowners - This is a newly published paper in the American Bankruptcy Law Journal that I was lucky to work on with Daniel McCue and Eric Belsky at the Joint Center for Housing Studies at Harvard University. Using previously unexamined data in the 2007 Consumer Bankruptcy Project, we study what makes homeowners more or less likely to have mortgage troubles as they head into bankruptcy. Although much can be said about the econometric analysis, for now I wanted to mention quickly that the paper includes descriptive details about bankrupt homeowners (debtor-reported) such as numbers of missed mortgage payments, use of adjustable rate mortgages, mortgage broker use, mobile homes, and refinancing or home equity lines of credit. So please check it out!
Michael Olenick: Is Shadow Housing Inventory Vastly Larger Than Widely Believed? - I believe that parasitic financial institutions have pushed the boundaries so far that they’ve put their host, the middle-class itself, at risk. One new bit of information suggests the housing front is in more perilous shape than most pundits believe. One challenge when performing any type of analysis is that information is scattered in many different places, and even when disseminated by the government its accuracy is oftentimes questionable. We’ve already seen existing home sales for recent years revised downward from their already dismal position, with barely a yawn from the public and no accountability whatsoever from government regulators who used that information when more reliable sources existed. I don’t understand why accurate housing data, which is supposed to be open to the public, is so hard to come by. The housing crisis arguably rises to the level of a national emergency, one we can see and fee every day as it ripples through the economy. Despite that, government-owned Fannie Mae still keeps loan-level data away from the public, it’s extremely difficult to get data from Freddie Mac, and MERS’ database remains a black hole. There is one piece of data only recently released — and, as far as I can tell, has gone unnoticed — that, if true, suggests the housing market is in such dire straits we’ve finally reached a critical mass where only radical out-of-the-box solutions will work. If this information, which comes of a highly suspect albeit well connected insider, is accurate, then extend and pretend has finally reached its natural end.
Comments on the Housing Vacancies and Homeownership Survey - This morning Dean Baker wrote about the Housing Vacancies and Homeownership Survey: Robert Samuelson Oversells the Case for Economic Optimism - [W]e are still far from making up for the overbuilding of the bubble years as indicated by the fact that the vacancy rate remains at near record levels.(There have been some questions raised about the accuracy of the Census Department's data, claiming that it overstates the number of housing units in the country. Those raising the issue fail to note that measures of housing starts do not include housing units that were created by conversion of commercial or industrial property, such as an old warehouse being turned into condos. The rehabilitation of dilapidated units would also not be included in housing start numbers. The critics of this measure must show how the Census methodology would lead it to overstate the share of units that are vacant.) First, the main criticism of the HVS is it doesn't match the decennial Census results. The Census Bureau has acknowledged this and promised to investigate the differences. It is important to note that the HVS is benchmarked to the decennial Census, so the most recent vintage for housing inventory was benchmarked to the 2010 Census. So clearly the Census Bureau thinks that is a better estimate of the total housing inventory.
Mortgage demand fell at year-end, purchases sag (Reuters) - Demand for loans to buy homes and refinance mortgages slid in the final week of 2011, even as mortgage rates dipped, an industry group said on Wednesday. Applications for U.S. home mortgages fell 4.1 percent in the week ended December 30, weighed down by a 9.6 percent drop in purchase loan requests and a 2.5 percent decline in refinancing requests, seasonally adjusted data from the Mortgage Bankers Association showed. Average 30-year conforming mortgage rates dipped to the year's low of 4.07 percent from 4.10 percent the prior week, and well below 4.82 percent at the end of 2010. The slide to near-record-low borrowing rates has spurred more homeowners to seek refinancing, propelling that index up more than 60 percent in 2011.
Vital Signs: More Homes Going Into Contract - More homes are selling. The National Association of Realtors’ index of pending home sales rose for the second consecutive month in November. The index, a measure of existing homes that go into contract, is now at its highest level since April 2010, when sales got a boost from an expiring tax credit for home purchases.
First-time buyers lean on the bank of mom and dad Reuters: (Reuters) - Billy Lacher couldn't have purchased his split-level home in October without a little help from an increasingly popular financial institution: The Bank of Mom and Dad. The 31-year-old New York City firefighter and his wife put a 10 percent downpayment on the $285,000 three-bedroom home, but his parents provided an additional $20,000 (half as gift, half as loan). Lacher's not unusual. About a third of first-time buyers in 2011 got either a gift (26 percent) or a loan (7 percent) from their families to help finance their home purchases, down slightly from 2010, but consistent with assistance levels seen during the last decade, according to data from the National Association of Realtors (NAR). But industry observers think the level of parental generosity is even higher, with some giving children money for home purchases so far in advance of a loan application that the gift isn't disclosed to lenders, or, if they've got the resources, buying homes outright for their adult kids and setting up an after-the-fact intra-family loan agreement. In November, all-cash buys among first-timers hit a high of 13 percent, That's up from 6 percent in 2009, when IFM first began tracking it. Cecala said that when first-time buyers buy outright, it's likely their parents who are purchasing on the children's behalf.
Van line: Calif. jumps to No. 7 U.S. destination - Allied Van Lines’ 44th annual “Magnet States Report” says that at least by its own business patterns California is back as on the “inbound list” — states with more folks moving in than out. Moving van activity is seen by some experts as a good indication of migration for executive-level employees. These pricier relocations are often paid for by the moving workers’ employer. And Allied’s California moving patterms were by no means unique as two competitors saw similar trends. What Allied called “the biggest surprise” on its inbound leader board, was ranked No. 7th most popular destination. Note: By this same math, California was the top outbound state in 2004 and 2006 — ranked 40th from the top last year! Overall, Texas was the top destination, by Allied metrics: It had 1,556 more inbound moves than outbound — but that’s down from 1,640 in 2010. Florida was second with a net gain of 809 moves; followed by South Carolina, Colorado and Oregon. Illinois had the most net outbound losses followed by Pennsylvania, Michigan, New Jersey and New York.
The New American Dream: Rent, Don’t Buy - Call it the Big Selloff—America is headed toward a future in which fewer people own the spaces they call home. The effective homeownership rate, which excludes borrowers whose homes are underwater, stands at 62 percent, down from 69 percent in 2006, according to a 2010 report by the New York Federal Reserve. As more people move from owning to renting, apartment vacancy rates have fallen fast, from 8 percent in 2009 to 5.6 percent in third quarter 2011. That’s pushed up rents in all markets by 2.5 percent, including apartments and single-family homes, to an average of $846 nationwide, according to Local Market Monitor, a home price forecaster. For a two-bedroom dwelling, the average rent was at $1,020 in June 2011. Those trends are just the beginning, concludes a July report from investment bank Morgan Stanley: the United States is becoming a nation of renters and home ownership will keep falling. And that, say some experts, could be good for the country.
Reis: Apartment Vacancy Rate falls to 5.2% in Q4, Lowest since 2001 - Reis reported that the apartment vacancy rate (82 markets) fell to 5.2% in Q4 from 5.6% in Q3. The vacancy rate was at 6.6% in Q4 2010 and peaked at 8.0% at the end of 2009. From the WSJ: Apartment-Vacancy Rate Tumbles to 2001 Level The nation's apartment-vacancy rate in the fourth quarter fell to its lowest level since late 2001 ... In the fourth quarter, the vacancy rate fell to 5.2% from 6.6% a year earlier and 5.6% at the end of the third quarter, according to Reis. During the depths of the downturn, landlords had to offer incentives such as flat-screen TVs and months with no rent to attract tenants. But in the fourth quarter of 2011, landlords in 71 of the 82 of the markets that Reis follows were able to raise rents. ... Nationwide, landlords raised asking rents an average of 0.4% in the fourth quarter, to $1,064 a month. That's up from $1,026 in 2009.This graph shows the apartment vacancy rate starting in 2005. Reis is just for large cities, but this decline in vacancy rates is happening just about everywhere.
U.S. Apartment Vacancies Decline to a Decade Low of 5.2%, Rents Increase - U.S. apartment vacancies dropped to a 10-year low in the fourth quarter, allowing for rent increases that are likely to continue this year, Reis Inc. said. The vacancy rate fell to 5.2 percent, the lowest since the end of 2001, the New York-based property research firm said in a report today. It was 5.6 percent in the previous three months and 6.6 percent a year earlier. The average monthly effective rent, or what tenants paid after landlord giveaways, climbed 2.3 percent from a year earlier to $1,009, Reis said. Rising foreclosures and stricter mortgage-lending standards have helped make rental housing the best-performing segment of commercial real estate for the past two years. The vacancy rate has fallen for seven straight quarters from a three-decade high of 8 percent at the end of 2009, according to Reis. “With the strong occupancy we had this year, we were really able to push rents,”
Manhattan Apartment Sales Fall 12% on Waiting - Manhattan apartment sales fell 12 percent in the fourth quarter from a year earlier as Europe’s debt crisis and sluggish U.S. job growth dimmed buyer appetites. Purchases of condominiums and co-ops declined to 2,011 from 2,295 in the fourth quarter of 2010, The median price of units that changed hands in the final three months of 2011 climbed 1.2 percent from a year earlier, to $855,000. “Consumers paused to see how things play out with all the information that’s coming at them right now,” “Europe, the impasse in Washington over economic policy, the stagnant nature of the economy -- there’s a lot of conflicting economic news, and if you’re on the fence, maybe you wait a little bit.” Financial firms globally disclosed plans in 2011 to eliminate more than 200,000 jobs as they grapple with market turmoil, fallout from Europe’s sovereign-debt crisis and concerns that U.S. economic growth will slow. Morgan Stanley told regulators last week that it may dismiss 580 employees in New York City as the bank cuts 1,600 jobs. New York City’s unemployment rate was 8.9 percent in November, up 0.1 percentage point from the previous month and higher than the national average of 8.6 percent, the state Department of Labor said Dec. 15.
Construction Spending increased in November - This morning the Census Bureau reported that overall construction spending increased in November: The U.S. Census Bureau of the Department of Commerce announced today that construction spending during November 2011 was estimated at a seasonally adjusted annual rate of $807.1 billion, 1.2 percent (±1.6%)* above the revised October estimate of $797.4 billion. The November figure is 0.5 percent (±1.9%)* above the November 2010 estimate of $803.0 billion.This graph shows private residential and nonresidential construction spending, and public spending, since 1993. Note: nominal dollars, not inflation adjusted. Private residential spending is 64% below the peak in early 2006, and non-residential spending is 33% below the peak in January 2008. Public construction spending is now 12% below the peak in March 2009. The second graph shows the year-over-year change in construction spending. On a year-over-year basis, both private residential and non-residential construction spending have turned positive, but public spending is now falling on a year-over-year basis as the stimulus spending ends. The year-over-year improvements in private non-residential are mostly due to energy spending (power and electric).
Construction Spending And The Housing Quagmire -Among the “good” economic news today was private residential construction spending, which rose 2% in November and 3.4% year-over-year, according to the Census Bureau, confirming similar trends in building permits and housing starts reported earlier. Construction creates lots of jobs and contributes significantly to GDP. Everyone, from the President down to local politicians, wants it to grow. It gets them reelected. But for homeowners, banks, and tax payers, these trends are costly. Today's housing market is a consequence of the credit bubble that the Greenspan Fed engineered. It sparked a speculative boom. Developers went crazy. Lenders made liar loans. Values soared. People bought houses sight-unseen to get rich. Cities and states collected taxes. Everyone was happy. When the construction bubble peaked in January 2006, housing starts hit an annual rate of 2.3 million units. But after years of overbuilding, the frenzy dried up. What was left was a housing glut. And vacant units became the root cause of the decline in home values. There were a lot of them of vacant homes: 18.8 million in 2009, according to the Census Bureau. While reasonable people may have quibbles with that number, everyone agrees that the inventory of vacant units is immense. Whether it's 18.8 million or 12 million units only changes the duration of the healing process, not the problem itself.
Regional dispersion in vacancy and unemployment - Since I happen to have handy some regional data on the help-wanted index (HWI) for the U.S., I thought it might be interesting to see whether U.S. vacancy and unemployment dynamics in a cross-section display any interesting patterns. The regional HWI data is from the Conference Board. I explain here how the data was corrected for the recent substitution from print to electronic media in job advertising activities. That data was constructed for 36 U.S. cities. I construct a "vacancy rate" measure by dividing the HWI by the labor force and normalizing to 10 in 1990:1. Here is what the aggregate data looks like: As one would expect, there is a strong negative correlation between vacancies and unemployment; this is the so-called Beveridge Curve. Labor economists sometimes like to gauge labor market conditions by constructing a "labor market tightness" variable--the ratio of vacancies to unemployment, or the v/u ratio. The v/u ratio plays a prominent role equilibrium unemployment theory; see Diamond, Mortensen and Pissarides. As the following diagram shows, labor-market-tightness is highly procyclical.
U.S. Container Trade Rebounding at Fastest Pace Since May as Housing Gains - U.S. imports of containerized goods rose the most in six months in November as a recovering housing market bolstered consumer demand, according to The Journal of Commerce/PIERS, which tracks volumes through ports. Seaborne imports advanced 5 percent from a year earlier to 1.49 million 20-foot boxes, the biggest jump since May, the Newark, New Jersey-based company said in a statement today. Shipments of furniture, which account for about 10 percent of the total, gained 7 percent. Existing home sales rose 4 percent to 4.42 million units in November, while purchases of new single-family houses gained for a third consecutive month, according to data from the National Association of Realtors and the Census Bureau. The world’s largest economy expanded 2.75 percent in the fourth quarter, its fastest pace since the three months to June 2010, according to the median of 68 economist estimates compiled by Bloomberg.
Vital Signs: Port Traffic Muted - Fewer shipping containers are arriving at West Coast ports. The number of containers unloaded at the ports of Los Angeles and Long Beach fell 3.6% in November versus a year earlier, according to the ports. Retailers have kept inventories tight amid a still-uncertain economy, leading to less demand for overseas goods.
America’s top export in 2011 was . . . fuel? -- Fuel is now the top U.S. export. The Associated Press reports that America is on pace to ship out more gasoline, diesel and jet fuel than anything else in 2011. (Aircraft, motor vehicles, vacuum tubes and telecom equipment were next on the list of top exports.) Granted, this is only for refined petroleum products — and those exports are still dwarfed by America’s much, much larger imports of crude oil. Still, it’s the first time fuel has been our top export in 21 years. So how did this happen? UC San Diego economist James Hamilton has a more in-depth analysis. Perhaps the biggest factor, he writes, is the glut of new shale oil in North Dakota. Since there’s not enough pipeline infrastructure to get all that oil down to the Gulf of Mexico for export, it’s been piling up in Cushing, Okla. That makes it cheap for refineries in the Midwest to refine it and ship it out than to simply ship the oil directly. It’s also worth noting, as energy analyst Gregor McDonald points out in comments on Hamilton’s piece, that U.S. oil consumption has declined since 2006, which means that much of the refining capacity the country added in the past decade is now geared toward exports.
Weekly Gasoline Price Update: Second Week of Price Increases - Here is my weekly gasoline chart update from Department of Energy data with an overlay of West Texas Crude (WTIC). Gasoline prices at the pump -- both regular and premium -- rose four cents over the past week, which follows a 3 cent increase the week before. Regular is now 16.8% off its 2011 interim high set in early May 2011. Premium is down 15.2%. WTIC closed today at 102.83. It is 9.7% off its 2011 interim high, which also dates from early May 2011. As the first chart below shows, the price of oil has risen significantly since the interim low in early October while gasoline prices had trended downward until the last two weeks. Has the increase in the price of oil begun finding its way to the gasoline pump? As I write this, GasBuddy.com shows no states with the average price of regular above $4.
End of ethanol subsidy will raise the price of gas - Gasoline could cost 4.5 cents a gallon more starting as early as this week, and it's not because of rising oil prices. It's because Congress declined to renew the 30-year-old federal subsidy for ethanol, letting it expire Sunday. Ethanol, denatured grain alcohol used as a proven smog-cutting ingredient, currently makes up 10% of most gasoline-based motor fuel for general use, so-called E-10. In a few areas, E-85 fuel, 85% ethanol, also is available. E-85 can be burned only by vehicles equipped for "flex fuel." How much the end of the subsidy could add to gas prices, and how soon, is yet to be seen. Ethanol blenders got a 45-cents-a-gallon tax credit, which amounts to 4.5 cents for the amount blended into each gallon of E-10 fuel.It's hard to calculate the immediate impact. Oil prices and ethanol stocks are in flux. And unknown is the impact of another move by Congress: dropping the 54-cents-per-gallon tariff on ethanol imports. Brazil is a leading global producer of ethanol made mostly from sugar cane. In the U.S., ethanol primarily is made from corn.
Why gas mileage has barely budged since 1980 - It’s sometimes suggested that American car companies have quit making more efficient cars and trucks in recent decades. But that’s not strictly true, according to MIT economist Christopher Knittel. In a new paper for the American Economic Review, building off his earlier research (PDF), Knittel calculates that automakers actually boosted vehicle fuel efficiency a whopping 60 percent between 1980 and 2006. Engine technology got better by leaps and bounds. It’s just that most of those improvements went toward making cars bigger and more powerful — and, as a result, all those advances barely increased gas mileage. Knittel notes that automakers have made a slew of striking advances on the internal combustion engine over the past few decades — from variable-speed transmissions to front-wheel drive — that have drastically increased efficiency. But automakers mainly took advantage of those breakthroughs to build larger cars and light trucks with more powerful engines. Between 1980 and 2006, the average curb weight of vehicles increased 26 percent, while horsepower rose 10 percent. Average gas mileage, by contrast, improved just 15 percent.
How Do Consumers Spend Engine Efficiency Advances? On Bigger, Faster Cars - Auto companies have made great strides in improving engine efficiency in recent decades. But those improvements haven’t done much to improve the fuel economy of America’s passenger car fleet. Instead, consumers have “spent” most of those efficiency improvements on bigger, faster cars. MIT economist Christopher Knittel has carefully quantified these tradeoffs in a recent paper in the American Economic Review (pdf; earlier ungated version here). As noted by Peter Dizikes of MIT’s News Office: [B]etween 1980 and 2006, the average gas mileage of vehicles sold in the United States increased by slightly more than 15 percent — a relatively modest improvement. But during that time, Knittel has found, the average curb weight of those vehicles increased 26 percent, while their horsepower rose 107 percent. All factors being equal, fuel economy actually increased by 60 percent between 1980 and 2006, as Knittel shows in a new research paper, “Automobiles on Steroids,” just published in the American Economic Review. Thus if Americans today were driving cars of the same size and power that were typical in 1980, the country’s fleet of autos would have jumped from an average of about 23 miles per gallon (mpg) to roughly 37 mpg, well above the current average of around 27 mpg. Instead, Knittel says, “Most of that technological progress has gone into [compensating for] weight and horsepower.”
Vehicle Miles Driven Decline: A possible contributing factor - Earlier this week I noted that vehicle miles driven had declined in October. Most of the decline is probably due to high gasoline prices and the sluggish economy, but reader Dave sent me this article by Lisa Hymas: Driving has lost its cool for young Americans In 2008, just 31 percent of American 16-year-olds had their driver's licenses, down from 46 percent in 1983, according to a new study in the journal Traffic Injury Prevention. The numbers were down for 18-year-olds too, from 80 percent in 1983 to 65 percent in 2008, and the percentage of twenty- and thirtysomethings with driver's licenses fell as well. And even those with driver's licenses are trying to drive less; a new survey by car-sharing company Zipcar found that more than half of drivers under the age of 44 are making efforts to reduce the time they spend packed like lemmings into shiny metal boxes. The decline in driving by younger Americans is fed by many factors: the high cost of gas and insurance at a time of economic insecurity; tighter restrictions on teen drivers in many states; and roads that are more congested than ever, making driving less fun than ever. But the impact of the internet is big too. "It is possible that the availability of virtual contact through electronic means reduces the need for actual contact among young people,"
US: Personal Incomes Fall More During 'Recovery' Than During The Recession - America's longest economic recession since WWII, ended in June of 2009. The recession's end means that our economy has allegedly been in recovery mode since July of 2009, more than two and a half years. If we are in recovery, why have American's incomes dropped more during the recovery than they did in the recession? The facts are clear. Personal incomes fell during the recession by 3.2%. During the recovery (since July 2009), personal incomes have fallen an additional 6.7%. Those numbers were posted in a report by Sentier Research using numbers provided by the U.S. Census. (The RED line is the Household Income Index) The Obama administration has been touting the "recovery" of the American economy and yet this recent data seems to demonstrate that the average household is still waiting for some of the benefits seen in the stock market.
Vital Signs: Consumers Feeling More Confident - Consumers are feeling better about the economy. The Conference Board’s monthly index of consumer confidence rose to 64.5 in December, its highest level since April, before fears of a renewed recession arose over the summer. The survey found that consumers are both more comfortable with their current situation and more optimistic about the future.
Household Income Creeping Up - Here’s another glimmer of good news about the state of the U.S. economy: Household income is creeping up, notching a third consecutive month of gains in November. However, like all promising indicators from the recovery, this one is freighted with caveats: Although the 2.7% increase is significant, it isn’t necessarily sustainable, given economic risks at home and abroad — and perhaps more importantly, even with these gains, American households are far below their median income levels seen before the recession. Real median annual household income — that’s the figure at the middle of the middle adjusted for inflation — increased to $50,876 in November, up 2.7% from August’s $49,556, according to a report today from Sentier Research. The overall 2.7% increase since August breaks down as follows: Household incomes rose 1.1% from August to September; 0.8% from September to October, and 0.7% from October to November. (With rounding, the three figures tally to 2.7%.) “That 2.7% is a very strong rate of growth over a three-month period,” Mr. Green said. “It seems to be in accordance with a lot of other good economic reports.”
The Debtwatch Manifesto -The fundamental cause of the economic and financial crisis that began in late 2007 was lending by the finance sector that primarily financed speculation rather than investment. The private debt bubble this caused is unprecedented, probably in human history and certainly in the last century (see Figure 1). Its unwinding now is the primary cause of the sustained slump in economic growth. The recent growth in sovereign debt is a symptom of this underlying crisis, not the cause, and the current political obsession with reducing sovereign debt will exacerbate the root problem of private sector deleveraging. US private debt clearly rose faster than GDP from the end of World War II (when the debt to GDP ratio was 43%) until 2009 (when it peaked at 303%), but there is no intrinsic reason why it (or the public sector debt to GDP ratio) has to rise over time. I give a theoretical explanation elsewhere (Keen 2010), but an empirical comparison will suffice here: 1945 till 1965 were the best years of the Australian economy—with unemployment averaging 2 percent—and during that time the private debt ratio remained relatively constant at 25% of GDP (see Figure 2).
For 2012, Signs Point to Tepid Consumer Spending - American consumers are running out of tricks. As the weak economy has trudged on, they have leaned on credit cards to pay for holiday gifts, many bought at discounts. They are dipping into savings to cover spikes in gas, food and rent. They are substituting domestic vacations for international trips, squeezing more life out of their washing machines and refrigerators and switching to alternatives as meat prices have risen. That leaves little room for a big increase in spending in 2012, economists say, a shaky foundation for the most important pillar of the American economy. Even the seemingly robust holiday shopping season is raising concern. After a strong start on Thanksgiving weekend, a pronounced lull followed, causing retailers to mark down products heavily in the week before Christmas. While final numbers for the season are not in, analysts say they are worried that retailers had to eat into profits to generate high revenues. Consumer spending makes up 70 percent of the economy, so until it ignites, general growth is likely to be sluggish.
U.S. consumer in the slow lane - (Reuters) - It's up to the consumer to drive the U.S. economy and lift world growth in 2012, and the outlook is far from encouraging. Over the past three and half years, growth in U.S. consumer spending has averaged a paltry 0.2 percent adjusted for inflation, the weakest in the post-World War II period, Morgan Stanley says.While the employment picture is gradually brightening, wage growth is going in the opposite direction, keeping a lid on consumer behavior. Over the past year, pay for blue-collar workers adjusted for inflation fell 12 cents from the previous year, according to the Bureau of Labor Statistics. That was the steepest decline since the stagflationary days of 1980. Pay for all workers has fallen 16 cents this year in real terms. Consumer buying power, modest over the holiday season, remains constrained by heavy debt loads. Total U.S. household debt as a percentage of disposable personal income is down from its 2007 peak at 130 percent, but it remains well above its 1970-2000 average of 75 percent. As a result, Stephen Roach, non-executive chairman of Morgan Stanley, sees U.S. consumption remaining anemic for years to come. That will place a drag on global growth, especially in Asia, a big manufacturer of U.S. consumer goods.
A Few Quick Charts on Consumer Spending, by Tim Duy: In my last piece, I noted that excessive optimism or pessimism essentially cancelled each other out over the course of 2011 when tracking the overall economy. The same held true of consumption spending as well: Since the recession ended, consumer spending has been tracking a slightly slower growth trend than prior to the recession. Again, there looks to have been a long-lasting shock to the path of consumer spending. Interesting changes have occurred underneath the surface, however. The path of spending on services is markedly lower: This was the subject of a Wall Street Journal article last November: Increasingly, that means service businesses find it harder to get their share of consumer spending, which is prompting many business owners to scale back. At The Wall Street Journal's CEO Council conference this month, Alan Krueger, chairman of the president's Council of Economic Advisers, highlighted the service sector's central role for jobs growth. "Services account for about half of GDP, and over half of jobs," Mr. Krueger said. "Particularly discretionary services…people have been putting off getting their cars repaired because of concerns about jobs and income growth." This is certainly something weighing on job growth. That said, consumers are not foregoing all spending.
Record Dividends in 2012 Should Help Consumers - The dividend checks are in the mail. S&P Indices reported Wednesday that dividend increases reached $50.2 billion in 2011, up sharply from the $26.5 billion reported in 2010. In addition, S&P expects dividend payments to set a new record in 2012, surpassing the old high set in mid-2008 before the financial collapse and recession caused companies to cut back on payouts. The expected increases in dividends are important to the consumer outlook because dividends have been one of the fastest-growing segments of personal income. Since the recession ended, dividend income has shot up 43%, while total personal income increased less than 10%, according to Bureau of Economic Analysis data. Wage and salary disbursements have crept up only 6.6%. The growth leader has been farm income, up almost 52%. Looked at another way, dividends comprise about 6% of personal income but they have accounted for 21% of income’s growth since June 2009.
Rail Traffic Ends the Year With Strong Gains - The Association of American Railroads (AAR) today reported gains in 2011 rail traffic compared with last year, with U.S. railroads originating 15.2 million carloads, up 2.2 percent over 2010 and up 9.7 percent over 2009. Total U.S. rail intermodal volume in 2011 was 11.9 million trailers and containers, up 5.4 percent over 2010 and up 20.4 percent over 2009. In 2011, 14 of the 20 carload commodity categories tracked by AAR saw increases on U.S. railroads compared with 2010 indicating a broad recovery across industry sectors. The largest gains were: metallic ores, up 20.5 percent or 67,631 carloads; primary metal products, up 12 percent or 56,988 carloads; and petroleum products, up 11.1 percent or 36,811 carloads. AAR also announced gains in December 2011 rail traffic, with U.S. railroads originating 1,134,580 carloads, up 7.3 percent over December 2010, which is the largest year-over-year monthly increase since January 2011. U.S. rail intermodal originations totaled 873,390 containers and trailers, up 9.4 percent over December 2010. This is the second-highest monthly intermodal average for any December in history. During December 2011, 16 of the 20 carload commodity categories tracked by the AAR saw increases compared with December 2010.
AAR: Rail Traffic increased 7.3 percent YoY in December - The Association of American Railroads (AAR) reports carload traffic in December increased 7.3 percent compared with the same month last year, and intermodal traffic (using intermodal or shipping containers) increased 9.4 percent compared with December 2010. Total carloads for the year were 15.2 million, up 2.2% over 2010’s 14.8 million and up 9.7% over 2009’s 13.8 million. Total U.S. rail intermodal volume in 2011 was 11.9 million containers and trailers, up 5.4% over 2010’s 11.3 million units and up 20.4% over 2009’s 9.9 million units. On a seasonally adjusted basis, carloads in December were up 1.8% from last month, and intermodal in December was up 0.4% from November.This graph shows U.S. average weekly rail carloads (NSA). Rail carload traffic collapsed in November 2008, and now, 2 1/2 years into the recovery, carload traffic is still not half way back to the pre-recession levels. The second graph is for intermodal traffic (using intermodal or shipping containers): Intermodal traffic is close to the peak year in 2006. U.S. rail intermodal originations totaled 873,390 containers and trailers in December 2011, an average of 218,348 per week — up 9.4% over December 2010 and the second-highest monthly intermodal average for any December in history (behind December 2006 — see chart ...).
Vital Signs: Investment Cutback - U.S. businesses cut back on investment during the month of November. The Commerce Department said new orders for nondefense capital goods excluding aircraft — a proxy for business spending on new equipment — fell 1.2% in November from the previous month. New orders tumbled for products such as computers as well as machinery for mining and construction.
ISM Manufacturing index indicates faster expansion in December - PMI was at 53.9% in December, up from 52.7% in November. The employment index was at 55.1%, up from 51.8%, and new orders index was at 57.6%, up from 56.7%. From the Institute for Supply Management: December 2011 Manufacturing ISM Report On Business® Economic activity in the manufacturing sector expanded in December for the 29th consecutive month, and the overall economy grew for the 31st consecutive month, say the nation's supply executives in the latest Manufacturing ISM Report On Business®. . "Here is a long term graph of the ISM manufacturing index. This was above expectations of 53.2%, and suggests manufacturing expanded at a faster rate in December than in November. It appears manufacturing employment expanded in December with the employment index at 55.1%. New orders were up, and prices declined.
An Encouraging Start For 2012 Economic Releases - The first major economic release of the December economic profile suggests that momentum continues to bubble. The ISM’s factory index rose 1.2 percentage points to 53.9 last month, the highest since April and an acceleration from the pace of November's gain. If the first reading on the windup to 2011 is any indication, the statistical case is a bit stronger today for expecting the economy to muddle forward, perhaps at a slightly faster clip, in the months ahead. Reviewing the ISM index with the annual change in the stock market (S&P 500) implies that equity prices will trend higher. As the chart below shows, the ISM benchmark has been turning higher recently as the S&P has remained flat on a year-over-year basis. The bullish ISM report found support in today's other data release: construction spending for November, which rose an annualized 1.2% and is now at the highest level since June 2010. This report adds another data point to the argument that that the housing sector is finally reviving.
Manufacturing ISM Highest Since June; Expiring Business Tax Credits Explain Why; Enjoy it While You Can As US Decoupling Won't Last - The Institute for Supply Management released the December 2011 Manufacturing ISM Report On Business® "The PMI registered 53.9 percent, an increase of 1.2 percentage points from November's reading of 52.7 percent, indicating expansion in the manufacturing sector for the 29th consecutive month. The New Orders Index increased 0.9 percentage point from November to 57.6 percent, reflecting the third consecutive month of growth after three months of contraction. Looking for an explanation for the rise in December? I have one (and was aware of a likely jump in PMI in advance): 2011 Expiring Business Tax Incentives
- 100% Bonus Depreciation
- Self-Employment Tax Reduction –
- Section 179d Depreciation Provisions -
- 15 Year Straight Line Depreciation –
- Energy Efficient Appliance Credit.
‘Tis (still) the seasonality, ISM edition - A few weeks ago we posted this chart from of the Nomura economics team: It shows the recent diverging trend between the Fed’s measure of industrial production and that of the Institute for Supply Management (ISM). The explanation Nomura gave for the divergence was that of these two indicators, only the Fed measure had been properly adjusted (earlier in 2011) to account for seasonal biases in the data that have distorted a range of indicators since late 2008. These biases exist because the computational techniques used to seasonally adjust economic data inappropriately interpreted some of the downturn in the fourth quarter of 2008 as a new seasonal trend. Nomura went on to predict that the December ISM reading, which was released yesterday and beat consensus at 53.9, would be exaggeratedly strong because of these biases. (The production level subindex, which is what Nomura shows in the graph above, was 59.9.) Well, Goldman have a new note out today analysing the same thing, estimating that both the mild winter weather in the US and these seasonal biases gave the ISM reading an artificially strong boost, probably on the order of two or three points.
Vital Signs: Improving Factory Sector - The U.S. manufacturing sector is gaining strength. The Institute for Supply Management’s monthly survey of purchasing managers found that factory activity in December hit 53.9, the highest level since June. Readings above 50 indicate expansion. But the manufacturing sector has yet to regain all the momentum it lost during the summer slowdown, and activity is down from a year ago.
U.S. Light Vehicle Sales at 13.56 million SAAR in December - Based on an estimate from Autodata Corp, light vehicle sales were at a 13.56 million SAAR in December. That is up 8.9% from December 2010, and down 0.3% from the sales rate last month (13.60 million SAAR in Nov 2011). This was at the consensus forecast of 13.6 million SAAR. This graph shows the historical light vehicle sales (seasonally adjusted annual rate) from the BEA (blue) and an estimate for December (red, light vehicle sales of 13.56 million SAAR from Autodata Corp).The annualized sales rate was essentially unchanged from November, and the last two months were the strongest since June 2008 excluding cash-for-clunkers. The second graph shows light vehicle sales since the BEA started keeping data in 1967.This shows the huge collapse in sales in the 2007 recession. This also shows the impact of the tsunami and supply chain issues on sales, especially in May and June.
ISM Non-Manufacturing Index indicates slightly faster expansion in December - The December ISM Non-manufacturing index was at 52.6%, up from 52.0% in November. The employment index increased in December to 49.4%, up from 48.9% in November. Note: Above 50 indicates expansion, below 50 contraction. From the Institute for Supply Management: December 2011 Non-Manufacturing ISM Report On Business® Economic activity in the non-manufacturing sector grew in December for the 25th consecutive month, say the nation's purchasing and supply executives in the latest Non-Manufacturing ISM Report..This graph shows the ISM non-manufacturing index (started in January 2008) and the ISM non-manufacturing employment diffusion index. This was below the consensus forecast of 53.4% and indicates slightly faster expansion in December than in November.
Survey: Small Business Owners report small decline in employment, hiring plans positive - From the National Federation of Independent Business (NFIB): NFIB Jobs Statement: No Rally in Jobs at Close of 2011, but Small Business is Cautiously Optimistic about 2012 “Unfortunately, December’s jobs numbers fizzled, with the net change in employment per firm turning negative again; small businesses lost an average .15 workers per firm. ... The good news is that the number of owners cutting jobs has ‘normalized’. In the past several months, reports of those cutting workers have been at the lowest levels since the recession started in December 2007. ... Over the next three months ... a seasonally adjusted net 6 percent of owners planning to create new jobs, a 1 point decline but still one of the strongest readings since September 2008.Here is a graph of the net hiring plans for the next three months since 1986.Hiring plans declined slightly in December, but the trend is up. It is no surprise that small businesses are struggling due to the high concentration of real estate related companies in the survey. This is another slightly discouraging survey before the BLS report tomorrow.
Mike Mandel on productivity and Tyler Cowen on stagnation - Last week Mike Mandel published a very interesting chart as his nominee for the chart of the year. http://innovationandgrowth.wordpress.com/ He is using the net investment data to argue that capital spending is much smaller than generally assumed. Standard thinking is that since the early 1980s capital spending has been booming and despite cyclical swings real business fixed investment has moved up to record levels as this chart of real business fixed investment as a share of GDP shows.. Maybe, if you look at this chart that divides real business fixed investment into two categories: information tech ( IT) and all other, or more traditional capital goods it demonstrates that IT has accounted for virtually all the growth in real investment since 1980 and that it share of total capital spending has been steadily increasing -- it now accounts for 45% of the total. But IT equipment has a very different life span than more traditional capital equipment. Business computers have a life span of only about 2 years and communication equipment has a similar life span. In contrast, traditional capital equipment has a much longer life span. An office building, a ware house or something like a blast furnace can be expected to have a useful life of decades.
Sinking Into The 'Great Stagnation' - “America is in disarray,” states Prof Cowen, “and our economy is failing us.” He points to the slow growth of median wages since the 1970s, the illusions of the 2000s and the absence of “new net job creation in this last decade”. Moreover, “we face a long-run fiscal crisis, driven by the increasing cost of entitlements, our reliance on debt, and our willingness to let matters slide rather than face up to paying the bills”. So far, so familiar. More novel is how Prof Cowen explains the US predicament: “the American economy has enjoyed ... low-hanging fruit since at least the 17th century, whether it be free land, ... immigrant labor, or powerful new technologies. Yet during the last 40 years, that low-hanging fruit started disappearing, and we started pretending it was still there. We have failed to recognise that we are at a technological plateau and the trees are more bare than we would like to think. That’s it. That is what has gone wrong.” The role of both cheap resources and the import of labour in past US growth is clear. But Prof Cowen adds an important point. In 1900, only 6.4 per cent of Americans graduated from high school. In the late 1960s, this ratio peaked at 80 per cent. Similarly, by 2009, 40 per cent of 18-24 year olds were already enrolled in college. Improving labour force quality has become far harder.
Shovel-Ready, Job-Creating Particle Accelerators - The NYT is right about this: you want to sell or kill a policy these days, it’s mandatory to attach the words “jobs creator” or “jobs killer” to it. I’ve played along—always in good faith—I never asserted numbers I didn’t believe or couldn’t defend. But as the piece points out, it’s gotten pretty ridiculous. In fact, the article overlooks the weirdest example I’ve seen of this “sell-it-with-jobs” strategy: this press release from the Energy Dept. on the new-job-creating particle accelerator: "Ground Broken for New Job-Creating Accelerator Research Facility at DOE’s Fermi National Accelerator Laboratory in Illinois” [my bold] Sounds like the Onion, right? Economist David Card, as quoted in the NYT piece, basically has this right: "It’s just a selling point. You can say anything, no matter what, creates jobs. I don’t think people should pay much attention to it.” Still, despite the fact that we’ve pretty much punted on job creation given our current politics, it is very much within the purview of public policy to help generate job growth at times like the present. Would the policy process be better served if economists stopped making such predictions?
The Decline of the Public Good, by Robert Reich - What defines a society is a set of mutual benefits and duties embodied most visibly in public institutions — public schools, public libraries, public transportation, public hospitals, public parks, public museums, public recreation, public universities, and so on. Public institutions are supported by all taxpayers, and are available to all. If the tax system is progressive, those who better off (and who, presumably, have benefitted from many of these same public institutions) help pay for everyone else. “Privatiize” means pay-for-it-yourself. Much of what’s called “public” is increasingly a private good paid for by users — ever-higher tolls on public highways and public bridges, higher tuitions at so-called public universities, higher admission fees at public parks and public museums. Much of the rest of what’s considered “public” has become so shoddy that those who can afford to find private alternatives. As public schools deteriorate, the upper-middle class and wealthy send their kids to private ones. As public pools and playgrounds decay, they buy memberships in private tennis and swimming clubs. As public hospitals decline, they pay premium rates for private care.Gated communities and office parks now come with their own manicured lawns and walkways, security guards, and backup power systems.
Government-funded job creation works - Is high unemployment as certain as death and taxes? Of course not. But if we depend on the private sector to bring rates down, joblessness could join those two certainties. International experience shows that direct job creation by governments is one of the very few options that has succeeded at raising employment levels more than just marginally during a crisis. Nonetheless, unfounded optimism about the power of privately fueled growth underlies the latest round of interventions in Europe. The assumption that the business sector has the ability to absorb enough labor to end the unemployment crisis remains almost unquestioned. It's unreasonable to expect private enterprises to solve these problems. Full employment isn't an objective of businesses. Companies usually strive to keep staffing at a minimum — we've all heard the virtues of "lean and mean." In contrast, direct public-service job creation programs by governments have a history of long-term positive results. Throughout the last century, the United States, Sweden, India, South Africa, Argentina, Ethiopia, South Korea, Peru, Bangladesh, Ghana, Cambodia and Chile, among others, have intermittently adopted policies that made them "employers of last resort" — a term coined by economist Hyman Minsky in the 1960s — when private sector demand wasn't sufficient.
Bain, Barack and Jobs, by Paul Krugman - Mr. Romney claims that Mr. Obama has been a job destroyer, while he was a job-creating businessman. For example, he told Fox News: “This is a president who lost ... two million jobs...” He went on to declare, of his time at the private equity firm Bain Capital, “I’m very happy in my former life; we helped create over 100,000 new jobs.” But his claims about the Obama record border on dishonesty, and his claims about his own record are well across that border. Start with the Obama record. It’s true that 1.9 million fewer Americans have jobs now than when Mr. Obama took office. But the president inherited an economy in free fall... So how much of that Obama job loss took place in, say, the first half of 2009? The answer is: more than all of it. The economy lost 3.1 million jobs between January 2009 and June 2009 and has since gained 1.2 million jobs. On the point about using current employment, consider Staples, which has more than twice as many stores now as it did back in 1999, when Mr. Romney left Bain. Can he claim credit for everything good that has happened to the company in the past 12 years? Then there’s the bit about looking only at Bain-connected companies that added jobs, ignoring those that reduced their work forces or went out of business. Hey, if pluses count but minuses don’t, everyone who spends a day playing the slot machines comes out way ahead!
What if We Focus on Boosting Employment Rather Than Growth? - video - Yves Smith - Although it is remarkably difficult to come up with decent data , from what I can tell, the Japanese bubble was considerably bigger relative to the size of its economy than the US debt binge was. Yet even though the Japanese aftermath has been remarkably protracted, and arguably worsened by a slow and cautious initial response, visitors to Japan find the country wearing its malaise remarkably well. One of the reasons may be the Japanese preoccupation with employment. Entrepreneurs are revered not for making money but for creating jobs. Japanese companies went to great lengths to keep workers, cutting senior pay to preserve manning. That was done largely for cultural reasons, since companies are seen as being like families. But was this preoccupation also good economic policy, and might it have played a more direct role in buffering the worse effects of the bubble aftermath? In this interview, Pavlina Tcherevna argues that the way policymakers think about growth, that demand drives employment, may be backwards.
Profits and Resource Flows - The right says that taxing profits destroys the incentive to invest, and interferes with the ability of the invisible hand to direct resources to their most productive use. That's true, but only up to a point and we shouldn't fear taxing profits that are persistently (and in some cases extraordinarily) high. If an industry is making above average profits – and perhaps producing huge mega-bonuses for executives as well – that’s a signal that more resources are needed in that industry. Thus, if there is an increase in demand for a product, prices and profits will increase and that will attract more resources to the industry. But that doesn't mean that we should accept persistently high profits. Incumbent firms do not want more competition. If more firms enter, the added competition will reduce their high incomes and these firms will do all they can to construct barriers to entry and protect their advantage. Sometimes the barriers are legal, sometimes they are economic, and sometimes the structure of the markets protects the advantages of incumbent firms without them having to do anything active to protect their market power. Thus, while short-term profits are necessary, if we see persistent above average profits that's a sign that entry into an industry is not as free as it should be.
The insider brain gain - I won't argue about net job creation here (though I think most innovation fosters it in the long run, so long as the education system prepares people for the new jobs that result). But it is exciting to see a company designed to extract some of the highest-value cognitive surplus around, and to make money both for the company and its - well, they are not exactly workers. Call them members - or even sellers of their own cognitive surplus through an exchange set up for that purpose. The story starts with yet another recent phenomenon: an increase in corporate transparency, whether companies want it or not. In the old days, most companies sold products and had specified spokespersons; more recently, many have added call centres, creating about 3.5 million jobs in the United States alone, and many more outside it. But now employees of all kinds, not just those in customer support or public relations, have an online presence. Some mention their employer; most do not. This makes most employers a little nervous. Companies seem to have become fishbowls, their contents visible to customers and strangers alike. You could say that they have a larger "surface area", composed of employees who interact with outsiders.
A Fight for Post Offices and Towns’ Souls - People over a certain age here remember what happened to Mozart. It sat there perfectly content for years, a little community on a crooked mountain road in the southern Ozarks. Then one day they closed the post office. Now Mozart is a place on the road where only those who knew it was there would know it was there. The same thing happened with Newnata, Rushing and Cozahome. But if the people in Fox have a say, it will not happen again, at least not here. Along with the residents of other tiny towns across the country, from Challenge, Calif., to Economy, Ind., the people of Fox learned last summer that their post office was being studied for possible closing by the United States Postal Service. It was one of the more than 3,600 deemed by the postal authorities to have too little a workload — less than $27,500 annual revenue is one such measurement — or to be too close to another office to justify keeping open by an agency that is billions of dollars in debt and facing a steeply and steadily declining revenue stream.
Men grab most new jobs, even in retail –Men are claiming more than two-thirds of the private-sector jobs created as the economy recovers, reversing a long-running trend that came within a whisker of giving the USA its first-ever majority-female workforce. In a wrinkle that puzzles economists, one important driver of the trend is that hundreds of thousands of men are showing up in retailing, once considered a source of jobs for women. Nearly 1.28 million men gained jobs in the 12 months that ended in November, compared with 600,000 women, according to the Bureau of Labor Statistics (BLS). Although men have returned to work in greater numbers in goods-producing jobs and service-related businesses, they're not returning to still-stagnant construction industries. Instead, retailers have added 216,900 men — about five times as many as have been added by traditionally male financial services companies — vs. about 9,000 women. Also, manufacturers have added more than 250,000 men and cut 33,000 women. "It's a testament to how difficult the job market is," Moody's Analytics economist Ryan Sweet said, noting that there are still 4.5 times more unemployed people than U.S. job openings. "Men are taking jobs you wouldn't think they would."
Question #6 for 2012: Unemployment Rate - Earlier I posted Ten Economic Questions for 2012. 6) Unemployment Rate: What will the unemployment rate be in December 2012? Last year, my prediction was for the unemployment rate to still be above 9% in December 2011. As of November, the unemployment rate had fallen to 8.6%. My guess was the participation rate would increase a little in 2011, however the participation rate continued to decline, and that pushed down the unemployment rate. This is a reminder that forecasting the participation rate is critical in forecasting the unemployment rate.Say the Civilian noninstitutional population was 1 million, and 650,000 participated in the labor force. And say 600,000 were employed leaving 50,000 unemployed. Then the labor force participation rate would be 65%, and the unemployment rate would be 50,000 / 650,000 equals 7.7%. But if only 640,000 people participated in the labor force, then with the same level of employment (600,000), only 40,000 will be unemployed - and the unemployment rate would be 40,000 / 640,000 equals 6.3%.Here is a graph showing the current unemployment rate (red) and the participation rate (blue). Although I expect the participation rate to decline over the next couple of decades as the population ages, I think the participation rate will rise a little in 2012. Although I'm still looking at GDP and employment for 2012, I think the unemployment rate will be mostly unchanged in 2012.
Weekly Initial Unemployment Claims decline to 372,000 - The DOL reports: In the week ending December 31, the advance figure for seasonally adjusted initial claims was 372,000, a decrease of 15,000 from the previous week's revised figure of 387,000. The 4-week moving average was 373,250, a decrease of 3,250 from the previous week's revised average of 376,500. The following graph shows the 4-week moving average of weekly claims since January 2000. The dashed line on the graph is the current 4-week average. The four-week average of weekly unemployment claims decreased this week to 373,250. This is the lowest level for the 4-week average since June 2008. And here is a long term graph of weekly claims: The 4-week moving average is still falling and is now well below 400,000. This suggests fewer layoffs and more payroll jobs added in December.
Jobless Claims End 2011 at 3.5 Year Low; And ADP Reports 325K Private Job Gain in December - In another sign that the U.S. labor market is gradually improving, the Labor Department reported today that the four-week moving average for initial jobless claims fell to 380,250, the lowest level since June 2008, three and-a-half years ago (see chart above). This marks the fifth consecutive decline in the four-week moving average, and the ninth decline in the last ten weeks. In a separate report today, paycheck processer ADP reported that U.S. nonfarm private employment increased by 325,000 in December, another sign that the labor market was gaining momentum as the year ended. This was the largest monthly employment gain in a year, and almost twice the median consensus expectation of a 178,000 gain.
ADP: Private Employment increased 325,000 in December -- ADP reports: Private-sector employment increased by 325,000 from November to December on a seasonally adjusted basis, according to the latest ADP National Employment Report® released today. The ADP National Employment Report, created by Automatic Data Processing, Inc. (ADP®), in partnership with Macroeconomic Advisers, LLC, is derived from actual payroll data and measures the change in total nonfarm private employment each month. The estimated gain in employment from October to November was revised down slightly to 204,000 from the initially reported 206,000. This was well above the consensus forecast of an increase of 160,000 private sector jobs in December. The BLS reports on Friday, and the consensus is for an increase of 150,000 payroll jobs in December, on a seasonally adjusted (SA) basis. Government payrolls have been shrinking by about 24,000 per month this year. So this suggests around 325,000 private nonfarm payroll jobs added, minus 24,000 government workers - or around 301,000 total jobs added in December. Of course ADP hasn't been very useful in predicting the BLS report.
ADP: Job Creation Surged In December - Job creation accelerated sharply last month, according to the ADP Employment Report. U.S. nonfarm private employment rose a seasonally adjusted 325,000 in December--up dramatically from November’s 204,000 net gain. December’s advance is the strongest monthly gain in the history of this series, which dates to 2000. ADP’s estimate for job growth is coupled with news that initial jobless claims fell a healthy 15,000 last week to a seasonally adjusted 372,000, or the lowest level since May 2008. It’s starting to look like there’s a tailwind in the labor market. The recent drop in jobless claims has been anticipating as much and the forecast appears to be turning into reality. The next test is whether the ADP report finds support in tomorrow’s far-more influential jobs report from the U.S. Labor Department for December. Judging by the ADP data, there’s reason for optimism. As the chart below shows, there’s a fairly tight relationship between the ADP and Labor Department date through time. The two data series fall out of line in the short run, but the gap doesn't often linger. The fact that the latest ADP number is relatively elevated vs. the last data point from the government implies that tomorrow’s update will be favorable.
Good News On The Jobs Front? - Two pieces of data are out today in advance of tomorrow’s December jobs report that raise the tantalizing prospect that we might have turned a corner on hiring. In some respects, it won’t be surprising at all to see an uptick in hiring for December. Even with seasonal adjustments, the numbers are likely to show the impact of holiday hiring in the retail sector. Nonetheless, the numbers out today offer the thought, or at least the hope, that something more permanent is going on. We’ve been here before, of course, only to see things peter out in the end, but good news is good news. First up, there’s the monthly hiring report from payroll processing giant ADP: Private-sector companies significantly ramped up their hiring in December, according to a report issued Thursday. The private sector added a seasonally adjusted 325,000 jobs during the month, up from 204,000 in November, payroll-processing firm ADP said. In other news, the Labor Department reported a slight drop in weekly jobless claims as the overrall number once again stayed below the 400,000 level: Fewer Americans filed claims for unemployment insurance payments last week, showing the labor market is starting 2012 on better footing than a year earlier.Applications for jobless benefits decreased 15,000 in the week ended Dec. 31 to 372,000, Labor Department figures showed today
Signs of Hope on Jobs, and Some Caveats - With as dismal a run as we’ve had in the economy over the last few years, it’s tempting to start looking for the glass to be half full. After a traumatic late summer and fall, the economy showed some signs it was sputtering back with holiday sales strength and three months of steady – if uninspiring – job growth. Hopes are rising for signs of accelerating job creation in Friday’s Labor Department report, following a decline in the four-week average of new unemployment claims and a strikingly robust report of job growth from ADP, the payroll service. ADP said on Thursday that the private sector added 325,000 jobs in December, the strongest increase in a year.Without trying to knock the glass over, we have to point out that many economists consider the ADP numbers less than predictive. “Its track record is spotty (and that characterization is being polite),” ADP often revises its numbers, and historically, December’s numbers have been subject to fairly wide swings.
Strong ADP Jobs Gain Needs Grain of Salt - The U.S. added 325,000 private-sector jobs in December, according to a report by payroll giant Automatic Data Processing and consultancy firm Macroeconomic Advisers. The number was much better than economists were expecting, and added to hopes of a strong official Labor Department report on Friday. But ADP has a mixed track record compared to the official Labor Department numbers, partly because of different methods for collecting data. Last month, ADP reported that the private sector added 206,000 jobs, but the official number from the Labor Department was a more subdued 140,000. And back in early July, ADP announced June payrolls had soared by 157,000 new slots, but the Labor Department reported a much more subdued 57,000 private jobs.
Whoa! The 10x Difference Between TrimTabs December Jobs Estimate of 38,000 New Jobs and ADP’s Estimate of 325,000 Begs an Explanation - For the second consecutive month, ADP has forecast an unusually high estimate of private job creation for the BLS payroll report. This month ADP's estimate is 325,000 jobs. Last month, and on many other occasions, ADP's estimates and the BLS reports were miles apart. Is one better than the other? While pondering that question, this month Trim Tabs has stepped up to the plate with a forecast of 38,000 jobs. Madeline Schnapp, Editor of "TrimTabs Weekly Macro Analysis" and "TrimTabs Employment NewsFlash" provided a transcript of the above video. On Tuesday, January 3rd TrimTabs released its December jobs estimate which showed the U.S. economy added only 38,000 new jobs. Today, ADP released its December jobs estimate pointing to job growth of a stunning 325,000 new jobs, almost 10 times TrimTabs estimate. In addition, the consensus estimate for the BLS report this Friday is for 150,000 jobs. Whoa! The differences between the three estimates begs the question of what is going on here? Before we answer that question, a few observations are in order. First, we challenge the notion that the BLS should be the standard bearer for job growth in the U.S. because its estimates are frequently revised, ranging from a few percent to several hundred percent. For example, in August, the BLS revised its estimate up from 0, a showing an economy on the verge of recession, to 104,000 showing an economy experiencing positive but weak economic growth. Second, the BLS and the ADP estimates are based on surveys that are incomplete when released. TrimTabs jobs estimate, on the other hand, is based on daily income tax withholdings to 130 million wage earners.
December Employment Report Preview - If you accept the idea that the final benchmarking is accurate, then the BLS approach should be viewed as an initial estimate, not the ultimate answer. What we are all looking for is information about job growth. There are several competing sources using different methods and with different answers.
- ADP has actual, real-time data from firms that use their services. The firms are not completely representative of the entire universe, but it is a different and interesting source. ADP sees gains of 325K private jobs. There is a continuing trend of losses in government jobs.
- TrimTabs looks at income tax withholding data. The idea is that this is the best current method for determining real job growth. They see job gains of only 38,000.
- Econonmic correlations. Most Wall Street economists use a method that employs data from various inputs, sometimes including ADP (which I think is cheating -- you should make an independent estimate). I use the four-week moving average of initial claims, the ISM manufacturing index, and the University of Michigan sentiment index. I do this to embrace both job creation (running at over 2.5 million jobs per month) and job destruction (running at about 2.3 million jobs per month).. When you know there is a problem with an input variable, you need to review the model.
December Employment Report: 200,000 Jobs, 8.5% Unemployment Rate - From the BLS: Nonfarm payroll employment rose by 200,000 in December, and the unemployment rate, at 8.5 percent, continued to trend down, the U.S. Bureau of Labor Statistics reported today. Job gains occurred in transportation and warehousing, retail trade, manufacturing, health care, and mining. ...The change in total nonfarm payroll employment for October was revised from +100,000 to +112,000, and the change for November was revised from +120,000 to +100,000. The following graph shows the employment population ratio, the participation rate, and the unemployment rate.The unemployment rate declined to 8.5% (red line). The Labor Force Participation Rate was unchanged 64.0% in December (blue line). This is the percentage of the working age population in the labor force. The participation rate is well below the 66% to 67% rate that was normal over the last 20 years, although some of the decline is due to the aging population. The Employment-Population ratio was unchanged at 58.5% in December (black line). The second graph shows the job losses from the start of the employment recession, in percentage terms. The dotted line is ex-Census hiring.
Employment Situation - spencer - (6 charts) The employment report shows signs of an improved employment situation, but on balance it looks like more of the same. The unemployment rate fell 0.2 points to 8.5%. This continues the recent trend of a falling unemployment rate. But the drop was also driven by anther 50,000 drop in the labor force. But the increase in the headline payroll employment was 200,000, one of the largest gains this cycle. The household increase in employment eased to some 176,000, significantly smaller than over the past few months when the household survey showed well over 200,000 monthly job gains.In particular, private payrolls showed a nice improvement over the past few months. Maybe most importantly, the index of aggregate hours worked looks like it is continuing the trend established soon after it bottomed. The year over year gain in hours worked has been bouncing around 2.5% since the first quarter. Average hourly earnings continue to stagnate around 2%, modestly better than the 1.8% increase in 2010. It may be possible to say that average weekly earnings growth has bottomed, but to call it a bottom or a trend change look like a stretch to me. With such weak wage gains nominal personal income growth is likely to remain weak and in an environment of such weak income gains it is difficult to see how higher inflation can be sustained.
Employment Rate Down 0.1% to 8.5% on 200K New Jobs - Here is the lead paragraph from the Employment Situation Summary released this morning by the Bureau of Labor Statistics: Nonfarm payroll employment rose by 200,000 in December, and the unemployment rate, at 8.5 percent, continued to trend down, the U.S. Bureau of Labor Statistics reported today. Job gains occurred in transportation and warehousing, retail trade, manufacturing, health care, and mining. The unemployment peak for the current cycle was 10.2% in October 2009. The chart here shows the pattern of unemployment, recessions and both the nominal and real (inflation-adjusted) price of the S&P Composite since 1948. The second chart shows the unemployment rate for the civilian population unemployed 27 weeks and over. The December number is 3.6% — down fractionally from last month's 3.7%. This measure gives an alternative perspective on the relative severity of economic conditions. As we readily see, this metric remains significantly higher than the peak in 1983, which came six months after the broader measure topped out at 10.8%. The next chart is an overlay of the unemployment rate and the employment-population ratio. This is the ratio of the number of employed people to the total civilian population age 16 and over.
Jobs Report, First Impressions - Employers added 200,000 jobs on net last month, while the jobless rate ticked down to 8.5%, according to this morning’s jobs report from the BLS. That’s a bit better than what was expected, reflecting moderate but broad labor demand across almost all sectors of the private job market–the public sector continues to be a notable sore spot. All told, a solid report, with most industries adding jobs, the work week expanding a bit, and the jobless rate revealing a slow but steady trend down–see figure. With December’s data, we now have full year 2011 numbers. Payrolls added 1.6 million jobs last year, the best showing since 2006. Private sector payrolls were up 1.9 million, the most jobs added in the private sector since 2005. In other words, the labor market is improving, and has a bit of trend going for it–employers remain cautious–hiring can’t be called robust–but it has been slow and steady.
Jobs Report, Second Impressions: the Good, the Bad, the Ugly -- Re the job situation:
- –Payrolls expanded in every month last year, the first time we’ve seen that for a while, adding 1.6 million jobs overall and 1.9 million in the public sector (continued public sector job loss is one of the bads).
- –Unemployment is trending down. It peaked at 10% in Oct of 2010 and hit 8.5% last month. However, no small part of this decline is due to people leaving the labor force (see below).
- –The underemployment rate is down 1.4 ppts from a year ago, from 16.6% to 15.2%, driven in part by the decline of almost 800,000 in the number of involuntary part timers (i.e., part-time workers who want full time jobs).
- –Job Quality: Many of the jobs we’ve added over the past year have been in low-paying sectors, like restaurants, bars, and retailers (part of the 200K gain last month, e.g., included 42,000 jobs for couriers/messengers, presumably related to holiday deliveries). On the other hand, manufacturing’s picked up lately, up 225K over the year.
- –Labor Force Participation: This is the most notable bad we face right now.
- –Long Term Unemployment: Still a huge problem, with over 40% of the jobless unemployed for at least half a year.
- –Public Sector: The state and local government sector continues to shed jobs, down about half-a-million over the last two years. They’re cutting budgets and taking it out of their workforces, and remember, these are teachers, police, sanitation workers—folks whose work is essential to our communities (education jobs at the local level are down 190K over the past two years).
- The Ugly: That would be Congress...
Unmitigated good news on jobs - File this one under “unmitigated good news”: America’s employment situation turns out to have been rosier, at the end of 2011, than anyone had dared hope. There were 200,000 more people in work last month than there were in November, and the unemployment rate — by far the single most politically-important macroeconomic statistic — fell to 8.5%, the lowest rate in three years. All data series are noisy, of course, and we’ll surely see volatility in this one over the course of 2012. But it really does seem that there’s a bit of fire in the American belly right now, and that things are going to continue to get better over the course of this year unless and until some new crisis comes along.The cheer is spread all over this report. The broadest measure of underemployment, U-6, fell sharply to 15.2%, again a new three-year low, and down two full percentage points in two years. The unemployment figures more generally are now beginning to look as though they’re in a downward trend, rather than every good month being offset with a subsequent disappointment. Back then, it seemed like nothing could get Americans back to work: now, with political gridlock as far as the eye can see through 2012, it seems that America has got used to nothing and is has worked out how to grow anyway.
Private Payrolls Rise 212k In December - Private payrolls rose by a net 212,000 in December as the overall jobless rate fell to 8.5%, the lowest in nearly three years, the Labor Department reports. Still, the pace of job creation last month is a bit of a letdown after yesterday's stellar rise via ADP's estimate. But let's not quibble too much. Today's report is still quite respectable in the current climate. Indeed, a gain of 212,000 jobs is a decent showing after November's tepid 120,000 gain. If nothing else, today's number du jour puts more pressure on the folks who argue there's a recession in the offing. Never say never, but economic contractions don’t have a history of arriving when the labor market is expanding at the current pace. And if job creation is strengthening, as it seems to be, pessimism about the macro trend may out of style for a stretch. Sure, there may be a recession off in the distance and next month may bring dismal news. But there's no sign of darkness in today's employment report. Job growth is hardly the only data point to consider when reviewing macro trends, but it's certainly a fair slice of the total package. And when you consider some of the other encouraging reports of late, it's tempting to see the proverbial glass as half full.
Nonfarm Payroll +200,000 ; Labor Force Drops Another 50,000 ; Those Not in Labor Force Rises by 194,000 ; Unemployment Rate 8.5%; Notes from Trim Tabs on the BLS Report -- Here is an overview of December Jobs Report, today's release.
- US Payrolls +200,000
- US Unemployment Rate Declined .2 (from revised number) to 8.5%
- Civilian labor force fell by 50,000
- Those Not in Labor Force rose by 194,000
- Participation Rate steady at 64.0%, nearly matching a low last seen in 1984
- Actual number of Employed (by Household Survey) rose by 176,000
- Unemployment fell by 226,000 (194,000 of which comes from those dropping out of labor force)
- Civilian population rose by 143,000
- Average workweek for all employees on private nonfarm payrolls was +.1 to 34.4 hours
- The average workweek for production and nonsupervisory employees on private nonfarm payrolls edged higher 0.1 hour to 33.7 hours in November.
- Average hourly earnings for all employees in the private sector rose by 4 cents to $23.24
- Government employment decreased by 12,000
- The private sector has only recovered 36 percent of jobs lost in the peak-to-trough period of January 2008 to February 2010.
Video: Analysis of Jobs Data - The WSJ News Hub provides full coverage of the improving U.S. jobs picture. In December, 200,000 non-farm payrolls were added as the nation’s unemployment rate fell to 8.5%.
Something is working - It is too early to celebrate, but one can at least heave a sigh of relief after a December jobs report that shows a meaningful acceleration in employment growth. This morning, the Bureau of Labour Statistics released preliminary numbers on the American labour market in December, and the news is good. Non-farm employment rose by 200,000 jobs for the month. Private employers added 212,000 jobs, slightly offset by the continuing decline in government employment. In the 12 months through December, the American economy added 1.9m private-sector jobs—the best performance so far in this recovery. The unemployment rate dipped again, from 8.7% to 8.5%. Part of the decline was once again associated with departures from the labour force, but rising employment accounted for much of the improvement. Payroll growth was fairly broad in nature. Construction employment rose by 17,000 in December, though very little of that was attributable to improving prospects for residential construction. Manufacturing employment rose by 23,000, all of it in durable-goods production. The American economy added 225,000 manufacturing jobs in 2011. Service-sector employment, especially in health-care industries, added substantially to growth, and there was a curious rise of 42,000 jobs for "couriers and messengers". Some of that may subsequently be revised away; it seems likely that the bureau's seasonal adjustment isn't large enough.
Jobs Strength Is There, Now Sustainability Needed - December is the traditional month of gift-giving and so it was for the labor markets. Businesses gave the gift of solid hiring to job seekers. The question is whether companies will keep up the pace in 2012. Nonfarm payrolls added a better-than-expected 200,000 slots in December, with jobs added in manufacturing, construction, and private services. The December unemployment rate fell to 8.5%. That was the second consecutive decline and took the rate down to its lowest since February 2009. A sustained pace of December-caliber job growth is needed to trigger the virtuous cycle of more income generating more demand which causes businesses to add more workers. The key word there is “sustained.” More than 13 million workers are still unemployed and another 10 million or so are underemployed or are too discouraged to even look for work. It will take years before the labor markets approached anything close to normal employment. Worse still, 42.5% of the unemployed have been out of work for more than six months. Their absence from the workforce puts a heavy burden on the economy.
Best Jobs Report in a Long Time Leads Off the Election Season - Everyone knows what this election will be about: jobs, jobs, jobs. If so, the latest numbers from the Bureau of Labor Statistics should shake things up a little. The headline number in the report is a relatively robust gain of 200,000 jobs in December, confirming that the jobs market is picking up after a mid-year slump. The November gain was revised downward from 120,000 reported last month to just 100,000, but that was partly offset by an upward revision of the October figure from an originally-reported 100,000 to 112,000. There was good news in the line-by-line numbers, as well. Goods-producing jobs increased by 48,000, after a decrease in November. About half of those were in manufacturing, which had been flat for most of the quarter. As has been the case all year, the private sector was healthier than government. There were 212,000 new private-sector payroll jobs, compared with a loss of 12,000 government jobs. Most of the government jobs were lost at the local level. State employment was flat, and federal non-postal jobs grew slightly. As has been true all year, the service sector accounted for the bulk of job formation, but the pattern here changed subtly as well. Transportation and retail trade gained strongly. Financial service jobs were almost unchanged. Health care, which had been almost the only job creator in some of last year’s worst months, continued to grow but it was no longer the strongest source of jobs.
Getting Better But a Long Way to Go - Friday’s jobs data confirmed that labor markets are getting better, but slowly. Payrolls expanded by 200,000, the unemployment rate fell again to 8.5%, weekly hours ticked up from 34.3 to 34.4, and hourly earnings rose by 0.2%. Of course, there is still a long, long way to go. Unemployment and underemployment both remain very high, but they’ve been moving in the right direction. After peaking at 10% in October 2009, the unemployment rate has declined by 1.5 percentage points. The U-6 measure of underemployment, meanwhile, peaked at 17.2% and now stands at 15.2%: (The U-6 measures includes the officially unemployed, marginally attached workers, and those who are working part-time but want full-time work.)
Unemployment Falls to 8.5 Percent, but Job Growth Remains Weak - The unemployment rate fell to 8.5 percent in December, the lowest level since the 8.3 percent rate reported for February of 2009, the month that Congress approved the stimulus package. The drop was driven primarily by a 0.3 percentage point decline in the unemployment rate for men to 8.0 percent. The unemployment rate for women edged up slightly to 7.9 percent. Over the last year, the gap in unemployment rates between the sexes has virtually disappeared as the unemployment rate for men fell by 1.4 percentage points, while the rate for women only dropped by 0.2 percentage points. The employment-to-population ratio (EPOP) for women has actually fallen by 0.4 percentage points over this period, while it has risen by 0.8 percentage points for men. Overall, the EPOP stands at 58.5 percent, 0.2 percentage points above its year-ago level and 0.4 percentage points above the lows hit in the summer. White men have gained much more than black men over the last year, with a 1.4 percentage point drop in their unemployment rate to 7.1 percent. For black men, the decline has been 1.1 percentage points to 15.7 percent. The unemployment rate for black women has risen by 0.9 percentage points over the year to 13.9 percent, while their EPOP has fallen 1.6 percentage points. Other news in the survey is mixed. The number of people involuntarily working part-time fell by 406,000, the third consecutive month of sharp declines. On the other side, the unemployment rate due to job leavers fell by 0.4 percentage points, suggesting workers lack confidence in their job prospects. The unemployment duration measures edged down slightly, but did not completely reverse the jump seen in October. The percentage of workers experiencing long-term hardship, a fuller measure that includes people who have left the labor force, is near 7.0 percent, roughly twice the share of workers experiencing long-term unemployment.
Massive Beat? Not So Fast - Morgan Stanley Warns 42,000 "Jobs" Bogus Due To Seasonal Quirk - Enamored with the 200,000 number? Don't be - the reason why the market has basically yawned at this BLS data is that as Morgan Stanley's David Greenlaw reports, 42,000 of the 200,000 is basically a seasonal quirk, which will be given back next month, meaning the true adjusted number is 158,000, essentially right on top of the expectation. From David Greenlaw: "some of the strength in this report should be discounted because of an seasonal quirk in the courier category of payrolls (Fed-ex, UPS, etc). Jobs in this sector jumped 42,000 in December, repeating a pattern seen in 2009 and 2010 (see attached figure). We should see a payback in next month's report."
The Soft Bigotry of Low Employment Expectations - Krugman - A brief note while in transit, about today’s jobs report. Obviously it’s better than we’ve been seeing. But we need much faster job growth; it says something about how beaten down we are that this is considered good news. Let me give two back-of-the-envelope ways to think about how inadequate 200,000 jobs a month is. First, note that there are still about 6 million fewer jobs than there were at the end of 2007 — and that we would normally have expected to have added around 5 million jobs over a four-year period. So we’re 11 million jobs down — and we need at least 100,000 jobs a month just to keep up with working-age population growth. Do the math, and you’ll see that it would take 9 or 10 years of growth at this rate to restore full employment. Alternatively, note that during the Clinton years — all 8 of them — the economy added around 230,000 jobs a month. As it did that, the unemployment rate fell about 3 1/2 percentage points — which is about what we’d need from here to get back to something that felt like full employment. Again, this suggests that we’re looking at something like a decade-long haul to have full recovery. So yes, this is better news than we’ve been having. But it’s still vastly inadequate.
Economists Take Solace (but Only a Little) in Jobs Report - Economists viewed the latest jobs numbers as at least moderately encouraging, although some of them warned, as usual, against reading too much into the results of any single month — especially December. “Things are looking a bit better,” as Morgan Stanley’s David Greenlaw and Ted Wieseman summed it up, “but, we wouldn’t get too carried away just yet.” Ian Shepherdson of High Frequency Economics was more ebullient. “We see these trends as sustainable,” he wrote. “This is the real deal for the U.S. economy, at last.” He reckoned that private companies held off hiring in the summer and fall as consumer confidence fell, but then began to hire once it became clear that spending was holding up. And the loss of government jobs was “clearly slowing,” he said. Some economists noted that a seasonal bump each December in jobs held by couriers was typically followed by layoffs in January, once all the holiday gifts were delivered. And some offered other cautionary notes and qualifiers. “The pace of job growth in recent months, while still not satisfactory compared to most past cycles, at least seems sufficient to generate enough income growth to keep consumer spending moving ahead at a moderate pace,”
Employment Reality Check: 200,000 New Jobs Is a Good Start, But Good Times May Still Be a Decade Away - Companies are hiring again. That’s the good news. The bad news is those hires might not be coming fast enough. In December, corporate America added 200,000 employees to their payrolls. That hit the magic number economists have been pointing to for months as the rate we needed to declare the current state of affairs a real recovery and not just false hopes.Is 200,000 enough? And if so, is it sustainable? The good news: The unemployment rate fell to 8.5%. That was the fourth month in a row that the jobless number has fallen, and it was the lowest level that gauge of economy has been since February 2009. The drop was also a surprise to economists, who generally thought the rate would rise. But even that good news came with some doubt. Some have questioned whether the drop in the unemployment rate is to be believed. Jim Pethokoulis, a blogger for the conservative think tank the American Enterprise Institute, tweeted shortly after the jobs number came out on Friday morning: “10.9%: The unemployment rate (u-3) if the size of the workforce was the same as when Obama took office.” His point is that while the unemployment rate is lower, so too is the size of the workforce.
Jobs Day - The headline number at 200K is decent. As always we care more about the internals.
- Construction up 17K, almost all of which was non-residential specialty trades. I am guessing this means oil and gas extraction installations.
- Manufacturing up 23K with metals and motor vehicles doing well. This is as expected.
- Non-Durables were flat. I still need to spend more time with this but from looking at the industrial production data this is where we are weak. Its not clear what’s going on here.
- Wholesale and Retail Trade clocked in at 12K and 29K respectively. Not bad and consistent with rising consumer expenditures.
- Transportation came in big at 50K on 42K couriers and messengers. I am not sure if that is a strike resolution of something, but keep that in mind.
- Information managed not to fire people, coming in at 6K, call that a win.
- Financial Services likewise clocking in at 2K
- Professional and Business Services was weak at 12K with a particularly disconcerting drop of 8K in Temp workers.
- Ed and Health added 29K, YAWN
- Leisure and Hospitality added 21K with a respectable 24K going towards food service.
- Government shed12K workers with a still amazing 9K local government education workers.
Employment Summary, Part Time Workers, and Unemployed over 26 Weeks - There were 200,000 payroll jobs added in December. This included 212,000 private sector jobs added, and 12,000 government jobs lost. The unemployment rate fell to 8.5% from a revised 8.7% in November (revised from 8.6%). U-6, an alternate measure of labor underutilization that includes part time workers and marginally attached workers, declined to 15.2% - this remains very high. U-6 was in the 8% range in 2007. For the year, the economy added 1.64 million total non-farm jobs or just 137 thousand per month. This is a better pace of payroll job creation than in 2010, but the economy still has 6.0 million fewer payroll jobs than at the beginning of the 2007 recession. There were 1.92 million private sector jobs added in 2011, or about 160 thousand per month. Both the participation rate and the employment population ratio were unchanged in December at 64.0% and 58.5% respectively. The average workweek was increased slightly to 34.4 hours, and average hourly earnings increased 0.2%. "The average workweek for all employees on private nonfarm payrolls increased by 0.1 hour to 34.4 hours in December. ... In December, average hourly earnings for all employees on private nonfarm payrolls rose by 4 cents, or 0.2 percent, to $23.24. Over the past 12 months, average hourly earnings have increased by 2.1 percent." From the BLS report: The number of persons employed part time for economic reasons (sometimes referred to as involuntary part-time workers) declined by 371,000 to 8.1 million in December. This is the lowest level since January 2009.This graph shows the number of workers unemployed for 27 weeks or more. According to the BLS, there are 5.588 million workers who have been unemployed for more than 26 weeks and still want a job. This was down from 5.680 million in November.
Interesting Facts from Today's Employment Report - A few interesting items from today's BLS Employment Report for December:
- 1. The unemployment rate for workers with a college degree fell to 4.1% in December, which is the lowest jobless rate for that group since January 2009, almost three years ago. The number of employed college graduates is at an all-time high of 45.2 million, and more than 1.6 million above the December 2007 level when the recession started. In contrast, the jobless rate for workers with less than a high school degree jumped to 13.8% in December from 13.3% in November, and the employment level for those workers remains 1.24 million jobs below the December 2007 level. This contrast suggests that educational level might be an important factor in the labor market improvements and the drop in the jobless rate to 8.5%, with college-educated workers being the group that is gaining jobs during the recovery, while the least educated workers are the group finding it hardest to find jobs.
- 2. The manufacturing sector added 225,000 jobs in 2011, following an increase of 109,000 factory jobs in 2010, bringing manufacturing employment to 11.79 million at year-end. That's the first time since 1996-1997 of two consecutive annual increases in employment by U.S. manufacturing companies, and the 225,000 job gain last year was the largest since a 304,000 increase in 1997. If manufacturing companies continue to add jobs at the current pace, it's likely that manufacturing employment by mid-2012 will exceed the 12 million mark for the first time since early 2009.
Real Jobless Rate Is 11.4% With Realistic Labor Force Participation Rate - One does not need to be a rocket scientist to grasp the fudging the BLS has been doing every month for years now in order to bring the unemployment rate lower: the BLS constantly lowers the labor force participation rate as more and more people "drop out" of the labor force for one reason or another. While there is some floating speculation that this is due to early retirement, this is completely counterfactual when one also considers the overall rise in the general civilian non institutional population. In order to back out this fudge we are redoing an analysis we did first back in August 2010, which shows what the real unemployment rate would be using a realistic labor force participation rate. To get that we used the average rate since 1980, or ever since the great moderation began. As it happens, this long-term average is 65.8% (chart 1). We then apply this participation rate to the civilian noninstitutional population to get what an "implied" labor force number is, and additionally calculate the implied unemployed using this more realistic labor force. We then show the difference between the reported and implied unemployed (chart 2). Finally, we calculate the jobless rate using this new implied data. It won't surprise anyone that as of December, the real implied unemployment rate was 11.4% (final chart) - basically where it has been ever since 2009 - and at 2.9% delta to reported, represents the widest divergence to reported data since the early 1980s. And because we know this will be the next question, extending this lunacy, America will officially have no unemployed, when the Labor Force Participation rate hits 58.5%, which should be just before the presidential election.
Average Duration Of Unemployment: Second Highest Ever At 40.8 Week -The NFP report confirms the picture we have all known to grow and love - the people "entering" the labor force are temp workers, those with marginal job skills, and making the lowest wages. For everyone else: better luck elsewhere: the number of people not in the labor force has soared by 7.5 million since January 2007, and the average duration of unemployment is 40.8 weeks - essentially in line with last month's record 40.9. Bottom line - if you are out of a job, you are out of a job unless you are willing to trade down to an entry level "temp-like" position with virtually no benefits or job security.
How Long Will It Take the Economics Reporters to Wipe the Egg Off Their Faces? - All the news reports on the December jobs data are very upbeat about the 200,000 jobs reported for December. The phrase for the day is "better than expected." However, as someone who told friends and family it would be 165,000 I see it as slightly worse than expected. Look at the data boys and girls. We created 42,200 courier jobs in December. Was there really a big surge in hiring in the courier industry? Well, the Bureau of Labor Statistics showed a surge of more than 50,000 new courier jobs last December, all of which were gone in January and then some. In other words, pull out our 42,000 courier jobs and we are looking at job growth of 158,000, not much to celebrate. btw, even 200,000 jobs would not be much celebrate. Job growth averaged almost 250,000 a month for the years 1996-2000. Coming out of a steep recession, we should be expected job growth in the 300k-400k monthly range. Unfortunately, there has been a huge effort to lower expectations so that we come to accept dismal economic performance as the best we can do. (The double-dip recession crew deserve a special flogging in this story.)
Under Obama, a Record Decline in Government Jobs - Three years into his presidency, he has exceeded Reagan in one area: reductions in government jobs. Over all — including a decline of 12,000 public sector jobs in the Labor Department report for December — government — government employment is down 2.6 percent over the last three years, compared to a decline of 2.2 percent in the early Reagan years. That is a record. That record, which will seem a dubious distinction to public-sector employees who backed Mr. Obama, is largely a result of shrinking state governments. State employment fell 1.2 percent in 2011 — the largest percentage for any year since counting began in 1955. The number is down 2.2 percent over the last three years. It was up 1.2 percent during Reagan’s first three years, declining in only one of the years. Local government jobs used to be deemed super safe. Since the federal government started tracking the statistic in 1955, there have been only six years when local government employment declined. They have come in threes: 1981, 1982 and 1983, the first three years of the Reagan administration, and 2009, 2010, 2011, the first three years of the Obama administration. The declines were a little larger under Reagan. The local-government job count fell 3.8 percent under him but just 3.5 percent over the last three years. But if teacher employment is the measure, the cuts have been greater under Mr. Obama. Education jobs at the local level are down 3 percent under Mr. Obama, compared to 2.1 percent in the early Reagan years.
Government Still Trimming Jobs, but Cutbacks Slow - State and local governments continue to be a big drag on the job market, though they are cutting jobs at a slower pace than they were over the past two years when the economy was weaker and their budgets tighter. State and local governments cut 14,000 jobs in December and a total of 244,000 over the year. That tally was only slightly less than the 249,000 state and local jobs that were lost in 2010, but the pace slowed considerably over the second half of the year. Some 66,000 teachers, police officers, firefighters and other government workers lost their jobs in the second half of 2011 — about half as many as in the last six months of 2010. The ebb in state and local job losses will likely continue. State spending is expected to increase in the next fiscal year, which starts in July, while various reports show states’ quarterly tax hauls continue to improve. But while states have seen a marked improvement in collections, the local government sector — which has roughly four times as many workers — has been generally worse off. Local governments, unlike most states, get much of their funding from property taxes, which remain weak along with the housing market.
Seasonal Retail Hiring, Duration of Unemployment, Unemployment by Education and Diffusion Indexes - According to the BLS, retailers hired seasonal workers at the pre-recession pace in 2011. Click on graph for larger image. This graph shows the historical net retail jobs added for October, November and December by year. Typically retail companies start hiring for the holiday season in October, and really increase hiring in November. Retailers hired 718.5 thousand workers (NSA) net this year. This is about the same level as in 2006 and 2007. Note: this is NSA (Not Seasonally Adjusted). This suggests a fairly strong holiday season. This graph shows the duration of unemployment as a percent of the civilian labor force. The graph shows the number of unemployed in four categories: less than 5 week, 6 to 14 weeks, 15 to 26 weeks, and 27 weeks or more. The the long term unemployed declined to 3.6% of the labor force - this is still very high, but the lowest since September 2009. This graph shows the unemployment rate by four levels of education (all groups are 25 years and older). Unfortunately this data only goes back to 1992 and only includes one previous recession (the stock / tech bust in 2001). Clearly education matters with regards to the unemployment rate - and it appears all four groups are generally trending down. Note: This says nothing about the quality of jobs - as an example, a college graduate working at minimum wage would be considered "employed". This is a little more technical. The BLS diffusion index for total private employment was at 61.2 in December, up from 50.7 in November. For manufacturing, the diffusion index increased to 56.8, up from 40.7 in November. Think of this as a measure of how widespread job gains are across industries. The further from 50 (above or below), the more widespread the job losses or gains reported by the BLS.
Unemployment declines, but don't sound the all clear just yet - The unemployment report released by the Labor Department on Friday shows nonfarm payroll employment increasing by 200,000 in December and unemployment falling to 8.5 percent. There is some question about the seasonal adjustment procedure used to adjust the numbers for holiday hiring, but even so this is a relatively strong report with job gains "in transportation and warehousing, retail trade, manufacturing, health care, and mining." The good news in the latest unemployment report coupled with the decline in new claims for unemployment insurance over the last few weeks are both pointing to recovery. But how strong and robust will that recovery be? We are recovering from a particularly troublesome type of economic problem known as a balance sheet recession. It takes considerable time to rebuild all that is lost, and so long as this rebuilding is underway -- so long as people are saving rather than consuming -- economic growth will be slow and lost decades are not at all uncommon in this type of a recession. It doesn't have to be this way. Effective monetary and fiscal policy can shorten the recovery time. However, fiscal policy makers are not going to increase spending on the scale needed. They are much more likely to do something that works against the recovery such as reducing the deficit before the economy is ready for it than to take further action to spur output and employment.
Gallup Provides Best Unemployment Measure - Given the constantly changing -- and sometimes surprising nature of the government's reports -- Gallup's measurement of the U.S. unemployment rate, based on a random sample of more than 15,000 phone interviews monthly, is likely the best way to monitor the real unemployment situation. On Friday, Jan. 6, the government reported the U.S. unemployment rate for December 2011 was 8.5% on a seasonally-adjusted basis and 8.3% unadjusted. The prior day, Gallup reported its unadjusted unemployment rate at 8.5% for December -- the same as in November. On an unadjusted basis, both Gallup and the government show a relatively stable unemployment situation over the last three months of 2011 -- probably the best view of the real situation.However, the government's adjusted data -- as revised -- shows something completely different with the unemployment rate declining steadily from 8.9% in October to 8.5% in December. In 2012, anything may happen, as the government rebases its data in January and then adjusts its results monthly. The current declining trend could continue or reverse -- either way all of these adjustments may create political debates about whether the real job situation is improving or not.
Measuring Long-Term Hardship in the Labor Market - From peak to trough, the United States lost almost nine million jobs in the most recent economic downturn. What was completely unprecedented about the most recent recession, however, was the explosion in long-term unemployment. The depth and length of the recession pushed the long-term unemployment rate – the share of unemployed workers who have been unemployed for 27 weeks or longer – to over 40 percent throughout the entirety of 2010 and 2011. The official concept of “long-term unemployment,” however, is incomplete and, in some cases, even potentially misleading. As tracked by government statistics, the long-term unemployed are only a relatively small part of the population facing extended, sometimes permanent, spells without work. This paper proposes rethinking our understanding of long-term unemployment in two ways. First, we encourage shifting from a narrow focus on long-term unemployment toward a broader concept of “long-term hardship” in the labor market. Second, we suggest complementing the standard measure of long-term unemployment, which reports the share of the unemployed who have been out of work for six months or more, with an alternative measure, which reports the share of the total labor force that has been unemployed for six months or more.
Work-At-Home Scam Victims Receive $9.70 Per Person In Settlement - With more Americans out-of-work, the economic downturn has given work-at-home scammers a boost. The number of complaints about work-at-home scams filed to the FTC grew to nearly 8,000 in 2009 from slightly more than 4,000 in 2006, according to USA Today. The firms often take advantage of vulnerable Americans by offering them the opportunity to make money by stuffing envelopes, doing online searches or assembly or craft work, according to the FTC. In addition to the unemployed, financial scammers are also increasingly preying on the elderly, a separate USA Today report found. Since the unemployment rate has seen an unwelcome boost in recent years, the Federal Trade Commission has stepped its enforcement efforts against firms that advertise the opportunity for Americans to get rich quick working from home, only to ask potential customers to pay up front for materials that allegedly don't result in a successful business. But by the time the FTC prosecutes the businesses and the cases run their way through the court system, the firms have often already spent or hidden the money, The Washington Post reports. The result? In a recent FTC settlement with a Texas-based company, the victims of an alleged scam only received an average payment of $9.70, WaPo reports.
An Appalling Idea, Even by Washington Standards - For legislation to extend the payroll tax cut through the end of 2012, House Republicans are expected to push for a provision on unemployment insurance (UI) that is appalling even by current Washington standards. Neither President Obama nor Congress should accept any payroll-tax legislation that includes it. Here’s why: The provision, part of a full-year payroll-tax bill that the House passed in December, would deny UI benefits to any worker who lacks a high school diploma or GED and is not enrolled in classes to get one or the other — regardless of how long the person worked or whether he or she has access to adult education, which itself has been subject to significant budget cuts in the past few years and is heavily oversubscribed. The proposal would deny UI benefits to hundreds of thousands of workers — many of them middle-aged — who have worked hard, played by the rules, and effectively paid UI taxes for years and who then were laid off due to no fault of their own. Older workers would be hit the hardest. Nearly half (47 percent) of UI recipients with less than a high school education or the equivalent are over age 45. In 2010, half a million workers age 50 or over who received UI lacked a high school diploma.
Unemployed Rely More On Family Than Government : NPR: A Kaiser Family Foundation and NPR survey shows that many people enduring long-term joblessness have been relying more heavily on friends and family than government or other safety net services to get by. Many surveyed also say that, so far, the federal government's efforts to boost the economy and job market have done more harm than good. Now, a recent NPR Kaiser Family Foundation survey of the long-term unemployed and underemployed. It found little trust in the government's ability to both help the economy and help them. And as Kirk Siegler of member station KUNC reports, that means many jobless Americans are turning to friends and to family instead.
With Unemployment Insurance, Is 99 Weeks the Magic Number? - A possible compromise between Democrats who want to leave the unemployment compensation system unchanged and Republicans who want to return to pre-recession benefit formulas might be to adopt a benefit formula from some of the previous recessions. At the end of 2011, Congress allowed unemployment beneficiaries to continue to collect under both the emergency and extended programs, which permit the unemployed to receive benefits for up to 99 weeks of unemployment. Some economists believe that unemployment insurance stimulates spending because unemployed people are thought to spend most, if not all, of the money they have on hand. Some economists also suggest that unemployment insurance prolongs unemployment because an unemployed person has to give up his benefits as soon as he finds and starts a new job or returns to working at his previous job. Either way, some people cannot find work, and unemployment benefits help cushion their blow.
David Ignatius Hides Upward Redistribution Policies as Market Outcomes, by Dean Baker: People are inclined to give much more legitimacy to market outcomes than policy outcomes engineered by governments. That is why there is a whole industry devoted to convincing people that the upward redistribution of income over the last three decades, which has given the bulk of economic gains to the One Percent, is really just the result of the natural workings of the market. David Ignatius is one of the people who works in this industry. His Post column today urges readers to contemplate the awful thought that, quoting Francis Fukuyama: "What if the further development of technology and globalization undermines the middle class and makes it impossible for more than a minority of citizens in an advanced society to achieve middle-class status?” It is very useful to the One Percent to pretend that their wealth and the near stagnation in living standards for everyone else is just the result of "the further development of technology and globalization." However this has nothing to do with reality.
Charting The Extinction Of American Disposable Income - It was the best of times, it was the worst of times. Given today's excitement at a rallying equity market, we are already hearing chatter on raising GDP estimates even though macro data is benefiting from standard seasonal improvements. However, while these good times are rolling for some (who, we are not sure), Sean Corrigan (of Diapason Commodities) points to our real disposable income. The man on the street's spend-ability has seen the worst five years' growth in half a century. For four decades, US real per capita disposable income has risen at ~20% a decade. For the average working man, that is a doubling of disposable income in a typical working life. The last 5 1/2 years, however, have seen no change whatsoever - the worst performance in at least half a century.
Overclass vs. Underclass - The middle class looks nervously up, then down. Which is the greater economic threat, the overclass or the underclass? Perceived answers to this question now shape political allegiances in the United States. Not that the middle class is sure where its boundaries lie. Much depends on what other labels are offered – such as working class or upper middle or lower middle rather than just plain middle. But whatever its exact size, the middle class is usually considered more deserving – and more threatened – than those at the extremes. Those on the left argue that the overclass threatens the country’s well-being, while those on the right point their fingers at the underclass. President Obama wants to raise taxes on millionaires; Republicans want to cut social programs directed at the poor. Occupy Wall Street accuses the top 1 percent of greed; Tea Party conservatives accuse welfare recipients of sloth, another deadly sin. Many people, including me, have decided that the overclass poses the most serious threat today to the middle class in the United States because it markets the assertion that the underclass is the source of all our problems. What the middle class decides will depend on its assessments of the relative threats of increasingly concentrated wealth at the top versus growing economic desperation at the bottom.
No longer the land of opportunity - “Over the past three years, Barack Obama has been replacing our merit-based society with an Entitlement Society,” Mitt Romney wrote in USA Today last month. The coming election, Romney told Wall Street Journal editors last month, will be “a very simple choice” between Obama’s “European social democratic” vision and “a merit-based opportunity society — an American-style society — where people earn their rewards based on their education, their work, their willingness to take risks and their dreams.” The best way to measure a nation’s merit-based status is to look at its intergenerational economic mobility: Do children move up and down the economic ladder based on their own abilities, or does their economic standing simply replicate their parents’? Sadly, as the American middle class has thinned out over recent decades, the idea of America as the land of opportunity has become a farce. As a paper by Julia Isaacs of the Brookings Institution has shown, sons’ earnings approximate those of their fathers about three times more frequently in the United States than they do in Denmark, Norway and Finland, and about 11 / 2 times more frequently than they do in Germany. The European social democracies — where taxes, entitlements and the rate of unionization greatly exceed America’s — are demonstrably more merit-based than the United States.
Unpaid internships hurt mobility - In his excellent piece in today’s New York Times on the declining economic mobility of Americans, Jason DeParle mentions a commentary by Reihan Salam for the National Review Online, “Should we care about relative mobility?”Salam disputes that there’s anything wrong in the natural tendency of economically successful families to give their children special advantages in the competition for jobs, education and other resources. He admits, however, that affluent white families may have social networks that blacks cannot access and that protect whites, but not blacks, from downward mobility. The particular mechanism Salam identifies – internships — is one that EPI has identified as a serious problem for the economic mobility of minorities and for the labor market in general. Salam recognizes that internships are sometimes reserved for the affluent: Unpaid internships, in particular, exclude students from poorer families who can’t afford to work for nothing for a summer or a semester, especially after they graduate from college with tens of thousands of dollars of student loan debt. The children of affluent families, on the other hand, can afford to live in the most expensive cities in the U.S., such as New York and Washington, making contacts, building their resumes, and sometimes even learning skills, while their parents pay for their room and board, travel and entertainment.
Another Excellent Inequality Study -The Congressional Research Service (CRS) isn’t as well known in these parts as the CBO, but their reports are widely considered equally reliable and nonpartisan. So I took notice of their newly released study on income inequality. The CRS study is notable in numerous respects: it uses high quality tax return data; it provides useful breakdowns of income by source (wages, cap gains, etc.) and their impact on inequality; it provides before- and after-tax analysis.Two drawbacks are the 1) data are for income tax filers only—including, however, low-income families that get tax refunds—and 2) the data years and 1996 and 2006, so the endpoint seems a bit outdated (it’s the last year of publicly available of this sort). However, as CRS convincingly states, these years are actually well-chosen: …both years were at approximately similar points of the business-cycle with moderate inflation (about 3%), a modest unemployment rate (about 5%), and moderate economic growth (3.7% in 1996 and 2.7% in 2006). Second, 2006 was the year before the August 2007 liquidity crunch and the onset of the severe 2007-2009 recession. Third, there were major tax policy changes between these two years. Fourth, both 1996 and 2006 were three years after the enactment of tax legislation that affected tax rates and are unlikely to be affected by short-run behavioral responses to these changes. Here are some of the findings that caught my eye:
Harder for Americans to Rise From Lower Rungs —Movin’ on up,” George Jefferson-style, is not only a sitcom song but a civil religion. But many researchers have reached a conclusion that turns conventional wisdom on its head: Americans enjoy less economic mobility than their peers in Canada and much of Western Europe. The mobility gap has been widely discussed in academic circles, but a sour season of mass unemployment and street protests has moved the discussion toward center stage. Former Senator Rick Santorum of Pennsylvania, a Republican candidate for president, warned1 this fall that movement “up into the middle income is actually greater, the mobility in Europe, than it is in America.” National Review, a conservative thought leader, wrote2 that “most Western European and English-speaking nations have higher rates of mobility.” Even Representative Paul D. Ryan, a Wisconsin Republican who argues that overall mobility remains high, recently wrote that “mobility from the very bottom up” is “where the United States lags behind.” Liberal commentators have long emphasized class, but the attention on the right is largely new.
Dividends, Capital Gains, and the Growth of Income Inequality - Yesterday, I posted this analysis of an informative new report from the CRS on the increase in income inequality between 1996 and 2006. One important finding from the report decomposes the increase in inequality, as measured by the Gini coefficient, into the contributions made by different income types. Such diagnostics can be very helpful when we’re thinking about prescriptions. I’ve plotted the results below. The Gini coefficient is a measure of inequality that ranges between 0 and 1, where higher numbers imply a less equal distribution. Over these 10 years, the Gini of after-tax income increased from 0.503 to 0.560, an increase of 0.057, or 11%. The figure below assigns that 0.057 point growth to the different sources of income. Note that some sources led to higher inequality, while other reduced its growth. On net, however, inequality grew. Source: CRSThe largest single contributor to the growth of inequality, 1996-2006, was dividends and capital gains. Adding in business income, like profits from a hedge fund, comes to 0.061, more than explaining the 0.057 point increase in the Gini index.
The biggest driver of income inequality —A new report1 from the Congressional Research Service — the nonpartisan public policy branch of Congress — takes a closer look at the drivers of income inequality between 1996 and 2006, the last period of moderate economic growth before the latest boom-bust cycle. The report explains that the Bush tax cuts contributed significantly to growing inequality but concludes that income from capital gains and dividends — investments in stocks, bonds, real estate and other assets — mattered even more: Changes in income from capital gains and dividends were the single largest contributor to rising income inequality between 1996 and 2006. Changes in tax policy also made a significant contribution to the increase in income inequality, but even in the absence of tax policy changes income inequality would likely have increased. Although earning inequality increased between 1996 and 2006, changes in wages and salaries appear to have had little effect on the increase in overall income inequality. Democrats like President Obama have proposed raising the capital gains tax — which was lowered under Bush — partly out of interest in bridging this divide. Many conservatives, by contrast, believe that capital gains are taxed too much, arguing that it’s income that can be double-taxed under corporate and individual income taxes. All the major Republican presidential candidates but Romney and Santorum want to eliminate the capital gains tax entirely.
Myth of American Upward Mobility Punctured - We’ve been talking about income inequality lately, and tied into that is the idea of upward mobility. The United States, in the myths of cock-eyed optimists everywhere, remains the land of opportunity, where everyone can get a fair shot at greatness. But that America hasn’t existed for a while. In fact, as Jason DeParle reports, upward mobility doesn’t really exist in this country anymore. At least five large studies in recent years have found the United States to be less mobile than comparable nations. A project led by Markus Jantti, an economist at a Swedish university, found that 42 percent of American men raised in the bottom fifth of incomes stay there as adults. That shows a level of persistent disadvantage much higher than in Denmark (25 percent) and Britain (30 percent) — a country famous for its class constraints. Meanwhile, just 8 percent of American men at the bottom rose to the top fifth. That compares with 12 percent of the British and 14 percent of the Danes. Despite frequent references to the United States as a classless society, about 62 percent of Americans (male and female) raised in the top fifth of incomes stay in the top two-fifths, according to research by the Economic Mobility Project of the Pew Charitable Trusts. Similarly, 65 percent born in the bottom fifth stay in the bottom two-fifths.
More Mobility Pictures and Words - I promised I’d follow up on this and I do try to stay true to my word. [These come from the mobility chapter I contributed to the 2008/09 version of the book State of Working America, an EPI publication.] The first figure reflects some of the points from the NYT article this AM (see link above). Each bar represents a correlation between the incomes of fathers and sons, once the sons grow up. So this is a “how-far-does-the-apple-fall-from-the-tree” measure. And larger correlations mean closer apples. Basically, the more you can look at someone’s economic situation at birth and accurately predict where they’ll end up, the less mobility there is. Next, two figures that are particularly important in terms of the factors responsible for tamping down mobility, particularly for lower-income children. They both show that educational opportunity—a critical component of upward mobility for kids from less advantaged backgrounds—is itself inequitably distributed. The first picture just compares the family income of kids in the entering classes at top universities versus community colleges. Only 3% of kids entering the top-tier schools come from the low end of the income scale; almost three-quarters come from the top. But it’s the next chart that’s the real killer. This one controls for not just income, but cognitive ability as well, based on test scores in eighth grade. It then follows these kids over time and asks what share completed college.
Median Adjusted Gross Incomes by Tax Filling Status - Sometimes, as we work on our various projects, we stumble across data that's kind of interesting in and of itself. To that end, today's example of that would appear to provide more evidence that social factors have more to do with the perceived rise in income inequality in the United States over time than do economic factors: In the chart above, we've presented the median adjusted gross incomes we've estimated for 2009's income tax filers according to their tax filing status. The number in parentheses below each column in the cart indicates the number of tax returns filed in 2009 for each group. It would seem that just marital status has a lot to do with the observed differences between the various kinds of income tax filers.
Stigmatizing Food Stamps - Five years ago, New York State stopped requiring that all applicants for food stamps be electronically fingerprinted. Recently, California and Texas ended their requirement, leaving New York City and Arizona the only jurisdictions to continue the stigmatizing requirement. Especially at a time when so many families are struggling, the Bloomberg administration should drop the requirement that leads too many New Yorkers to forgo help. If it does not, Gov. Andrew Cuomo should issue an executive order ending the city’s exemption. Mayor Michael Bloomberg and his human resources commissioner, Robert Doar, contend that fingerprint matching is essential for detecting and deterring fraud and avoiding costly duplications. But there is no evidence that finger-imaging is either cost-effective or necessary. Collecting fingerprints is useless for uncovering scams like government employees’ making up phony cases or applicants’ lying about their income. Matching applicants’ names with Social Security numbers, as other jurisdictions do, would be cheaper and equally effective.
Does the US Populace Know It's Turning Its Nation's Poor Into Criminals? Or Is It The Ultimate Money-Maker In A Deep Recession? - Suzan - I met Barbara Ehrenreich when she spoke in Key West in the mid-90's about her research for her book, Nickeled and Dimed, for a consortium of women's organizations which had asked me to help with the preparations. I really enjoyed her witty and intelligent presentation and queried Barbara afterwards about the problem I was just beginning to understand concerning the difficulty of so-called "overqualified" professionals in obtaining almost any type of employment after layoffs due either to too much education and/or experience or being older than mid-30's. Her next book, Bait and Switch, was a nice answer for me. Not that I ever got a job again which was more than a short-term contract, but still . . . at least I knew someone else understood what was going on early in the cycle. I thoroughly enjoyed and touted personally (as I really like her and her research skills) at this blog her last book, Bright-Sided, on the dangers of too much positive thinking when reality demands a much more knowledgeable perspective. I also have personal experience with her current subject (unfortunately). It's embarrassing to admit impending poverty, not to mention being poor in this society (and maybe in all societies everywhere today), but it's a crushing phenomenon now experienced by a very large and increasing number in our population and it doesn't seem like it's receding a bit.
3.5 Million Homeless and 18.5 Million Vacant Homes in the US - The National Economic and Social Rights Initiative along with Amnesty International are asking the U.S. to step up its efforts to address the foreclosure crisis, including by giving serious consideration to the growing call for a foreclosure moratorium and other forms of relief for those at risk, and establishing a housing finance system that fulfills human rights obligations. New government census reports have revealed disturbing information that details the cold, hard numbers of Americans who have been deeply affected by the state of our economy, and bank foreclosure practices: In the last few days, the U.S. government census figures have revealed that 1 in 2 Americans have fallen into poverty or are struggling to live on low incomes. Along with poverty and low incomes, the foreclosure rate has created its own crisis situation as the number of families removed from their homes has skyrocketed. Since 2007, banks have foreclosed around eight million homes. It is estimated that another eight to ten million homes will be foreclosed before the financial crisis is over. This approach to resolving one part of the financial crisis means many, many families are living without adequate and secure housing. In addition, approximately 3.5 million people in the U.S. are homeless, many of them veterans. It is worth noting that, at the same time, there are 18.5 million vacant homes in the country.
Billions needed to upgrade America’s leaky water infrastructure - At first glance, the pizza-size hole that popped open when a heavy truck passed over a freshly paved District street seemed fairly minor. Then city inspectors got on their bellies with a flashlight to peer into it. What they discovered has become far too common. A massive 19th-century brick sewer had silently eroded away, leaving a cavern beneath a street in Adams Morgan that could have swallowed most of a Metro bus. It took three weeks and about a million dollars to repair the sewer, which was built in 1889. Time and wear “had torn off all the bricks and sent them God knows where,” “We have to find them and see if they’re plugging up the system somewhere farther down the line.” If it were not buried underground, the water and sewer system that serves the nation’s capital could be an advertisement for Band-Aids. And it is not much different from any other major system in the country, including those in many suburbs and in cities less than half as old as Washington.
Jobless Rates Drop in Most Cities - Unemployment rates in most cities were below year-earlier levels in November, the Labor Department reported, but 133 of 372 metropolitan areas posted flat or declining employment from a November 2010. Unemployment rates at the city level aren’t seasonally adjusted to take things like higher holiday employment into account, so the best comparisons are to year-earlier levels instead of comparing monthly variations. Without seasonal adjustments the national unemployment rate was 8.2% in November. One hundred thirty seven metropolitan area recorded November unemployment rates above the national average, while 225 were lower. The highest unemployment rates continued to be concentrated in California with seven of the top eight located in the state. El Centro, Calif., and Yuma, Ariz., recorded the highest rates in the country in November at 27.2% and 23.7%, respectively. The lowest rates were recorded in North Dakota with Bismarck at 2.8% and Fargo at 3.1%. Lincoln, Neb. came in third at 3.2%. Among metropolitan areas with over a million people, Las Vegas and California’s Inland Empire topped the list with a 12.5% each. Minneapolis-St. Paul was the lowest among large cities with a rate of 5.1%.
Question #7 for 2012: State and Local Governments - Earlier I postedTen Economic Questions for 2012. I'm trying to add some thoughts, and a few predictions for each question. Many of the questions are interrelated. The question on monetary policy depends on inflation (question #9), the unemployment rate (question #6) and what happens in Europe (question #8). And the unemployment rate is related to GDP growth (question #4), and on and on ... Question #7: State and Local Governments: It is starting to look like there will be less drag in 2012 than in 2011. How much of a drag will state and local budget problems have on economic growth and employment? How about this headline from Bloomberg this morning: Michigan Fiscal Agency Anticipates $735 Million Budget Surplus for 2011-12? This doesn't mean the cuts are over because the budget assumes further cuts, especially for education. But it suggests progress. There was a similar article about California a couple of weeks ago in the San Francisco Chronicle: California leaders say time for cuts may be ending. Once again there are more cuts coming, but the end may be in sight.
State revenue rises, but not enough to offset cuts - Twenty-nine states are spending less from their general funds today than they did before the recession, according to a recent joint survey from the National Governors Association and the National Association of State Budget Officers. More than 30 states have raised taxes since the recession began, but some of those increases were temporary and are expiring soon, as in Arizona. With the economy slowly reviving and unemployment rates dipping, many governors and lawmakers say they don't want to jeopardize the recovery by raising taxes again. But tax revenue is not expected to grow enough to make up for the impact of four years of dismal economic times. Rainy-day funds, internal transfers and other one-time sources have largely been tapped, so governors and lawmakers must look for new places to cut spending. Changes to public employee retirement benefits and sweeping reforms to health care programs such as Medicaid are among the most likely targets. At least 17 states project budget gaps for the next fiscal year, while a handful need to balance budgets in the remaining six months of the current budget year. The revenue of all 50 states combined remains $21 billion below 2008 levels, according to the National Governors Association-NASBO report.
State- and local level corporate subsidy tracker - A growing number of state governments are disclosing which companies they are giving tax breaks and other subsidies in the name of job creation and economic development. Yet much of that information is being disseminated through hard-to-find reports and web pages. SUBSIDY TRACKER is the first national search engine for state economic development subsidies. It brings together recipient data from a wide range of subsidy programs in states across the country.Each entry identifies the recipient company and, depending on availability, provides data on the dollar value of the subsidy, the program and state agency involved, the location of the subsidized facility, and the employment impact of the subsidy. Each entry also indicates where the data came from, so the user can go to the original source for more details. For more information on the data, see the User Guide. Subsidy Tracker is a work in progress. We are continually adding data from more programs and increasing the years of coverage. Subsidy Tracker currently contains more than 114,000 awards from 264 programs in 42 states. Inventory of data sources (updated November 8, 2011)
Quinn’s 3-year outlook forecasts gloomy budget - The long-term forecast for the Illinois budget looks gloomy, with less state money available and government services facing cuts, Gov. Pat Quinn’s office said Tuesday. Quinn’s three-year projection shows state revenues climbing for two years and then dropping sharply when the state income tax increase expires. More federal money could make up the difference, but Illinois government would wind up with roughly the same amount to spend in 2015 that it has now: a little over $33 billion. Meanwhile, expenses will keep climbing unless officials take action. The state’s contribution to government pension systems is projected to grow 43 percent, to about $5.9 billion. Quinn’s forecast shows health care costs holding steady, but that assumes something happens in the next few years to control expenses. Without that, Medicaid costs could rise by hundreds of millions of dollars a year. “Our revenue growth is not enough to keep up with pensions and Medicaid. It creates a squeeze for everything else,”
California lawmakers return to face huge budget deficit - Lawmakers returned to Sacramento with a bang Wednesday, kicking off 2012 with a flurry of new bills, a leadership transition and no shortage of drama involving members' personal troubles. While tackling a projected budget deficit of roughly $12 billion over the next 18 months will be a top priority, Senate President Pro Tem Darrell Steinberg, a Democrat, predicted that members would take action on a long list of issues during the second year of the two-year session, including public employee pensions, the state's high-speed rail project and an $11 billion water bond slated for the November ballot. The Sacramento Democrat said he felt the three-month recess, the first full break of its kind in years, had given members the energy and focus to "get off to a fast start this year." For Senate Republicans, the new year means a new leader. The caucus met in the afternoon to elect Republican Bob Huff as GOP leader, the successor to Sen. Bob Dutton, who is termed out and running for the Assembly this year.
California Train Plan Hits Bump Over Funds - California’s ambitious plan for a high-speed rail system hit a big roadblock Tuesday, as an independent panel urged lawmakers to deny authorizing the issuance of $2.7 billion in bonds to kick off the $98.5 billion project. The California High-Speed Rail Peer Review Group—which the state legislature appointed to analyze funding for the rail system—questioned the California High-Speed Rail Authority’s plan to start construction without any assurance of future funding from the federal government, among other factors. Moving ahead “represents an immense financial risk” for California, the group said in its report, echoing concerns from critics who say the project could leave state taxpayers on the hook for billions of dollars in future costs. The panel appeared to leave the door open to supporting state funding in the future, if the rail authority addresses its concerns. While the report isn’t binding, it puts pressure on California lawmakers as they decide whether to release billions of dollars in state bonds for the project.
Urban Growth and Decline: The Role of Population Density at the City Core - Cleveland Fed - In recent decades, some cities have seen their urban centers lose population density, as residents spread farther out to suburbs and exurbs. Others have kept populous downtowns even as their environs have grown. Population density in general has economic advantages, so one might wonder whether a loss of density, which may be a symptom of negative economic shocks, could amplify those shocks. We look at four decades of census data and show that growing cities have maintained dense urban centers, while shrinking cities have not. There are reasons to think that loss of population density at the core of the city could be particularly damaging to productivity. If this is the case, there could be productivity gains from policies aimed at reversing that trend.
Mayor Dave Bing's Detroit rescue plan fails to win over City Council - Mayor Dave Bing delivered to Detroiters a rescue plan Thursday that he says can save the city from insolvency and an emergency manager. But the plan is not new and depends largely on concessions that unions have strongly resisted. Bing unveiled the plan in a rare appearance before the City Council but did little to convince members that it was bold enough to avoid the appointment of an emergency manager, which the state warned could happen anytime during the next two months. "Think bold; think outside the box," Councilwoman Saunteel Jenkins urged the mayor. "There is a sense of urgency. The goal is to figure out if we are going to get out of this financial crisis on our own." Bing's rescue plan calls for $360 million in cuts during the next 18 months, about half of which depends on labor unions accepting major concessions in health care and pension benefits. Among the cuts: $20 million by reducing overtime; $14 million by laying off 1,000 employees in February; $13 million in vendor payment reductions. The Police and Fire departments each also plan to each cut about $12.5 million from their budgets, with a combined 200 layoffs.
Hundreds of Miami-Dade officer layoffs expected -- Miami-Dade commissioners voted against forcing officers in the county to spend more of their hard-earned money, which means that hundreds of officers may soon receive pink slips. Miami-Dade County Mayor Carlos Gimenez has asked for $239 million in concessions from all of the unions, $75 million specifically from the Police Benevolent Association. In November, the Police Benevolent Association and the County reached an agreement to cut $57 million, but the union rejected the portion of the contract that increased healthcare contributions. On Thursday, the commission was forced to choose whether they would require Miami-Dade Police officers to contribute another five percent toward their healthcare benefits, or lay off law enforcement officers. Hundreds of Miami-Dade Police officers packed the commission chambers, wearing T-shirts with the words "Enough is Enough." The officers, who are already giving five percent of their salaries for their benefits, declared they could not afford to give any more of their money.
T Proposing 43 Percent Fare Hikes - Public transit riders would face fare hikes as high as 43 percent, along with service cuts, under proposals made Tuesday by the Massachusetts Bay Transportation Authority as it tries to close a projected $161 million budget gap. State transportation officials unveiled two possible scenarios at a meeting of the MBTA's Board of Directors. The T has not had a fare hike in five years. Under one scenario, a bus ride could jump from $1.25 to $1.75 while a subway ride could jump from $1.70 to $2.40 for passengers holding automated CharlieCards. Under a second scenario, fare increases would rise by a more modest 35 percent - $1.50 for a bus ride and $2.25 for subway - but service cuts would be more extensive.
Fewer Kids in the U.S. - The U.S. under-18 population fell between 2010 and 2011, the first time in at least two decades that the country has seen its minor population decline, according to demographers and new Census data. Getty ImagesThe U.S. under-18 population was 73,934,272 in July 2011, a decline of 247,000 or 0.3% from July of 2010, according to an analysis of Census data by William H. Frey, a demographer at The Brookings Institution. The child population is still up 2.3% from 2000, largely because of gains made in the early-decade boom years. The child population is falling because fewer immigrant children are coming across U.S. borders, and because fewer children are being born. Meantime, the so-called millennial generation is moving into adulthood. With fertility rates down, Mr. Frey says “it doesn’t look like a youth boom will reverberate anytime soon.” The U.S. minor population fell in the 1970s as well, as baby boomers moved into adulthood and women entered the labor force en masse, delaying families in the process. A large drop in fertility was also behind a decline in minors between 1920 and 1930.
Welfare Lines Overflow - Growing numbers of New Yorkers seeking food stamps have created an unwelcome spillover effect at some of New York City's job centers: overcrowding that in some cases has grown so severe, benefits were jeopardized. The crush of people grew so large at one Brooklyn center in November that the Fire Department intervened and prevented anyone from entering the building. That was an extreme example of the problem. But clients at many of the city's 29 job centers—which manage public-assistance benefits, including food stamps—regularly arrive long before the doors open to wait in line. Advocates said people miss mandatory appointments, leading to a bureaucratic battle to reopen their cases, or abandon the process after growing discouraged. "It's like everybody is running around with their head cut off, and no one cares." Officials at the city's Human Resources Administration, which runs the centers, acknowledged that serious overcrowding is a problem at five facilities. Advocates believe the problem is broader, affecting roughly 10 centers.
Circle of Concern Food Pantry Sees 13% Increase in 2011 - Circle of Concern Food Pantry has been serving those in need since 1967, but never has the need been so great. Glenn Koenen tells KMOX in 2011, Circle of Concern fed 13-percent more people then in 2010. The exact number, 25,161 people were served last year. Many families that use to be middle-class, supported Koenen’s food pantry, now they need the help. Koenen says as people’s unemployment and resources run out, they are turning to Circle of Concern. He says many of those people feel as though they have lost their middle-class standing and will never be able to bounce back.Despite more people starting to go back to work, Koenen says “they just can’t earn enough money to escape poverty.” In 2002, Circle of Concern served 75-hundred. The food pantry operates entirely off of donations. Koenen has a request, circle a day in February or March and collect food in your neighborhood and then, donate the items to Circle of Concern or any food pantry of your choice.
Homeless have been sleeping on clinic’s porch for months - The jarring sight we saw in the wee hours of the morning Thursday at Baltimore’s new $15.5 million homeless services clinic – eight people sleeping in barely above freezing temperatures outside the building on its “front porch” – was not unusual, it seems. Kevin Lindamood, president and CEO of Health Care for the Homeless (HCH), said people began sleeping outside their building at 421 Fallsway a year ago – and the “porch population” that has been coming there ever since is “not static.” Caseworkers are assigned to the people who turn up, meet regularly with them and often manage to find them a bed somewhere in town, Lindamood said. But new people keep coming. “We’ve had couples, we recently had two women and, at one point, we had a woman who was eight months pregnant,” he said, adding that the staff of the clinic (it is not a shelter) eventually found her a place to stay that was out of the elements.
Charlotte homeless shelter expecting record numbers (Video) - As the temperature plunges, Charlotte's Men's Shelter will not turn away anyone, no matter how many show up.
Growing Number Of States Contending With Crisis-Level Child Poverty -- Child poverty is getting worse in America. And with more and more states seeing their populations of disadvantaged youth soar beyond pre-recession levels, the crisis is far from limited to a few troubled states. In 2007, before the economy seized up, and before a combination of rising unemployment and plunging home values left millions of Americans scrambling to make ends meet, the child poverty rate in America was 17.8 percent, according to a report released in December from First Focus and the Brookings Institution. Only fourteen states had child poverty rates of 20 percent or more, a percentage that put them in a category the report calls "high child poverty status." Things have devolved considerably in the years since, however. By 2010, the national child poverty rate had risen to 21.6 percent, and the number of high-child-poverty states had nearly doubled, to 25. It's expected to get worse before things get better. While the official statistics aren't in yet for 2011, the Brookings report predicts that nationwide child poverty swelled to 22 percent in the year just ended, and that the number of high child poverty states grew again to 28. One in five Americans has had trouble putting food on the table in the past year, and nearly half of all U.S. households are struggling to cover basic expenses like electricity and medical care.
Philly schools send layoff notices to 1,400 - The Philadelphia School District has sent layoff notices to an additional 1,400 employees as it struggles to contain costs while facing a bleak budget picture. The Philadelphia Inquirer ( http://bit.ly/vmtPYT) reports the district issued the notices last week to blue-collar workers who clean buildings and attend to buses. The layoffs don't take effect until Dec. 31, 2012. The district laid off nearly 850 similar workers in September. More than 1,000 teachers were laid off over the summer. A district spokesman says the layoffs were necessary because the union rejected a contract extension that included $16 million in concessions. Union leaders say the proposal was rejected after the district paid nearly $1 million to buy out the contract of former Superintendent Arlene Ackerman.
Schools will be cut $4.8 billion if taxes don't pass, Gov. Jerry Brown says -- Putting schools and voters squarely in the middle of what could be an explosive battle over taxes, Gov. Jerry Brown on Thursday laid out a fiscal blueprint that heavily relies on cash the state doesn't yet have. Brown called for a budget that assumes $6.9 billion in new revenues from a tax measure he plans to take to voters in November. The governor says passage of the measure would wipe out a $9.2 billion deficit through mid-2013 and give schools $4.9 billion more than this fiscal year. It was the opening act to what will be Brown's main political thrust this year: to persuade voters that without new revenues California's grim times will become even bleaker. If voters reject the taxes, new cuts of $5.4 billion -- including the new funding for schools -- would be triggered, on top of the $4.2 billion in cuts that Brown has proposed for the next budget year, which begins July 1. Those potential cuts could reduce the school year by three weeks.
The private education dilemma - As an Australian parent in 2012, the public versus private school debate is hard to avoid. In a society where private schooling is becoming the norm, yet literacy and numeracy skills are stagnating, how does one objectively analyse the costs and benefits of school choice? First, let me say that school choice is just one factor determining vocational, personal and emotional skills during adolescence. Genetics, parenting, the home environment, peer groups, sports and other club activities, amongst many factors, all contribute to shaping young minds. Additionally, the composition of students at the school plays a strong role in determining academic outcomes. Many private schools for example, offer academic scholarships. If those students had instead attended the local public school, any difference in average academic results may be greatly reduced. How then does one separate the impact of school choice from these other factors?
Shocker: Empathy Dropped 40% in College Students Since 2000 - College students who hit campus after 2000 have empathy levels that are 40% lower than those who came before them, according to a stunning new study presented at the annual meeting of the Association for Psychological Science by University of Michigan researchers. It includes data from over 14,000 students. Although we argue in Born for Love: Why Empathy Is Essential--and Endangered that modern child-rearing practices are putting empathy at risk, this is the largest study presented so far to quantify the decline. Previous research done by psychologist Jean Twenge had measured what she labeled a "narcissism epidemic," with more students showing selfish qualities and with increases in traits that can lead to a diagnosis of narcissistic personality disorder. That is a condition in which people are so self-involved that other people are no more than objects to reflect their glory.
For Better Grades, Try Bach in the Background - In the journal Learning and Individual Differences, a research team led by Fabrice Dosseville of the Universite de Caen Basse-Normandie describes an experiment featuring 249 university students. All were enrolled in an introductory course in sports psychology. The students were divided into two groups “that were equal on academic performance.” Each group viewed a different version of an hour-long videotaped lecture on “Expertise in Athletics,” in which the talk was accompanied by synchronized slides. For one group, the lecture was accompanied by a series of familiar classical pieces, including excerpts from Mozart’s Eine Kleine Nachtmusik, Tchaikovsky’s Nutcracker and Bach’s Third Brandenburg Concerto. The other group heard the lecture with no background music. Within 15 minutes of hearing the lecture, all the students took a multiple-choice quiz featuring questions based on the lecture material. The results: the students who heard the music-enhanced lecture scored significantly higher on the quiz than those who heard the music-free version.
Princeton Brews Trouble for Us 1 Percenters - To: The Upper Ones, From: The Strategy Committee, Re: The Alarming Behavior of College Students The committee has been reconvened in haste to respond to a disturbing new trend: the uprisings by students on elite college campuses. Across the Ivy League the young people whom our Wall Street division once subjugated with ease are becoming troublesome. Our good friends at Goldman Sachs, to cite one example, have been forced to cancel their recruiting trips to Harvard and Brown. At Princeton, 30 students masquerading as job applicants entered a pair of Wall Street informational sessions, asked many obnoxious questions (“How do I get a job lobbying the U.S. government to protect Wall Street interests?”), rose and chanted a list of charges at bankers from JPMorgan and Goldman Sachs, and, finally, posted videos of their outrageous behavior on YouTube. The committee views this latter incident as a sure sign of trouble to come. The whole point of going to Princeton for the past several decades has been to get a job at Goldman Sachs or, failing that, JPMorgan. That Princeton students are now identifying their interests with the Lower 99 percenters is, in its way, as ominous as the return of the Jews to Jerusalem.
Want a Job? Go to College, and Don't Major in Architecture - Say it with me, readers: College is worth it. For all the bellyaching about wasted degrees and the many indebted grads stuck on their parents’ couches, recent college graduates are still doing a lot better than their less-educated counterparts. Unemployment for new graduates is around 8.9 percent; the rate for workers with only a high school degree is nearly three times as high, at 22.9 percent. That’s according to a new report [PDF] from Georgetown’s Center on Education and the Workforce. The report also had some fascinating statistics on earnings and jobless rates by college major, something we’ve written about before. The chart below shows unemployment rates sorted by major, based on 2009-10 census data. You can also see jobless rates for graduates of a given undergraduate major who went on to receive further education (not necessarily related to their college major). In the chart, “recent college graduate” refers to workers who are 22 to 26 years old; “experienced college graduate” covers those 30 to 54; and “graduate degree holder” is limited to workers 30 to 54 years old.
M.I.T. Game Changer: Free Online Education For All - For Wall Street Occupiers or other decriers of the “social injustice” of college tuition, here’s a curveball bound to scramble your worldview: a totally free college education regardless of your academic performance or background. The Massachusetts Institute of Technology (M.I.T.) will announce on Monday that they intend to launch an online learning initiative called M.I.T.x,which will offer the online teaching of M.I.T. courses free of charge to anyone in the world. The program will not allow students to earn an M.I.T. degree. Instead, those who are able to exhibit a mastery of the subjects taught on the platform will receive an official certificate of completion. The certificate will obviously not carry the weight of a traditional M.I.T. diploma, but it will provide an incentive to finish the online material. According to the New York Times, in order to prevent confusion, the certificate will be a credential bearing the distinct name of a new not-for-profit body that will be created within M.I.T. The new online platform will look to build upon the decade-long success of the university’s original free online platform, OpenCourseWare (OCW), which has been used by over 100 million students and contains course material for roughly 2,100 classes. The new M.I.T.x online program will not compete with OCW in the number of courses that it offers. However, the program will offer students a greater interactive experience.
Is college worth the money and debt? - The cost of college has increased by 11x since 1980 while inflation overall has increased by 3x. Diluting education with for-profits. and saddling millions with debt. Is a college degree worth it? Since the debt bubble burst spectacularly in 2007 many more prospective students are questioning the worth of a college degree. For so many decades it was simply taken at face value that getting a college degree, any college degree would be worth it. Slowly this perception has morphed when annual tuition is running at $20,000 or more at for-profit institutions and $50,000 for private institutions. More to the point, most of the recent educational growth has been financed with large wallet crushing student loans. This financing of the college dream is turning out story after gut-wrenching story of college education nightmares. When a college education becomes this expensive it is important that potential students become savvy consumers. The financial sector certainly isn’t going to offer any advice on navigating the minefield of higher education since they largely have their greedy hands on this sector of the economy as well.
The calm before the student loan bubble bursts - For-profits make up 9 percent of student enrollment yet produce 27 percent of all private loans. The inevitable pop of the student loan bubble. The worth of a college degree has now come into question because of the massive student loan bubble. An education is vital yet the monopoly on knowledge has been turned upside down with readily accessible information through technological changes. What is odd however is during a time of knowledge access ubiquity you have a field sprouting up of institutions that simply target the unknowing with promises of degrees that yield worthless marketable prospects. Many for-profit colleges fit in perfectly with the financialization of our nation. The main goal is to draw in a large unsuspecting audience and saddling millions with unsustainable amounts of debt for a piece of paper that has little worth in regards to career aspirations. Like the subprime mortgages pushed by lower levels of the financial industry only for quick profits, many of the for-profit colleges have done very similar things to the prestige of a college diploma. When a list of cats and dogs with college degrees is listed on Wikipedia we know there are serious issues in how some for-profits operate.
Funding gap doubles for US corporate pensions - The funding gap for US corporate pension plans almost doubled in 2011 as bond yields dropped and stock market performance failed to keep up with rising liabilities, to leave a far greater hole than at the height of the financial crisis. From a moderate surplus at the end of 2007, pension plan assets at S&P 500 companies now cover only about 74 per cent of estimated liabilities, calculates Credit Suisse, a deficit of roughly $450bn. At the start of the year the S&P 500 pension funding gap was estimated at $250bn, according to Credit Suisse. Falling interest rates, or yields, have also lowered the discount rate used to calculate the value of promises to past and present employees. Credit Suisse calculates that every 25 basis point fall in the discount rate equals a $45bn increase in liabilities. The discount rates used by companies has fallen about three times that much this year. David Zion, head of accounting and research for Credit Suisse said: “You need really good returns to offset that. The typical pension plan has generated slightly positive returns this year, you can’t say that’s good”.
Illinois revenues to drop, pensions increase– Illinois’ projected budget shortfall is expected to increase over the next three years as the income tax increase expires and pension contributions increase. The governor must release three-year projections of revenue and expenses annually under new rules designed to improve the budgeting process. It shows state pension contributions increasing to $5.9 billion annually by Fiscal Year 2015, up from this year’s $4.1 billion. Kelly Kraft, spokeswoman for the governor’s budget office, says small operational cuts have been made, but more serious cuts must happen. “These are real savings that we are talking about here, but then when you take a look at the pension costs, as well as the increasing Medicaid costs, those costs are billions of dollars that we’re talking about,” she says. Kraft says the projection doesn’t include debt restructuring, but does set extra revenue aside to pay old unpaid bills. She says the governor will continue to push a borrowing plan to pay off bills at a lower interest rate.
N.J.'s elderly population to surge - The Garden State population has grown to 8.8 million, and within 20 years is expected by state demographers to approach 9.4 million. Of greater consequence than the raw numbers is how much growth is expected in the elderly population, equal to more than 90 percent of the overall change. Baby boomers, the post-World War II generation born between 1946 and 1964, account for nearly 30 percent of New Jersey’s population. As they age, they’ll push the number of residents 65 years and older from 1.15 million four years ago to more than 1.8 million by 2028, nearly 20 percent of the population.
You Cannot Make This Up: New Criterion Tells Us We Should Ditch Social Security Because All Minimum Wage Earners Can Become Millionaires - Yves Smith - People who write for right wing outlets live in an alternative reality. The piece that Michael Thomas pointed out to me from the New Criterion, “Future tense, V: Everybody gets rich,” by Kevin D. Williamson, belongs in a special category of its own in terms of the degree of disconnect it exhibits. As much as I enjoy shredding articles, this piece has so much wrongheadedness in a compressed space so as to make a full bore exercise of unpacking it a a major exercise. Let’s deal with just this part, which is a neat one-two effort to tell us no one need safety nets like Social Security because even people making minimum wage can be rich: The welfare state isn’t a very good buy. The average Social Security benefit runs just over $1,100 a month—peanuts, hardly enough to keep you in cut-rate butter once your median rent of more than $800 has been paid. For that, you’re taxed 12 percent of your take-home pay. Compare that to this: A married couple, each earning the minimum wage, investing only 10 percent of their earnings at a modest 7 percent return, retires with an annual income of more than $100,000 a year—even if they never touch the $1.5 million principle they’ll leave to their children. President George W. Bush was mocked for calling his proposal to cultivate such minimum-wage millionaires the “Ownership Society,” but it was the most important initiative of his presidency. Erm, the worst is I get the strong impression Williamson believes every bloomin’ word he wrote. I gather no one told him the global financial crisis was the culmination of the ownership society, which was purchased with minimal equity and cheap leverage. Let’s start with the most obvious reason why Williamson’s little tale of minimum wage people retiring as millionaires is observed about as often in the real world as unicorns: his fantasy expectation that they save 10% of their incomes. The savings rate for Americans as a whole hasn’t been over 10% since 1984. It is currently 3.5%.
Medicaid clients in Colorado at "all-time historical high" in November - Nearly 615,000 Coloradans were on Medicaid in November, by far a record high, officials said Wednesday, attributing the vast bulk of the growth to economic hard times rather than recent eligibility expansions. "We've had a mushrooming of clients," Sue Birch, director of the state Department of Health Care Policy and Financing, told members of the legislature's Joint Budget Committee. Birch said the 614,146 Coloradans enrolled in Medicaid in November represented a 57.7 percent increase over January 2007. "This is an all-time historical high," she said. Added to the 71,988 children and pregnant women covered under the state's CHP+ program — a 42 percent increase over January 2007 — it means roughly 13 percent of all Coloradans are covered by state health-insurance programs.
Medicaid shortfall grows with no fix in sight - The funding shortfall in North Carolina's Medicaid program has ballooned to $150 million, and the political fight over how to fill the growing budget hole shows no signs of a solution. Health and Human Services Secretary Lanier Cansler says the Medicaid program, which serves more than 1 million people statewide, won't be able to achieve more than $350 million in cuts mandated by the state budget under its current operations. Cansler says the budget offers him only one option to accomplish the required savings: deep cuts to optional services and to the reimbursement rates the state pays Medicaid providers. The federal government has approved fewer than half of the 54 rate cuts DHHS has proposed, he told lawmakers on Tuesday, which cuts into the projected savings they counted on in the budget. "If we don't find a way to solve the problem come May, it's going to be extremely serious because, again, we can't write Medicaid checks if we don't have the money," he said. Increased demand for services and overpayments DHHS made to providers aggravated the shortfall, which officials said could grow to $243 million by the 2012-13 fiscal year, which starts in July.
State pushes prescription painkiller methadone, saving millions but costing lives - For the past eight years Washington has steered people with state-subsidized health care — Medicaid patients, injured workers and state employees — to methadone, a narcotic with two notable characteristics. The drug is cheap. The drug is unpredictable. The state highlights the former and downplays the latter, cutting its costs while refusing to own up to the consequences, according to a Seattle Times investigation that includes computerized analysis of death certificates, hospitalization records and poverty data.
Medicare Debate in 2012 Is All About Baby Boomers - Baby boomers take note: Medicare as your parents have known it is headed for big changes no matter who wins the White House in 2012. You may not like it, but you might have to accept it. Dial down the partisan rhetoric and surprising similarities emerge from competing policy prescriptions by President Barack Obama and leading Republicans such as Wisconsin Rep. Paul Ryan. Limit the overall growth of Medicare spending? It's in both approaches. Squeeze more money from upper-income retirees and some in the middle-class? Ditto. Raise the eligibility age? That too, if the deal is right. With more than 1.5 million baby boomers a year signing up for Medicare, the program's future is one of the most important economic issues for anyone now 50 or older. Health care costs are the most unpredictable part of retirement, and Medicare remains an exceptional deal for retirees, who can reap benefits worth far more than the payroll taxes they paid in during their careers. "People would like to have what they used to have. What they don't seem to understand is that it's already changed,"
Patients rush to use up health benefits - While many people are spending the last week of the year hitting after-Christmas sales, Sue Sners has other ways to save money. A mammogram on Wednesday. Hand surgery on Friday. Across the country, people are squeezing as many healthcare appointments as possible into 2011 — colonoscopies, mammograms, root canals. Some people need to take advantage of their current insurance coverage before their employer switches plans. Others hurry to spend money in a flexible spending account, which might otherwise be lost when the ball drops at Times Square. And those who have met their deductibles, or even their out-of-pocket yearly maximums, can get relative bargains by expediting care that they need anyway. Sners, 55, has met her $1,000 annual healthcare deductible, so her insurance provider will pick up much of her costs. "Everything's so expensive now, and people are trying to save wherever you can," she said. Consumers' knowledge of insurance deductibles and flex accounts has improved, and they are trying to use that knowledge to their advantage.
Uninsured turn to daily deal sites for health care - The last time Mark Stella went to the dentist he didn't need an insurance card. Instead, he pulled out a Groupon. Stella, a small business owner, canceled his health insurance plan more than three years ago when his premium rose to more than $400 a month. He considered himself healthy and decided that he was wasting money on something that he rarely used. Daily deal sites like Groupon and LivingSocial are best known for offering limited-time discounts on a variety of discretionary goods and services including restaurant meals, wine tastings, spa visits and hotel stays. The sites are increasingly moving beyond little luxuries like facials and vacations and offering deals that are helping some people fill holes in their health insurance coverage. Visitors to these sites are finding a growing number of markdowns on health care services such as teeth cleanings, eye exams, chiropractic care and even medical checkups. They're also offering deals on elective procedures not commonly covered by health insurers, such as wrinkle-reducing Botox injections and vision-correcting Lasik eye surgery. About one out of every 11 deals offered online is for a health care service, according to data compiled by DealRadar.com, a site that gathers and lists 20,000 deals a day from different websites.
For some in need, Facebook is route to new kidney - Here's another reason for holdouts to join the social media site Facebook: It's a great place to find a kidney. Between the children's photos and reminiscences about high school, more and more pleas for help from people with failing kidneys are popping up. Facebook and other social media sites are quickly becoming a go-to place to find a generous person with a kidney to spare, according to the people asking for help and some national organizations that facilitate matches. Damon Brown found a kidney on Facebook after telling his story on a special page the Seattle dad created under the name, "Damon Kidney." His friends and family forwarded the link to everyone they knew and on Jan. 3 a woman his wife has known for years, but not someone they consider a close family friend, will be giving him a kidney. Brown's story is not unique, said April Paschke, a spokeswoman for the United Network for Organ Sharing, a private nonprofit organization that manages the nation's organ transplant system for the federal government. "We see more and more people matched up by social media," she said. "It's an extension of the way we communicate. Before we found the Internet, people found other ways: through a church bulletin, word of mouth or an advertisement even."
Doctors Support Occupy Wall Street Because Wall Street Is Occupying Health Care - Physicians for a National Health Program We support Occupy Wall Street because the private health insurance industry exemplifies the OWS movement’s central tenet: its unchecked corporate greed tramples human need. We support OWS because economic and social inequalities make our patients sick. Low wages, high unemployment, inadequate education, unhealthy food, unaffordable housing, unsafe jobs, a polluted environment, and a lack of access to affordable health care breed death and disability. We support OWS because health care is a human right. We reject a system that forces us to treat patients differently based on their insurance and the treatments they can “afford.” We support OWS because we believe in evidence, and evidence shows us that profit-driven health care decreases access, raises costs and lowers quality. It’s unhealthy for the 99%; only a few corporate executives, bankers, and lobbyists benefit. We support OWS because our political leaders, held hostage by corporate money, reject evidence-based health policies such as a single-payer reform that would save both lives and money. We support OWS because the health care economy – like the overall economy – has ample resources to take care of 100%, but those resources are siphoned off by profit-driven corporations in the interest of the 1%. We support OWS because we took an oath to do no harm, and our corrupt political and economic systems are harming us all. We support OWS because we are hopeful that we can change our society. Join us!
Prescription drug shortage crisis hits hard - When Jenny Morrill, who has been battling ovarian cancer since 2007, went to the hospital for her scheduled chemotherapy treatment in June, the nurse greeted her with both good news and bad. "She said, 'The good news is that you're doing really well on this drug Doxil. The bad news is that we have no Doxil to give you,' " Morrill, a mother and a former arts administrator who lives near Kingston, N.Y., is one of thousands of patients with ovarian cancer, multiple myeloma, AIDS-related Kaposi's sarcoma or other cancers who were left in the lurch last summer when supplies of Doxil, a chemotherapy drug less toxic than many comparable agents, ran out because of production problems at the only plant that made it. In recent years, about 7,000 patients in the United States were using the drug at any given time. But by November, the factory had shut down completely. The shortage has disrupted treatment plans and has upset patients. "A lot of things can go wrong when you're in cancer treatment - your white count can go down, you can become too frail to get treatment, the chemo can stop working. One of the things you never consider is that treatment might just not be available,"
Medication Shortages Surge To Record In 2011 — The number of new prescription drug shortages in 2011 shot up to 267, well above the prior record and about four times the number of medication shortages in the middle of the last decade. As the drug shortages worsen, so does their impact on patient care, particularly in hospitals. The inability to get crucial medicines has disrupted chemotherapy, surgery and care for patients with infections and pain. At least 15 deaths since 2010 have been blamed on the shortages, which have set a record high in each of the last five years. "At the beginning of the year, we were on a pace of about a shortage every day," She noted the Food and Drug Administration has said it has prevented more than 100 new shortages in 2011. That's partly because of an executive order President Obama issued on Oct. 31 to address the shortages, with provisions requiring more manufacturers to report potential shortages in advance to the FDA. But Fox is still worried because many of the current shortages won't be resolved anytime soon, based on reports from several key manufacturers that have had to shut down production because of contamination or other quality problems. For some medicines, there may be only one other manufacturer, which doesn't have the capacity to fill the gap immediately or completely.
FDA Gives Up on Antibiotic Restrictions in Livestock - The Food and Drug Administration (FDA) pulled a Scrooge move just before Christmas. The agency published an entry in the Federal Register declaring that it will end its attempt at mandatory restrictions on the use of antibiotics in animal agriculture. The agency isn’t advertising the shift, though: This news would have remained a secret if not for Maryn McKenna’s Superbug blog over at Wired. McKenna, who specializes in writing about antibiotics and their link to pathogens, caught the Federal Register notice. McKenna created an excellent timeline that traces the history of the issue back to the 1950s. In 2009, the Obama administration breathed new life into a moribund process because the top two Obama appointees at the FDA, Commissioner Margaret Hamburg and her then-deputy Joshua Sharfstein, strongly supported restricting antibiotic use in agriculture. But despite Hamburg and Sharfstein’s many supportive statements, the FDA has only produced a draft set of “voluntary” guidelines. And, with this latest announcement, it looks like that’s as far as they’re willing to go. Inaction has consequences: According to the vast majority of microbiologists and public health experts, restrictions on agricultural uses are key to preserving the effectiveness of antibiotics as well as to preventing the spread of antibiotic-resistant bacteria like MRSA and salmonella Heidelberg (cause of last summer’s record-breaking ground turkey recall). And it’s no small dosage: Every year 29 million pounds of antibiotics are given to animals — often via their feed. That figure represents 80 percent of all antibiotics used in the U.S.
Eaters, beware: Walmart is taking over our food system | Walmart’s greenwash: Why the retail giant is still unsustainable - Aubretia Edick has worked at a Walmart store in upstate New York for 11 years, but she won't buy fresh food there. Bagged salads, she claims, are often past their sell-by dates and, in the summer, fruit is sometimes kept on shelves until it rots. "They say, 'We'll take care of it,' but they don't. As a cashier, you hear a lot of people complain," she said. Edick blames the problems on the store's chronic understaffing and Walmart's lack of respect for the skilled labor needed to handle the nation's food supply. At her store, a former maintenance person was made produce manager. He's often diverted to other tasks. "If the toilets get backed up, they call him," she said. Tracie McMillan, who did a stint working in the produce section of a Walmart store while researching her forthcoming book, The American Way of Eating, reports much the same. "They put a 20-year-old from electronics in charge of the produce department. He didn't know anything about food," she said. "We had a leak in the cooler that didn't get fixed for a month and all this moldy food was going out on the floor." Walmart doesn't accept the idea that "a supermarket takes any skill to run," she said. "They treated the produce like any other kind of merchandise."
Heat, Humidity and Crop Yields - If you haven't been following, I've written a lot about the strong and robust association between extreme heat and crop yields. This puzzles some crop scientists who focus on soil moisture and precipitation as the key impediments to higher yields. But in comparison to any precipitation or soil moisture variable we've constructed, extreme heat, measured as degree days above 29C, is a far better predictor of yield. And the underlying relationship is similar across widely varying climates and whether identified over the cross section (comparing average yields with average climates over locations) or the time series (comparing yields over time in a fixed location with different weather outcomes). Such a robust and pervasive pattern in observational data is extremely rare. Most of the hard work is in constructing fine-scale measures VPD and degree day measures, including our measure of extreme heat. Since these measures are nonlinear in temperature, accurate measurement requires daily measures of minimums and maximums on a fine geographic scale that is matched with the locations where crops are grown. This involves tedious cleaning of weather station data and a combination of statistical techniques and a climate model to interpolate weather outcomes between weather stations. Once we estimate VDP, precipitation and temperature measures on a fine scale, we then aggregate, weighting each fine-scale grid by the crop area. State-level plots over time are shown below (click for a larger view).
Shortage of Seed Could Hamper US Corn Crop - Last year’s volatility in the corn market could repeat itself this year, but for a different reason. Seed corn, which is grown from specialized plants, is in short supply due to dry conditions in the Midwest and West last summer. Seed suppliers like Monsanto Co. (NYSE: MON) and E.I du Pont de Nemours and Co. (NYSE: DD), as well as food processors such as General Mills Inc. (NYSE: GIS), Kellogg Co. (NYSE: K), and Kraft Foods Inc. (NYSE: KFT) could all feel the pinch, if for different reasons. The Wall Street Journal cites a trader who says: Corn prices slumped in the second half as the fall harvest replenished supplies. But in the past three weeks, corn futures prices have been on the rise, jumping 14% in the past three weeks. While much of that has been on the back of fears of lower-than-expected production in South America because of drought, the prospect of falling corn seed could propel prices even further. Corn prices, currently around $6.50/bushel, could rise as high as $10/bushel if the seed is indeed in short supply.
Bugs may be resistant to genetically modified corn - One of the nation's most widely planted crops — a genetically engineered corn plant that makes its own insecticide — may be losing its effectiveness because a major pest appears to be developing resistance more quickly than scientists expected.The U.S. food supply is not in any immediate danger because the problem remains isolated. But scientists fear potentially risky farming practices could be blunting the hybrid's sophisticated weaponry. When it was introduced in 2003, so-called Bt corn seemed like the answer to farmers' dreams: It would allow growers to bring in bountiful harvests using fewer chemicals because the corn naturally produces a toxin that poisons western corn rootworms. The hybrid was such a swift success that it and similar varieties now account for 65 percent of all U.S. corn acres — grain that ends up in thousands of everyday foods such as cereal, sweeteners and cooking oil. But over the last few summers, rootworms have feasted on the roots of Bt corn in parts of four Midwestern states, suggesting that some of the insects are becoming resistant to the crop's pest-fighting powers. Scientists say the problem could be partly the result of farmers who've planted Bt corn year after year in the same fields.
“Zombie” Fly Parasite Killing Honeybees - A heap of dead bees was supposed to become food for a newly captured praying mantis. Instead, the pile ended up revealing a previously unrecognized suspect in colony collapse disorder a mysterious condition that for several years has been causing declines in U.S. honeybee populations, which are needed to pollinate many important crops. This new potential culprit is a bizarre and potentially devastating parasitic fly that has been taking over the bodies of honeybees (Apis mellifera) in Northern California. John Hafernik, a biology professor at San Francisco State University, had collected some belly-up bees from the ground underneath lights around the University’s biology building. “But being an absent-minded professor,” he noted in a prepared statement, “I left them in a vial on my desk and forgot about them.” He soon got a shock. “The next time I looked at the vial, there were all these fly pupae surrounding the bees,” he said. A fly (Apocephalus borealis) had inserted its eggs into the bees, using their bodies as a home for its developing larvae. And the invaders had somehow led the bees from their hives to their deaths. A detailed description of the newly documented relationship was published online Tuesday in PLoS ONE.
The Honeybee Decline Story: Neonicotinoid and Spinosads Insecticides which Harm Honeybee Central Nervous Systems - If Germany, France, Italy, and Slovenia have banned Clothianidin, a pesticide which harms the central nervous system of insects and is known by the EPA to significantly harm the honeybee, why is it not banned here in the United States? One can't help but be confused by the multitude of headlines over these past several years which have claimed to know (or not know) the cause of Colony Collapse Disorder, or CCD. Luckily, I have a friend here in Boulder who raises bees and is connected to other beekeepers and real world experts who are carefully watching the honeybee decline story. They believe that a new Purdue study is very important and significant, which implicates the insecticide class of neonicotinoids: Multiple Routes of Pesticide Exposure for Honey Bees Living Near Agricultural Fields. When you visit Wikipedia's neonicotinoid page, it begins, "Neonicotinoids are a class of insecticides which act on the central nervous system of insects with lower toxicity to mammals. Neonicotinoids are among the most widely used insecticides worldwide, but recently the uses of some members of this class have been restricted in some countries due to a possible connection to honey-bee colony collapse disorder, though no scientific evidence has been established confirming that connection." Wikipedia needs to update their page, since scientific evidence certainly has been established with this Purdue study and had already been well-established by this 2010 EPA (PDF) leaked document.
Fifteen Years After Their Reintroduction, Wolves are Being Slaughtered Again - In doing this blog, I've become pretty numb to bad news. But sometimes, I'll read a story that depresses me so badly that I just want to stop the world so I can get off. As reported by the Los Angeles Times, the politically motivated slaughter of wolves has resumed in the very same states where their reintroduction was widely celebrated just a decade-and-a-half ago: Congress removed wolves in Montana and Idaho from the protection of the Endangered Species Act in April. And this fall, the killing began. As of Wednesday, the Idaho Department of Fish and Game reported that 154 of its estimated 750 wolves had been "harvested" this year. Legal hunting and trapping — with both snares to strangle and leg traps to capture — will continue through the spring. And if hunting fails to reduce the wolf population sufficiently — to less than 150 wolves — the state says it will use airborne shooters to eliminate more. In Montana, hunters will be allowed to kill up to 220 wolves this season (or about 40% of the state's roughly 550 wolves). To date, hunters have taken only about 100 wolves, prompting the state to extend the hunting season until the end of January. David Allen, president of the powerful Rocky Mountain Elk Foundation, has said he is urging the state to follow Idaho's lead and "prepare for more aggressive wolf control methods, perhaps as early as summer 2012."
A Punch to the Mouth: Food Price Volatility Hits the World - 2011 was an abysmal year for the global insurance industry, which had to cover yet another enormous increase in damages from natural disasters. Unknown to most casual observers is the fact that during the past few decades the frequency of weather-related disasters (floods, fires, storms) has been growing at a much faster pace than geological disasters (such as earthquakes). This spread between the two types of insurable losses has moved so strongly that it prompted Munich Re to note in a late 2010 letter that weather-related disasters due to wind have doubled and flooding events have tripled in frequency since 1980. The world now has to contend with a much higher degree of risk from weather and climate volatility, and this has broad-reaching implications. And critically, it has a particular impact on food. Many factors seen over the past decade have produced higher food prices: population growth, urbanization, the decline of arable land per person, and the upgrading of diets for example. But more damaging than food inflation has been the pushing of global food prices out of their long, quiet envelope of stability. From the recently released UN Report on the World Food Situation:
East Africa famine: Somali prime minister denies food shortage - The United Nations says that 250,000 Somalis are suffering from famine in three regions including Mogadishu, a fact that Abdiweli Mohammed Ali, who leads Somalia’s officially recognised government, has denied. "I don’t believe there’s a famine in Mogadishu. Absolutely no," he told The Daily Telegraph. "You know the aid agencies became an entrenched interest group and they say all kind of things that they want to say.” Mr Ali leads a government that depends almost completely on outside donations. Our reporter visited a UN feeding centre in the city, where he found hundreds of starving women with their children seeking food.
Buy local or don't buy at all? - Elisabeth Rosenthal at the NYTimes: But even as more Americans buy foods with the organic label, the products are increasingly removed from the traditional organic ideal: produce that is not only free of chemicals and pesticides but also grown locally on small farms in a way that protects the environment. The explosive growth in the commercial cultivation of organic tomatoes here, for example, is putting stress on the water table. In some areas, wells have run dry this year, meaning that small subsistence farmers cannot grow crops. And the organic tomatoes end up in an energy-intensive global distribution chain that takes them as far as New York and Dubai, United Arab Emirates, producing significant emissions that contribute to global warming. From now until spring, farms from Mexico to Chile to Argentina that grow organic food for the United States market are enjoying their busiest season. And here is the follow-up question from at the blog formerly known as Green, Inc: I know that food miles – the carbon dioxide emissions produced by food transport – constitute only a small fraction of the total emissions related to food production. Still, for me, there’s a bit of cognitive dissonance in eating an organic tomato that was grown in a desert and then flown 3,000 miles so I can feel good about eating “natural” foods.
Satellite Studies Reveal Groundwater Depletion - With a world population estimated at just shy of 7 billion and growing, the UN Food and Agriculture Organization says agricultural production will need to increase 70% by 2050. As agriculture takes up most of human water use, that’s going to put vastly greater demands and strains on our water resources at a time when climate change is changing temperature and precipitation levels and patterns in ways that cannot be predicted at local levels but are likely to make this even more difficult to achieve. One thing that has been determined is that groundwater levels have dropped in many places around the world in the past nine years, including across key agricultural areas, such as southern Argentina, western Australia and the western US, according to a pair of studies of satellite gravity monitoring data conducted by researchers at the University of California Center for Hydrologic Modeling in Irvine, Science News reports. Groundwater depletion is especially pronounced beneath parts of California, India, the Middle East and China. Besides showing that water is being pumped out of underground groundwater aquifers faster than it’s being replenished, the results raise concerns that farming in particular is the primary cause, according to the Science News report. The Gravity Recovery and Climate Experiment (GRACE), conducted jointly by NASA and the German Aerospace Center, has been taking monthly snapshots of global groundwater used in the two studies since 2002. GRACE data is especially useful in accumulating data across countries where governments do not maintain extensive networks of groundwater monitoring wells. While the US maintains an extensive nationwide network of such wells, countries, such as China, do not.
Current US Drought Map - To strengthen my (and hopefully your) intuition for the Palmer Drought Severity Index I'm going to try and post the current US map on a monthly basis. For more background on the Palmer Index see this post. The map for the week through Dec 31 is shown above. You can see that most of Texas is still in the grips of an extreme drought and a lot of the southeast is also pretty badly off. This continues a pattern that lasted through most of last year in which a lot of the southern half of the country was very dry while the northern half was unusually soggy. However, the southern droughts are not as extensive now as they were at their height in August. You can see a nice animation of the monthly PDSI for the whole of 2011 at NOAA's site. You can also construct longer movies of any portion of the twentieth century you'd like to watch - for example here's one of the dust bowl years. We still haven't managed to create anything that bad (in general most of the US has been trending wetter not drier under global warming) .
Can the 2012 Farm Bill protect the Ogallala Aquifer? - To look at the pale-green buffalo grass that covered the High Plains, you would never suspect that an aquifer holding as much water as Lake Huron lay beneath. By the time we sold our farm in 2006, Plains farmers were pumping 6 trillion gallons. That's 1.5 trillion more than the Colorado River carries to the Southwestern United States. The Ogallala Aquifer sits below 174,000 square miles of crop and rangeland from South Dakota to Texas.The Ogallala Aquifer is vast. It underlies portions of eight large states -- 174,000 square miles of crop and rangeland all the way from South Dakota to Texas. But it is also invisible. So it's not surprising that until the debate over the Keystone XL pipeline erupted, few people had ever heard of it. Then for several months, its melodious name was broadcast all over the national news. Now that the aquifer is safe from the pipeline (for the time being), there's another risk worth examining: industrial agriculture. Nebraska landowners stepped up to protect the Ogallala from potential pipeline spills. Now they should do their damndest to stop the overpumping and nonpoint-source pollution that have already made parts of it unusable. If it is not protected, then many parts of the aquifer will either run dry or be too polluted to use by the end of this century. This is especially frightening because it would take thousands of years for the Ogallala to replenish itself.
Why are we Depleting and Polluting the Ogallala Aquifer to Manufacture Ethanol? - I would like to point readers to Grist today, where my friend Julene Bair has written another excellent article, "Can the 2012 Farm Bill protect the Ogallala Aquifer?" In it, she goes after one of the subjects which upsets me most, that of Nebraska corn farmers using precious ancient aquifer water to make corn ethanol to burn in our gas guzzling SUV tanks, lawn mowers, 4-wheelers, snowmobiles, F-150s, and H2s. Aquifer water is next-to-free for farmers wishing to irrigate. Once they pay for their pivot systems, they need to pay for electricity to pump the water, the deeper the more expensive their pumping costs, which does affect their profit margin. Lucky for these Nebraska farmers, electricity is relatively cheap in Nebraska due to large coal burning power plants and two nuclear facilities (remember - the ones that flooded last spring), making Nebraska an electricity exporter, and attracting power-thirsty businesses such as Google to the banks of the Missouri River. Logic? Not so much. Engineers speak of the EROEI (energy returned on energy invested) of corn ethanol. It is already low enough (.8-1.3) that it doesn't make up for the environmental damage which it causes, but once you throw irrigated corn into the calculation, there is virtually NO energy returned and quite likely there is net energy lost. This means that the electricity made from coal, natural gas, or diesel which is used to irrigate the corn would best be used directly to power vehicles and we'd save the aquifer and the land degradation involved, too.
After Three Decades, Federal Tax Credit for Ethanol Expires… A federal tax credit for ethanol expired on Saturday, ending an era in which the federal government provided more than $20 billion in subsidies for use of the product. The tax break, created more than 30 years ago, had long seemed untouchable. But in the last year, during which Congress was preoccupied with deficits and debt, it became a symbol of corporate welfare. Fiscal conservatives joined liberal environmentalists to kill it, with help from a diverse coalition of outside groups. In the United States, most ethanol is produced from corn. The demise of the subsidy is all the more remarkable because it comes at the peak of the political season in Iowa, where corn is king. Mr. Taylor, who grows corn and soybeans in Prairie City, Iowa, east of Des Moines, said in an interview that the loss of the tax credit “will reduce the profit margin for a lot of people in the ethanol business.” But, he added, “It won’t be fatal as long as the demand for ethanol and gasoline remains strong.” Nearly 40 percent of the United States corn crop goes to ethanol and byproducts, including animal feed.
$6 billion-a-year ethanol subsidy dies -- but wait there's more - America's corn farmers have been benefiting from annual federal subsidies of around $6 billion in recent years, all in the name of ethanol used as an additive for the nation's vehicles. That ends on Jan. 1, when the companies making ethanol will lose a tax credit of 46 cents per gallon, and even the ethanol industry is OK with it -- thanks in part to high oil prices that make ethanol competitive. Ethanol output and exports reached record highs this year, and a federal law assures ethanol a longer-term share of the motor fuel market. "Like all incentives it was put in place to help build an industry and when successful, it should sunset," the Renewable Fuels Association said in a statement last week. What the industry doesn’t want to see, however, is an end to a separate tax credit for ethanol made not from corn but non-foodstuffs like switchgrass, wood chips and even the leaves and stalks of corn. Known as cellulosic ethanol, no one is selling it just yet due to its higher R&D and production costs. But the industry hopes to soon, and the production tax credit is up to $1.01 per gallon.
EPA boosts production goal for advanced, cellulosic biofuels by more than a third: The U.S. Environmental Protection Agency (EPA) boosted its 2012 goals for production of non-corn-based biofuels by about 36 percent, reflecting the federal government's efforts to both cut its dependency on foreign oil and find alternatives to corn- and alcohol-based fuels. The EPA boosted its production goal for advanced biofuels, whose feedstocks range from sugarcane ethanol to algae, by 48 percent, while increasing its goal for cellulosic biofuels, or biofuels produced from grasses, wood and plants, by 34 percent. Production of biomass-based biodiesel is set to rise 25 percent next year, according to the EPA. The EPA also reiterated its goal set in June to boost renewable fuel production next year by 9 percent to 15.2 billion gallons, or 9.2 percent of total fuel production. Those numbers are up from the 13.95 billion gallons, or 8 percent of the fuel-production total, that the EPA set for 2011. Annual increases in the EPA's renewable-fuel production guidelines are in response to the Renewable Fuel Standard 2 (RFS2) and 2007's Energy Independence and Security Act (EISA), which in part set a U.S. production goal of 36 billion annual gallons of renewable fuel by 2022.
Ethanol Subsidies: Not Gone, Just Hidden a Little Better - A few years ago I called subsidies for corn ethanol "catastrophically idiotic." And why not? Corn ethanol, it turns out is actively worse for the environment than even gasoline, farmers responded to the subsidies by reducing the amount of farmland used for food production, and this drove up the price of staple food worldwide. What's more, back when the subsidies were enacted corn farmers were already doing pretty well. We were shoveling $10 billion in ag welfare to a group of people who were already pretty rich. But guess what? At the end of last year, ethanol subsidies quietly expired and no one tried to extend them. On the campaign trail, ethanol subsidies became invisible. It was like a tiny miracle. It turns out that corn farmers really don't care about ethanol subsidies all that much anymore, but there's a reason for that. Here is our own Tom Philpott writing in February 2010: After a flirtation with reason last spring, the Obama EPA has signed off on the absurd, abysmal Renewable Fuel Standard established under Bush a couple of years ago — ensuring that farmers will continue to devote vast swaths of land to GHG-intensive corn, of which huge portion will ultimately be set aflame to power cars — but not before being transformed into liquid fuel in an energy-intensive process.
Malaya: Emerging war: Food vs fuel - IF the problems in the United States spill over to the Philippines, the country may suffer from a severe food shortage although regulators say there is a law that prevents the possibility. The United States is agonizing over which gets preference: more food or cheap fuel. Unfortunately, the bulk of the fuel substitute comes from food. The Department of Energy has repeatedly said there is complete compliance with the 10 percent mandatory use of ethanol mixed with gasoline for engine fuel. On the other hand, the Department of Agriculture said there are about 400,000 hectares available for sugarcane plantation exclusively for ethanol. It explained that cane for ethanol grows on any kind of soil. It matters not if the sugar yield is low. If used to produce ethanol, no sugar is produced from the cane.
Chinese Government Plans to Cause Ten Percent More Rain By 2015 - China is already doing plenty of things to the atmosphere above it, but most changes are byproducts of the country’s marathon industrial revolution. Now China plans to make some purposeful atmospheric changes — namely making it rain, for the purpose of growing crops. China is starting four regional programs to artificially increase precipitation across the country by 10 percent before 2015, under a newly released 12th Five-Year Plan (2011-2015), according to the state-run China Daily. “Weather intervention” could bring an additional 230 billion cubic meters of precipitation per year — that’s on top of the 50 billion China already artificially creates annually, China Daily says. “Because clouds are boundless, weather control is boundless. The five regional weather control programs will coordinate the ground resources, such as the cloud seeding rockets and planes, across provinces to increase potential rain or snow,” said Zheng Jiangping, deputy director of the China Meteorological Administration’s department of emergency response. Cloud seeding, involving the injection of silver iodide particles into the atmosphere, helped clear some of the pollution from Beijing before the 2008 Olympics. But it does not always go so well. This time, cloud seeding is necessary to make actual rain, authorities said.
South Asia’s smog ‘getting worse’ - BBC - A rapid rise in air pollution from fossil fuels and biomass burning has worsened winter smog and extended its duration in many parts of South Asia, scientists and officials have said. In Bangladesh, India and Nepal the temperature has plummeted and clouds of fog and smoke hang in the sky blocking sunlight for several days. Normal lives have been affected with many flights diverted and suspended and trains delayed because of low visibility. Experts say they have noticed that the intensity of smog has grown in the Indo-Gangetic plains in the last few years, leading to increased impacts. "Since 1990 onwards, there has been increase in the number of [smog-affected] days in northern India," says BP Yadav, director of the Indian Meteorological Department. "It is not a linear trend showing an increase every year. There are, of course, year-to-year fluctuations. "But there are more years that have seen dense fogs." Nepal's Department of Hydrology and Meteorology director-general Keshav Prasad Sharma agrees the issue of smog is becoming increasingly serious in the plains in southern Nepal bordering India.
Acid rain’s blind spot - University of Michigan researchers say future generations of sugar maple trees are at risk unless soft spots in the federal Clean Air Act are strengthened to address an old nemesis: acid rain. Precipitation that is highly acidic from burned fossil fuels has been largely under control since the early 1990s. In 1989, the federal government adopted a system to control acid rain through large reductions of sulfur dioxide. Electricity-producing coal-fired power plants were allowed to meet tougher limits through swaps of so-called emission credits. Industrial leaders and environmentalists agree that cap-and-trade has worked well for acid rain. But it isn’t suitable for all forms of pollution. In particular, it wasn’t designed to address nitrogen.
Deforestation and Greenhouse Gases - CBO Director's Blog - The destruction and degradation of forestland, caused mainly by expanded agricultural activity in tropical developing countries, currently accounts for roughly 12 percent of global greenhouse gas (GHG) emissions. Slowing or halting deforestation in developing countries is a potentially low-cost way to help reduce global GHG emissions. For that potential to be realized, however, substantial challenges would need to be addressed. A CBO study, prepared at the request of the Chairman of the Senate Committee on Foreign Relations, examines those challenges and assesses policy approaches for reducing forest-based emissions. To provide a handy summary of the most pertinent points of today’s study, CBO published an infographic on deforestation and greenhouse gases—the fourth in CBO’s ongoing series of infographics. If actions to support forest preservation are to play a cost-effective role in a significant international effort to reduce global GHG emissions, three broad challenges would have to be met:
- Obtaining useful measurements of changes in the amount of carbon stored in forests,
- Structuring incentives to reduce total forest-based emissions, and
- Improving governance in developing countries.
Job-Killing’ EPA Regulations for Chesapeake Bay Will Create 35 Times as Many Jobs as Keystone XL Pipeline - If rhetoric from the Republican Presidential candidates is to be believed, the Environmental Protection Agency is “a tool to crush the private enterprise system” (Mitt Romney), “a cemetery for jobs” (Rick Perry), and “should be re-named the job-killing organization of America” (Michele Bachmann). But it’s a safe bet the tens of thousands of people who may soon find jobs implementing EPA regulations aimed at cleaning up the Chesapeake Bay would disagree with those assertions. A new report released today by the Chesapeake Bay Foundation highlights the job creation numbers — 240,000 full-time jobs — expected to come from achieving new pollution goals set by the EPA’s “Total Maximum Daily Load” restrictions. Finalized in December 2010, these rules require a 25 percent reduction of pollution flowing into the Bay by 2025 and have already spurred state and federal investment in stormwater mitigation projects, upgrades at sewage treatment facilities, addition of power plant smokestack scrubbers, and improvements to management of agricultural runoff and livestock waste management. The Bay’s watershed covers more than 64,000 square miles including all of Maryland and the District of Colombia, large areas of Virginia and Pennsylvania, and portions of Delaware, New York, and West Virginia. Therefore infrastructure projects to reduce pollution will encompass a massive region and provide a major boost to the economy.
Dead herring mystery for Norway as thousands wash up on beach - Norwegians have been left puzzled at the sight of thousands of dead herring carpeting a beach in the northerly district of Nordreisa with some wondering if a predator had driven them to their death or a storm had washed them ashore. Scientists were hoping to test the fish to see if they could ascertain the cause of death. Locals had more pressing concerns: how to clean up the 20 tonnes of dead creatures before they decay. For doom-mongers, the fish were the second a sign in as many days that 2012 would live up to the apocalyptic prediction of the ancient Mayans, after hundreds of blackbirds reportedly dropped dead in Arkansas.
Rain Forest for Ransom —Yasuni National Park — a 10,000-sq-km reserve on the western fringes of the Amazon basin — is indeed a paradise, considered by many scientists to be the single most biodiverse spot on the planet. But it's a paradise in danger of being lost. Oil companies have found rich deposits beneath the park's trees and rivers, nearly 900 million barrels of crude worth billions of dollars. That's money that Ecuador — a small South American country in which a third of the population lives below the poverty line and petroleum already accounts for more than half its export revenue — badly needs, money that oil companies and consumers will be only too happy to provide if drilling is allowed to go forward. If Ecuador follows the usual path of development, that's exactly what will happen — with disastrous consequences for the park. "Yasuni is a truly unique place in the world," says Gorky Villa, an Ecuadorian botanist who works with the conservation group Finding Species. "Our concern is that it will be ruined before we can even understand it." But there may be another way. Ecuadorian President Rafael Correa has told the international community that his country would be willing to forgo drilling and leave Yasuni largely intact in exchange for donations equal to $3.6 billion over 13 years, or about half the expected market value of the park's oil deposits.
Year 2011 Extreme Weather in Photos - The headlines of 2011 were driven by global warming disasters and the popular uprising against the powers-that-be who have accumulated profit at the expense of the future of humanity. The United States faced the most billion-dollar climate disasters ever, with 14 distinct disasters costing at least $53 billion to the U.S. economy. Stymied by the election of the science-denying Tea Party Congress, the Obama administration failed to pass climate pollution or oil and coal safety legislation in response to the disasters of 2010. The administration fought back attacks on investment in renewable energy and stopped the rush to build the Keystone XL tar sands pipeline, spurred by mass protests.
‘Like being on steroids’: PBS links extreme weather to climate - Mainstream news outlets spent a lot of time in 2011 covering the record-breaking year for extreme weather in the U.S. But only a few of them spent much time exploring the link between those events and global warming. So PBS deserves a special mention for a segment that aired last week looking at how global warming is influencing extreme weather events. As Jeff Masters, co-founder of the Weather Underground, explained in the piece: "They all tend to get increased when you have this extra energy in the atmosphere. I call it being on steroids ... for the atmosphere." Watch the full segment:
Why tornadoes take the weekend off - Tornadoes and hailstorms may take the weekends off during the muggy summer months, according to a new study that reveals new ways human activity can inadvertently sway weather. Scientists analyzed summertime storm activity in the eastern U.S. from 1995 to 2009 using data collected by the National Oceanic and Atmospheric Administration's Storm Prediction Center. They discovered that tornadoes and hailstorms occurred at a rate of about 20 percent above average during the middle of the week. In contrast, the phenomena occurred at a rate of roughly 20 percent below average on the weekend. The findings proved statistically significant—not just a random pattern—and matched up well with similar cycles seen in other kinds of storms, the study authors say. The team then investigated Environmental Protection Agency air-quality monitoring data and noted that human-made, summertime air pollution over the eastern U.S. peaks midweek. The cycle is linked to more human-made pollution created during the five-day workweek, such as commuters driving to and from work.
Lots More Killer Summers on the Way - In discussion on yesterday's post, commenter Chris R. pointed me to another recent Hansen paper (with coauthors M. Sato and R. Ruedy) Climate Variability and Climate Change: The New Climate Dice. I will explain the thrust of the paper by focussing on this part of Figure 4: I imagine most of my readers are educated enough to recognize that this is some kind of probability distribution and that it's shifting over time - but probability distribution of what? Well, take the temperature in a 250km by 250km cell of the earth's surface and compute the average for each summer (the months of June, July, and August). Obviously, some summers are warmer than others so these summer averages will fluctuate, but on the whole we expect summers to have been getting warmer in most places on account of global warming. To explore how these trends are changing what Hansen et al do is find the mean and standard deviation for each cell from 1951 to 1980 and use that to rescale all the individual summer averages. That makes the entire global population of cell-summers comparable (in the sense that they have the same average and width of distribution over 1951-1980 after rescaling) so they combine all the summers from all the cells and compute the histograms by decade. That's the result above.
IEA: World on Pace for 11-Degree Warming, "Even School Children Know This Will Have Catastrophic Implications for All of Us" - The International Energy Agency was once a staid and conservative organization that people ignored because it was staid and conservative.Now people ignore the IEA because it has become a blunt truth teller on oil and climate (see World’s top energy economist warns peak oil threatens recovery, urges immediate action: “We have to leave oil before oil leaves us”). Last November, Climate Progress blogged on the IEA’s 2011 World Energy Outlook [WEO] bombshell warning: We’re Headed Toward 11°F Global Warming and “Delaying Action Is a False Economy.” Fatih Birol is the IEA’s chief economist, and later gave a great talk at the Carnegie endowment on the WEO’s implications. You can watch it here (and view the transcript and download his PPT slides — I clipped the top image from the last slide). Birol can’t really be considered a rabble-rouser — he worked for OPEC for 6 years before joining the IEA in 1995, so he was there during extended period of time when nobody was much paying attention to the IEA. He had some blunt remarks on climate and energy (starting around minute 56):
Mother Nature is Just Getting Warmed Up: December Heat Records Exceed Cold By 80%, Annual Ratio Hits 2.8-to-1 - Steve Scolnik at Capital Climate analyzed the data from NOAA’s National Climatic Data Center (NCDC) and created the chart above. So if you live on the East Coast and thought it was unusually warm the last few weeks, you were right. Although “unusual” isn’t what it used to be. As the figure makes clear, this was a very hot summer (see “Third Hottest Summer Globally, Second Warmest for U.S. With Stunning Weather Extremes, Texas Drought Worst in Centuries“). I like the statistical aggregation across the country, since it gets us beyond the oft-repeated point that you can’t pin any one record temperature on global warming. If you want to know how to judge whether the 2.8-to-1 ratio for the entire year is a big deal, here’s what a 2009 National Center for Atmospheric Research study found over the past six decades (see “Record high temperatures far outpace record lows across U.S.“):
Arctic Methane: local PM (ascending AIRS CH4 at 400 mb on 2011.11, 2010.11 and 2002.11 (arctic maps)
Eurasian soils froze less deeply in winter from late 1960s to early 1990s - Seasonally frozen ground across the former Soviet Republic extended 31.9 cm shallower in winter of 2000 than in the 1930s. That’s according to a comprehensive assessment of soil thermal conditions in the Eurasian high latitudes, which also found that the trend for decreasing freeze depth began in the late 1960s and appeared to stop in the early 1990s. “We fully expected to find accelerated and amplified changes in these seasonally frozen ground regions, as is the case for virtually all other cryospheric variables in recent decades,” Oliver Frauenfeld of Texas A&M University, US, told environmentalresearchweb. “Observing this slowdown in the response of Northern soils despite continued climate warming is a significant finding in itself. According to Frauenfeld, much of the observed warming and cryospheric change from the 1970s to 1990s, including changes in seasonal freeze depths, can be explained by a prolonged and anomalous positive mode of the North Atlantic Oscillation (NAO). “However, most other cryospheric variables have continued their decline despite the absence of strong NAO forcing from the mid-1990s onward,” he said. “Seasonally frozen ground apparently has not. It is important to note that while seasonal freeze depth has not continued to decrease, it has not returned to its pre-1970 levels.”
Potential sea-level rise impacts in East Boston - Some scientists believe climate change could cause Boston Harbor to overflow its banks and return parts of the city to the marshland it once was, but local activists hope an educated public can reduce the impact of rising sea levels and help protect vital resources and communities. The issue is particularly pressing in East Boston now, given the proposals outlined by Mayor Thomas M. Menino last month that would encourage development along the neighborhood’s waterfront, an area that could one day be fully submerged beneath Boston Harbor. In Menino’s annual speech before the Boston Chamber of Commerce on Dec. 6, he cited five waterfront projects that stalled due to financing problems or other difficulties but that he hopes can be jumpstarted by municipal investments in the waterfront. In a December phone interview, community activist Neenah Estrella-Luna cautioned that any new waterfront development has to be done with foresight. “One of my biggest concerns is how are they taking into account climate change in all of these waterfront development projects,” she said.
Hansen still argues 5m 21st C sea level rise possible - This is interesting - here is the latest paper from James Hansen and coauthor Miki Sato Paleoclimate Implications for Human-Made Climate Change. If you are up to reading climate science papers it's highly recommended. A little background is in order - one of the serious scientific debates in the climate science community over the last decade has been the implications of the unexpectedly large acceleration of glacier discharge in Greenland and Antarctica and in particular a discovery by Zwally et al in 2002 that surface melt water can get down the base of a glacier and lubricate its motion. Prior to the early 2000s it was assumed that ice sheets would decay mainly by melting on the surface and climate models all assumed that they would decay only very slowly in a warmer world - it was a surprise to realize that the most important breakdown mode was actually basal lubrication and sliding down into the ocean. Hansen in particular became the leading spokesman for the view that the ice sheets on Greenland and parts of Antarctica would prove quite unstable under Anthropocene conditions and might break down in a rapid non-linear manner and cause very large levels of twenty-first century sea level rise.
Extinctions from Climate Change Underestimated - As climate change progresses, the planet may lose more plant and animal species than predicted, a new modeling study suggests. This is because current predictions overlook two important factors: the differences in how quickly species relocate and competition among species, according to the researchers, led by Mark Urban, an ecologist at the University of Connecticut. Already evidence suggests that species have begun to migrate out of ranges made inhospitable by climate change and into newly hospitable territory. "We have really sophisticated meteorological models for predicting climate change," Urban said in a statement. "But in real life, animals move around, they compete, they parasitize each other and they eat each other. The majority of our predictions don't include these important interactions." These are important because some species may not be able to move fast enough to survive, or they may have to compete with new species or species better able to adapt to the shifts during and after the move.
Climate change – our real bequest to future generations - Dean Baker: It is remarkable how efforts to reduce the government deficit/debt are often portrayed as a generational issue, while efforts to reduce global warming are almost never framed in this way. ... Seeing the debt as an issue between generations is wrong in almost every dimension. The debt is not money that our children and grandchildren will be paying to someone else. It is money that they will be paying to themselves.Of course, some of this debt will be owned by foreigners. ... However, the foreign ownership of US financial assets, including government debt, is determined by our trade deficit, not our budget deficit. Those who proclaim themselves concerned that our grandchildren will be stuck making huge payments to ... foreigners should be focused on reducing the value of the dollar. A more competitively priced dollar will be the key to ... reducing the outflow of dollars each year that are used to buy up US financial assets. The main factor that will determine the economic wellbeing of our children and grandchildren will be the quality of the capital and infrastructure we pass onto them, along with the level of education we give them, the state of technical knowledge we achieve, and the state of the natural environment.
Rethinking the Growth Imperative, by Kenneth Rogoff - Modern macroeconomics often seems to treat rapid and stable economic growth as the be-all and end-all of policy. But does it really make sense to take growth as the main social objective in perpetuity, as economics textbooks implicitly assume? Wouldn’t it make more sense to worry whether conflict or global warming might produce a catastrophe that derails society for centuries or more? Even if one thinks narrowly about one’s own descendants, presumably one hopes that they will be thriving. Assuming that they are significantly better off than one’s own generation, how important is their absolute level of income? Perhaps a deeper rationale underlying the growth imperative in many countries stems from concerns about national prestige and national security. ... An economic race for global power is certainly an understandable rationale for focusing on long-term growth, but if such competition is really a central justification for this focus, then we need to re-examine standard macroeconomic models, which ignore this issue entirely. In a period of great economic uncertainty, it may seem inappropriate to question the growth imperative. But, then again, perhaps a crisis is exactly the occasion to rethink the longer-term goals of global economic policy.
Introducing: Deep Accountability- This is the first in a series of occasional posts I’m writing to grow an idea I’m calling “Deep Accountability.” Currently, fossil fuel industry lobbyists, flacks, allied pundits, and government officials are far too comfortable dismissing concerns about what their pollution does to other people. In their minds, it’s a big country, there’s plenty to use, and pollution is no big deal as long as it creates problems for other people. Permanently contaminate water tables with gas drilling’s fracking fluids? Just cart in water for those other people. The problem is, we really don’t have a big enough country to trash it like we’ve been doing. In fact, we can’t afford to trash it much more at all. But fossil guys operating with a time horizon of a quarterly earnings report or an election cycle can still nurse the illusion that the status quo is OK. That’s because the effects are still falling on just a few other people. They think anyone who speaks up about the problem must be silly, wimpy, unpatriotic, or not living in “the real world.” With global pollutions trend lines escalating in the wrong direction, it’s pretty clear that by the time the fossil guys wake up to the realities of what they’re doing to the rest of us, it will very likely be too late to reverse the damage. According to some experts, it might be already.
Trouble in paradise: Ocean acidification this way comes - Tahitian breezes dance across crystal blue waters and beneath the tropical seas lies a necklace of coral reefs that encircles Mo'orea like a string of brightly colored jewels. Extensive reefs of a coral named Porites and other species form atolls, or reefs that ring Mo'orea's lagoons. Porites are colonial corals, also known as Scleractinians, found in shallow tropical waters throughout the Indo-Pacific and Caribbean regions. Think tropical reef and your mind's eye is likely seeing Porites. These corals and other calcifying marine life, such as coralline algae, are also the world's primary reef-builders. And therein lies the trouble. The seas in which these calcifying species dwell are turning acidic, their pH slowly dropping as Earth's oceans acidify in response to increased carbon dioxide in the atmosphere. As atmospheric carbon rises in response to human-caused carbon dioxide emissions, carbon in the ocean goes up in tandem. Marine life that depends on calcium carbonate can no longer form shells or, in the case of coral reefs, skeletons. Such marine life are found in waters that are more basic with a higher pH rather than a lower pH, which is more acidic.
Court puts on hold regulation to reduce power plant pollution spoiling air downwind - A federal court Friday put on hold a controversial Obama administration regulation aimed at reducing power plant pollution in 27 states that contributes to unhealthy air downwind. More than a dozen electric power companies, municipal power plant operators and states had sought to delay the rules until the litigation plays out. A federal appeals court in Washington approved their request Friday. The EPA, in a statement, said it was confident that the rule would ultimately be upheld on its merits. But the agency said it was “disappointing” the regulation’s health benefits would be delayed, even if temporarily. Republicans in Congress have attempted to block the rule using legislation, saying it would shutter some older, coal-fired power plants and kill jobs. While those efforts succeeded in the Republican-controlled House, the Senate — with the help of six Republicans — in November rejected an attempt to stay the regulation. And the White House had threatened to veto it.
Where the Real Jobs Are — The Republicans believe they have President Obama in a box: either he approves a controversial Canadian oil pipeline or they accuse him of depriving the nation of jobs. Mr. Obama can and should push back hard. This is precisely the moment for him to argue the case for alternative fuel sources and clean energy jobs — and to lambaste the Republicans for doubling down on conventional fuels while ceding a $5 trillion global clean technology market (and the jobs that go with it) to more aggressive competitors like China and Germany. The payroll tax cut bill, which Mr. Obama signed last month, gave him 60 days to decide on the Keystone XL pipeline. That is not enough time to complete the required environmental review of a project that, in its present design, crosses ecologically sensitive territory and risks polluting an aquifer critical to Midwestern water supplies. The Republicans’ claim that the pipeline will create tens of thousands of new jobs — 20,000 according to House Speaker John Boehner and 100,000 according to Jon Huntsman — are wildly inflated. A more accurate forecast from the federal government, one with which TransCanada, the pipeline company, agrees, says the project would create 6,000 to 6,500 temporary construction jobs at best, for two years.
Storehouses for Solar Energy Can Step In When the Sun Goes Down - If solar energy is eventually going to matter— that is, generate a significant portion of the nation’s electricity — the industry must overcome a major stumbling block, experts say: finding a way to store it for use when the sun isn’t shining. That challenge seems to be creating an opening for a different form of power, solar thermal, which makes electricity by using the sun’s heat to boil water. The water can be used to heat salt that stores the energy until later, when the sun dips and households power up their appliances and air-conditioning at peak demand hours in the summer. Two California companies are planning to deploy the storage technology: SolarReserve, which is building a plant in the Nevada desert scheduled to start up next year, and BrightSource, which plans three plants in California that would begin operating in 2016 and 2017. Together, the four projects will be capable of powering tens of thousand of households throughout a summer evening.
Continued Advances in Fuel Cell Technology - The New Year may well be the breakthrough year for fuel cells. The astonishing innovation and marketing locomotive of Apple Computers with the i – you name it – product list leading us into new uses for electronic devices, has let slip they will preview a fuel cell idea at this month’s Consumer Electronics Show. Apple has gone so far as to file patent applications named “Fuel Cell System to Power a Portable Computing Device” and “Fuel Cell System Coupled to a Portable Computing Device” – ideas not to be taken lightly. It not a great surprise to close Apple watchers, Apple has filed other patent applications for light weight hydrogen fuel cells. Those patents, which were brought to light this past October, described a building process where multiple fuel cells are connected by a power bus in a parallel pattern, and a voltage-multiplying circuit is added for additional voltage from the stack. Apple hopes to utilize these lighter, more efficient fuel cells in its mobile products in an effort to promote renewable energy sources and offer devices with the ability to run for days or even weeks without refuelling, according to the patent applications.
Power Plant Rule Is Delayed A federal court is suspending an Obama administration regulation intended to reduce pollution from power plants in 27 states and help improve unhealthy air downwind. More than a dozen power companies, municipal power plant operators and states had sought to delay the rules until the litigation played out. A federal appeals court in Washington approved their request on Friday. Republicans in Congress have tried to block the rule using legislation, saying it would shutter some plants and kill jobs. While those efforts succeeded in the Republican-controlled House, the Senate rejected an attempt to stay the regulation in November. The rule, finalized by the Environmental Protection Agency in July, replaces a 2005 Bush administration proposal that was rejected by a federal court. The Bush-era rule will remain in effect.Did Fukushima Really Put a Nail in Atomic Power's Coffin? - There have been a flurry of antinuclear events in the United States since Christmas. Presumably, those who are opposed to nuclear power want to take advantage of the news lull to hammer home their bleak message: Fukushima Daiichi was the effective end of nuclear power, at least in the northern industrialized world. But was it? Maybe it proved that nuclear power can take a drubbing and survive. If you are a nuclear power believer, the three GE-built reactors proved their mettle during the earthquake and tsunami that hit Japan's Fukushima province in March. They withstood all that nature could throw at them although terrible damage resulted from the loss of external power and the swamping of the emergency diesel generators. The result was core melting and trouble in the used fuel storage pools. If you are doubtful about nuclear power, or you are simply a political opportunist, this event was the final nail in the coffin, the proof that the end had arrived. For you, it provided more evidence that nuclear power is inherently unsafe and that its use, as American scientist Alvin Weinberg once said, is a Faustian bargain.
Australia Developing Wave Power - Consider. Australia’s 2,966,140 square-mile landmass is ringed by 16,006 miles of coastline. Most of the population is concentrated along the southeast coast of the country, in an arc running from Brisbane to Adelaide along the "boomerang coast." Virtually all of Australia's large cities - Sydney, Melbourne, Brisbane, Perth, and Adelaide - are on the coast. About 80 percent of Australia's population lives within 30 miles of the coast. So, where do the Aussies get their energy to support their affluent lifestyles? Australia is one of the most coal-dependent countries in the world and coal and natural gas, along with oil-based products, are currently the primary sources of Australian energy usage. But recent technological innovations may make that coastline as attractive to renewable energy investors as sunbathers. A new wave energy project is being planned for development off the coast of Garden Island in Western Australia, near Perth.
As radiation fears persist, ties unravel in society - A 4-year-old boy in Tokyo's Meguro Ward wears two flu masks and a raincoat every time he goes to his kindergarten. When he returns home, he is immediately told to shower and rinse his body with bottled water. These measures are ordered by his 28-year-old mother, who remains fearful about radiation from the accident at the Fukushima No. 1 nuclear power plant 230 kilometers away. Her husband has told her to stop, and they once quarreled for three hours over the matter. "I no longer tell him anything about my uneasiness. I don't think he will understand me," said the mother, adding that she wants to flee to western Japan with her son, leaving her husband behind. Japan's worst nuclear disaster has caused a number of rifts in a society long known for its cohesion. The public no longer trusts the government. Families are arguing over protective measures against radiation exposure. Scientists are at odds over the actual dangers of the radioactive fallout.
Extra nuclear safety to cost up to 10 bln euros: EDF - Recommendations by France's nuclear watchdog agency to beef up safety at plants will cost the state-owned electricity provider EDF up to 10 billion euros (13 billion dollars), a senior executive told AFP on Tuesday. "We had scheduled investment of around 40 billion euros (over 30 years) in our 58 reactors on the basis of plant operational life of up to 60 years," Jean-Marc Miraucourt, head of engineering for nuclear facilities at Electricite de France (EDF), said. "Our preliminary estimates are that we will be in the range of 40 to 50 billion euros (52-65 billion dollars)." Earlier Tuesday, France's Nuclear Safety Authority (ASN) issued a raft of recommendations for coping with natural disasters in the light of the March 11 accident at the Fukushima plant in northeastern Japan. Miraucourt said some investments would have to be brought forward. They include the provision of backup generators, which were now likely to be installed over the next six years rather than over a longer period.
The End of the Nuclear Renaissance - In political terms, the issues of climate change and energy took a back seat for most of 2011. The truly significant developments, however, were not driven by politics, although they will have profound political implications. In 2011, nuclear power ceased to be a serious option for meeting the world’s energy needs, and solar photovoltaics (PV) finally became an option worth noting. The “solar vs. nuclear” dispute had been largely symbolic for several decades. After rapid growth in the 1960s and 1970s, new installations of nuclear power came to a grinding halt. This was partly a result of safety fears created by the accidents at Three Mile Island and Chernobyl. Economic factors were even more significant. Far from being too cheap to meter, nuclear power turned out to be far more expensive than its main rival, coal, primarily because of unpredictable capital costs and generally high interest rates. As a result, since 1977, when the River Bend plant in Louisiana commenced construction, not one new nuclear-power plant has been ordered and completed in the United States. The situation in most other developed countries was similar. Only where some combination of military funding and concern about national self-sufficiency allowed for substantial subsidies was there any new construction of nuclear-power plants.
Fracking Cracks the Public Consciousness in 2011 -This was the year that "fracking" became a household word. It wasn't just that environmental concerns about the underground drilling process finally struck a mainstream chord -- after three years of reporting and more than 125 stories. For the first time, independent scientific investigations linked the drilling technique with water pollution, and a variety of federal and state agencies responded to the growing apprehension about water contamination with more studies and more regulation. The most important development -- and perhaps a crucial turning point -- was in December. In a landmark finding, the Environmental Protection Agency concluded that hydraulic fracturing was the likely culprit in a spate of groundwater contamination that had forced residents to stop using their water in dozens of homes in central Wyoming. The agency had been investigating since 2008. Earlier in the year, a study published through the National Academy of Sciences determined that in Pennsylvania, private water wells in close proximity to fracked gas wells were 17 times more likely to be contaminated with methane gas. Those studies are separate from a national research project the EPA has undertaken to assess the risks fracking poses to water resources. The study is meant to help Congress and regulators determine whether fracking should be regulated like other similar processes under the Safe Drinking Water Act and whether companies that frack should be forced to disclose the details about the chemicals they use.
4.0 earthquake strikes in US: — A 4.0 magnitude quake Saturday afternoon in McDonald, outside of Youngstown, was the 11th in a series of minor earthquakes in area, many of which have struck near the Youngstown injection well. Officials said Saturday they believe the latest earthquake activity in northeast Ohio is related to the injection of wastewater into the ground near a fault line, creating enough pressure to cause seismic activity. The brine wastewater comes from drilling operations that use the so-called fracking process to extract gas from underground shale. But Ohio Department of Natural Resources Director Jim Zehringer said during a news teleconference that fracking is not causing the quakes. "The seismic events are not a direct result of fracking," he said. Environmentalists and property owners who live near gas drilling wells have questioned the safety of fracking to the environment and public health. Federal regulators have declared the technology safe, however. Zehringer said four injection wells within a 5-mile (8-kilometer) radius of an already shuttered well in Youngstown will remain inactive while further scientific research is conducted.
Northeast Ohio rocked by 11th earthquake linked to Youngstown injection wells - The 4.0-magnitude quake was centered near Youngstown, reported the U.S. Geological Survey and the Ohio Earthquake Information Center. The earthquake at 3:05 p.m. was felt as far away as Michigan, Ontario, Pennsylvania and New York, reported Michael C. Hansen, state geologist and coordinator of the Ohio Seismic Network, part of the Ohio Department of Natural Resources’ Division of Geological Survey. The quake was “a pretty good-sized one,” he said.There were no initial reports of injuries or major damage, he said. The quake was the 11th over the last eight months in Mahoning County, all within two miles of the injection wells, he said. Saturday’s quake was the largest yet.
Expert: Wastewater well in Ohio triggered quakes - A northeast Ohio well used to dispose of wastewater from oil and gas drilling almost certainly caused a series of 11 minor quakes in the Youngstown area since last spring, a seismologist investigating the quakes said Monday. Research is continuing on the now-shuttered injection well at Youngstown and seismic activity, but it might take a year for the wastewater-related rumblings in the earth to dissipate, said John Armbruster of Columbia University’s Lamont-Doherty Earth Observatory in Palisades, New York. Brine wastewater dumped in wells comes from drilling operations, including the so-called fracking process to extract gas from underground shale that has been a source of concern among environmental groups and some property owners. Injection wells have also been suspected in quakes in Astabula in far northeast Ohio, and in Arkansas, Colorado, and Oklahoma, Armbruster said.
Official: 4 Ohio fluid-injection wells cannot open in wake of quake (CNN) -- State leaders have ordered that four fluid-injection wells in eastern Ohio will be "indefinitely" prohibited from opening in the aftermath of heightened seismic activity in the area, an official said. Ohio Department of Natural Resources Director James Zehringer had announced on Friday that one such well -- which injects "fluid deep underground into porous rock formations, such as sandstone or limestone, or into or below the shallow soil layer," the U.S. Environmental Protection Agency explains -- was closed after a series of small earthquakes in and around Youngstown. Then on Saturday, a magnitude 4.0 earthquake struck that released at least 40 times more energy than any of the previous 10 or more tremors that had rattled the region in 2011. Andy Ware, deputy director of Ohio's natural resources department, told CNN on Sunday that Zehringer and Gov. John Kasich subsequently ordered that four nearby injection well projects will not open in the coming weeks, as had previously been planned. They 'll be inoperational until a determination is made in an investigation of a possible link between the earthquakes and the fluid-injection wells, he added.
Ohio Fracking Wells Closed After Earthquakes - CNN reports: State leaders have ordered that four fluid-injection wells in eastern Ohio will be "indefinitely" prohibited from opening in the aftermath of heightened seismic activity in the area, an official said. Ohio Department of Natural Resources Director James Zehringer had announced on Friday that one such well -- which injects "fluid deep underground into porous rock formations, such as sandstone or limestone, or into or below the shallow soil layer," the U.S. Environmental Protection Agency explains -- was closed after a series of small earthquakes in and around Youngstown. Then on Saturday, a magnitude 4.0 earthquake struck that released at least 40 times more energy than any of the previous 10 or more tremors that had rattled the region in 2011. The New York Times notes that: The latest quake, the 11th since mid-March, occurred Saturday afternoon and with a magnitude of 4.0 was the strongest yet. Like the others, it was centered near a well that has been used for the disposal of millions of gallons of brine and other waste liquids produced at natural-gas wells, mostly in Pennsylvania. The waste, from the process called hydraulic fracturing that is used to unlock the gas from shale rock, had been injected under pressure into the well, which is 9,200 feet deep. Scientists had suspected that some of the wastewater might have migrated into deeper rock formations, allowing an ancient fault to slip. Similar links between disposal wells and earthquakes have been suspected in Arkansas and Texas.
Ohio earthquake was not a natural event, says expert (Reuters) - A 4.0 magnitude earthquake in Ohio on New Year's Eve did not occur naturally and may have been caused by high-pressure liquid injection related to oil and gas exploration and production, an expert hired by the state of Ohio said on Tuesday. Ohio's Department of Natural Resources on Sunday suspended operations at five deep well sites in Youngstown, Ohio, where the injection of water was taking place, while they evaluate seismological data from a rare quake in the area. The wells are about 9,000 feet deep and are used to dispose of water from oil and gas wells. The process is related to fracking, the controversial injection of chemical-laced water and sand into rock to release oil and gas. Critics say that the high pressure injection of the liquid causes seismic activity. Won-Young Kim, a research professor of Seismology Geology and Tectonophysics at the Lamont-Doherty Earth Observatory at Columbia University, told Reuters in an interview on Tuesday that circumstantial evidence suggests a link between the earthquake and the high-pressure well activity. "We know the depth (of the quake on Saturday) is two miles and that is different from a natural earthquake," said Kim, who is advising the state of Ohio.
Ohio Earthquake Likely Caused by Fracking Wastewater - Residents of Youngstown, Ohio, received an extra surprise on Christmas Eve and again on New Year's Eve—earthquakes, measuring 2.7 and 4.0 on the Richter scale, respectively. No one was injured and only a few cases of minor damage were reported after the Dec. 31 event. Scientists have quickly determined that the likely cause was fracking—although not from drilling into deep shale or cracking it with pressured water and chemicals to retrieve natural gas. Rather, they suspect the disposal of wastewater from those operations, done by pumping it back down into equally deep sandstone. Nine small earthquakes had already occurred between March and November 2011 within an eight-kilometer radius of a wastewater injection well run by Northstar Disposal Services. By triangulating the arrival time of shock waves at the four stations, Armbruster and his colleagues needed only a day or two to determine with 95 percent certainty that the epicenters of the two holiday quakes were within 100 meters of each other, and within 0.8 kilometer of the injection well. The team also determined that the quakes were caused by slippage along a fault at about the same depth as the injection site, almost three kilometers down.
A Fracking Mess - Fracking (Hydraulic Fracturing) for natural gas has stirred contentious debates among (and between) economists, geologists, environmentalists, industrialists, and local and state politicians in Pennsylvania, New York and more recently Ohio. Most of the debates center around 1) the potential local development benefits and costs (JOBS!) and 2) the environmental side effects of cracking rock thousands of feet below the surface. In case you haven't heard, in Ohio we are now adding a 3rd dimension of debate: EARTHQUAKES! State officials say they will let waste fluids that were injected thousands of feet down a Youngstown disposal well bubble back to the surface in an effort to relieve underground pressure that might have caused a series of earthquakes. The Northstar No. 1 disposal well stopped injecting brine and fracking fluids from natural-gas wells in Pennsylvania on Friday, about a day before a 4.0-magnitude quake shook Youngstown. It was the 11th such quake recorded in that area last year and the strongest to date. John Armbruster, a Columbia University seismologist who installed the seismometers at the state’s request, said yesterday he thinks that the disposal well triggered the quakes. “I find the evidence convincing,” Armbruster said.
Oil-drilling wastewater causing earthquakes, expert says -- In the wake of a recent decision by Ohio state officials to close four "fluid injection" wells, at least one expert believes that pumping oil-drilling wastewater back into a northeast Ohio well has "almost certainly" caused a series of earthquakes, according to published reports. Eleven minor earthquakes have occurred around Youngstown in the past year, including one on Saturday. Reports said Northstar Disposal Services has used the wells to dispose of brine wastewater from shale oil and gas drilling. This is reportedly different than fracking, which has gained national attention from those concerned about its safety, although some claim this process is related to fracking. The Youngstown well is near a fault that geologists did not know about, the report said, and the wastewater's pressure caused the shift of the fault and, therefore, the earthquakes. The earthquakes will trickle on as a kind of a cascading process once you've caused them to occur," John Armbruster of Columbia University's Lamont-Doherty Earth Observatory told the Associated Press. "This one year of pumping is a pulse that has been pushed into the ground, and it's going to be spreading out for at least a year."
Ohio quakes could incite fracking policy shift — In Ohio, geographically and politically positioned to become a leading importer of wastewater from gas drilling, environmentalists and lawmakers opposed to the technique known as fracking are seizing on a series of small earthquakes as a signal to proceed with caution. Earthquakes caused by the injection of wastewater that's a byproduct of high-pressure hydraulic fracture drilling, aren't new. Yet earthquakes have a special ability to grab public attention. That's especially true after Saturday's quake near Youngstown, at magnitude 4.0 strong enough to be felt across hundreds of square miles. Gov. John Kasich, a drilling proponent, has shut down the wastewater well on which the quake has been blamed, along with others in the area, as the seismic activity is reviewed. "Drilling's very important for our economy and to help us progress as a state, but every single person in the Mahoning Valley felt this earthquake," said state Sen. Joe Schiavoni, a Youngstown Democrat who on Tuesday called for a public hearing. "I wouldn't deem it as an emergency, but when you live in a place that you're not used to earthquakes and you have 11 earthquakes, you're concerned,"
Avoiding fracking earthquakes: expensive venture (Reuters) - With mounting evidence linking hundreds of small earthquakes from Oklahoma to Ohio to the energy industry's growing use of fracking technology, scientists say there is one way to minimize risks of even minor temblors. Only, it costs about $10 million a pop.A thorough seismic survey to assess tracts of rock below where oil and gas drilling fluid is disposed of could help detect quake prone areas. But that would be far more costly than the traditional method of drilling a bore hole, which takes a limited sample of a rock formation but gives no hint of faults lines or plates. The more expensive method will be a hard sell as long as irrefutable proof of the link between fracking and earthquakes remains elusive. "If we knew what was in the earth we could perfectly mitigate the risk of earthquakes," said Austin Holland, seismologist at the Oklahoma Geological Survey. "That is something that we don't have enough science to establish yet."
China, France Join Hunt for U.S. Shale Oil and Gas - Taking advantage of low barriers to entry and even lower natural gas prices, two large foreign-owned oil and gas companies announced plans to invest billions of dollars to develop shale resources in the United States. Sinopec, China’s second-largest oil company inked a $2.5 billion deal with Oklahoma-based Devon Energy to invest in five new shale development areas ranging from Ohio south to Alabama. In another deal, France’s Total Group is investing $2.3 billion in a joint venture with Chesapeake Energy and EnerVest on an Ohio oil and gas project. The two deals have a similar structure and purpose. The foreign companies are paying a majority of the development costs plus cash up front for a minority stake. The reason? Total and Sinopec want to learn a thing or two about advanced drilling techniques.
Should the U.S. export its natural gas? A debate flares - Last year, fuel was America’s #1 export. But not everyone’s so keen on watching the United States ship out all that energy to the rest of the world. Case in point: On Wednesday, Rep. Edward Markey (D-Mass.) fired off a letter to Energy Secretary Steven Chu asking him whether it was really such a swell idea for the United States to be exporting its newly abundant natural gas resources all over the globe. Some experts, after all, have raised concerns that such exports could have unexpected downsides. On the surface, there’s an alluring logic in exporting natural gas. The United States has been flooded with cheap gas thanks to its newly exploitable (and potentially large) shale resources. And gas prices are higher in many other countries. So why not ramp up exports, turn a profit, and reap the gains from trade? That explains why various producers are asking the Energy Department to green-light new export facilities, such as Cheniere Energy’s just-okayed Sabine Pass Liquefaction terminal in Cameron Parish, La., which will ship out two billion cubic feet of gas per day by 2015. Seven more projects are awaiting approval.
PetroChina controls Canadian oil sand project - Canada's Athabasca Oil Sands Corp said it has sold the remaining 40 percent of interest in the MacKay River oil sands project to a subsidiary of PetroChina, a move that will render a Chinese company full ownership of such a project for the first time. The deal with PetroChina International Investment Limited was worth C$680 million ($666 million), Athabasca said in its press release. Canadian regulators previously approved PetroChina to buy 60 percent of the project for C$1.9 billion in November 2011, according to Xinhuanet. The MacKay River project is located in northern Alberta of Canada, a region that contains 85 percent of the world's oil sand. The first phase of the project will begin in 2014, with a daily output of 35,000 barrels of oil. Its max daily production is expected to be 150,000 barrels, according to Xinhuanet.
Oil industry: 'Huge political consequences' if pipeline rejected -A top oil industry official delivered a clear warning to President Obama Wednesday: approve the Keystone XL pipeline or face “huge political consequences.” American Petroleum Institute President Jack Gerard urged Obama to quickly approve the pipeline, which would carry oil sands crude from Alberta, Canada, to refineries along the Gulf Coast. A payroll tax cut package signed into law by Obama last month includes a GOP-backed provision requiring the president to make a final decision on the pipeline within 60 days. “I think it would be a huge mistake on the part of the president of the United States to deny the construction of the Keystone XL pipeline,” Gerard said during the powerful oil industry trade association’s annual “State of American Energy” event Wednesday. “Clearly, the Keystone XL pipeline is in the national interest. A determination to decide anything less than that I believe will have huge political consequences.”
Big Oil Makes Their Threat on Keystone XL -- The oil industry, which has previously worked behind the scenes on urging a permit for the Keystone XL tar sands pipeline, is now openly threatening the President, who must decide by February 21 to accept or deny a permit for the project. The oil industry’s top lobbyist warned the Obama administration Wednesday to approve the Keystone XL oil pipeline or face “huge political consequences” in an election year. Jack Gerard, president of the American Petroleum Institute, said it would be a “huge mistake” for President Barack Obama to reject the 1,700-mile, Canada-to-Texas pipeline. Obama faces a Feb. 21 deadline to decide whether the $7 billion pipeline is in the national interest. We know that Big Oil has worked in conjunction with several unions to push the tar sands pipeline, occasionally in incredibly dishonest ways. Now, the lobbyists are making their threats clear: they will run ads in the Presidential election and in Senate races accusing those not supportive of the pipeline of ruining America and destroying jobs.
Keystone Oil Pipeline Deadline Puts Obama In A Pinch - When Congress gave the White House a tight 60-day deadline for approving or rejecting the controversial Keystone project, it seemed like a Christmas gift to TransCanada, the company building the pipeline that would carry oil from Canada all the way to the Gulf of Mexico. But TransCanada says it didn’t ask for this deadline and it doesn’t know how to handle this unwanted gift. “We have essentially become the lightning rod for that broader debate around the consumption of fossil fuels,” Last year, environmentalists and ranchers in Nebraska succeeded in delaying the Keystone XL pipeline by arguing that it put a huge aquifer at risk. The company is looking for a new route through Nebraska, and it doesn’t expect to have it pinned down until next fall. The unrequested deadline was just the latest consequence of how politicized the Keystone pipeline has become.
Buying Congress in 2012 - Bill McKibben - Startling numbers of Americans are “underwater” -- homeowners and students alike -- and so, for that matter, is Congress, even if in quite a different way. In these last years, it’s been flooded with money. Millionaires, including at least 10 centimillionaires, now make up nearly half of our representatives there, and as a group, they have been growing ever richer as Americans grow ever poorer. Bad times? Never heard of them. Congress’s median net worth rose by 15% between 2004 and 2010 -- and this news, in a recent front-page New York Times piece, hardly caused a stir. Of course, everything is relative. Compared to the giant energy companies, ours is a Congress of paupers. After all, the Big Five oil outfits (BP, Chevron, ConocoPhillips, ExxonMobil, and Royal Dutch Shell) announced a combined $36 billion in profits in the second quarter of 2011. In the third quarter, the same five companies returned for an encore. They made another $32.6 billion in profits, with Exxon at $10.3 billion (about half of which it again spent on stock buybacks). Out of a deep sense of civic-mindedness, they and other oil and gas companies have, in turn, showered Congress with their pocket change. From 1989 through 2010, according to the Center for Responsive Politics’ invaluable OpenSecrets.org website, oil and gas companies gave Republicans in Congress $126 million and Democrats $42 million.
US eyes first BP criminal charges over Gulf spill: WSJ - US prosecutors are readying criminal charges against British oil giant BP employees over the 2010 Deepwater Horizon accident that led to the catastrophic Gulf oil spill, The Wall Street Journal reported online. The charges if brought and prosecuted by the US Justice Department would be the first criminal charges over the disaster. Citing sources close to the matter, the Journal said the prosecutors are focusing on US-based BP engineers and at least one supervisor who they say may have provided false information to regulators on the risks of deep water drilling in the Gulf. Felony charges for providing false information in federal documents may be made public early next year, said the Journal. A conviction on that charge would carry a fine and up to five years in prison, the newspaper said.
BP fund halts payments to spill victims pending clarification - BP's $20 billion oil spill fund has halted payments to eligible victims until a U.S. federal court clarifies an order issued in December, according to a notice posted on the fund's website. The District Court for the Eastern District of Louisiana had asked the fund, called the Gulf Coast Claims Facility, to pay into a court supervised escrow account 6 percent of the gross settlement amount. The funds from the escrow account would be used to meet certain legal expenses incurred by the plaintiffs' lawyers. In a letter to the court, a lawyer for the fund, David Pitofsky, asked the court to clarify whether the ruling would mean that those who have already been paid by GCCF on or after November 7 should be asked to give some of the money back. "Effective December 30, the GCCF has temporarily frozen all payments to claimants and the issuance of any payment determination letters,"
Ecuador court upholds $18bn Chevron ruling - An Ecuadorean appeals court has upheld an $18bn ruling against Chevron for pollution in the remote pocket of the Amazon where the country’s oil industry was founded. The damages bill represents about one-third of Ecuador’s gross domestic product, making it the most expensive environmental suit in history, although the BP Gulf of Mexico oil spill is expected to overtake it. A three-judge panel supported the original court’s order that Chevron pay $8.6bn in damages, which later more than doubled after the company refused to publicly apologise. James Craig, a Chevron spokesman, said the company did not believe the Ecuadorean ruling was enforceable “in any court that observes the rule of law”. “[Tuesday’s] decision is another glaring example of the politicisation and corruption of Ecuador’s judiciary that has plagued this fraudulent case from the start,” he said. Chevron, which bought out Texaco, the company accused of causing the pollution, in 2001, has turned to the Hague and the District Court for the Southern District of New York to accuse the plaintiffs’ representatives of fraud and corruption.
Mark Ames: Failing Up With Joshua Foust – Meet The “Evil Genius” Massacre-Denier Who Shills For War Profiteers - Yves here. We cross posted a piece by Mark Ames on a massacre of Kazakh oil workers striking against KazMunaiGaz, a company “owned” by the son-in-law of the Kazakh president for life. Its American JV partners are led by Chevron. The story got a surprising amount of pushback here and on Ames’ site, and some of reaction did not look organic. That led Ames to do further digging, and the resulting piece below gives a window into how big corporations go about neutralizing embarrassing news coverage. The more the public knows about the modus operandi of people like Foust, the faster they will be forced to seek more honorable lines of employment. In this blogger’s humble opinion, this piece is a gold standard takedown of a truly deserving target. Last week, some troll named Joshua Foust attacked my article about the massacre in Kazakhstan on December 16. I really had no idea who Foust was until I started getting emails from readers telling me “some guy with a goatee is having a meltdown on Twitter.” What upset Foust so much about my article was that I dared to report a death toll number, “up to 70,” that differed from the official figure of 15 that the regime in Kazakhstan wanted the outside world to believe. Why did Foust take on the role of massacre-denier for Kazakhstan’s notoriously brutal, corrupt regime?
Coastal villages in Nigeria protest as crude oil washes ashore - Nigerian villagers say oil washing up on the coast comes from a Royal Dutch Shell loading accident last month that caused the biggest spill in Africa’s top producer in more than 13 years. Shell denies that any of the oil is from its 200,000 barrel per day Bonga facility, 120 km offshore and accounting for 10 percent of monthly oil flows, which was shut down by the spill on Dec. 20. Shell says five ships were used to disperse and contain the spill and that this kept any oil from washing ashore. But local villagers, as well as environmental and rights groups, dispute this account, saying the oil is still at large, coating parts of the coast, killing fish and sparking protests.
Nigeria fury as fuel prices double after subsidy ends - Ordinary Nigerians and trade unionists have condemned the government for withdrawing a fuel price subsidy which has led petrol prices to more than double in many areas. The BBC's Chris Ewokor in the capital, Abuja, says many Nigerians are angry at the announcement, fearing the price of many other goods will also rise. There have been small protests and the trade unions have called for a strike. Nigeria is Africa's biggest oil producer, but imports refined petrol. Years of mismanagement and corruption mean it does not have the capacity to refine oil, turning it into petrol and other fuels. Analysts say many Nigerians regard cheap fuel as the only benefit they get from the nation's oil wealth. Several previous governments have tried to remove the subsidy but have backed down in the face of widespread public protests and reduced it instead. The IMF has long urged Nigeria's government to remove the subsidy, which costs a reported $8bn (£5.2bn) a year.
America’s oil boom—Because progressivism exists to justify a few people bossing around most people, and because progressives believe that only government’s energy should flow unimpeded, they crave energy scarcities as an excuse for rationing — by them — that produces ever-more-minute government supervision of Americans’ behavior. Imagine what a horror 2011 was for progressives as Americans began to comprehend their stunning abundance of fossil fuels — beyond their two centuries’ supply of coal. Progressives responded with attempts to impede development of the vast proven reserves of natural gas and oil here and in Canada. They bent Obama to delay approval of the Keystone XL pipeline to carry oil from Canadian tar sands; they raised environmental objections to new techniques for extracting gas and “tight” oil from shale formations.
Oil and Gas Bubble Up All Over - You'll know the U.S. energy industry is really on the rebound when North Dakota's newfangled Bakken oil field starts pumping more crude than Alaska's stalwart Prudhoe Bay. Energy experts expect it to happen in 2012 (see chart above). Dwindling production from the once-mighty Alaskan field has been a symbol of what was once seen as the slow, inexorable decline of U.S. oil. But new technologies have turned that overall decline into an increase, led by the Bakken shale, which in July produced 424,000 barrels a day, to Alaska's 453,00. Rising oil production from the Bakken and other nontraditional fields is expected to add 250,000 barrels of oil a day to U.S. production, according to the International Energy Agency, even as conventional oil production falls. If overall trends continue, daily U.S. oil output could be up by 1 million barrels a day by 2016, to 6.6 million.
Tech Talk - Some Thoughts on Current and Perceived Oil and Natural Gas Supply - It should be noted up front that there are considerable differences between the supplies of natural gas becoming available, and those of crude oil. Natural gas reserves are still increasing; I wrote just recently of the realization that exists in Azerbaijan that the gas produced from the Shah Deniz field will have a hard time competing in the global marketplace in three years because of the arrival of natural gas from the Levant Basin. The relatively low prices for natural gas in the United States brought about by the development of wells in the gas shales such as the Barnett, Haynesville, and Marcellus, and their initial high productivity, will continue to make it difficult to see much increase in price. Yet this comes at a time when the price that natural gas is sold for in America is around $3.50 per thousand cubic feet (kcf) or $124 per thousand cubic meters (kcm). That price is often insufficient to totally cover the costs of its production and return a profit to all the investors, with some indications that a profitable price would need to be closer to $6.00 per kcf. The low price of natural gas relative to world prices, however, means that it helps to keep American industry competitive, since fuel costs are usually significantly lower here than elsewhere.
In a first, gas and other fuels are top US export - For the first time, the top export of the United States, the world's biggest gas guzzler, is — wait for it — fuel. Measured in dollars, the nation is on pace this year to ship more gasoline, diesel, and jet fuel than any other single export, according to U.S. Census data going back to 1990. It will also be the first year in more than 60 that America has been a net exporter of these fuels.Just how big of a shift is this? A decade ago, fuel wasn't even among the top 25 exports. And for the last five years, America's top export was aircraft. The trend is significant because for decades the U.S. has relied on huge imports of fuel from Europe in order to meet demand. It only reinforced the image of America as an energy hog. And up until a few years ago, whenever gasoline prices climbed, there were complaints in Congress that U.S. refiners were not growing quickly enough to satisfy domestic demand; that controversy would appear to be over. Still, the U.S. is nowhere close to energy independence. America is still the world's largest importer of crude oil. From January to October, the country imported 2.7 billion barrels of oil worth roughly $280 billion.
Hunt for Gas Hits Fragile Soil, and South Africans Fear Risks - When a drought dried up their wells last year, hundreds of farmers and their families flocked to local fairgrounds here to pray for rain, and a call went out on the regional radio station imploring South Africans to donate bottled water. Covering much of the roughly 800 miles between Johannesburg and Cape Town, this arid expanse — its name means “thirsty land” — sees less rain in some parts than the Mojave Desert. Even so, Shell and several other large energy companies hope to drill thousands of natural gas1 wells in the region, using a new drilling technology that can require a million gallons of water or more for each well. Companies will also have to find a way to dispose of all the toxic wastewater or sludge that each well produces, since the closest landfill or industrial-waste facility that can handle the waste is hundreds of miles away. With his three skinny border collies crouching dutifully at his side, Mr. Hayward explained that he had to slaughter more than 600 of his 2,000 sheep last year because there was not enough water to go around. “If our government lets these companies touch even a drop of our water,” he said, “we’re ruined.”
Pakistan to Produce Natural Gas - By Burning Underground Coal - With about 50 per cent less electricity generation capability than the actual demand, Pakistan’s National Grid is facing more than a 5,000-megawatt shortfall in power generation, leading to blackouts in both urban and rural areas of the country. Due to unscheduled shortages by the National Power Control Center, urban areas are facing unscheduled minimum 8-hour power blackouts each day, while in rural areas the blackouts can last as long as 14 hours. Scrambling to exploit virtually any indigenous sources of energy, officials in the capital Islamabad are now pinning their hopes on the Thar Underground Coal Gasification (UCG) pilot project, situated in the Tharparkar desert in Sindh eastern Pakistan. Underground coal gasification converts coal to gas while still in the coal seam, where injection wells are drilled and used to supply the oxidants to ignite and fuel the underground combustion process, with separate production wells used to bring the product gas to surface. The high pressure combustion is conducted at temperatures of 1,290–1,650 degrees Fahrenheit, but can reach up to 2,730 degrees Fahrenheit. The process produces carbon monoxide and dioxide, hydrogen and methane.
Russia 2011 oil output at new post-Soviet record high (Reuters) - Oil output in Russia edged up 1.2 percent to reach a new post-Soviet high of 10.27 million barrels per day (bpd) last year, as the world's top crude producer eased tax burden and launched pipeline flows to China, the Energy Ministry said on Monday. That is a bit more than the 10.26 million bpd, expected by an analyst poll compiled a year ago, though the increase in 2011 has slackened from a 2.2 percent rise in 2010 when the country produced 10.145 mln bpd, up from 9.93 million bpd in 2009 and 9.78 million bpd in 2008. Russia aims to maintain annual oil production at around 510 million tonnes, or just over 10 million bpd, in the next 10 years. It also sees its crude oil export flat at 250 million tonnes in 2012. The main driver behind the increase was the new Vankor oilfield, developed by the country's top crude producer Rosneft , which reached a production target of 15 million tonnes (300,000 bpd) last year.The field is slated as the main source of Russia's pipeline export to China via the East Siberia - Pacific Ocean (ESPO) link, which is shipping 300,000 bpd of oil to Daqing in China. In 2012, Russia plans to finish the second stage of ESPO, which will terminate at the Pacific port of Kozmino.
Global oil search may cost $595 billion in 2012 -- Dahlman Rose & Co. on Tuesday said it expects worldwide oil and gas exploration spending to rise by 9% to a record $595 billion in 2012. Analyst James Crandell based his projection on a survey of 460 companies. Capital spending in the U.S. is expected to increase by 11%. "The results of our exploration and production spending survey support our thesis of a long upcycle...in spending internationally, as well as our emphasis on beneficiaries of horizontal drilling in the shales and the increase in ultra-deepwater drilling," Crandell said in a note to clients. "We continue our broad-based positive stance toward investing in the group, with a focus on large-cap oil service and equipment companies, land drillers, and North American services."
The Oil That Comes in From the Cold - Thanks to soaring oil prices and new technology, oil producers in the hot sands of Arabia, the torrid Niger delta or the humid plains of the Orinoco are facing new competition from rivals in the frozen North. The Anglo-Dutch Shell group was given the green light by the U.S. environmental agency to drill for oil off the coast of the northern edge of Alaska from July 2012, a project in which the company has already invested 3.5 billion dollars. Meanwhile U.S. oil giant Exxon signed an agreement with Rosneft, Russia's largest oil producer, to invest 3.2 billion dollars in exploring for oil and gas under the Kara sea, in northwest Russia. Another alliance, between BP (British) and TNK (Russian), is regretting its failure to win this opportunity. "Estimated reserves of 100 billion barrels of crude lie under the Arctic ocean, as much as in Iraq or Kuwait, as well as 44 billion barrels of natural gas liquids (like propane and butane) and 80 trillion cubic feet of natural gas," Kenneth Ramírez, an expert on geopolitics and oil issues at the Central University of Venezuela, told IPS. The Danish island of Greenland has also called for bids for offshore oil exploration, and Exxon and the U.S.-based Chevron have been quick to express interest. Canada, for its part, has Arctic oil deposits to add to the tar sands in its western provinces, putting it among the countries with the world's largest oil reserves. It also has the advantage of proximity to the largest market in the world, the U.S. Between 13 and 20 percent of the undiscovered oil on the planet is under the Arctic ocean, according to the United States Geological Survey (USGS), most of it at accessible depths, which increases the likely profits if demand increases as expected and prices remain at or above 100 dollars a barrel.
Saudis use more oil; exporter status threatened - -- Growing domestic energy consumption in the world's largest oil exporter, Saudi Arabia, threatens its ability to adequately supply world markets, said a report from London-based think tank Chatham House. The report, posted on the Chatham House website Wednesday, said without significant policy changes, rising Saudi energy consumption could deprive the world of 2 million barrels a day of oil exports by 2020 and make major oil price spikes more likely. It urged the Saudi authorities to curb demand growth with some urgency by increasing domestic fuel prices and pushing for greater efficiency. "Saudi Arabia's energy consumption pattern is unsustainable," said the report. "Demand for its own oil and gas is growing at around 7% a year. At this rate of growth, national consumption will have doubled in a decade." According to the Joint Organizations Data Initiative, which publishes official oil production figures from participating countries, Saudi Arabia produced 9.4 million barrels a day of oil in October and consumed 2.0 million barrels a day. Saudi Officials say the kingdom is able to produce as much as 12.5 million barrels a day, indicating that it could potentially accommodate a doubling of domestic consumption and maintain exports. However, many oil industry experts are skeptical that the Saudis could reach 12.5 million barrels a day of oil production and sustain it for an extended period.
Speculation About Oil - Last Spring, some Democrats and liberals (Ed Schultz and Bernie Sanders spring readily to mind) who have somehow resisted the enlightenment of unfettered free markets suggested that high oil prices are due to speculation. Noah Smith took this subject on, asking the question: "Do speculators cause oil and/or gas prices to rise above their "natural" or fundamental level?" Noah's take is that speculation is innocent, and he cites some corroborating experimental evidence. I'm a big fan, but this time I think Noah missed the point. First, I'll state right up front that futures markets play a vital role in allowing the producers and first-line purchasers of various commodities to be able to stabilize their cash flows and construct realistic business plans. So - yes, futures markets are a good thing. On the other hand, when quizzed by Senator Cantwell on why big, trans-national oil companies should continue to receive multiple billions of dollars in tax breaks, Exxon CEO Rex Tillerson admitted that a good estimate of a supply-demand determined price (considering the price of the next marginal barrel) for crude is in the range of $60 to $70 per barrel.
A Deeper Dive into Oil Pricing - In the previous post, I suggested that speculation is driving oil prices higher than they should be. In this follow-up, I think I can show that oil prices are not behaving in a completely supply-demand determined way. We'll look at price activity, volatility, and an estimate of what rational pricing might be. First, here is Brent Crude spot price activity since 1987, data from the U.S Energy Information Administration. I've taken a weekly average of daily data, and plotted it as of each Friday (it was just a lot easier than trying to work their data table into a daily data plot.) Also included is a 55 week moving average.As you can see, the price really took off after 2000. Coincidentally, the Gramm–Leach–Bliley (Financial Services Modernization) Act of 1999, which undid portions of the Glass-Steagall of 1933, was signed into law on Nov 12 of that year, and the Commodities Futures Modernization Act of 2000 was signed into law on Dec 21 of that year. These new laws allowed mega-consolidation in the finance industry and prohibited the regulation of certain speculative activities.
Vitals Signs: Oil Prices Moving Up - Oil prices are running higher. Nymex crude settled at $101.81 a barrel Thursday, down $1.41 from the previous day, but that’s more than $26 higher than the levels seen early in October. During 2011, oil prices peaked at $113.93 in late April. Improving economic signals in the U.S. along with rising energy demand overseas and tensions surrounding Iran are spurring the latest price increase.
Oil prices will never fall again - So prognosticates oil analyst and energy sector investor Gregor Macdonald, who also expects certain asset classes to make "very large, very surprising moves in 2012."
Tail Risk and Embalming Fluid, in 2012 -The last 18 months have supplied historians with every reason to believe that a replay of the 2008 financial crisis was about to unfold. The difference being that the private sector debt crisis which triggered 2008′s terrible domino event has now been transposed, into a similar risk in sovereign debt. Especially the sovereign debt of peripheral Europe. As a student of macroeconomics, and as one who observes the procession of market psychology—when markets slowly move from the comfort of sleep to the Ker-Pow! of recognition—I am strangely in the position of thinking the following, mildly heretical thought: tail risk in global markets is now much, much lower than most anticipate. For the past three years at this blog, I have articulated the intractable dilemma of debt and resource scarcity that will plague the EU, US, and Japan for the balance of the decade. In short, oil prices are never going to come down again—not for any length of time. And US house prices and US wages are not likely to ever go up again—not for any length of time. The dream of higher wages and lower oil prices is just that. And the utopia of 1999, when purchasing power was flipped (compared to now) and the US Dollar stood like a giant against food and energy, will eventually be accepted as a lost era. Never to be regained.
Waiting for the Great Pumpkin - With the coming of the new year, predictions of what’s in store during the next twelve months are showing up here and there in the peak oil blogosphere: a feature of the season, really, as reliable as the icicles that hang from the roof’s edge outside the window of my study. Like the icicles, they’re enticing to look at; like the icicles, equally, a great many of them are guaranteed to drop to the ground and shatter at some point in the months to come. That’s all the more remarkable in that, by and large, the peak oil community has been pretty much spot on when it comes to the general shape of the future. Five or ten years ago, it bears remembering, nobody else was predicting the sustained oil prices on the far side of $100 a barrel and the global economic gridlock that have become fixtures of the contemporary scene; the peak oil scene had that one nailed. A healthy skepticism toward whatever the current speculative bubble happens to be—tech stocks back in the days when the peak oil blogosphere was first getting under way, real estate in the runup to the 2008 crash, shale gas and shale oil now—has also been a common feature in the peak oil scene throughout its history, even when almost everyone else was cheering along the bubble du jour as the wave of the future.
Oil will decline shortly after 2015, says former oil expert of International Energy Agency - Olivier Rech developed petroleum scenarios for the International Energy Agency over a three year period, up until 2009. This French economist now advises large investment funds on behalf of La Française AM, a Parisian assets management firm. His forecasts for future petroleum production are now much more pessimistic than those published by the IEA. He expects stronger tensions as of 2013, and an inevitable overall decline of oil production "somewhere between 2015 and 2020", in the following exclusive interview. Rech’s outlook serves as another significant contribution to the expanding list of leading sources portraying the threat of an imminent decline in global extraction of crude oil.
US Imposes Sanctions on Iran, But With Exemptions- President Barack Obama signed into law on Saturday a defense funding bill that imposes sanctions on financial institutions dealing with Iran's central bank, while allowing for exemptions to avoid upsetting energy markets. The sanctions target both private and government-controlled banks—including central banks— and would take hold after a two- to six-month warning period, depending on the transactions, a senior Obama administration official said. Under the law, the president can move to exempt institutions in a country that has significantly reduced its dealings with Iran and in situations where a waiver is in the U.S. national security interest or otherwise necessary for energy market stability. He would need to notify Congress and waivers would be temporary, but could be extended. Sanctioned institutions would be frozen out of U.S. financial markets. "Our intent is to implement this law in a timed and phased approach so that we avoid repercussions to the oil market and ensure that this damages Iran and not the rest of the world," the senior U.S. official told Reuters.
U.S. Targets Iran's Central Bank - President Barack Obama signed into law on Saturday sanctions against Iran's central bank, marking the sharpest economic confrontation between Washington and Tehran yet and potentially stoking tensions in the Persian Gulf. The measure, which Congress passed as part of the 2012 National Defense Authorization Act, penalizes foreign financial institutions that do business with Iran's central bank, Bank Markazi. Mr. Obama has some flexibility in determining the strength and scope of the sanctions, which are intended to make it more difficult for Iran to sell its oil. But the administration intends to move forward with implementing the law in a way that doesn't damage the global economy, senior administration officials said. "The president will consider his options, but our intent—our absolute intent—is to in a timed and phased way implement this legislation so it can have the impact that Congress intended and the president agrees with." Some U.S. officials believe that Tehran will view the bill signing itself as an act of war. The move could push Iran to take drastic measures, including an attempt to close the Strait of Hormuz, the world's most important channel for shipping crude oil. But while Iran's navy could theoretically disrupt tanker traffic there, which would send oil prices skyrocketing, in reality it would be almost impossible for Iran to block the waterway.
Iran currency slips to record low after new US sanctions - Iran's currency, the rial, slipped to a record low Sunday, the day after the United States imposed extra sanctions targeting the Islamic republic's central bank and financial sector. The state news agency IRNA and an Iranian website tracking the currency said the rial's street value at money changers' slid to around 16,000 to the dollar. That represented a huge difference with the official central bank rate of 11,179 rials to the dollar. On Saturday, US President Barack Obama signed the new sanctions into law. The measures aim to further squeeze Iran's crucial oil revenues, most of which are processed by the central bank, by making foreign firms choose between doing business with the Islamic republic or the economically mighty United States. They were being imposed as part of a Western push to force Iran to halt its nuclear programme, which the United States and its allies believe is being used to develop atomic weapons despite Tehran's denials. Iran, the second-biggest producer in OPEC after Saudi Arabia, depends on oil sales for 80 percent of its foreign revenues. The European Union is mulling an embargo on buying Iranian oil, on which a decision could be announced at an EU foreign ministers' meeting at the end of the month.
The high price of oil has blocked the West's economic escape route - The global economy will grow by around 3pc this year, down from 4pc in 2011. The US should manage a 2pc expansion, while Britain and the eurozone will struggle. A West European recession, the UK included, now looks unavoidable. The emerging markets, meanwhile, will keep forging ahead during 2012. Even if China slows a bit, the world's second-largest economy should expand by 8pc to 9pc. The "big four" emerging markets – China, India, Russia and Brazil – now make up a quarter of the global economy. These "emerging giants" will account for the lion's share of world growth in 2012, just as they did in each of the past three years. Such countries aren't insulated from the Western world's sovereign debt debacle. Far from it. But with lower debts, much higher reserves, relatively stable banking systems, and trading ever more between themselves, the emerging markets will outpace the "advanced industrialised nations" this year too. During previous slowdowns, lower fuel costs have boosted the profitability of Western firms. Reduced inflationary pressures have provided our central banks with the room to cut interest rates. So cheaper oil has helped the West climb out of periodic economic slumps. Yet this vital mechanism is now broken.
Should We Be Worried About Iran? - If the Iranian government makes good on its recent threats to stop oil shipments through the Strait of Hormuz, oil prices would shoot up $20 to $30 a barrel within hours and the price of gasoline in the United States would rise by $1 a gallon. Such a steep spike in crude oil prices would plunge the United States and Europe back into recession, said Money Morning Global Energy Strategist Dr. Kent Moors. Iran just concluded a 10-day military exercise intended to prove to the West that it can choke off the flow of Persian Gulf oil whenever it wants. The world's fourth-biggest oil producer is unhappy with fresh U.S. financial sanctions that will make it harder to sell its oil, which accounts for half of the government's revenue. "Tehran is making a renewed political point here. The message is - we can close this anytime we want to," said Moors, who has studied Iran for more than a decade. "The oil markets are essentially ignoring the likelihood at the moment, but any increase in tensions will increase risk assessment and thereby pricing."
Iran successfully test fires long-range missile Iran on Monday successfully tested a Ghader ground-to-ship cruise missile on the last day of navy war games near the Strait of Hormuz, the official news agency IRNA quoted a navy spokesman as saying. "This missile built by Iranian experts successfully hit its target and destroyed it," Commodore Mahmoud Mousavi was quoted as saying. He said it was "the first time" a Ghader missile had been tested. The Ghader missile is said to have a range of 200 kilometres (120 miles), which is generally considered medium-range or even short-range for a cruise missile, even though IRNA described it as "long-range."
Iran Says It Has Produced First Nuclear Fuel Rod - — Iranian scientists have produced the nation's first nuclear fuel rod, a feat of engineering the West has doubted Tehran capable of, the country's nuclear agency said Sunday. The announcement marks another step in Tehran's efforts to achieve proficiency in the entire nuclear fuel cycle — from exploring uranium ore to producing nuclear fuel — despite U.N. sanctions and measures by the U.S. and others to get it to halt aspects of its atomic work that could provide a possible pathway to weapons production. Tehran has long said it is forced to seek a way to manufacture the fuel rods on its own, since the sanctions ban it from buying them on foreign markets. Nuclear fuel rods are tubes containing pellets of enriched uranium that provide fuel for nuclear reactors. Iran's atomic energy agency's website said the first domestically made rod has already been inserted into the core of Tehran's research nuclear reactor. But it was unclear if the rod contained pellets or was inserted empty, as part of a test.
Tehran ‘pursuing nuclear weapons' - France insisted yesterday that Iran is developing nuclear bombs and urged Europe to follow the US lead by slapping an embargo on its oil exports and freezing its central bank assets by next month. The call came as Iran's military warned one of the US navy's biggest aircraft carriers to keep away from the Gulf, in an escalating showdown over Tehran's nuclear drive that could pitch into armed confrontation. French Foreign Minister Alain Juppe said that despite Tehran's insistence that its nuclear programme was exclusively for peaceful purposes, he was convinced "Iran is pursuing the development of its nuclear arms."
How Iran’s Saber Rattling Could Affect Oil Prices and the Environment - It’s easy to see the Iranian Mullahs and their allied minions as a world threat. The country is a significant source of crude oil, has a strategic location over the Strait of Hormuz, seems to be busily building an atomic arsenal with missile delivery systems, supports radical and violent extraterritorial groups and many believe is directly funding world terrorism against both Muslims and others. The atom bomb matter has the largest destructive and life risking potential and has driven other nations to respond. So far that has only gone as far as economic sanctions, an idea of limited effect. But the suspicion is the effect is having an impact, and if Iran is bright enough to use the sanctions as a tool to justify an oil price increasing effect – thus you have a threat to close the Strait of Hormuz – for whatever the real reason. Iranian Vice President Mohammad Reza Rahimi has warned that Iran will not allow a “drop of oil” to pass through the Strait of Hormuz if the West widens sanctions against his country. Iranian Navy Admiral Habibollah Sayyari said it would be “really easy” for his forces to block the waterway through which a sixth of the world’s oil flows. At issue is 40% of the world’s tanker-borne oil passes through the Straits. Iran, some of Iraq’s and Bahrain, Kuwait, Qatar, Saudi Arabia and the United Arab Emirates all ship crude oil out the Strait.
Oil Price Would Skyrocket if Iran Closed the Strait of Hormuz— If Iran were to follow through with its threat to blockade the Strait of Hormuz, a vital transit route for almost one-fifth of the oil1 traded globally, the impact would be immediate: Energy analysts say the price of oil would start to soar and could rise 50 percent or more within days. An Iranian blockade by means of mining, airstrikes or sabotage is logistically well within Tehran’s military capabilities. But despite rising tensions with the West, including a tentative ban on European imports of Iranian oil announced Wednesday, Iran is unlikely to take such hostile action, according to most Middle East political experts. Iran’s own shaky economy relies on exporting at least two million barrels of oil a day through the strait, which is the only sea route from the Persian Gulf and “the world’s most important oil choke point,” according to Energy Department analysts. A blockade would also punish China, Iran’s most important oil customer and a major recipient of Persian Gulf oil. China has invested heavily in Iranian oil fields and has opposed Western efforts to sanction Iran over its nuclear program2. Despite such deterrents to armed confrontation, oil and foreign policy analysts say a miscalculation is possible that could cause an overreaction from one side or the other.
As currency crisis and feud with West deepen, Iranians brace for war - At a time when U.S. officials are increasingly confident that economic and political pressure alone may succeed in curbing Iran’s nuclear ambitions, the mood here has turned bleak and belligerent as Iranians prepare grimly for a period of prolonged hardship and, they fear, war. This stark contrast has been evident in the Iranian capital this week as a top military commander declared a “critical point” in the country’s long feud with the West and ordinary Iranians stocked up on essential supplies. Merchants watched helplessly as the Iranian currency, the rial, shed more than a third of its value, triggering huge increases in the prices of imported goods. The sense of impending confrontation is not shared in Washington and other Western capitals, where government officials and analysts expressed cautious satisfaction that their policies are working. Former and current U.S. government officials did not dismiss the possibility of a military confrontation but said they saw recent threats by Iranian leaders — including warning a U.S. aircraft carrier this week not to return to the crucial Strait of Hormuz — mainly as signs of rising frustration. U.S. officials say this amounts to vindication of a years-long policy of increasing pressure, including through clandestine operations, on Iran’s clerical rulers without provoking war.
War Imminent In Straits Of Hormuz? $200 A Barrel Oil? - There are dim lights at the end of the seemingly darker and darker tunnel. The proposed sanctions legislation allows Obama to waive sanctions if they cause the price of oil to rise or threaten national security. Furthermore, there is the wild card of Iran’s oil customers, the most prominent of which is China, which would hardly be inclined to go along with increased sanctions. But one thing should be clear in Washington – however odious the U.S. government might find Iran’s mullahcracy, it is most unlikely to cave in to either economic or military intimidation that would threaten the nation’s existence, and if backed up against the wall with no way out, would just as likely go for broke and use every weapon at its disposal to defend itself. Given their evident cyber abilities in hacking the RQ-170 Sentinel drone and their announcement of an indigenous naval doctrine, a “cakewalk” victory with “mission accomplished” declared within a few short weeks seems anything but assured, particularly as it would extend the military arc of crisis from Iraq through Iran to Afghanistan, a potential shambolic military quagmire beyond Washington’s, NATO’s and Tel Aviv’s resources to quell. What is occurring now off the Persian Gulf is a diplomatic and military game of chess, with global implications.
Oil jumps 4 percent on Iran anxiety (Reuters) - Oil prices surged on Tuesday, with U.S. crude hitting the highest settlement since May, fueled by strong economic data from the United States and China and mounting concern about supply disruption from Iran. Brent crude jumped $5 in late activity as markets latched on to data showing U.S. construction spending near a 1-1/2 year peak in November and China manufacturing data that eased concerns of a slowdown in the world's No. 2 oil consumer. Tuesday's gains on the first day of trading in the new year added to Brent's 13 percent rise in 2011, with support in recent weeks coming from Iranian threat's to choke of crude oil shipments through the strategic Strait of Hormuz in Tehran's ongoing standoff with the West. "The supportive economic data and the geopolitical concerns are furthering the crude oil rally," . "The temperature is going up every day now on the Iran situation -- new sanctions, new missile launches, and saber rattling are all contributing," Brent February crude rose $4.75 to settle at $112.13 barrel, the highest close since the November 15 settlement at $112.39. It reached as high as $112.44 a barrel in post-settlement activity.
EU Governments Moving Closer to Iran Oil Embargo as Greece Lifts Objection - European Union governments moved closer to halting oil purchases from Iran, stepping up the confrontation over the Islamic republic’s nuclear program. EU foreign ministers are aiming to announce harsher sanctions on Iran’s energy and banking industries at their next meeting on Jan. 30 after Greece lifted its objections to an oil embargo. “We want to tighten sanctions on Iran -- the things that have been mentioned are the oil sector and the financial sector,” EU spokesman Michael Mann said by telephone in Brussels today. French Foreign Minister Alain Juppe said in Lisbon today that he hopes a decision about an embargo on Iranian oil exports may be adopted at the Jan. 30 meeting of foreign ministers. The U.S. today welcomed the push toward an embargo.
South Korea Increases Oil Deal with Iran -South Korea has made an agreement to increase its oil business dealings with Iran and helping to sabotage U.S. economic sanctions against the Iranian Republic. The southeastern Asian nation announced Wednesday that it will buy around 10 percent of its crude from Tehran this year, a slight increase over 2011. SK Energy will buy the additional crude, taking a total of about 130,000 bpd (barrels per day) in 2012. Hyndai Oilbank, the other importer, will take 70,000 bpd, but said it is making contingency plans for any interruption in supplies. "We are planning for various scenarios, including diversifying supply lines, if the situation changes," a company spokesman said. South Korean refiners purchased 190,000 bpd (barrels per day) from Iran last year, according to the Reuters news agency. The country, which rates as the fifth-largest oil importer in the world, will meet with the U.S. to request an exemption from sanctions signed into law by President Barack Obama on Saturday. The sanctions could block refiners from paying for Iranian oil.
UPDATE 1-Turkey to seek US waiver on Iran oil -energy official Reuters (Reuters) - Turkey will seek a waiver from the United States to exempt its biggest refiner Tupras from new U.S. sanctions on institutions that deal with Iran's central bank, a Turkish energy ministry official told Reuters on Wednesday. U.S. President Barack Obama signed the new sanctions into law on New Year's Eve, which if implemented fully would prevent most refineries from paying for Iranian crude, the first Western measure that could have serious impact on Iran's oil industry.The law would strip any financial institution dealing with Iran's central bank from access to the U.S. financial system.However, the law allows Obama to issue waivers to firms in countries that significantly reduce dealings with Iran, or at any time when it is either in the U.S. national interest or necessary for energy market stability.U.S. officials have said they will discuss with allies how to implement the law without causing havoc in oil markets.U.S. ally Turkey gets about 30 percent of its oil from neighbour Iran, and Tupras - Turkey's biggest crude oil importer, owned by its largest conglomerate, Koc Holding - is a big buyer of Iranian crude.
Quid Pro Quo: IMF Cash For Europe In Exchange for Iran Oil Ban? - Europe may have just traded a U.S.-pushed Iranian oil embargo in exchange for Washington’s support of International Monetary Fund bailout loans to Italy and Spain, if one economist’s speculation is right. Jacob Kirkegaard, a fellow at the Peterson Institute for International Economics, speculates the timing Europe’s newly-proposed ban on Iranian oil imports is too fortuitous to be purely coincidental. Greece, Spain and Italy–in that order–heavily depend on Iranian crude and have been the most resistant to an embargo. They are now no longer fighting a ban–Italy has stated it would support it in principle while the others have signaled they wouldn’t stand in the way. Each of those countries are also the current epicenters of Europe’s sovereign debt crisis. Athens is in the middle of negotiating an agreement with bondholders on a debt deal that will pave the way for a near doubling of emergency loans, including from the IMF. Italy has to roll over nearly $340 billion in debt this year, but the cost of borrowing has soared beyond levels economists say is sustainable. And Spain’s banks are facing a housing bubble that could very well mean Madrid must soon ask for IMF assistance. Meanwhile, each time the possibility of new IMF loans to Italy or Spain has been raised among members of the Group of 20 nations, Washington has pushed back. But rather than maintaining such opposition, Kirkegaard said he sees it as entirely rational horse-trading for U.S. Treasury Secretary Timothy Geithner to now give reluctant consent for the fund to help play savior in Europe in exchange for Europe supporting an oil embargo. [The U.S. is the only country with veto power on the IMF's executive board.]
NYT Misleads Readers on Iran Crisis - In two articles yesterday (1/5/12), the New York Times misled readers about the state of Iran's nuclear program. On the front page, the Times' Steven Erlanger reported this: The threats from Iran, aimed both at the West and at Israel, combined with a recent assessment by the International Atomic Energy Agency that Iran's nuclear program has a military objective, is becoming an important issue in the American presidential campaign. There is no such International Atomic Energy Agency assessment. The IAEA report the Times is mischaracterizing raised questions about the state of the Iranian program, and presented the evidence, mostly years old, that Iran's critics say points towards a weapons program. (This evidence has been challenged by outside analysts--see FAIR Media Advisory, 11/16/11.) But the IAEA report made no firm conclusion that Iran had a nuclear weapons program, and noted that its inspections of Iran's facilities continue to show no diversion of uranium for military purposes. Elsewhere in the Times, readers saw this in a piece by Clifford Krauss about a potential conflict over the Strait of Hormuz: Various Iranian officials in recent weeks have said they would blockade the strait, which is only 21 miles wide at its narrowest point, if the United States and Europe imposed a tight oil embargo on their country in an effort to thwart its development of nuclear weapons.
Art Cashin Explains What Is Really Happening In Iran - Despite the barrage of geopolitical headlines involving Iran, and as of today, the US and Israel, especially as pertains to wargame exercises in the Straits of Hormuz, a different, and potentially much more important story is to be found in the country's capital markets, and specifically its currency, which has continued to tumble ever since Obama signed the Iran financial boycott on New Year's Day as reported here. And, as we predicted, it is the aftershocks of the boycott which may have the most adverse impact on geopolitics. Because if the Iran regime finds itself in a lose-lose situation with its economy imploding and its currency crashing, the opportunity cost of doing something very irrational, from a military standpoint or otherwise, gets lower and lower. Then again, something tells us the US administration has been well aware of this sequence of events all along. Here is Art Cashing explaining it all.
The US-Iran economic war - Here's a crash course on how to further wreck the global economy. A key amendment to the National Defense Authorization Act signed by United States President Barack Obama on the last day of 2011 - when no one was paying attention - imposes sanctions on any countries or companies that buy Iranian oil and pay for it through Iran's central bank. Starting this summer, anybody who does it is prevented from doing business with the US. This amendment - for all practical purposes a declaration of economic war - was brought to you by the American Israel Public Affairs Committee (AIPAC), on direct orders of the Israeli government under Prime Minister Benjamin "Bibi" Netanyahu. Torrents of spin have tried to rationalize it as the Obama administration's plan B as opposed to letting the Israeli dogs of war conduct an unilateral attack on Iran over its supposed nuclear weapons program. Yet the original Israeli strategy was in fact even more hysterical - as in effectively preventing any country or company from paying for imported Iranian oil, with the possible exceptions of China and India. On top of it, American Israel-firsters were trying to convince anyone this would not result in relentless oil price hikes. Once again displaying a matchless capacity to shoot themselves in their Ferragamo-clad feet, governments in the European Union (EU) are debating whether or not to buy oil from Iran anymore. The existential doubt is should we start now or wait for a few months. Inevitably, like death and taxes, the result has been - what else - oil prices soaring. Brent crude is now hovering around $114, and the only way is up.
Vital Signs: Europeans Pay More for Oil - Europeans are paying more for oil. In dollar terms, the price of a barrel of Brent crude — the European benchmark — has moderated in recent weeks, falling about $8 per barrel from its November peak. But the weakening euro meant that the local-currency oil price fell much less, and now has begun to creep back up.
Refinery Crunch In Europe - A few weeks ago we discussed the pressure the Greeks were under to source their energy needs from Iran since no one else would extend them credit. The European credit strain contagion now appears to be spreading rapidly as Europe's largest independent refiner by capacity, Petroplus Holdings AG, is suspending operations at three plants as banks freeze a $1bn revolving loan facility. S&P cut its rating from B to CCC+ citing a sharp deterioration in the firm's liquidity position. As a pure play refiner, meaning it needs to buy all of its crude supplies (on credit obviously) to feed its plants, it seems evident that both vendor- and bank-financing mechansims are starting to clog up very seriously if the largest independent refiner can't get credit. Bloomberg notes that refining margins are down considerably and we suspect that the closure of the Petroplus plants will help margins implicitly but as headlines show:
China push to put astronaut on the moon - China has declared its intention to land an astronaut on the moon, in the first official confirmation of its aim to go where Americans last set foot nearly 40 years ago. While Chinese scientists have previously discussed the possibility of a manned lunar mission, a government white paper published on Thursday is the first public government document to enshrine it as a policy goal. China will “conduct studies on the preliminary plan for a human lunar landing”, the white paper said. Although a manned moon mission is still some time off – Chinese experts say after 2020 – the statement highlights Beijing’s soaring ambitions just five months after the US retired its space shuttle programme . According to the white paper, which serves as a blueprint for the next five years, China will develop new satellites, accelerate efforts to build a space station and strengthen its research in space. Laying the foundation for a mission to the moon, the government also plans to launch unmanned lunar probes and make “new technological breakthroughs” in human space flights by 2016.
China’s Wen Jiacao sees ‘relatively difficult’ first quarter - Chinese Premier Wen Jiabao said business conditions may be “relatively difficult” this quarter and monetary policy will be fine-tuned as needed.“We see downside pressure on our economy and elevated inflation at the same time,” Wen said during a two-day trip to Hunan province, according to a statement on the government’s website yesterday. “We also face problems of weakening external demand and rising costs for companies.” Economists at Barclays Capital and Bank of America Corp. say the central bank will cut lenders’ reserve requirements before a weeklong Chinese New Year holiday starts on Jan. 23, the second reduction since 2008. The ruling Communist Party is shifting focus to supporting growth rather than damping inflation as Europe’s debt crisis threatens to curb exports. “The government is closely monitoring the downside risks to growth,”. “With an expected deceleration in property investment and exports, we expect to see more weakness in industrial activity.”
China on the verge? - It has become increasingly common to suggest that on top of the European debacle and the sluggish recovery in the United States, China might be on the verge of a collapse, and with it the last bastion of economic growth in the world economy would also be gone. Not only the center is stagnant, but also the periphery of the global economy is very fragile. But the probability of a Chinese slowdown is greatly exaggerated. Paul Krugman, who has been correct about the need for fiscal expansion in the United States, and about the European Central Bank (ECB) mismanagement of the Greek crisis, for example, has suggested that China is in the middle of a housing bubble that can burst at any time. This view insinuates that growth in China is fundamentally dependent on domestic demand, but that the sources of the expansion are fragile. It would be good to check the data, before providing a full reply to the doomsday scenario. First when we look at the decomposition of the sources of growth in China, it becomes clear that since the beginning of the last boom in the periphery the external sector has not been the driving force in China, since imports, particularly of commodities, have grown very fast. Investment and consumption are, on the contrary, the main sources of Chinese growth. So on that one the pessimists’ are correct; growth in China is driven by domestic markets forces.
Asia's double-edged currency sword - The roller-coaster ride for Asian currencies, which saw only the yen and yuan post significant gains for the year against the U.S. dollar, is set to continue in 2012. While Japan actively sought to stem the yen's rise -- drawing U.S. criticism last week -- China intervened to ensure the yuan ended the year at a new high. Both currencies appreciated roughly 5 per cent in 2011 against the U.S. dollar. The opposite approaches illustrate a dilemma facing Asian policymakers as they try to smooth out foreign exchange rate volatility, which shows no sign of abating in the new year. If the currency is too strong, exports get more expensive. Too weak, and imported inflation spikes and domestic buying power fades. Singapore and South Korea provide two examples of how inflation can stay surprisingly high, even as declining global demand curbs exports and saps growth. Both the Singapore dollar and the won slipped against the greenback in 2011. For Japan, which has been battling deflationary forces for two decades, rising prices would be a welcome change. Three times in 2011, Tokyo intervened in the currency market to try to weaken the yen, once with the help of Group of 7 nations after the March earthquake and tsunami, and twice unilaterally.
Chinese audit finds local government debt problems - Local Chinese governments that have borrowed heavily from banks to pay for public works construction and other expenses mishandled $83 billion in debt, according to an audit released Wednesday. The report by the National Audit Office comes amid concern about the ability of Chinese city, county and other local governments to repay borrowing. But it gave no indication the money it cited was lost or stolen. In June, Beijing disclosed that local governments ran up 10.7 trillion yuan ($1.6 trillion) in debt -- equal to about one-quarter of China's annual economic output -- over the past decade. Private sector economists expect Beijing to intervene to repay at least a portion of local debts. An audit released in June said some local governments were not able to pay their debts but gave no forecast of how many might default. The Chinese central bank has tried to allay concern about the debt load, saying its risks were manageable. A large portion of that borrowing paid for projects that were part of China's huge stimulus after the 2008 financial crisis and for schools and other social programs that were promised but not financed by Beijing.
China in the News - While 2011 was a busy year for Europe-watchers, I suspect that 2012 is going to be a big year for China-watchers, at least when it comes to developments that will have the potential to dramatically affect the world's financial system and economy. And as has been the case with the eurozone debt crisis, the most significant developments will probably be purely internal. After years of seemingly unstoppable growth, China's economy has shown some sign of cooling off in recent months. But as always, the sharpest dangers to China's and the world's economy are fundamentally financial. China's property boom seems to be coming to a sputtering halt, and the big question is whether this will turn into a full-blown bubble-burst. But in China such things have an additional layer of significance, because in addition to potentially causing financial disruptions, falling property values could create political disruptions as well. From Marketwatch: China faces social unrest from housing woes— Irate Chinese homeowners are among the top policy concerns for Beijing this year, according to analysts who say weakening house prices are stoking serious tensions. ...City University’s Cheng says tensions over the housing market are emerging, even as authorities are proving more adept at defusing conflict in other areas. He points to December’s protest in the southern costal community of Wukan as one example.
China No Country for Old Men as Government Battles ‘Demographic Tsunami’ - Wang Fuchuan lies in bed wearing a quilted black jacket, with two comforters pulled up to his chin to keep out the chilly November air. The heating at Beijing Songtang Caring Hospice is broken and the 90-year-old’s nostrils are stuffed with toilet paper to stop them dripping. Cockroaches scurry across the floor of his room, which has no running water or toilet. Wang counts himself lucky. While he has no family or savings, he fought against the Japanese and Kuomintang in the 1940s, so the government pays the clinic’s monthly fee of 2,000 yuan ($318). His 200-yuan pension buys food. “A lot of people my age can’t afford to be here,” Wang says. Wang is in the vanguard of a looming demographic shift for China, Bloomberg reports in its Jan. 9 issue. The latest government census shows 178 million Chinese were over 60 in 2009. That figure could reach 437 million -- one third of the population -- by 2050, the United Nations forecasts. While the elderly were looked after in the past by their children, urbanization and the nation’s one-child policy have eroded the tradition of family care.
The Myth of Japan’s Failure - DESPITE some small signs of optimism about the United States economy, unemployment is still high, and the country seems stalled. Time and again, Americans are told to look to Japan as a warning of what the country might become if the right path is not followed, although there is intense disagreement about what that path might be. Here, for instance, is how the CNN analyst David Gergen has described Japan: “It’s now a very demoralized country and it has really been set back.” But that presentation of Japan is a myth. By many measures, the Japanese economy has done very well during the so-called lost decades, which started with a stock market crash in January 1990. By some of the most important measures, it has done a lot better than the United States. Japan has succeeded in delivering an increasingly affluent lifestyle to its people despite the financial crash. In the fullness of time, it is likely that this era will be viewed as an outstanding success story. How can the reality and the image be so different? And can the United States learn from Japan’s experience?
Goldman’s O’Neill Sees Aging Labor in BRICs - Aging and shrinking labor pools are also poised to curb expansion across the so-called BRIC nations that contributed almost half of global growth in the past decade. With fewer youths keeping factories going and more pensioners to support in those markets, the world economy is set to slow, Goldman Sachs Group Inc. (GS) says. The number of people older than 65 in Brazil, Russia, India and China will rise 46 percent to 295 million by 2020 and to 412 million by 2030, according to United Nations projections. The pool of 15 to 24-year-olds, the mainstay for factories like Liu’s that drove China’s boom for three decades, will fall by 61 million by 2030, about the population of Italy. As the BRICs slow down, global growth probably will peak at about 4.3 percent this decade and fall to 3.9 percent in the 2020s, according a Dec. 7 report by Goldman analysts. That’s prompting fund managers including Mark Mobius to invest in so- called frontier markets such as Nigeria, Vietnam and Argentina, where average annual growth is set to rise to 5.1 percent this decade, from about 4.3 percent in the previous 10 years.
Another year older and deeper in debt (Video) It has been calculated the world’s top economies have 5.8 trillion euros worth of borrowings they will have to pay back in 2012. That is the Group of Seven leading economic nations, plus the so called BRICs — the biggest emerging countries Brazil, Russia, India and China. Most of those countries will have to pay higher rates of interest to borrow more. Japan in the top spot with 2.3 trillion euros, followed by the United States with the equivalent of 2.1 trillion euros. Italy needs to refinance 330 billion euros, France 282 billion and Germany 219 billion. Economist Francois Chaulet of Montsegur Finance said: “You see that 2012 starts with a number of problems similar to those we faced in 2011, that is the difficulties European states are having in lowering their debt and restarting their economies. It’s obvious that the economic situation is not very strong and won’t be during the first part of 2012.” The investors who are going to lend those governments money are very wary about how the weak global economy will effect their ability to repay, thence the high interest rates.
A fitting end to a disastrous year in Indian politics -It was a fitting end to a disastrous year for corruption-ridden India’s floundering government, destructive parliamentary opposition, and self-serving politicians. At midnight last night, amid almost unbelievable scenes of chaos and uproar, legislation to introduce an anti-corruption Lok Pal (ombudsman) stalled in parliament with MPs on all sides shouting and screaming at each other about whether and when to vote on over 180 amendments. This was just the latest of a series of examples this year of how coalition leader Sonia Gandhi and prime minister Manmohan Singh are unable to run an effective government. The examples range from their slow handling of corruption scandals, to their clumsy attempts to deal with a mass anti-corruption movement, and their failure to reinvigorate the country’s flagging economy, declining international image, and faltering business confidence. The parliamentary opposition has made matters worse. Scenting blood with a stream of corruption allegations against leading members of the government, it has been in destruction mode – maybe thinking it can force an early general election (though it is itself in no fit shape to fight one). Consequently, India now has a coalition government that cannot govern, partly because of its own internal failings and contradictions, and partly because of a vicious opposition that has no new coherent policies of its own but wants power.
Why India is riskier than China - Steven Roach -Today, fears are growing that China and India are about to be the next victims of the ongoing global economic carnage. This would have enormous consequences. Asia's developing and newly industrialised economies grew at an 8.5 per cent average annual rate over 2010-11 - nearly triple the 3 per cent growth elsewhere in the world. If China and India are next to fall, Asia would be at risk, and it would be hard to avoid a global recession. Yet fears of hard landings for both economies are overblown, especially regarding China. Yes, China is paying a price for aggressive economic stimulus undertaken in the depths of the subprime crisis. The banking system funded the bulk of the additional spending, and thus is exposed to any deterioration in credit quality that may have arisen from such efforts. There are also concerns about frothy property markets and mounting inflation. India is more problematic. As the only economy in Asia with a current-account deficit, its external funding problems can hardly be taken lightly. Like China, India's economic-growth momentum is ebbing. But unlike China, the downshift is more pronounced - GDP growth fell through the 7 per cent threshold in the third calendar-year quarter of 2011, and annual industrial output actually fell by 5.1 per cent in October.
$96b sale likely to deepen India's worst bond losses - India's plan to boost its debt sales for the second time this fiscal year to a record $96 billion (Dh352.502 billion) is threatening to extend the nation's worst bond losses since 2009. Yields on 10-year government notes surged 65 basis points in 2011 to 8.57 per cent as bond prices fell, the biggest increase in Asia after Vietnam. Yields fell 53 basis points to 11.64 per cent in Brazil and declined 50 basis points to 3.41 per cent in China. India sold 7.99 per cent notes due July 2017 at a yield of 8.55 per cent on Friday, the highest level at an auction in two months, according to a central bank statement. Finance Minister Pranab Mukherjee is increasing borrowing to finance a budget deficit as the slowest economic growth since 2009 cuts revenue and a slide in stocks derails plans to sell stakes in state-run companies. Meeting the government's goal to cut its shortfall to a four-year low of 4.6 per cent of gross domestic product by March will be difficult, the finance ministry said last month.
Infrastructure in India: Infrastruggles | The Economist - For the past half decade India’s infrastructure industry has enjoyed a Sea Link moment; a blast of growth when one could imagine that the private sector could deliver all the new roads, bridges, power stations and airports that the country needs so badly. The government says the boom will continue. Over the next five years it predicts that infrastructure investment will reach a new high relative to GDP, with some $1 trillion spent, half of it by the private sector. The trouble with this rosy prediction is that the balance-sheets of many Indian infrastructure firms are as potholed as the roads they resurface. The backdrop is a slowing economy—growth has dipped below 7%—and a deep ditch of debt at infrastructure firms (which typically build, own or operate projects, or do a combination of the three, sometimes in partnership with the state). Government decision-making has slowed, partly due to drift at the top and because officials are scared of being accused of graft.
Education in India - This is related to our recent discussion of why Indian test scores why so low: Estimating the precise enrollment of private schools is tricky. Government officials say more than 90 percent of all primary schools are run by or financed by the government. Yet one government survey found that 30 percent of the 187 million students in grades 1 through 8 now attend private schools. Some academic studies have suggested that more than half of all urban students now attend private academies. In Mumbai, so many parents have pulled their children out of government schools that officials have started renting empty classrooms to charities and labor unions — and even to private schools. In recent years, Indian officials have increased spending on government education, dedicating far more money for new schools, hiring teachers and providing free lunches to students. Still, more and more parents are choosing to go private. “What does it say about the quality of your product that you can’t even give it away for free?” Here is much more.
Anger over secret drug trials on Indian children - Indian activists have reacted angrily after 12 doctors were fined less than $100 each for conducting secret drug trials on children and patients with learning disabilities. The Madhya Pradesh state government said the tests had not been cleared by health authorities, and it added that the doctors refused to disclose further details citing patient confidentiality laws. Anand Rai, a doctor who acted as a whistleblower in the case, told AFP on Tuesday he was angry and frustrated that the scale of the punishment would not deter future illegal trials. “The Madhya Pradesh government has now slapped a nominal 5,000-rupee ($94) penalty on the 12 government doctors who were involved in the bizarre case,” he said. “The penalty was for their failure to inform about the trials.” “All drug trials were performed on patients who had gone to these government hospitals for routine treatment. It’s a criminal offence to put them under drug trials without their consent.”
Revenue fall prompts debt spike - THE Victorian and South Australian governments will add $1.5 billion more in debt this financial year than planned when they crafted their budgets six months ago. Victoria, South Australia and NSW have all released mid-year budget updates revealing collapsing revenues that put forecast surpluses in severe doubt, reports The Australian Financial Review. In the wake of those announcements, Victoria and South Australia have indicated to debt markets that they will substantially boost their borrowings this financial year. Treasury Corporation of Victoria, which handles borrowings for the state government as well as a number of agencies and state-owned companies, has revised upwards its funding task for the current financial year by $741 million to $7.3 billion. The rise is due to changes in the government's financial position,
The long-run effects of the Scramble for Africa - The 'Scramble for Africa' – the artificial drawing of African political boundaries among European powers in the end of the 19th century – led to the partitioning of several ethnicities across newly created African states. This columns shows that partitioned ethnic groups have suffered significantly longer and more devastating civil wars. It also uncovers substantial spillovers as ethnic conflict spreads from the historical homeland of groups partitioned to nearby areas where non-split ethnicities reside.
Has the Spectre of Protectionism Blown Away? - IMF - As the crisis has become protracted and unemployment remains stubbornly high in many economies, there are worrying signs that protectionist pressures may be on the rise. There are plenty of examples: recent actions by Brazil at the World Trade Organization (WTO) aim to use trade remedies to offset currency misalignments, China imposed duties on cars made in the United States, and legislation is pending in the United States to use trade measures to defend against “undervalued” currencies such as the renminbi. But now is certainly not the moment we should be putting jobs and growth to the test. Fortunately fears of a widespread resurgence of 1930’s-style trade protectionism after the 2008 financial crisis proved unfounded. This was thanks, in large part, to a shared responsibility by countries and institutions for the multilateral trading system. Yet, our analysis reveals that advanced economies experiencing the largest increases in unemployment were also those most inclined to impose trade restrictions—as suggested by the number of cases of anti-dumping and countervailing duties initiated against China. In fact, we saw a big uptick in these measures in recent years (see chart).
IMF: Asia Should Prepare to Activate Emergency Programs - Asia should prepare to activate its regional emergency bailout fund and central bank swap line agreements in case Europe’s debt crisis worsens, the International Monetary Fund warned Thursday. “Central bank swap lines and regional reserve pooling arrangements could be further strengthened and activated to address shortages in particular currencies,” IMF staff economists wrote in a fund blog. The IMF has been campaigning to strengthen the global financial safety nets as Europe’s sovereign debt crisis threatens to spiral out of control, potentially engulfing the world in another financial crisis and recession. Besides seeking to boost its own war chests, the IMF has sought to strengthen cooperation with regional financing facilities such as the European Financial Stability Facility or Asia’s Chiang Mai Initiative, a $120 billion agreement of pooled emergency resources.
Why the Russian Economy is No Longer a Big Plus for Putin - Vladimir Putin’s decision to return to the presidency has touched off a wave of protests in Russia. The motives behind the protests are partly social and political (see this recent post), but economics also plays a role in Putin’s fading popularity. It is far from clear that the present regime will be able to continue to offer growth and rising incomes in exchange for a monopoly of political power, as it has in the past. Here are some of the problems facing Russia’s economy in as we look toward the March election and beyond. Putin assumed power as Acting President of Russia on December 31, 1999. That year marked the beginning of the country’s recovery from almost a decade of post-Soviet contraction. By 2004, Putin was confident enough to promise that economic output would double in ten years. As the chart shows, the early 2000s were boom years for Russia. From 1999 to 2008 Russian real GDP, measured in constant rubles, increased by 82 percent. More important for Russian living standards, real GDP measured at purchasing power parity, boosted by steady appreciation of the ruble, increased by 128 percent over the same period. If you choose the right ten years and the right income measure, then, you can say that Putin delivered on his promise. Going forward from 2008, however, things do not look so good.
World-Wide Factory Activity, by Country - Global manufacturing was expanding in much of the world last month, as growth in North America and Asia offset contraction in Europe, according to an index published by J.P. Morgan. The JPMorgan Global Manufacturing Purchasing Managers’ Index rose to 50.8 in December from 49.7 in the previous month. A reading above 50 signifies expansion in the sector. “December saw manufacturing output increase for the first time in five months, as levels of incoming new orders held steady following a four-month sequence of contraction,” J.P. Morgan said in their release. The U.S. continued to register strong numbers, as factory-sector expansion continued to improve in December. Meanwhile, China and Japan moved back into growth territory after registering contractionary numbers in November. The euro zone, which many economists say is facing recession, continued to indicate shrinking manufacturing output. Though, the pace of contraction slowed in many European countries. See a sortable chart of manufacturing activity, by country.
World’s Biggest Economies Face $7.6 Trillion Debt - Governments of the world’s leading economies have more than $7.6 trillion of debt maturing this year, with most facing a rise in borrowing costs. Led by Japan’s $3 trillion and the U.S.’s $2.8 trillion, the amount coming due for the Group of Seven nations and Brazil, Russia, India and China is up from $7.4 trillion at this time last year, according to data compiled by Bloomberg. Ten-year bond yields will be higher by year-end for at least seven of the countries, forecasts show. Investors may demand higher compensation to lend to countries that struggle to finance increasing debt burdens as the global economy slows, surveys show. The International Monetary Fund cut its forecast for growth this year to 4 percent from a prior estimate of 4.5 percent as Europe’s debt crisis spreads, the U.S. struggles to reduce a budget deficit exceeding $1 trillion and China’s property market cools. “The weight of supply may be a concern,” . “Rather than the start of the year being the problem, it’s the middle part of the year that becomes the problem. That’s when we see the slowdown in the global economy having its biggest impact.”
Global Bond Issuance To Top A Staggering $8 Trillion In 2012 - As households are supposedly deleveraging and European nations face austerity, one might suspect that global debt levels were stabilizing or even dropping. Think again. It will likely come as no surprise when we point out that the G-7 nations alone face a massive $7.3 Trillion (with a T) of sovereign-only maturities (and a further $566 Billion in interest payments) in 2012 alone. This incomprehensible number is worsened only in historical comparison as it's current level is 125% higher than was 'expected' at the end of 2010 (and 238% higher than was expected for 2012 at the end of 2009). As Bloomberg points out, Japan tops the list with $3.05tn (equivalent) followed the US at $2.76tn for 2012 as the former peaks in March 2012 (with $678bn due in that month alone) and the latter peaks in this month with January 2012 seeing over $480bn due to mature (and be rolled). But it gets worse for supply - global corporations (dominated by Financials relative to non-Financials), as noted by S&P today, have used the low interest rate environment to modestly relever and face almost $1 Trillion (again with a T) of maturing debt that will need to be rolled in 2012 (with January and March also topping the list) and over $3.1Tn in the next four years. So in the next four years, amid a slowing demand picture thanks to European worries, global corporate debt combined with G-7 sovereign debt maturing is an incredible $18.48 Trillion that will need to be rolled, rehypothecated, and have capital allocated to it (or not).
IMF's Blanchard on Consolidation vs Stimulus - IMF Chief Economist Olivier Blanchard writes about the "four hard truths" from 2011 that should interest most readers. Alike other economists, Blanchard is ambiguous on fiscal consolidation--its magnitude and the timing of when it's implemented. I have previously commented on the unreality of the widely-held idea that the US for instance should splurge now and retrench later based on the observation that America's national government has not managed to decrease its expenditures since 1965. Expanding government generates its own momentum into the future. There's also more than a smidgen of hypocrisy involved now that industrialized countries (from which many of these economist types comes from, you will observe) instead of developing ones are enduring hard times. Go easy on the richer ones, yeah? That said, here is another Blanchard-ism for you concerning how markets seem to welcome announcements of fiscal consolidation but do not welcome the resulting slowdown in growth...
The Year Governments Lost Their Credibility - For most of 2011, it appeared that the year would be decent, if not particularly interesting, for investors. Then Europe announced its second plan to rescue Greece, the first one, reached more than a year earlier, having turned out to be completely inadequate. That’s when 2011 became exciting and the losses began to pile up. The summit meeting of European leaders on July 21 in Brussels called for private investors to take losses of 21 percent on some Greek bonds, but for a rescue package to keep losses from being worse. At first markets reacted with enthusiasm, but that deal did not last long enough to even write out the details. The European leaders had drastically underestimated the problem and misunderstood the risk that fears of default would spread to other countries. Within weeks, it became clear that 2011 would be remembered as the year that governments lost their credibility. Markets, which had always assumed that major Western governments would honor their obligations, struggled to learn to adjust to a new world where that was not so certain.
EU Officials Begin New Year With Calls to Save the Euro - Policymakers marked the 10th anniversary on Sunday of the introduction of euro notes and coins by urging governments in the currency bloc to save and consolidate to overcome their debt crisis. While German Finance Minister Wolfgang Schaeuble called the euro "a clear success story" and pledged the currency would remain stable, he also urged vulnerable debtor states to follow a tough savings course in 2012, boost their competitiveness and work to win back market confidence. "This is not a euro crisis, it is a debt crisis in some euro states," Schaeuble told German newspaper Bild in an interview to be published in Monday's edition of the paper. The crisis that began in Greece more than two years ago has since forced Ireland and Portugal to seek bailouts and now threatens the efforts of the bloc's third largest economy, Italy, to raise 450 billion euros ($580 billion) to finance its debt burden this year. The head of Standard Chartered bank told a British Sunday newspaper that political leaders had yet to offer a meaningful solution to the bloc's debt crisis. "We enter 2012 with a very difficult outlook for the euro zone...with an increasing possibility of countries actually leaving the euro zone,"
Question #8 for 2012: Europe and the Euro - Earlier I posted Ten Economic Questions for 2012. I'll try to add some thoughts, and maybe some predictions for each question. I've been stuck on #8, probably because I'm suffering from European crisis fatigue. It is very disturbing when a key policymaker like German Finance Minister Wolfgang Schaeuble says "This is not a euro crisis, it is a debt crisis in some euro states". Not only is that incorrect, but it is a reminder that the current policy is all stick and no carrot. Where is the growth agenda? The current path of endless austerity, slow wage deflation, and high unemployment in several countries seems politically unsustainable. Much of Europe is probably already in recession, and it could get much worse. It seems only a serious event, what many analysts are calling a "Lehman moment", will shock policymakers into more effective action. But maybe that is too pessimistic. There has been some discussion of a "roadmap" for the issuance of eurobonds (this will probably be discussed on January 9th). And apparently a growth agenda will be discussed at the next summit meeting on January 30th. That sounds like small carrots. A little more inflation would help with adjustments too, but no policymaker will say that openly. And all year there will be significant bond auctions for Italy, Spain, Belgium and France. More market stress is guaranteed.
Euro Is 10 Years Old, but Few Are Celebrating - Ten years later, the word “euro” in a headline is usually paired with the word “crisis.” Instead of hosting celebrations for the 10-year anniversary, policy makers appear to be staying as quiet as possible, as if hoping not to upset the brief calm that has come with the holiday season after European central bankers injected nearly $640 billion into the European banking system in December. In Brussels, there will be neither a ceremony nor even a news conference to mark the occasion. Even without the crisis, the day 10 years ago may be one better quickly forgotten. Far more than the celebrations, what stuck in the minds of consumers after changing to the euro was the rounding up of prices at supermarkets, restaurants and bars. Economists say that the increases were exaggerated and offset by declining prices for bigger-ticket items. But the narrative of opportunistic price-gouging on daily staples has grown rather than shrunk in the collective memory. And the perception is widespread in the euro zone that the cost of living has increased significantly as a result of its adoption.
Europe’s leaders warn of tough 2012 - Europe’s leaders warned 2012 was likely to be tougher than 2011, when spiralling borrowing costs forced political change in Italy and Spain and threatened the survival of the euro. In a sombre address on national television Nicolas Sarkozy, president of France, said the gravest crisis Europe has faced since the second world war “is not over” and Angela Merkel, German chancellor, told German voters “next year will no doubt be more difficult than 2011”. The euro crisis in 2011 forced borrowing costs higher for Italy and Spain and led to the dismissal of Silvio Berlusconi’s centre-right government in Rome and the fall of the Socialist administration of José Luis Rodríguez Zapatero in Madrid. It also undermined sentiment in the euro which had a second consecutive year of losses against the dollar and fell to its lowest level in a decade against the yen. Speaking on national television on Saturday, Ms Merkel said Europe was experiencing its “harshest test in decades” but would ultimately be made stronger by the crisis. Mr Sarkozy, who is facing a tough re-election campaign later this year, said French voters were more anxious at the end of the year than they were at the beginning. “This extraordinary crisis, without doubt the gravest since the second world war, is not over … you are ending the year more anxious for yourselves and your children.”
Economics in 2012: no gain, just pain as austerity brings misery to all - With the eurozone on the brink of a new recession, this will be the year when millions of people bear the brunt. The fluctuations of the financial markets and the relentless round of make-or-break euro-summits gripped the attention in 2011, but this will be the year when the shockwaves are felt by millions of people in Europe and beyond. Throughout 2011, the language of bond yields, AAA ratings and credit default swaps leapt from City trading floors into everyday chit-chat as the eurozone crisis spiralled out of control. Instead of answering first to their electorates, Europe's politicians became fixated on sating the demands of anxious investors in the bond markets for ever more drastic spending cuts. Preventing Italian bond yields from topping 7%, and protecting France's AAA credit rating became central policy aims. But reducing the eurozone's malaise to numbers flashing on a screen only served to mask the fact that millions of livelihoods were at stake in what the technocrats call the "real economy", but most of us would call real life. The policy of collective austerity imposed at the behest of the money men has driven the eurozone to the brink of a new recession. In 2012 it will be swept over the edge, carrying with it the jobs of millions.
Sarkozy rules out new austerity plan for 2012 (TV video) - French President Nicolas Sarkozy warned on Saturday that the country's future hung in the balance in 2012 amid the eurozone debt crisis but said ratings agencies would not decide French policy. "France's destiny could once again be tipped" in 2012, Sarkozy said in a televised New Year's address. "Emerging from the crisis, building a new model for growth, giving birth to a new Europe -- these are some of the challenges that await us." "This crisis... probably the most serious since World War II, this crisis is not over," Sarkozy said. "Yet there are reasons for hope... We must, we can keep confidence in the future," he said.The speech was Sarkozy's last New Year's address before France heads to the polls for the first round of a presidential election in April.
In Euro Zone, Austerity Seems to Hit Its Limits - Europe’s leaders braced their nations for a turbulent year, with their beleaguered economies facing a threat on two fronts: widening deficits that force more borrowing but increasing austerity measures that put growth further out of reach. Saying that Europe was facing its “harshest test in decades,” Chancellor Angela Merkel of Germany warned on New Year’s Eve that “next year will no doubt be more difficult than 2011” — a marked change in tone from a year ago, when she praised Germans for “mastering the crisis as no other nation.” Her blunt message was echoed in Italy, France and Greece, the epicenter of the debt crisis, where Prime Minister Lucas Papademos asked for resolve in seeing reforms through, “so that the sacrifices we have made up to now won’t be in vain.” While the economic picture in the United States has brightened recently with more upbeat employment figures, Europe remains mired in a slump. Most economists are forecasting a recession for 2012, which will heighten the pressure governments and financial institutions across the Continent are seeing.
Austerity Reigns Over Euro Zone as Crisis Deepens - Europe’s leaders braced their nations for a turbulent year, with their beleaguered economies facing a threat on two fronts: widening deficits that force more borrowing but increasing austerity measures that put growth further out of reach. Saying that Europe was facing its “harshest test in decades,” Chancellor Angela Merkel1 of Germany warned on New Year’s Eve that “next year will no doubt be more difficult than 2011” — a marked change in tone from a year ago, when she praised Germans for “mastering the crisis as no other nation.” Her blunt message was echoed in Italy, France and Greece, the epicenter of the debt crisis, where Prime Minister Lucas Papademos asked for resolve in seeing reforms through, “so that the sacrifices we have made up to now won’t be in vain.” Adding to the gloomy outlook is the prospect of a downgrade in France’s sterling credit rating, a move that analysts say could happen early in the new year and have wide-ranging consequences on efforts to stabilize Europe’s finances.
European Manufacturing Still Contracting? - So saith Markit in their latest Purchasing Managers Survey. The above graph shows the historical correlation between the PMI and change in actual output according to Eurostat. Markit is below the 50 level associated with contraction, but nowhere near as bad as 2008 (yet, anyway). In other news - Italian 10 year bonds have been back over 7% throughout the holiday season: So Europe is still some way from having resolved its problems.
Euro-Zone Manufacturing Activity Falls for Fifth Month - Manufacturing activity in the euro zone declined for the fifth straight month in December, although less sharply than earlier in the fourth quarter, according to a survey of purchasing managers released Monday. The survey is consistent with other indicators of recent activity, and together the numbers suggest the euro-zone economy contracted during the final three months of the year. Markit Economics said its Purchasing Managers Index for the sector rose to 46.9 from 46.4 in November, in line with expectations and below the 50.0 threshold that distinguishes an expansion
Euro zone manufacturing downturn extends to 5th month: PMI (Reuters) - Euro zone manufacturing activity declined for a fifth consecutive month in December, although at a slightly slower rate than November's 28-month record low, a survey showed on Monday, suggesting the decline would continue in the early months of 2012. Markit's Eurozone Manufacturing Purchasing Managers' Index (PMI) rose slightly in December to 46.9 from November's 46.4, but marked its fifth month below the 50 mark that divides growth from contraction. It was unchanged from an earlier preliminary reading. Survey compiler Markit said levels of production and new orders fell in all of the euro zone countries covered by the survey for the second month running. "Despite the rate of decline easing slightly in December, production appears to have been collapsing across the single currency area at a quarterly rate of approximately 1.5 percent in the final quarter of 2011," "The survey also points to a strong likelihood of further declines in the first quarter of the new year, with producers cutting back headcounts, inventories and purchasing."
Eurozone manufacturing 'stuck in reverse' - The eurozone manufacturing sector was in reverse for the fifth month in a row in December due to fewer orders, a global economic slowdown and financial market upheaval, a key survey showed Monday. With recession looming in 2012 across the 17-nation bloc, every state recorded drops in production for the second month running, according to the purchasing managers' index (PMI) compiled by Markit research firm. "Eurozone manufacturing is clearly undergoing another recession," said Markit chief economist Chris Williamson. The PMI, a closely-watched survey of 3,000 manufacturing firms, hit 46.9 points in December, slightly up from 46.4 points in November, when it reached a 28-month low. Any score below 50 indicates contraction. "Despite the rate of decline easing slightly in December, production appears to have been collapsing across the single currency area at a quarterly rate of approximately 1.5 percent in the final quarter of 2011,"
PMI data underline euro-zone recession fears The final December reading of the Markit purchasing-managers index for the manufacturing sector rose to 46.9 from a 28-month low of 46.4 in November, matching an earlier estimate. "Euro-zone manufacturing is clearly undergoing another recession,” said Chris Williamson, chief economist at Markit. “Despite the rate of decline easing slightly in December, production appears to have been collapsing across the single-currency area at a quarterly rate of approximately 1.5% in the final quarter of 2011.” For the second month in a row, all nations covered by the survey reported a decline in output. Williamson said it was particularly worrying to see new orders falling at a far faster rate than output. That indicates firms have relied on orders placed earlier in the year to sustain current production levels, he said.
Portugal Car Sales Plunge 60% in December, 31% for Entire Year; Spain Car Sales Plunge 17.7% to 1993 Levels - Things are not starting off on a good foot for Portugal or Spain, the two countries where the European sovereign debt crisis is most likely to strike early in 2012. Via Google Translate, please consider The sale of passenger cars dropped 31.3% in Portugal in 2011 The sale of passenger cars in Portugal fell to 31.3 percent in 2011 compared with the previous year to sell a total of 153,433 units, reported the Automobile Association of Portugal (ACAP). This marked reduction was driven by the results of last December, when sales fell 60% over the same month last year. Also from El Economista via Google Translate, please consider Car sales fell 17.7% in 2011 in Spain, near 1993 levels Registrations of cars and SUVs in Spain stood at 808,059 units in 2011, resulting in a decrease of 17.7% compared to previous year's figure, according to manufacturers' associations (Anfac) and sellers (Ganvam). During the last month of last year, deliveries of cars in the Spanish market reached 66,458 units, representing a decrease of 3.6% compared to data recorded in December 2010. These figures show that 2011 was one of the worst year ever in terms of volume of registrations in Spain and Spanish car market place at levels close to those recorded in 1993 when 792,500 units were delivered.
Unemployed Portuguese told to 'just emigrate' - Hounded by the economic crisis that shows no signs of letting up and by political leaders of all stripes, Portugal's conservative Prime Minister Pedro Passos Coelho sent out an unprecedented message to his fellow citizens: Emigrate. A wave of indignation was triggered when Passos Coelho, in the face of the growing unemployment that is hitting young people and educators extremely hard, suggested to teachers on December 18 that as an alternative they could move to Portuguese-speaking countries like Brazil or Angola. The next day, several ministers applauded the prime minister's remarks, saying his suggestion was a valid solution, especially for teachers. But the governments of Angola and Brazil quickly responded, saying they had no immediate need for teachers. Surveys indicate that young people between the ages of 25 and 34 are the most interested in moving abroad. Joao Peixoto, a researcher at the School of Economics and Management (ISEG), told the Publico newspaper that in order to emigrate, "it's not enough for things to be bad here; it's also necessary for us to have a place to go".
Promises Go Out the Window as Spain Undertakes Huge Tax Increase Coupled With Biggest Budget Cut in History; Depression in Spain will Worsen - Courtesy of Google Translate, please consider Rajoy approves the biggest cut in history and a large tax increase Everyone knew it. Above all, Mariano Rajoy , who had already pointed to the environment for months that the deficit would be 8%. Not counted in public, but privately the PP did not talk about something else. And yet, throughout the campaign, and the investiture debate, said the PP government would not raise taxes. But at the moment of truth, the vice president, Soraya Saenz de Santamaria , and Rajoy, who avoided appearing, announced the second largest tax increase in recent history of Spain. And the biggest cut in public spending of democracy in one fell swoop: 8,900 million euros. And that, he said, is only "the beginning of the beginning." The vice president announced that the estimated deficit will go to 8% , two points above the 6% expected, mainly because of the autonomous communities. This new deficit figure implies that the total cut to achieve the 4.4% in 2012, will be more than 36,000 million. It was the figure that ran for months in the PP-and well-published, but Rajoy made the debate with the official inauguration: 16,500 million. Before happened in Portugal, where the Conservatives won the election promising not to raise taxes and then did the opposite. Now comes Spain.
The Rain In Spain Falls Mainly On The Journalists, It Seems - Things in Spain are never exactly what they seem to be. This is a painful lesson that even Angela Merkel must have learnt in recent days, especially since she put her credibility so much on the line in backing the country’s deficit reduction efforts. “Spain has really done its homework and I think it is on the right track,” is the message she has been trying to sell to the world. Naturally then she will not have been amused to learn last Friday that rather than the 6% promised under the Spanish stability programme, the country’s deficit in 2011 is going to be something like 8%. Some sort of overshoot was long being anticipated, but such an overshoot? Naturally it isn’t (quite) Greek proportions, but it is still hardly evidence for a credible and praiseworthy effort. This is the thing about Spain, it obviously isn’t Greece, but still all isn’t quite what it should be. Add to this deficit result the fact that the Bank of Spain is reported to be frantically pressuring banks into revising the valuation of their property asssets following the publication by ratings agency Fitch of a report which claims they are currently on average 43% overvalued.
Spain warns deficit could top 8% - Spain's public deficit for 2011 may be higher than the 8 per cent of GDP forecast by the new government, the economy minister said on Monday, fuelling fears the country faces a prolonged period of tight budgets and economic contraction. Spain had originally targeted a 2011 deficit of 6 per cent of gross domestic product, but the newly elected conservatives said on Friday the deficit would be 8 per cent. It said it would now have to work hard to hit this year's tough deficit-reduction goals in an economy seen tipping back into recession this quarter and announced new tax rises and spending cuts. Friday's announcement that the deficit would be as high as 8 percent of GDP has reignited market concerns about the financing needs of indebted euro zone countries and put downward pressure on the euro, which hit a decade low versus the yen on Monday.
Spain Releases Another Stunner: Deficit Could Be Greater Than 8% Of GDP - One of the biggest headlines that floated under the radar late last week was the announcement by Spain that its budget deficit would soar well higher than the expected 6% of economic output and instead be at 8% of GDP, which while ignored by the broader media was certainly noted by the EURUSD which tumbled on the news. Probably the most humorous response came from the neo-feudal viceroy of the PIIGS Olli Rehn who was displeased. From Reuters: "The European Commission regretted missed fiscal targets announced in Spain on Friday, but hailed the government's announcement of an austerity plan intended to slash the Spanish public deficit. "I regret the sizable fiscal slippage" to a deficit of 8.0 percent of GDP instead of 6.0 percent initially targeted, Economic Affairs Commissioner Olli Rehn said, while welcoming the new measures announced from Madrid." We in turn regret that a year after adopting so-called austerity, Spain still has not understood that it means cutting the deficit, not blowing it up. Because just like in Greece, sooner or later the Germans will come knocking and demanding every last shred of sovereign independence from its bevy of debt/bailout slaves.
Spain revises up deficit and raises taxes --- Spain's new government warned Friday that the country's budget deficit will be much higher than anticipated this year, as it unveiled a first batch of austerity measures that include surprise income and property tax hikes. Following the new conservative government's second Cabinet meeting, the budget deficit for this year was revised up to 8 percent of national income from the previous government's forecast of 6 percent. Alongside the upward revision, which comes amid predictions that the Spanish economy will soon be back in recession, the government headed by Prime Minister Mariano Rajoy announced further measures to get a handle on its debts, including €8.9 billion ($11.5 billion) in spending cuts. "This is the beginning of the beginning," government spokeswoman Soraya Saenz de Santamaria said. She said more reforms and austerity will come in 2012.
Spain, Germany, France Debt Insurance Costs Rise -- French government bond yields rose Tuesday as dealers tried to make room for bond supply later this week, with worries over the country losing its coveted triple-A rating also keeping investors cautious. Spanish bonds also suffered after the new government signalled that the budget deficit in 2011 would be higher than previously estimated, spurring investors to book profits after a recent rally. Italian bond yields meanwhile eased with traders citing purchases by the European Central Bank, although the 10-year yield was still just shy of the psychologically crucial 7% mark that in the past toppled Greece, Ireland, and Portugal. The 10-year French bond yield rose by five basis points to 3.26%, while the corresponding Spanish bond yield climbed by 19 basis points to 5.26%, according to Tradeweb.
Eurozone Retail Trade Falls Below 2009 Trough - Eurostat has released Novemember retail trade figures and the retail economy continues to contract: It was contracting slowly all last year but the contraction seems to be accelerating slightly. One noteworthy milestone is that in the Eurozone (pink line) retail trade (on a real and seasonally adjusted basis) has now fallen below the lowest levels of the 2008-2009 recession. So the partial recovery in late 2009 and 2010 has been entirely wiped out. There are wide disparities in where the pain is falling. This graph shows year over year change in retail trade (in most cases for November but in a few cases for October where the former is not disclosed yet):The pain is very great in Greece, Portugal, and Spain - and not much better in Denmark and Bulgaria.
Italian lawmakers’ $14,000 monthly salary outpaces EU colleagues, is target of reform - A government-mandated report has confirmed what many Italians long suspected: The €11,000 ($14,300) that Italian lawmakers earn each month far outpaces what their peers in some of Europe’s largest economies get. Italy’s bloated public sector and the privileges of its political elite have come under fire as the country battles its debt crisis with tax hikes, labor market and pension reforms that are hurting ordinary Italians.Premier Mario Monti has vowed to trim the cost of governing as part of his austerity measures, and has renounced his own salary as premier and economy minister. The report, published Tuesday, looked at comparisons between labor costs for lawmakers in Italy compared to France, Germany, Spain, the Netherlands, Belgium and Austria. It also considered 34 public agencies in Italy to see if there were analogous ones in the other countries. The commission’s president hopes the findings will provide “food for thought” even while stressing the difficulty in comparing data from wildly diverse governments.
A Raid On A Luxury Ski Resort Has Uncovered The True Scale Of Tax Evasion In Italy - A raid by Italian tax officials on a luxury ski resort revealed dire rates of tax evasion, reports the Telegraph. Officials traced the license plates of several of the Lamborginis, Ferraris and other high-end vehicles that lined the streets of Cortina d'Ampezzo, a popular ski resort among wealthy Italians. In all, 133 vehicles were investigated; the owners of 42 of these were found to have reported annual salaries of less than $28,000 a year. The investigators also reportedly found that hotels, restaurants and boutiques in the resort were wildly under-declaring how much income they were generating. For example, Reuters reports that restaurants being studied by authorities were issuing sales receipts amounting to 300 percent more sales than the previous year. This demonstrated the fact that such establishments had not previously issued sales receipts in order to cut down their tax bills. The news wire also added that tax evasion is becoming such a severe problem in Italy that the government is installing special dogs at borders, designed to sniff out bank notes with the aim of stopping people smuggling their savings abroad.
Hungary Borrowing Costs Jump to 2009 High; Bond Risk at Record - Hungary sold three-month Treasury bills at the highest yield since 2009 at its first debt auction after passing laws that diminished the country’s chance of obtaining international financial aid. The cost of contracts to protect the nation’s debt climbed to a record. The government raised 45 billion forint ($190 million), the full amount planned, according to data from the Debt Management Agency published on Bloomberg. The average yield increased to 7.67 percent, the highest for three-month notes since August 2009, climbing from 7.43 percent at the last sale a week ago. “The country’s financing will be impossible over the longer term at such high yields,” . “Investor confidence in Hungary is deteriorating further as the government isn’t showing enough commitment to reaching a deal with the IMF and EU.”
'Democracy Is Being Trampled On in Hungary' - The European Commission on Tuesday announced that it was combing through both the new constitution, which took effect on Jan. 1, and a new law pertaining to Hungary's central bank, the Magyar Nemzeti Bank (MNB), to determine if they adhere to European Union treaties. Furthermore, the Commission said on Tuesday that the EU and the International Monetary Fund (IMF) have not yet decided whether to resume negotiations over much-needed financial assistance for Budapest. It didn't take long for markets to react. Yields on 10-year Hungarian bonds spiked to 10.7 percent on Wednesday, continuing a sharp rise since the talks over a €20 billion ($26 billion) EU/IMF aid package for Hungary collapsed in December. The country's currency, the forint, plunged to an all-time low against the euro on Wednesday morning. Both Standard & Poor's and Moody's slashed Hungary's credit rating to junk status in the weeks before Christmas. Hungary needs to refinance debt worth €4.8 billion in the coming months. Of particular concern are provisions which allow the government to appoint the bank's vice presidents, thus infringing on MNB's independence. Furthermore, the law increases the number of vice presidents from two to three, allowing Orban to appoint one immediately.
Hungary Fails to Raise Target Amount at Auction, Yields Soar -- Hungary raised less than planned at a Treasury bill auction as yields soared on concern the International Monetary Fund and European Union won't resume aid talks. The government sold 35 billion forint ($140 million) in one-year bills, 10 billion forint less than the planned amount, data from the Debt Management Agency on Bloomberg show. The average yield rose to 9.96 percent, the highest since April 2009, from 7.91 percent at the last sale of the same-maturity debt on Dec. 22. The EU and the IMF broke off aid talks last month as the government prepared legislation that threatened to undermine the independence of the central bank. Hungary needs a deal as soon as possible to help maintain market financing and is ready to discuss the conditions, Tamas Fellegi, the minister assigned to lead the talks, told reporters today.
How long can a Hungarian hunger strike go on? Journalist Profile - A Hungarian TV journalist is nearing Mahatma Gandhi’s limit of 21 days for a hunger strike. 44-year-old Balazs Nagy Navarro has been sitting at the doorstep of Hungary’s Public Television Bureau for 19 days in below-freezing temperatures. The protests that have swept through the world over the last year have finally reached Hungary. Christmas found thousands of Hungarians on the streets chanting DE-MOC-RA-CY! and FREEDOM-OF-THE-PRESS! at demonstrations against Prime Minister Viktor Orban. Navarro, a television journalist and vice president of one of the largest unions of broadcast journalists sees himself fighting for basic democratic rights such as fairness in public media. Navarro and a fellow journalist, Aranka Szavuly, who also joined the hunger strike, are fed up with what they say is extensive news manipulation by the center-right ruling administration. For them, the last straw came on December 3, when images of Zoltan Lomnici, the former chief judge of the Hungarian Supreme Court, were digitally blurred out in the evening news reports by two of the three state television channels. Lomnici held a press conference together with Laszlo Tokes, the other leader of the Council of Human Dignity, but only the latter was visible in the boradcasted images. The figure of Lomnici was pixelated in the background.
Market Monetarism in The Telegraph - Guess who wrote this paragraph: Central banks have the means to prevent a 1930s outcome, even with rates at zero, if willing to deploy Fisher-Friedman monetary stimulus with conviction, buying assets from non-banks and targeting nominal GDP growth of 5pc. But policy defeatism is in the air... The European Central Bank has guaranteed trouble by letting M3 money contract... The ECB's Mario Draghi will cut interest rates to 0.5pc by February, just to keep pace with passive tightening. In this small excerpt we find the ideas of nominal GDP targeting, purchasing assets from the non-bank public (i.e. using the portfolio channel), and the passive tightening of monetary policy. No, the author is not a Market Monetarist blogger. Rather this is Ambrose Evans-Pritchard, a columnist for The Telegraph and fan of Market Monetarist's views. As Lars Christensen notes, this is not the first time Evans-Pritchard has advocated Market Monetarist views.
Troika warns of more tax hikes and welfare cuts - Income tax increases and more cuts in social welfare may be likely as the Government struggles to meet its international bailout commitments, troika officials have warned. Irish people will be forced to carry an even heavier financial burden in the years ahead. Officials from the EU Commission and International Monetary Fund (IMF) believe the Cabinet will be unable to keep election promises not to adjust tax bands and credits in the 2013 Budget. A team of officials from the international troika monitoring Ireland's adherence to its bailout promises will arrive in Ireland next week to scrutinise the Government's fiscal performance. Burden Householders are facing new property tax bills which will be far higher than the new €100 household charge. The value-based home tax is expected to place a significant burden on struggling families.
2012 could be the year Germany lets the euro die - There will be no Chinese credit explosion this time, no real help from post-bubble India or over-stretched Brazil. It will be a global downturn on all fronts, aborting what remains of recovery even before industrial output in the OECD bloc has regained its pre-Lehman peak. The second wave will hit with youth unemployment already at 45pc in Greece and 49pc in Spain; and with the US labour participation rate already at depression levels of 64pc. We will hear more about Italy's Red Brigades, Greece's Sect of Revolutionaries, and America's militia groups, and how democracies respond. Proto-fascism in Hungary is our warning. China's surgical soft-landing will slip control, like Fed tightening in 1929 and 2007, or Japan's squeeze in 1990. Once construction has run amok, bears will have their way.
Germany Says Greek Debt Talks Near End After Report of Bigger Writedowns - Germany’s government declined to comment on a report that it may push for creditors to accept bigger losses on Greek debt than previously agreed upon, saying only that talks on lowering Greece’s debt level may end soon. Germany is studying a proposal to write down 75 percent of Greek government bonds held by private creditors as part of a planned debt swap to ensure greater debt sustainability, Greek news website Euro2day.gr reported today, without citing anyone. Under the terms of Greece’s 130 billion-euro ($168 billion) second bailout backed by European leaders in October, investors would take a 50 percent hit on the nominal value of 206 billion euros of privately owned debt. Talks are ongoing about the specifics of the role of the private sector and Germany assumes that the negotiations will end soon, the Finance Ministry in Berlin said in an e-mailed response to the Greek report, without elaborating. The ministry didn’t respond to a question on the 75 percent writedown as reported.
Greece warns on euro exit if bailout not signed - Greece may have to leave the eurozone if it fails to secure its latest bailout from the EU, IMF and banks, a government spokesperson has warned. "The bailout agreement needs to be signed otherwise we will be out of the markets, out of the euro," spokesman Pantelis Kapsis told Skai TV. The government is struggling with public opposition to new austerity measures, demanded by lenders. Analysts suggest the warning is designed to win support for the moves. EU visit The Greek Prime Minister, former central banker Lucas Papdemos, is due to address the nation in the next few days to try to win support for new spending cuts and structural reforms. The latest 130bn-euro bailout ($169.5bn, £108.7bn) was agreed in principle by EU leaders in October, conditional on Greece adopting further measures to cut its deficit and restructure its economy. EU, International Monetary Fund and European Central Bank inspectors are due in Athens later in January to review progress.
Spiegel: Time Running Out - Greece Urgently Requests Clarity on Bailout Deal - The New Year's address delivered by Greek Prime Minister Lucas Papademos was not exactly full of hope. A "very difficult year" was coming to an end, he intoned, and another "very difficult year" was beginning. He also said that the first three months of the new year were "especially critical." On Tuesday, government spokesman Pantelis Kapsis told Greek television station Skai TV exactly what that means. Greece and the euro zone have to quickly reach agreement on the second, €130 billion bailout package agreed to in principle last autumn. Otherwise, the country faces insolvency. "The bailout agreement needs to be signed," he said. "Otherwise, we will be out of the markets, out of the euro. The situation will be much worse."
Greece’s Least Bad Option Looks to Be Internal Devaluation: View - Greece and some other euro-area economies face years of financial struggle even if they manage to restructure their debts. Their prospects are so bleak that, according to one school of thought, they would be better off outside the euro system, despite the immediate costs of leaving. We disagree, and not just because the immediate costs of an exit would be enormous. Even after that penalty was paid, resurrecting national currencies and regaining control of monetary policy would create as many problems as they solved. Inside the system, the peripheral countries have learned a harsh lesson: They must hold growth in wages to the euro area’s rate of inflation plus any increase in national productivity. In countries such as Greece, this demands a new approach to wage bargaining by employers and unions. Overall, though, it should be no more difficult than managing a floating currency. And on this path the reward for success is greater: lower inflation rates and, with luck, faster economic growth. None of this alters the fact that Greece, so slow to learn the new rules, would have been better off not joining the euro system in the first place. But it did join, and its best bet now is to make it work.
Deeper Cuts Needed to Save Greece: Papademos - Prime Minister Lucas Papademos told Greeks that cuts in income are the only way to stay in the euro and get more financing from international creditors to avert an economic collapse that may otherwise come as soon as March. “We have to give up a little so we don’t lose a lot,” Papademos said, according to an e-mailed transcript of his statements to union and business leaders yesterday. Talks later this month with officials from the European Union, International Monetary Fund and European Central Bank, the so-called troika, will focus on a “credible” economic plan for 2012 to 2015. “Without this agreement with the troika and subsequent financing, Greece in March faces the immediate risk of a disorderly default,” he said. Appointed in early November to lead an interim government to secure a second financing package, Papademos is racing to complete a voluntary swap of debt with private bondholders, part of the new rescue plan for the country, which also includes 130 billion euros ($167 billion) of public funds. Under the terms of Greece’s second bailout, investors would take a 50 percent hit on the nominal value of 206 billion euros of privately owned debt. The country redeems 14.4 billion euros of bonds March 20.
Papademos Warns Greeks Economic Collapse Looms Without Sacrifice -- Prime Minister Lucas Papademos told fellow Greeks that deeper cuts in incomes are the only way for the country to remain in the euro area and receive more financing from international creditors, steps that would avert an economic collapse that may otherwise come as soon as March. "We have to give up a little so we don't lose a lot," Papademos said, according to an e-mailed transcript of his statements to union and business leaders yesterday. Talks later this month with officials from the European Union, International Monetary Fund and European Central Bank, the so-called troika, will focus on a "credible" economic plan for 2012 to 2015. "Without this agreement with the troika and subsequent financing, Greece in March faces the immediate risk of a disorderly default," he said. Appointed in early November to lead an interim government to secure a second financing package for the country, Papademos is racing to complete a voluntary swap of debt with private bondholders, part of the new rescue plan for the country, which also includes 130 billion euros ($168 billion) of public funds. The country redeems 14.4 billion euros of bonds on March 20.
CMA Now Officially Assumes 20% Recovery In Greek Default - Time To Change Sovereign Debt Risk Management Defaults? ZeroHedge: One of the ironclad assumptions in CDS trading was that recovery assumptions, especially on sovereign bonds, would be 40% of par come hell or high water. This key variable, which drives various other downstream implied data points, was never really touched as most i) had never really experienced a freefall sovereign default and ii) 40% recovery on sovereign bonds seemed more than fair. Obviously with Greek bonds already trading in the 20s this assumption was substantially challenged, although the methodology for all intents and purposes remained at 40%. No more - according to CMA, the default recovery on Greece is now 20%. So how long before both this number is adjusted, before recovery assumptions for all sovereigns are adjusted lower, and before all existing risk model have to be scrapped and redone with this new assumption which would impact how trillions in cash is allocated across the board. Of course, none of this will happen - after all what happens in Greece stays in Greece. In fact since America can decouple from the outside world, it now also appears that Greece can decouple from within the Eurozone, even though it has to be in the eurozone for there to be a Eurozone.
Greece Debt Negotiations Move Toward Deal - The Greek government expects to wrap up talks seeking a 50% write-down on its debt owed to creditor banks by the end of this month, after banks appeared to make concessions on the terms they would accept under a new bailout, said people with knowledge of the situation. In exchange, Greece has agreed to consider that the new bonds be governed by English law, which means creditors would be allowed to seize Greek assets if the country fails on its payments. Until now Athens had refused to offer such collateral "If nothing changes we are hoping to have an agreement within the next three weeks or even earlier," a senior Greek government official said.
Greek VoluntaryInvolutary DealNoDealDeal: Convolution Eupdate - Will Greece reach a voluntary deal with its creditors to write down its debt by 50% in the coming weeks? Will it default? ... or will its official patrons blink, pay up, and let the creditors off the hook? I hear at least two uber-expert Euro-watchers have taken opposite sides of the bet on that one. I bet nobody wins. This Wall Street Journal article is rather optimistic, and somewhat incoherent on the trade-offs. Apparently private creditors are willing to take a lower interest rate in exchange for a change in governing law from Greek to English (and presumably the ability to sue in London/submission to jurisdiction) in the exit instruments--which makes some sense. But the piece then proceeds to equate English law with available collateral, which comes right out of nowhere. Emerging market sovereigns routinely submit to foreign law, but virtually no one puts up collateral. The article is also muddled on the now-notorious business of collective action clauses and their implications for Greek Credit Default Swaps. If the majority binds the minority, the deal goes forward. Such a move almost certainly triggers a credit event under Greek CDS contracts: the new terms would be "binding on all" creditors, which is the litmus test under ISDA documentation. Until now, avoiding CDS triggers has been the line in the sand for key official and private players in this drama. Hence the obsession with characterizing the deal as "voluntary." But if coersion is now on the table, why mess around with the inadequate 50% and contract-legislation hybrids?
Merkel says Europe must cooperate more for euro to succeed - (Reuters) - Europe must cooperate more closely if it wants the euro to succeed as its shared currency, and it still has a long way to go to overcome its sovereign debt crisis, German Chancellor Angela Merkel said in her New Year's Eve address. She said that she would do everything in her power to strengthen the euro, but that this would only work if Europe learned from its mistakes. "A common currency can only really be successful if we in Europe cooperate more than we have done," Merkel said in a pre-recorded televised address to be broadcast on Saturday. "Europe is growing together in the crisis," she said, according to an official copy of her speech. "The path to overcoming this remains long and won't be free from setbacks, but at the end of it, Europe will emerge stronger from the crisis than it went into it." Merkel also said that while the German economy was doing well, next year would "without a doubt be more difficult than this one."
Missing: 13.3 Billion Deutschmarks -In late 2001, German banks sold Euro Starter Kits—sealed plastic pouches with €10.23 in coins. One of many steps in the arduous process of weaning Germans from their D-Mark. I was in Germany on business at the time and bought a Starter Kit as souvenir. I still have it. It’s in the back of a drawer, next to a D-Mark coin. And that coin is part of a vast phenomenon: 13.3 billion Deutschmarks are still missing ten years after the euro made it into German wallets. 163 D-Mark per capita. But now people see a reason to hang on to them. While part of it is stashed in the back of drawers or rusty boxes in Germany, a good part appears to be in other countries. Guest workers took their savings home in cash, which their families kept as hard currency. A smart move in a country like Turkey where, after decades of torrid inflation, the government revalued the lira in 2005 at 1,000,000 lira to one “new lira.” Which put an end to multi-million-lira döner sandwiches. And in the Balkans, the Deutschmark was the primary currency in the 1990s. When I was in Sarajevo in 1997, even hotel bills had to be paid in cash Deutschmarks.
Schadenfreude Capitalism - The protracted financial and economic crisis discredited first the American model of capitalism, and then the European version. Now it looks as if the Asian approach may take some knocks, too. Coming after the failure of state socialism, does this mean that there is no correct way of organizing an economy? The American model had supposedly failed, its reputation weakened first by the Iraq invasion, and then by the financial crisis. German Finance Minister Peer Steinbrück put this diagnosis as a challenge not only to the US, but also to other countries – notably the United Kingdom – that had “Americanized” their financial system. The problem, Steinbrück argued, lay in over-reliance on highly complex financial instruments, propagated by globalized American institutions: “The financial crisis is above all an American problem. The other G-7 financial ministers in continental Europe share this opinion.”Criticism of America did not stop there. Steinbrück’s successor, Wolfgang Schäuble, persisted in the same tone, attacking “clueless” American monetary policy, which was supposedly designed only to feed the American financial monster. But such criticism ignores the problems faced by banks that did not use or deal in complex financial products. Bank regulators had long insisted that the safest possible financial instrument was a bond issued by a rich industrial country. Then came the eurozone’s sovereign-debt crisis, with its roots in lax government finance in some (mostly southern European) countries.
European Fiscal History - Krugman - Nice paper in Vox decomposing the rise in debt-GDP ratios for troubled European economies. I’d make special note of this observation: Projections suggest that some European countries had an unsound fiscal stance (in terms of debt-to-GDP ratio evolution) well before the 2008–09 financial crisis (Greece, Portugal, the UK); on the contrary, others had a sound fiscal stance (Spain, Ireland, Italy). To understand what this means, you need to know that the combined GDP of Greece and Portugal is a bit over $500 billion (the UK isn’t in crisis), while the combined GDP of Spain, Ireland, and Italy is more than $3.5 trillion. So the economies now in trouble were, overwhelmingly as measured by economic importance, following sound fiscal policies before the crisis. Yet the whole European response has been based on the assumption that fiscal profligacy was the villain.
Learning from 2011, hoping for a better 2012 - Charles Wyplosz looks at the Eurozone crisis and how it deepened during the second half of 2011. He asks the question of why governments, the European Commission and the ECB do not seem to learn from their mistakes. He suggests several hypothesis:
1. ignorance and lack of understanding
2. the obsession of the French President and the German Chancellor to find a political solution
3. the "quasi-religious" beliefs at the ECB on economic policy options
4. the crisis as a strategic option chosen by the ECB and some countries to teach a lesson to those who misbehave
Olivier Blanchard, Economic Counsellor at the IMF, summarizes four lessons ("hard truths") from 2011. The article not only provides some great insights about the year but it also offers a very honest and fresh view on some of the hard lessons that policy makers and academics have learned. He stresses something that rarely gets attention in academic research: the importance of multiple equilibria and self-fulfilling crises of confidence.
Tensions not seen easing much as banks hoard cash (Reuters) - The euro zone banking system starts the new year awash with record levels of liquidity but few signs that institutions are prepared to lend to each other, leaving money markets frozen. Most of the near half trillion euros of three-year funds borrowed from the European Central Bank in the last week of 2011 have made their way back to the ECB's overnight deposit account. Use of the facility was close to 450 billion euros on Monday night. But, reflecting the dislocation in short-term funding markets, at least one other bank borrowed 14.8 billion euros from the ECB's punitively priced emergency lending facility. What happens to the excess liquidity in coming weeks will be key. But with banks facing heavy refinancing schedules this year, those looking for a revival in money markets may be disappointed. Benchmark three-month euro Libor rates fixed a basis point lower at 1.26857 percent, and down around 6 basis points since the injection of three-year funding. But the spread over equivalent maturity overnight indexed swap (OIS) rates has barely budged - it stands just a couple of basis points lower at 88 basis points - and RBS said there is unlikely to be a material tightening.
ECB Overnight Deposits Rise to New High of 453.2 Billion Euros -- The European Central Bank said overnight deposits from financial institutions rose to an all- time high. Euro-area banks parked 453.2 billion euros ($592.4 billion) with the Frankfurt-based ECB yesterday, up from 446 billion euros the previous day. That’s the highest since the euro’s introduction in 1999. Last month the ECB lent 523 banks a record 489 billion euros for three years to keep credit flowing to the 17-nation euro economy as the sovereign debt crisis persists. It lent the money at its benchmark rate of 1 percent. Banks are depositing excess cash back with the ECB at the overnight rate of 0.25 percent, incurring a loss rather than lending it for more elsewhere. Banks also borrowed 15 billion euros in emergency funds at the rate of 1.75 percent, up from 14.8 billion euros the previous day.
ECB Deposit Facility Usage Hits New Record - Not much to say here that has not been said daily for the past 2 weeks: the ECB's Deposit Facility use soared to a new all time high of €453 billion, and increase of €7 billion overnight and higher than, well, ever. The conclusions here are well known - there was no seasonality to the year end spike (because it is now next year), and the LTRO cash is not being used, as pessimistically expected here first. When the next LTRO prices on February 29, expect this number to peak at around €700 billion. And so LTRO by LTRO, the ECB will prefund the entire roughly €2-3 trillion capitalization shortfall in European banks but not before the 3rd 2012 European bank stress test tells us banks only need €0.69 billion in capital (and Dexia is fine despite its bankruptcy).
On Austerity, Unrest, And Quantifying Chaos - Politically speaking, austerity is a challenge. While we would expect that governments imposing spending cuts on their voting public may face electability issues, in fact, a recent paper from the Center for Economic Policy Research finds that there is no empirical evidence to confirm this - i.e. a budget-cutting government is no less likely to be re-relected than a spend-heavy government. However, what the CEPR paper does find as a factor in delaying austerity is much more worrisome - a fear of instability and unrest. The authors found a very clear relationship between CHAOS (their variable name for demonstrations, riots, strikes and worse) and expenditure cuts. As JPMorgan notes, austerity sounds straightforward as a policy, until the consequences bite. It remains unclear that the road Europe is taking is less costly in the long run, in economic, political and social terms. The history of Europe over the last 100 years shows that austerity can have severe consequences and outcomes and perhaps most notably, the independent variable that did result in more unrest: higher levels of government debt in the first place.
Spain sees €50bn of new bank provisions - Spain says it expects its banks to set aside up to €50bn in further provisions on their bad property assets as part of a new round of reforms for the country’s financial sector. More videoLuis de Guindos, economy minister in the centre-right government that took office two weeks ago after defeating the Socialists, said on Wednesday it was essential that the banks clean up their balance sheets without imposing a burden on the treasury. The €50bn figure, equivalent to about 4 per cent of Spain’s GDP, is higher than private expectations by bankers. Some analysts had speculated that the Popular party government of Mariano Rajoy, prime minister, would set up a large, state-funded “bad bank” like Ireland’s Nama to absorb the non-performing assets of lenders hit by the collapse of the housing bubble in 2007 and the subsequent European economic crisis. However, strong Spanish banks such as Santander and BBVA opposed the “bad bank” idea, arguing that they could handle their own problems and that weaker lenders should if necessary be absorbed by their stronger rivals. That is the path now being taken by the government with Mr de Guindos saying there should be another round of consolidation among cajas, or savings banks.
Brussels Recommends Sucking Spain Dry with Increased VAT; France to Raise Sales Tax to Protect Jobs; Is There Any Point or Reason for the Eurozone? - Political hacks are on a roll in Brussels. Spanish unemployment is 22.8%, yet Brussels recommends Spain hike its VAT. Via Google Translate, please consider Brussels Again Recommend Rise in Spain's VAT The European Commission hopes to discuss in the coming weeks with the new government of Mariano Rajoy new fiscal consolidation measures to compensate for the deviation from the deficit target in 2011 that could exceed even the 8% vs 6% agreed, and has advanced the VAT increase is one possibility among others. "We were informed last week by the Spanish authorities of a sizeable deficit, which should be 6% in 2011 and might be about or more than 8% according to latest statistics we have received from Madrid. At the moment, we have no elements to confirm these figures. We are not in a position to state here that the figure will be higher or lower than 8%, "said at a news conference the European Commission spokesman, Olivier Bailly. Asked whether Brussels remains the recommendation for Spain to raise the VAT, the spokesman insisted that "Spanish authorities are responsible for deciding planning to take other measures to offset the deficit diversion in order to meet the target of 3% in 2013 who are committed to comply ", but insisted that raise VAT is one of the recommendations of Brussels.
France Plans To Raise Sales Tax, Following Germany's Lead - French President Nicolas Sarkozy's government said Tuesday that it would borrow yet another page from Germany's economic textbook in a bid to make France's products more competitive and finance the nation's wide-reaching and heavily indebted social-welfare system. The proposal, which the government said would be implemented before this spring's presidential election, calls for reducing the amount companies contribute to the state-run health-care and pension systems. To make up for the lost income, the center-right government would raise France's value-added tax--a levy similar to sales taxes in the U.S.--which is currently as high as 19.6%. The government says the measure, often referred to as "social VAT," would act as a powerful tool to protect French jobs, which are increasingly being relocated to lower-cost countries. French companies would enjoy lower labor costs, while imported products--which would share the higher VAT burden--would help finance France's welfare system. The country's state-run health-care and pension systems are expected to have recorded a combined deficit of EUR18 billion ($23.3 billion) last year.
France to Increase the 'Social VAT' Before the May Presidential Election - The French government intends to implement the so-called 'social VAT' levied on products imported from countries with low production costs in order to apply a reduction in social contributions, before presidential elections next spring, as confirmed Budget Minister and government spokesman Gallo, Valérie Pécresse. "The social tax to create jobs in France and to prevent imported products sold in our country at low cost is going to apply, and we will do before the presidential election," he said Pécresse told France Info. The minister also said that this Budget proposal will be discussed with the French unions in the social summit is scheduled to be held on 18 January at the Elysee Palace. In this regard, Bertrand defended the implementation of this measure by the "general interest" of employment and the country, and stressed that in France there are "too many burdens on the job." As an example, said that for every $ 100 of gross wages, account charges 39 euros in Germany, while France is 50 euros. "I prefer to penalize imports, which have long criminalized the financing of social protection is now to finance social protection", had an impact.
France 10-year Borrowing Costs Rise As Triple-A Rating Faces Threat (RTTNews) - France paid more than what it did last month to borrow for ten years amid rising worries that the country may lose its prized triple-A credit rating. The Agence France Tresor raised EUR 7.963 billion from a sale of its long-term debt on Thursday, the first sale this year. The maximum target set for the OAT sale was EUR 8 billion. The auction attracted bids totaling EUR 14.956 billion. The Treasury sold EUR 4.02 billion of the 10-year bond at an average yield of 3.29 percent, up from 3.18 percent in the previous auction on December 1. The bid-to-cover ratio dropped to 1.64 from 3.05. The 3.25 percent bond will mature in October 2021. The agency also raised EUR 2.165 billion from the sale of the 4.50 percent 30-year debt, maturing in April 2041. The yield on the paper rose to 3.97 percent from 3.94 percent. Demand was 1.82 times the amount on offer, down from 2.26 previously on December 1. The 4.25 percent 12-year debt was placed at an average yield of 3.50 percent, which was less than 3.63 percent in the previous sale on June 1. The bid-to-cover ratio, however, rose to 3.22 from 1.97. The agency issued EUR 690 million of the debt that will mature in October 2023.
European Banks Face More Pressure to Shed Government Debt - As euro-zone nations prepare to refinance $1.3 trillion of debt in 2012, the Institute of International Finance — a global banking trade group — today painted a grim picture of their prospects. Several struggling European nations face mounting budget troubles at the same time European banks face pressure to cut their holdings of government bonds. Among the trouble spots identified in the IIF’s staff report:
- –Greece, where economic conditions have deteriorated in recent months, will likely miss its deficit target — requiring it to negotiate more budget adjustments through 2014.
- –Portugal, which has “experienced serious fiscal slippages,” is trying to meet a deficit target of 4.5% of GDP. Doing so would require a fiscal contraction valued at 6.1% of GDP, in a year in which growth is expected to drop by 3%. “This represents a very demanding objective and lack of progress could heighten market concern.”
- –Spain, with $200 billion of sovereign debt maturing in 2012, “has also experienced fiscal slippages.” GDP is expected to decline in the first quarter, after also contracting in the fourth quarter of 2011.
- –Italy, while pursuing severe austerity measures to eliminate its budget deficit by next year, must finance more than €440 billion ($563 billion) of debt this year. So far, market sentiment remains skeptical” with 10-year Italian bond yields hovering around 7% despite purchases by the European Central Bank.
How Austerity Is Killing Europe - The European Union has become a vicious circle of burgeoning debt leading to radical austerity measures, which in turn further weaken economic conditions and result in calls for still more damaging cuts in government spending and higher taxes. The European debt crisis began with Greece, and that nation remains the European Union’s most stricken economy. But it has spread inexorably to Ireland, Portugal, Italy, and Spain, and even threatens France and possibly the U.K. It need not have done so. Rarely do we get so stark an example of bad—arguably even perverse—economic thinking in action. Portugal, Ireland, Spain and Italy are coming under pressure from the EU to cut government spending and raise taxes to reduce their deficits if they wanted to qualify for a bailout. All have done so. Ireland and Portugal sharply cut spending and still had to take tens of billions of euros to help meet financial obligations as of course did Greece. Britain’s Conservative government led the way in ruthless government cutbacks in 2010. France has adopted its own austerity package, and even Germany, the supposed economic leader of Europe, has planned to cut its deficit by a record 80 billion euros in 2014.
“German Success Recipe” or Blip? - Despite the Eurozone debt crisis, the German economy has been on a roll, with unemployment at a 20-year low. Exports surpassed €1 trillion for the first time ever. The Federation of Wholesale and Foreign Trade even issued a card to commemorate the moment. For the year, exports rose 12%. In 2012—based on demand from Asia, Latin America, Africa, and Eastern Europe—exports are expected to grow 6% to €1.139 trillion—when GDP is only €2.37 trillion ($3.1 trillion)! But during the financial crisis, export orders fell off a cliff, causing GDP to plunge 2.1% in the fourth quarter of 2008 and a horrid 3.8% in the first quarter of 2009. Annualized, those two quarters printed a double-digit decline in GDP. The worst two quarters in the history of the Federal Republic. The German economy lives and dies by its exports. But the recovery was steep and enormous. So it’s perhaps just natural that gloating would infect the German media when, from their perch of success, they look at the economic mayhem in other parts of Europe. Even the Handelsblatt falls prey to it from time to time. I bookmarked its October 17 article, The German Success Recipe Is Called Industriousness and Boredom, because it was just too much. Now the first shadows have appeared, and the “German success recipe,” despite its strengths, might turn out to be a blip.
German Factory Orders Declined Most in Almost Three Years - German factory orders dropped the most in almost three years in November as the euro region economy edged toward a recession and global demand weakened. Orders, adjusted for seasonal swings and inflation, slipped 4.8 percent from October, when they surged a revised 5 percent, the Economy Ministry in Berlin said in a statement today. That’s the biggest drop since January 2009.While the euro region’s sovereign debt crisis has clouded the outlook and cooling global growth is hurting export orders, Europe’s biggest economy may still avert a recession. Unemployment at a two-decade low is helping to bolster consumer sentiment, service industries expanded in December and business confidence (GRIFPBUS) unexpectedly rose for a second month. “It’s quite clear that we’re heading into a pretty sharp downturn even in Germany, which has been one of the strongest of the euro zone’s economies,” “Orders are very clearly on a downward trend, as is industrial production itself.”
European Daily Catch: Unemployment and Retail - Rebecca Wilder - In this post, I present a new series: European Daily Catch (EDC). In this series, I’ll illustrate a selection of the day’s European economic data releases that I find particularly interesting. We’ll start with two complimentary reports: the labor marekt and retail sales. Bottom line: the divergence is at extreme levels. I expect 2012 to be the year of convergence rather than divergence. Something’s gotta give. EDC 1. The variance in labour performance further widens in November. Unemployment rates across the EA 12 (excludes the new countries Slovenia, Slovakia, Malta, Cyprus, and Estonia) show 5 countries making new cyclical highs. Ireland, Greece, and Spain all mark unemployment rates that are 130% or more above their cyclical lows. Note the Netherlands is not consistent with core performance – while the unemployment rate is low, 4.9%, it continues to rise. The Netherlands is the first sign of convergence; more will come. EDC 2. Next up is real and working-day adjusted retail sales. True, retail sales do not describe consumption patterns sufficiently well for some countries listed: the correlation between real retail sales and real consumption in Germany and France is 34% and 61%, respectively. However, for other countries, like Spain, the correlation is near 1, 92.5%.
Spain, Italy Debt Insurance Costs Rise On Euro-Zone Worries - The cost of insuring Spanish and Italian debt against default was higher in early trading Thursday as ongoing concerns about the euro-zone debt crisis continue to put pressure on credit default swaps levels. At around 0940 GMT, the five-year CDS on Spain was 13 basis points wider at 446 basis points, which means it now costs an average of $446,000 a year to insure $10 million of debt issued by the country. CDS are derivatives that function like a default insurance contract for debt. If a borrower defaults, sellers compensate buyers. The Spanish government said its banking sector will need to raise about EUR50 billion in additional provisions to deal with bad property assets, while Italy's CDS jumped 12 basis points wider to 526 basis points as data showed unemployment in the country is continuing to rise. Meanwhile, Hungary's CDS hit a fresh record wide of 755 basis points as the country's economic woes continue. It has been forced to abandon two bond auctions in the last week as its yields climbed to unsustainable levels.
ECB Cash Averts 'Funding Crisis' for Italy, Spain: Euro Credit -- The European Central Bank's unprecedented cash injection is easing borrowing costs for Italy, Spain and Belgium, compensating for the lack of a solution to the debt crisis and the risk of recession. Two-year Italian yields have dropped by 50 basis points and Belgian notes of the same maturity have declined by 22 basis points since Dec. 21, when the ECB supplied banks with 489 billion euros ($636 billion) of three-year loans. Short-dated Italian and Spanish debt outperformed AAA rated German and Dutch securities during that period. "Short-term borrowing costs have come down significantly and that certainly helps to buy time," "Six weeks ago, it looked as if there was going to be an imminent funding crisis, but that's averted by the ECB's money injection." The ECB, led by President Mario Draghi, cut its key interest rate last month for the second time in a quarter and offered unlimited three-year cash at 1 percent to persuade banks, saddled with deteriorating assets including bonds from so-called peripheral Europe, to keep providing credit to the region. Some of that money is probably being invested in sovereign debt,
ECB Takes Record Deposits Stoked by Emergency Lending Operations (Bloomberg) -- The European Central Bank took a record amount of overnight deposits yesterday as the region's financial institutions entrusted funds amassed from emergency lending operations. Euro-area banks parked 455.3 billion euros ($582 billion) with the Frankfurt-based ECB, the most since the euro's introduction in 1999 and up from 443.7 billion euros reported yesterday. Financial institutions borrowed 1.9 billion euros at the central bank's marginal lending facility. The ECB last month loaned 523 banks a record 489 billion euros for three years to keep credit flowing to the 17-nation euro economy during the sovereign debt crisis. It loaned the money at its benchmark rate of 1 percent. The surge in deposits suggests banks are placing excess cash back with the ECB at the overnight rate of 0.25 percent, incurring a loss rather than lending it for more elsewhere. "This was to be expected," "The banks have large amounts of cash after refinancing operations, which they are happy to redeposit with the ECB. Expect the deposit facility usage to increase over the coming days."
ECB Official Sees EU Lender of Last Resort Mechanism as Feasible - A senior European Central Bank policymaker said Friday that it was feasible to design a lender-of-last-resort mechanism for the European Union, though it should be funded from within the euro zone. Athanasios Orphanides, governor of the Central Bank of Cyprus and a member of the ECB governing council, said such a move would have to be carefully orchestrated to avoid further damaging investor confidence in euro-zone sovereign debt. Orphanides said on a panel at a conference in Chicago that progress had been made in removing the moral hazard that would encourage member states to build up too much debt. Speaking at the annual meeting of the American Economic Association, he said it would be “peculiar” if a safety net for the EU sovereign-bond market required funding from states such as India or China outside the euro zone. But he said creating EU-wide oversight of financial institutions was less well advanced, but necessary to help the region emerge from its current crisis. Olivier Blanchard, chief economist of the International Monetary Fund, said on the same panel that there was scope for public-debt issuance to help recapitalize EU banks and ease the impact of deleveraging by institutions.
European Bond Supply and Greece’s Trojan Horse - European sovereigns return to the capital markets more substantially next week as 2012 issuance gets under way. Between bills and bonds, around 35-40 bln euros will be sold. Maturing issues and coupon payments will cover about three-quarters of the bond issuance. The market’s focus is on the Spanish and Italian bond offerings in the second half of the week. Not to be overlooked though is the Austrian bond sales on Tuesday. Austria has come under pressure in recent days in good part due to its linkages with Hungary. After Greece and Spain, Austrian 10-year yields have risen the most this week, rising 55 bp. And even today, with some relief in Hungary, given the change in tone and tactics of the Orban government, the Austrian 10-year yield is up 9 bp at pixel time, the most in Europe today. Its saving grace next week may be that it may seek to raise only around a modest 1.3 bln euros. Spain, Italy and France will be issuing bills, and outside of Hungary, bill auctions have generally been well received. We suspect that in some countries, such as Italy, the concerns about the banks, encourages bill buying by retail accounts. Greece also issues bills next week.
EFSF Bond-Yield Boost Fails to Halt Slide in Demand for $4 Billion Issue - Europe’s bailout fund is losing its appeal as a bond issuer after investors ordered about 4.5 billion euros ($5.8 billion) of its 3 billion euros of notes compared with demand of nine times on its first deal a year ago. That’s after the European Financial Stability Facility offered investors a yield spread almost seven times what it paid to sell 5 billion euros of securities last January, according to data compiled by Bloomberg. “The book on the EFSF bond is far from stellar at just 4 billion,” “A much bigger cover would have given the thing a better gloss.” The new bond was the EFSF’s first three-year issue and follows a Nov. 7 sale that was delayed because of volatility caused by the euro region’s deepening sovereign crisis. Standard & Poor’s said last month that the fund, which will use the proceeds of today’s transaction to help finance the bailouts of Ireland and Portugal, may lose its top credit rating should one of its AAA rated guarantors be downgraded.
ECB's Knot: Euro May Collapse If Greece Pushed Out - European Central Bank Governing Council member Klaas Knot on Thursday said that Greece should have the final say on its membership in the euro zone, as an involuntary exit--driven by financial markets--could blow up the entire currency bloc. ECB officials barely comment in public on the possibility of a member state leaving the euro zone, on fears it could spark even more unrest in what are already choppy markets. Knot, who is also president of the Dutch Central Bank, said that Greece's membership is in the hands of Greek voters. "As long as more than 70% of the Greek population wants to remain a member of the [European Monetary Union] Greece has to stay a member of the EMU," Knot said during a talk show on Dutch television. Knot warned against the risks of what he described an involuntary exit driven by pressure from financial markets. "We all entered together. An involuntary exit is not possible and would result in a loss of confidence," he said. "If speculators will succeed in pushing a country involuntarily out of the [European Monetary Union], I fear this will immediately spread to all countries in a problematic situation. And this will result in a breakup of the EMU as a whole," he said.
Chugging Along: If We Avoid the Nightmare Eurozone Scenario - It will not have escaped anybody’s attention that the eurozone crisis has not been resolved. The Brussels summit at which David Cameron made his stand was as noteworthy for the failure of EU leaders to deliver the deal they were aiming for. True, the markets showed a spirit of goodwill over the festive period and the European Central Bank bunged nearly ¤500 billion of cheap funding into the coffers of European banks but the underlying uncertainty persists. Will it be resolved in a disorderly manner, with the eurozone disintegrating, or will EU leaders, the European Central Bank and the International Monetary Fund find some way of muddling through? Or could the euro could survive but with not all its members staying the course? This is something I have long thought likely, if not now then at some stage. Any of these things are possible but tucked in there somewhere is a very nasty outcome for the eurozone and Britain, what I shall call scenario one, which would see banking crisis and recession return with all the intensity of the autumn of 2008. It should not happen – it should not be allowed to happen – but that is no guarantee it will not.
The Decline and Fall of the Euro? - Great empires rarely succumb to outside attacks. But they often crumble under the weight of internal dissent. This vulnerability seems to apply to the eurozone as well. Key macroeconomic indicators do not suggest any problem for the eurozone as a whole. On the contrary, it has a balanced current account, which means that it has enough resources to solve its own public-finance problems. In this respect, the eurozone compares favorably with other large currency areas, such as the United States or, closer to home, the United Kingdom, which run external deficits and thus depend on continuing inflows of capital. In terms of fiscal policy, too, the eurozone average is comparatively strong. It has a much lower fiscal deficit than the US (4% of GDP for the eurozone, compared to almost 10% for the US). Debasement of the currency is another sign of weakness that often precedes decline and breakup. But, again, this is not the case for the eurozone, where the inflation rate remains low – and below that of the US and the UK. Much has been written about Europe’s sluggish growth, but the record is actually not so bad. Over the last decade, per capita growth in the US and the eurozone has been almost exactly the same. Given this relative strength in the eurozone’s fundamentals, it is far too early to write off the euro. But the crisis has been going from bad to worse, as Europe’s policymakers seem boundlessly capable of making a mess out of the situation.
Right Now the Debt Crisis is European, But the Problem is Global - The European debt crisis has not gone away. Concern about Euro debt has ebbed and flowed in the markets for the last two years, but is still far from a solution. Periodically, various high-level meetings and resulting announcements of vague outlines of plans have led to quiet periods, only to re-emerge again when something happens that indicates that not much has really been accomplished, and that there are still serious problems ahead. The latest eruption of worry burst forth as Unicredit, Italy’s largest bank, had to offer more than a 40% discount to existing shareholders to buy two shares for every one held. The disheartening news set off a chain reaction, as the need to raise capital is not restricted to Unicredit, but applies to almost all Italian banks and many major financial institutions throughout Europe as well. As a result, bank stocks plunged throughout the continent and impacted the general markets as well. Interest rates climbed and the Euro broke below $1.28 for the first time since September 2010. In addition the European Financial Stability Facility (EFSF) had to pay much higher rates to sell 3 billion Euros of debt.
Soros Says Euro-Area’s Failure Would Have a ’Catastrophic’ Global Impact - Billionaire investor George Soros said a fracturing of the euro area would have “catastrophic” consequences and that markets have started pricing in the possibility of the region breaking up. The disintegration of the 17-nation currency bloc would affect Europe and the “entire global financial system,” Soros said in the southern Indian city of Hyderabad today in response to questions. Leaders in the euro region have struggled to solve a sovereign-debt crisis that’s hampered the global recovery and is now in its third year. Greece, Ireland and Portugal have already been forced into bailouts and the European Central Bank has provided unprecedented cash injections, easing borrowing costs for Italy, Spain and Belgium. Soros said it isn’t currently clear whether the crisis will be contained, adding many people “feel” it’s “over the brink” and “insolvable.”
Eurozone unemployment stays at record high - Unemployment in the eurozone stayed at a record high in November as the impact of the sovereign debt crisis rumbled on, according to official figures. The jobless rate in the 17 nations that use the euro was 10.3% in November for the second month in a row, according to the Eurostat statistics agency. There were 16.3 million people in the bloc out of work. At the same time, an index of consumer confidence fell to a two-year low in December, the European Commission said. The economic sentiment indicator fell 0.5 to 93.3 in December, which was well below the long-term average of 100, the Commission said. Howard Archer, an economist at IHS Global Insight, said that the data suggested that Europe's economy had contracted in the last three months of 2011. "Tighter fiscal policy, squeezed consumers, the seemingly never-ending eurozone sovereign debt crisis, weakened global growth and financial market turmoil are taking a serious toll on economic activity across the eurozone," he said. Spain's unemployment rate was highest at 22.9%, accounting for more than a quarter of the total eurozone unemployment figure.
UK’s bailed-out banks face new £30bn hit - Lloyds Banking Group and Royal Bank of Scotland could be hit by a further £33bn of write downs related to mortgages, consumer loans and corporate debt, according to analysts at Barclays Capital. The two lenders have already taken £100bn in impairments since being bailed out by the taxpayer in 2008, but Barclays warned that new write downs were likely as the UK economy continues to struggle. Lloyds is facing having to take a further £20bn of impairments against its credit portfolios, an amount equal to half of its core capital buffer, while RBS could be hit by new write downs totalling £13bn in the coming years. "Mortgages are the key area of concern, where we estimate that a further £5bn of provisions at Lloyds but less than £1bn for RBS. However, we expect the stress to be more widespread, affecting weakened corporates, particularly smaller ones, and consumer credit," said Barclays.
Retailers face being "squeezed to extinction" - More shops will collapse into administration or announce store closures in the next couple of weeks, afters suffering from "profits squeezed to extinction" as well as a fall in sales over Christmas, according to the head of Britain's retail trade body. As many as 40,000 are expected to lose their jobs, with more forced to work on reduced hours, as the full force of the consumer slowdown starts to makes its effects felt on the high street. After the collapse of Barratts Priceless, the shoe chain, Hawkin's Bazaar, the toy shop and D2 Jeans last week, a clutch of other names are expected to go to the wall, said Stephen Robertson, the director general of the British Retail Consortium. "This feels, talking to retailers, that there is more pressure than there was back in 2008. Back then there had been a relatively good run up until that point, and sales were certainly down, but margins were holding up. "This time, it's not just about the poor sales performance it's about the underlying profitability. We have seen a blizzard of deals and promotions, so gross profit margins will have been punished." "It might not be an official recession, but we are in a retail recession,"
The impossible equation → Earlier this year I reported on what a wonderful Xmas all the Ricardian agents (consumers and firms) had enjoyed in the UK as a result of the government austerity program. Please read my blog – Ricardians in UK have a wonderful Xmas. It seems those “agents” just cannot get enough of it. Now, more than 15 months into the austerity program and with the cuts about to really bite, the British economy continues to go backwards. Our real world laboratory is providing priceless data upon which we can assess basic propositions that mainstream macroeconomics provides and which Modern Monetary Theory (MMT) contests. A nation cannot have a fiscal contraction expansion when all other spending is flat or going backwards. Britain is up against an impossible equation. The current period is providing us with an excellent (though tragic) real world laboratory to test the dominant economic theories. Forget all the mathematical models and regression equations. We don’t have to worry about transversality, homogeneity, boundaries or continuity. This is real life – we have Britain.
About 1m take out payday loans - Almost one million Britons have resorted to taking out high-interest payday loans to help make rent or mortgage payments in the past year. Shelter, the homeless charity which commissioned the YouGov poll, said the “shocking” findings revealed the spiral of debt people were falling into trying to keep a roof over their heads. “Turning to short-term pay day loans to help pay for the cost of housing is totally unsustainable. It can quickly lead to debts snowballing out of control and can lead to eviction or repossession and ultimately homelessness,” said Campbell Robb, chief executive of Shelter. Payday loans have come under fierce attack by politicians and consumer groups as interest charges can run as high as 5,000 per cent a year. Even so, they are growing rapidly in popularity among typically lower earning borrowers whose income has been further squeezed in the tough economic environment.


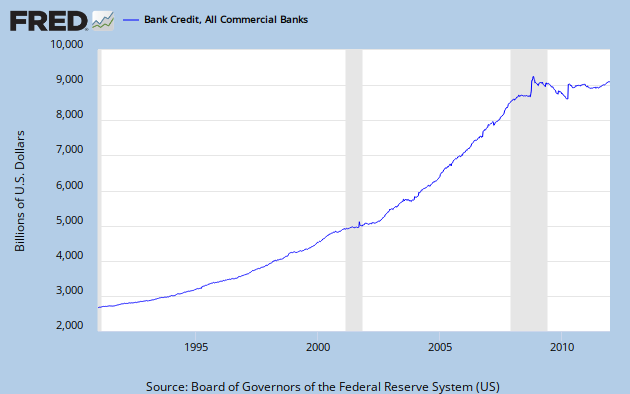
No comments:
Post a Comment