Fed Balance Sheet Tops $4 Trillion for First Time - The Federal Reserve's holdings of bonds and other assets topped $4 trillion for the first time, it reported Thursday, a milestone underscoring the benefits and risks of the central bank's bond-buying programs. The Fed's portfolio of assets, including Treasurys, mortgage-backed securities, loans, coins, buildings and other assets, was worth slightly more than $4 trillion as of Dec. 18, up from less than $900 billion before the crisis. It's going to keep growing for a while. A major propellant of this increase has been the Fed's three rounds of bond-buying programs since the 2008 financial crisis. The current program is aimed at holding down long-term interest rates to encourage more spending, investing and hiring. The Fed said Wednesday it plans to keep going next year, though at a slowing pace. If the economy and labor market keep improving as the Fed expects, it will reduce the amount in increments of about $10 billion at future meetings, Fed Chairman Ben Bernanke said at a press conference after the announcement. Following that path, the Fed would end up with a portfolio of assets worth about $4.5 trillion by the time the bond program is finished late next year. That would be about a quarter of the size of the roughly $17 trillion in annual U.S. economic output. The finally tally could be bigger or smaller, depending on how the economy performs in the months ahead as well as on how Fed officials decide to handle the details.
Fed's Balance Sheet Balloons Past $4 Trillion; Up 37% from Last Year: The Federal Reserve released its latest balance sheet and the figure topped $4 trillion for the first time ever. The latest figure has the balance sheet at $4.044 trillion for the week ended Dec. 18, 2013, up $1.085 trillion from last year, or 37%. On August 8, 2007, before the economic crisis, the Fed's balance sheet was only $869 billion. Yesterday's QE taper from the Fed will slow down the balance sheet growth, although it will still add $75 billion in new securities purchases each month until tapered further.
FRB: H.4.1 Release-- Factors Affecting Reserve Balances -- Thursday, December 19, 2013: Federal Reserve Statistical Release - Factors Affecting Reserve Balances of Depository Institutions and Condition Statement of Federal Reserve Banks
A Look Inside the Fed’s Balance Sheet --- The Federal Reserve said that its holdings of bonds and other assets topped $4 trillion for the first time, a milestone underscoring the benefits and risks of the central bank’s bond-buying programs. The level has climbed by more than $1 trillion over the course of 2013 as the central bank continued its bond-buying program launched in September 2012. The Fed announced Wednesday that it will continue buying bonds into next year, though it slowed the pace to $75 billion a month. The balance sheet is up from less than $1 trillion prior to the recession. During the downturn the Fed expanded its balance sheet through several programs aimed at keeping markets functioning. As markets stabilized the Fed shifted out of emergency programs and into purchases of U.S. Treasurys, mortgage-backed securities and agency debt securities to drive down interest rates and encourage more borrowing and growth in two separate rounds of what is known as quantitative easing. The most recent bond buying added $40 billion a month in MBS and another $45 billion in long-term Treasurys. Even as the Fed’s bond holdings have grown, other assets tied to emergency programs are disappearing. The Term Asset-Backed Securities Loan Facility, or TALF, ended in March 2010, and continues to fall due primarily to voluntary prepayments as the market improves and other financing options become more attractive. Direct-bank lending has fallen to the tens of millions of dollars. The Fed has sold off most of the assets related to the rescue of Bear Stearns and AIG and now just holds less than $2 billion. In an effort to track the Fed’s actions, Real Time Economics created an interactive graphic marking the expansion of the central bank’s balance sheet. The chart is updated as often as possible with the latest data released by the Fed. Click for full interactive graphic.
Fed’s $4 Trillion in Assets Draw Lawmakers’ Scrutiny - The Federal Reserve’s balance sheet is poised to exceed $4 trillion, prompting warnings its record easing is inflating asset-price bubbles and drawing renewed lawmaker scrutiny just as Janet Yellen prepares to take charge. The Fed’s assets rose to a record $3.99 trillion on Dec. 11, up from $2.82 trillion in September 2012, when it embarked on a third round of bond buying. Policy makers meet today and tomorrow to decide whether to start curtailing the $85 billion monthly pace of purchases. Among Fed officials, “there’s discomfort in the sense that the portfolio could grow almost without limit,” former Fed Vice Chairman Donald Kohn said last week during a panel discussion in Washington. Kohn said there was “discomfort in the potential financial stability effects” and added: “There’s some legitimacy in those discomforts.” Fed Governor Jeremy Stein has said some credit markets, such as corporate debt, show signs of excessive risk-taking, while not posing a threat to financial stability. Representative Jeb Hensarling, chairman of the House committee that oversees the Fed, last week said he plans “the most rigorous examination and oversight of the Federal Reserve in its history.” While any effort to rewrite the law establishing Fed powers lacks support from Democrats who control the Senate, the scrutiny is undesirable for central bankers who believe “independence is priceless,”
Fed Watch: FOMC Meeting Something of a Nail Biter -- Tapering will be on the table at this week's FOMC meeting, but will the Fed take the first step to ending the asset purchase program or let it ride into the new year? Wall Street analysts, economists, and pundits are all over the map on the tapering question, via Supeed Reddy at the Wall Street Journal. My own position is that while the Fed wants to taper, they will pass on this opportunity - although I admit I don't hold that position with any great conviction. The data flow in my opinion, is rather ambiguous in regards to tapering. Given that ambiguity, other factors will comes into play. One factor is the potential for disrupting bond markets during a traditionally illiquid month. We know from this summer's experience that the Federal Reserve is very sensitive to market functioning. Another factor is the institutional shake-up underway at the Fed. There is a potential continuity risk in changing policy now given the number of new faces among the voting members next year. In the absence of a dire rush to taper, it is reasonable to think the Fed will defer judgement until the crop of officials who will actually be carrying out the asset purchase wind down are all seated at the table. Regarding the ambiguity of the data, I am hard-pressed to say that the economy has changed radically since September. To be sure, the employment data is arguably firmer, but this really speaks more to the tendency of Fed officials to be overly sensitive to the last data point than any real change in the underlying pace of activity. Compare the 12-month and 3-month trends in nonfarm payroll growth:
Taper time? Close call for Fed - My colleague Pedro da Costa and I have a column in The Wall Street Journal today looking at the Fed’s two sets of considerations for winding down its $85 billion monthly bond-buying program. The Fed will end the program when it’s seen sufficient progress on the economy, or when the costs of continuing exceed the benefits. It’s not a clear-cut decision. The economy is making progress on the growth and employment front, but not inflation. Meanwhile, officials still believe the benefits of the bond-buying programs exceed the costs. Here’s another argument for why Fed officials meeting Tuesday and Wednesday might want to begin winding down the program sooner rather than later. It relates to the second test, costs versus benefits. Fed officials believe the benefits of bond buying recede over time and the costs grow. A moment comes, in other words, when they believe the tool stops being useful. If the Fed wants to use this program in the future, say for some unforeseen shock to the economy or another unexpected growth slowdown, officials might want to keep some of their powder dry by winding it down now while they’ve got an opportunity. I don’t know if this argument would win the day. In the past, the Fed has rejected arguments like this. For example, in late 2008 some economists argued that the Fed should keep its powder dry by cutting interest rates slowly. Instead, Fed Chairman Ben Bernanke moved aggressively to zero in December 2008. With the decision this week a close call, however, arguments like this could influence the debate.
Fed Tapers, Ben Bernanke Supports Cuts In Bond Buying - The Federal Reserve announced Wednesday that it plans to scale back its massive program of bond-buying to stimulate the economy, defying economists’ expectations that it would maintain current policy at least until after the New Year. The central bank’s Open Market Committee said it would cut the bond-buying program by $10 billion to $75 million, an action known as tapering. Stocks initially jumped on the announcement, and the Dow Jones Industrial Average was 137 points, or about 0.85 percent for the day, as of 2:20 p.m. Though the committee believed the economy and the job market have improved enough to warrant a slight decrease in monetary stimulus, it warned that the unemployment rate “remains elevated.” It also noted that the housing sector has slowed in recent months, and that short-term budget cutting efforts from Congress were slowing the recovery as well. Outgoing Fed Chairman Ben Bernanke supported the move. The Fed stressed that it is willing to adjust its purchases in the future either upwards or downwards if economic conditions warrant. In another change, the committee said that it would likely keep short-term interest rates near zero ”well past the time that the unemployment rate declines below 6-1/2 percent,” especially if inflation remains muted.
Fed Statement Following December Meeting - The following is the full text of the Fed's statement following its December meeting.
FOMC Statement: Taper! -- FOMC Statement: (except) Information received since the Federal Open Market Committee met in October indicates that economic activity is expanding at a moderate pace. Labor market conditions have shown further improvement; the unemployment rate has declined but remains elevated. Household spending and business fixed investment advanced, while the recovery in the housing sector slowed somewhat in recent months. Fiscal policy is restraining economic growth, although the extent of restraint may be diminishing. Inflation has been running below the Committee's longer-run objective, but longer-term inflation expectations have remained stable. Taking into account the extent of federal fiscal retrenchment since the inception of its current asset purchase program, the Committee sees the improvement in economic activity and labor market conditions over that period as consistent with growing underlying strength in the broader economy. In light of the cumulative progress toward maximum employment and the improvement in the outlook for labor market conditions, the Committee decided to modestly reduce the pace of its asset purchases. Beginning in January, the Committee will add to its holdings of agency mortgage-backed securities at a pace of $35 billion per month rather than $40 billion per month, and will add to its holdings of longer-term Treasury securities at a pace of $40 billion per month rather than $45 billion per month. The Federal Reserve releases a statement at the conclusion of each of its policy-setting meetings, outlining the central bank’s economic outlook and the actions it plans to take. Much of the statement remains the same from meeting to meeting. Fed watchers closely parse changes between statements to see how the Fed’s views are evolving. The following tool compares the latest statement with its immediate predecessor and highlights where policy makers have updated their language. This is the December statement compared with October.
The Taper Has Arrived! - It’s taper-time, as the Fed just announced that starting next month they’ll be reducing their monthly bond purchases from $85 billion to $75 billion. A change of that magnitude would not show up in the real economy–there are those who question whether QE shows up at all; I’d beg to differ–look at mortgage rates and housing activity, for one–but for its impact on expectations regarding the Fed’s future plans. And here, paradoxically, I’d say today’s move is probably stimulative (that was certainly the market’s reaction). First, tapering isn’t tightening; they’re simply reducing the amount of punch they’re adding to the bowl by a few tablespoons. Second, there’s this new language from the statement today (my bold): The Committee now anticipates, based on its assessment of these factors, that it likely will be appropriate to maintain the current target range for the federal funds rate well past the time that the unemployment rate declines below 6-1/2 percent, especially if projected inflation continues to run below the Committee’s 2 percent longer-run goal. So from the perspective of monetary stimulus, the Fed giveth in terms of forward guidance and taketh away addeth less in terms of QE.
FOMC statement, December 2013 — Taper begins, new language strengthening forward guidance -- Well, it’s begun. Here’s the relevant passage:Beginning in January, the Committee will add to its holdings of agency mortgage-backed securities at a pace of $35 billion per month rather than $40 billion per month, and will add to its holdings of longer-term Treasury securities at a pace of $40 billion per month rather than $45 billion per month. But the statement also includes a new line that bolsters forward guidance without changing the extant thresholds:The Committee now anticipates, based on its assessment of these factors, that it likely will be appropriate to maintain the current target range for the federal funds rate well past the time that the unemployment rate declines below 6-1/2 percent, especially if projected inflation continues to run below the Committee’s 2 percent longer-run goal.The full text of the statement is below, and of course we’ll be discussing it in detail and providing real-time coverage of the presser on Markets Live starting at 2:20pm
FOMC Projections and Press Conference - The key sentences in the announcement were: "In light of the cumulative progress toward maximum employment and the improvement in the outlook for labor market conditions, the Committee decided to modestly reduce the pace of its asset purchases. Beginning in January, the Committee will add to its holdings of agency mortgage-backed securities at a pace of $35 billion per month rather than $40 billion per month, and will add to its holdings of longer-term Treasury securities at a pace of $40 billion per month rather than $45 billion per month." And on forward guidance: "The Committee now anticipates, based on its assessment of these factors, that it likely will be appropriate to maintain the current target range for the federal funds rate well past the time that the unemployment rate declines below 6-1/2 percent, especially if projected inflation continues to run below the Committee's 2 percent longer-run goal." Rates will be low for a long long time ... As far as the "Appropriate timing of policy firming", the participants moved out a little with three participants now seeing the first increase in 2016.
Fed to Start Unwinding Its Stimulus Next Month - — The Federal Reserve said on Wednesday that it would gradually end its bond-buying program during 2014, a modest first step toward unwinding the central bank’s broader stimulus campaign as its officials gain confidence that the economy is growing steadily. The Fed plans to cut its monthly purchases of Treasury and mortgage-backed securities from $85 billion in December to nothing by the end of next year in a series of small steps, starting with a reduction to $75 billion in January, the central bank announced after a two-day meeting of its policy-making committee. At the same time, the Fed sought to offset concerns that it was once again pulling back too soon by strengthening its plans to hold short-term interest rates near zero, which officials regard as a more powerful means of stimulating growth. Both policies aim to hold down borrowing costs and revive risk-taking. The Fed’s shift in policy, in effect, means it plans to do less now and more later. That is a result of a compromise that has been months in the making between a group of officials convinced that the economy needs more help, and a range of internal critics who regarded the bond-buying campaign as ineffective or dangerous. The Fed’s chairman, Ben S. Bernanke, insisted that the net effect was not a withdrawal of support for the economy. “We are not doing less,” he said at a news conference on Wednesday. “I think we have been aggressive to try to keep the economy growing, and we are seeing progress in the labor market. I would dispute the idea that we are not providing a lot of accommodation to the economy.”
Fed Watch The Beginning of the End for Quantitative Easing - In his final press conference, Federal Reserve Chairman Ben Bernanke announced and explained the plan to end the quantitative easing, beginning with a $10 billion reduction in the pace of asset purchases. This policy action is something of a fitting end to Bernanke's tenure, as it marks the exit from the unconventional efforts that characterized monetary policy during the crisis. And at first blush, Bernanke and his colleagues managed the process deftly in comparison to Bernanke's ill-fated press conference in June as stock markets surged to new highs while Treasury yields edged down. Attention will now shift to the timing of the first rate hike, still not expected to arrive until 2015. It has been long known that the Federal Reserve desperately wanted to end the asset purchase program; the issue for months has been timing the first step in that direction in coordination with market acceptance that tapering is not tightening. To that end, the Fed has leaned heavily on forward guidance to entrench expectations of the path of short term interest rates to cap the rise in long-term rates. We knew that the time for such a move was soon at hand, with analysts largely split on the exact date between the next three meetings, with no forecast coming with much conviction (I thought they would wait until after the New Year). To justify tapering, the Fed cited progress toward goals. From the statement: In light of the cumulative progress toward maximum employment and the improvement in the outlook for labor market conditions, the Committee decided to modestly reduce the pace of its asset purchases. The last labor report and its reported decline in the unemployment rate, were the final straw. Moreover, they have greater confidence in the sustainability in the pace of job gains.
Fed Projections See No Rate Increase Until 2015 - Slightly more Federal Reserve officials see the central bank waiting longer to start raising short-term rates.Only two Fed officials now say the central bank will increase the benchmark federal funds rate in 2014, one fewer than held that view in September, according to new projections released Wednesday. The latest projections show 12 policy makers expect rates to first increase in 2015, the same as in September. Now three say the Fed funds rate will first rise in 2016, up from two in September.The latest projections highlight the central bank’s plans to keep interest rates low well after it starts winding down its bond-buying program. The Fed has held short-term rates near zero since December 2008 to help the U.S. economy recover from a severe recession.The projections call for the rates to rise only modestly when they do increase, with 10 of 17 officials forecasting rates to stay at or below 0.75% through end of 2015. A majority of policymakers say rates will stay below 2% through the end of 2016. The slight shift in expectations for the first Fed rate increase may reflect weak inflation in the economy. Inflation has been subdued this year, with the personal consumption expenditure price index advancing just 0.7% in October from a year earlier.Fed officials expect PCE inflation for all of 2013 will be 1.0% or less. They see inflation strengthening slightly next year, to the 1.4% to 1.6% range. In September, Fed officials said 2014 inflation could be as strong as 1.8%. The central bank’s inflation target is 2.0%. Officials say 2015 inflation will be in the 1.5% to 2.0% range.
The Late, Great Taper Starts With Low Interest Rates as Far as the Eye Can See - Wall Street was all aghast that their quantitative easing was about to disappear. The FOMC decided to taper iin January and now stocks soar. Why? Because the taper is minimal and the FOMC announced the federal funds rate will remain an effective zero for much longer than previously estimated. Beginning in January, the Committee will add to its holdings of agency mortgage-backed securities at a pace of $35 billion per month rather than $40 billion per month, and will add to its holdings of longer-term Treasury securities at a pace of $40 billion per month rather than $45 billion per month. This is only $10 billion less in additional purchases than previously. This means quantitative easing is still continuing, just as a slightly smaller size than previously. $75 billion is additional purchases so the Fed did not go cold turkey on additional purchases of mortgage backed securities and U.S. Treasuries. Additionally the Fed did not announce a schedule for tapering, additional reductions are dependent on economic conditions:If incoming information broadly supports the Committee's expectation of ongoing improvement in labor market conditions and inflation moving back toward its longer-run objective, the Committee will likely reduce the pace of asset purchases in further measured steps at future meetings. However, asset purchases are not on a preset course, and the Committee's decisions about their pace will remain contingent on the Committee's outlook for the labor market and inflation as well as its assessment of the likely efficacy and costs of such purchases. The FOMC also released a timing chart on when they expect the federal funds rate to rise and what value. The dots in the chart are individual FOMC members and to the right is the expected federal funds rate. Most of the members, 12, expect to raise the federal funds rate in 2015.
Hilsenrath’s Takeaways From December Fed Meeting - The Fed reduced its bond purchases from $85 billion per month to $75 billion per month, something it described as a modest move. Moreover, officials said they would likely reduce the program at future meetings in “measured steps.” The Fed said the move was made “in light of cumulative progress toward maximum employment and the improvement in the outlook for labor market conditions.” More reductions are expected “in measured steps” at future meetings. But it depends on the economy living up to the Fed’s expectations and it is not on a preset course. Fed officials have become a little more concerned about the outlook for inflation, which has been running below the Fed’s 2% objective for months. In October, the Fed’s preferred measure of inflation was up just 0.7% from a year earlier. Earlier in the year, the Fed said it expected inflation to start drifting back up toward the 2% goal, a point that was reflected in its policy statement. Today’s statement includes a shift. “The [Fed] recognizes that inflation persistently below its 2 percent objective could pose risks to economic performance, and it is monitoring inflation developments carefully for evidence that inflation will move back toward its objective over the medium term.” In other words, if inflation keeps undershooting its target, the Fed might have to alter the policy course it set out today. The vast majority of Fed officials doesn’t expect the central bank to begin raising short-term interest rates until 2015 and three think the Fed won’t get started until 2016. The majority thinks that rate increases in 2015 will be modest and that the benchmark fed funds rate will remain below 1% by the end of that year. The majority also expects the fed funds rate to remain below 2% in 2016. These low rate expectations persist even though the Fed sees the unemployment rate falling below 6.5% next year. That 6.5% rate is the Fed’s threshold for when it will begin talking about rate increases. The forecasts show officials expect to keep rates low for a while even after that discussion begins.
Despite Falling Short of Goals, Fed Suffers From QE-Fatigue - The Federal Reserve justified its decision to begin pulling back on the pace of its bond-buying program Wednesday on the grounds that labor market conditions have been improving and appear set to continue doing so. However, there was another, less explicit reason that policy makers cite privately for curtailing bond purchases. Call it QE fatigue: many policy makers, for one reason or another, are simply growing increasingly uncomfortable with the unconventional policy known as quantitative easing, or QE. “It is a bit puzzling – it certainly is there but they haven’t done a good job explaining what is motivating it,” said Michael Feroli, chief U.S. economist at J.P. Morgan and a former Fed staffer. “They constantly reference financial stability as their number one potential QE cost, but they don’t explain in more detail why this is so, it’s a bit mystifying.” The reasons differ depending on the official. For some, there are fears of bubbles. Others worry about future inflation, despite the lack of any evidence that such a spike is on the horizon. Another group, still, is simply suffering from a bit of sticker shock now that the central bank’s balance sheet is just about five times its precrisis size — a whopping $4 trillion. Listen to Fed Chairman Ben Bernanke make a forceful case for a second round of bond buys back in 2010 at the Kansas City Fed’s Jackson Hole conference: Contrast that with his rather tepid endorsement of the program’s third incarnation at the same symposium in 2012, just before the Fed launched QE3: “It appears reasonable to conclude that nontraditional policy tools have been and can continue to be effective in providing financial accommodation, though we are less certain about the magnitude and persistence of these effects than we are about those of more-traditional policies.”
Fed’s Rosengren: FOMC Dissent Focused on Counseling Patience - Federal Reserve Bank of Boston President Eric Rosengren released a statement Friday explaining in greater detail why he dissented against the central bank’s decision earlier this week to cut back on its easy money policy. Mr. Rosengren said he opposed the Federal Open Market Committee decision to pull back on the pace of its bond-buying stimulus program because he isn’t yet fully confident the recent spate of better economic news will continue. When it comes to lowering the level of support the Fed is providing the economy, Mr. Rosengren said, “I would prefer to wait until the economic improvement that I am forecasting is clearly evident in the data before reducing the size of the asset-purchase program.” Given how far the Fed is falling short on its inflation and employment goals, “I think patience remains appropriate at this time,” the official said. The FOMC announced on Wednesday that beginning in January it would lower the monthly pace of its bond-buying campaign from $85 billion to $75 billion. It will likely cut that pace further if the economy continues to grow and the unemployment continues to decline, in the view of most market participants. In a press conference after the FOMC meeting, Fed chief Ben Bernanke emphasized the central bank isn’t on a preset course and will allow the economy to dictate what happens with monetary policy. Mr. Rosengren has been one of the Fed’s biggest defenders of the bond-buying program. He has argued for some time in support of very aggressive action on the part of the central bank to lower high levels of unemployment.
Tardy Taper Thoughts - Paul Krugman - As many have noted, it looks as if the Fed has managed to pull the trick off this time — slowing the rate at which it purchases long-term assets, while simultaneously conveying the message that this did not signal a general hawkish turn, that short rates would remain at zero for a long time. But why, exactly, is the Fed eager to start exiting the QE business, even as it clearly remains concerned that the economy is too weak? The official statement was uninformative. What one hears is that a fair number of people at the Fed worry that QE is feeding speculative bubbles, as investors search for yield that really isn’t there.But surely that’s a feature of cheap money in general; the same argument could be used for raising short-term rates despite a weak economy and low inflation. The point is that the dilemma that supposedly explains the Fed’s attempt to give with one hand what it took away with the other really has nothing to do with the form of monetary policy, and everything to do with the pretty clear evidence that the natural rate of interest is negative, which ties us back to the whole secular stagnation issue. So why the Fed’s twist? My guess is that it’s ultimately political: that ever-growing balance sheet causes problems with Congress; Republicans hate easy money in general, but a Fed balance sheet of FOUR TRILLION DOLLARS [/Dr. Evil] offers an exceptionally easy target.
The Fed’s Taper and Market Fealty - Yves Smith - The Fed’s announcing the taper was supposed to be an earth-shaking event. But that actually sorta happened last summer when Bernanke first used the “t” word and interest and mortgage rates made an impressive upward march in a short period of time. From my considerable remove, what was noteworthy about the Fed’s announcement yesterday is how terrified it seems to be of creating an upset. This in and of itself is pretty odd, since other central banks are still engaged in QE and/or aggressive liquidity creation (Japan is going to do even more soon) so as to make the impact of any move by the Fed not that consequential in isolation. And that’s before you consider the historical evidence that undoing QE did all of…bupkis. As Philip Pilkington writes: There are two things that are particularly odd about all the tapering talk — two things that are tied up with one another. The first is that there is talk at all. If tapering evidently makes rather little difference to the markets and the economy then why do the press and financial analysts talk about it endlessly? The answer to this is rather simple: it is the nature of the press and wider society to talk about people and institutions that are perceived to wield power… The second thing that was rather odd about all the tapering talk was the constant reference to the supposed fact that it had never been done before, that we were entering uncharted waters and that it was hard to predict what effect such tapering might have. This was just complete and utter rubbish. In actual fact, as I noted on FT Alphaville back in April, a far more extreme version of tapering was undertaken by the Japanese central bank (JCB) in early 2006. And what were the effects? I cannot find any serious effects in the data. So, why is no one reporting on this? Surely this should be a worthy news item. Given that barrels upon barrels of ink that are expended daily reflecting on the significance of the taper surely the press should be interested in considering a far more substantial move away from QE. Not really. That would be the equivalent of revealing that the emperor has no clothes.
Chinese Official Praises U.S. Fed’s Tapering -- A senior Chinese finance official cheered the decision this week by the U.S. Federal Reserve to ease back on its efforts to stimulate the economy – even as he offered a cautionary note that the central bank should be mindful of the consequences of its actions. At a press conference in Beijing on Friday to discuss a round of trade meetings between China and the U.S., Vice Minister Zhu Guangyao of China’s Ministry of Finance said that the Fed’s decision to begin reducing its bond purchases ”shows the U.S. economy is gradually recovering.” He called that “positive signal” for the U.S. and global economy. He reiterated China’s position that the Fed should take into account the international consequences of its monetary policy when it makes decisions. “We call on the U.S. to work as a responsible major country and to be responsible for the spillover effect of its policy,” he said. To that end, he said, U.S. monetary policy should have a “clear direction.” The Fed’s decision-making is aimed at strengthening the U.S. economy. Fed policy makers argue that a stronger U.S. economy—the world’s largest—benefits the global economy.
Fed Focus Shifting to Stubbornly Low US Inflation -- After years of struggling to reduce high unemployment, the Federal Reserve is grappling with another tough challenge: How to raise very low inflation. So far, the Fed has had more success with the unemployment rate, which has fallen more than a percentage point to 7 percent since the Fed launched its bond-buying program last year. But inflation has declined since then and remains far below the Fed's 2 percent target. Fed policymakers expect inflation to remain below the target through at least 2015."There is still this question about inflation, which is more than a bit of a concern," Chairman Ben Bernanke said at a news conference Wednesday. The Fed "is determined to avoid inflation that is too low, as well as inflation that is too high." Most Americans likely prefer lower inflation when they pick up groceries or shop at the mall. But Bernanke and many other economists worry that if inflation falls too low, it will lead consumers and businesses to delay spending. Very low inflation also makes debts comparatively more expensive to pay off. The Fed decided Wednesday to cut its monthly bond purchases to $75 billion from $85 billion starting in January. Bernanke suggested that the purchases could end by late next year. That's evidence that the Fed thinks the job market and economy will continue to improve with less help from the Fed. But if inflation remains too low, Bernanke said the Fed might decide to keep short-term interest rates near zero for a longer period or take other steps to try to boost inflation.
What if we got the sign wrong on monetary policy? - I've been following with interest the rumblings of economists playing with an amazing idea -- what if we have the sign wrong on monetary policy? Could it be that raising the interest rate raises inflation, and not the other way around? Most recently, Steve Williamson plays with this idea towards the end of a recent provocative blog post; he concludes: If the Fed actually wants to increase the inflation rate over the medium term, the short-term nominal interest rate has to go up. So, here's the policy advice for our friends on the FOMC...If there's any tendency for inflation to change over time, it's in a negative direction, as long as the Fed keeps the interest rate on reserves at 0.25%. Forget about forward guidance...So, as long as the interest rate on reserves stays at 0.25%...you're losing by falling short of the 2% inflation target, which apparently you think is important. And you'll keep losing. So, what you should do is Volcker in reverse.. For good measure, do one short, large QE intervention. Then, either simultaneously or shortly after, increase the policy rate. Under current conditions, the overnight nominal rate does not have to go up much to get 2% inflation over the medium term. Conventional wisdom says no, of course: raising interest rates lowers inflation in the short run and and only raises inflation in a very long run if at all. The data don't scream such a negative relation. Both the secular trend and the business cycle pattern show a decent positive association of interest rates with inflation, culminating in our current period of inflation slowly drifting down despite the Fed's $3 trillion dollars worth of QE.
Bernanke Defends Transparency Push - WSJ -- Federal Reserve Chairman Ben Bernanke on Monday defended a push for greater central bank transparency during his tenure, arguing it is essential for public acceptance of Fed policies and can help ease financial conditions with interest rates at zero. The Fed has come to rely increasingly on verbal guidance about the likely path of short-term interest rates, most recently saying it is committed to leaving them near zero until the jobless rate falls to 6.5% from its current 7% — and as long as inflation remains under control. “Improved communication can help our policies work better, whether through the disclosure of bank stress-test results by helping the public and market participants better understand how monetary policy is likely to evolve,” Mr. Bernanke said at a Fed event celebrating the institution’s 100th birthday. “Ultimately, the most important reason for transparency and clear communication is to help ensure the accountability of our independent institution to the American people and their elected representatives,” said Mr. Bernanke, who is set to be replaced in February by Vice Chairwoman Janet Yellen, pending her Senate confirmation. Reflecting on two four-year terms at the Fed’s helm that will draw to a close at the end of January, Bernanke also urged policy makers to continue to stand up to political efforts to influence monetary policy. During Mr. Bernanke’s term, the pressure has tended to originate with those who opposed the central bank’s unconventional monetary policy, such as bond purchases.
The Downside of the Fed's Expectations Game - Yesterday, the Federal Reserve announced that it’s kind of sort of about to start ever-so-timidly pulling back on the massive monetary stimulus it’s been pouring out since the financial crisis. Then, stock prices around the world jumped. In the traditional view of monetary policy, this isn’t supposed to happen. Tightening by the Fed should make financial assets less valuable. When you view this reaction in terms of expectations, it makes a bit more sense. As economist Barry Eichengreen put it in the FT, the announcement of the start of the “taper” — the unwinding of the Fed’s bond-buying efforts — was widely expected. What was news in the announcement was that “future policy would remain loose for at least slightly longer than previously anticipated.” Still, even Eichengreen thought the policy shift was too inconsequential to justify the market reaction. Maybe he’ll turn out to be right, and the post-announcement jump will soon be undone. I think there’s more afoot than that, though. Long ago, a central bank’s job may have been as simple as taking away the punch bowl just as the party gets going, to paraphrase William McChesney Martin, the Fed’s chairman from 1951 to 1970. But in Martin’s day, the Federal Open Market Committee was able to make its monetary policy decisions in relative obscurity. Nowadays financial markets often drive the economy, and while this would seem to give the Fed more power, the amount of effort and attention now put into forecasting monetary policy and assessing its impact mean that exercising that power is far more complicated than it used to be.
Fed policy is heading into trouble - The future of monetary policy is troubling. I present a video to explain. (Part 4 of a series on the journey of the Fed rate from 1978 to the present.) Since the 1960′s, the Fed rate has consistently reacted to the natural level of real GDP (in terms of labor and capital utilization). Effective demand sets the natural level. The natural level of real GDP has fallen since the crisis. Monetary policy so far does not recognize this. This graph from the video shows how the natural level of real GDP is determined. A problem is that the Fed along with other economists, like Paul Krugman and Larry Summers, still see a large output gap to bring the economy back to full employment. In effect, they still see the economy returning to the middle trend line above, but with a negative real rate to get us there. The natural real interest rate at full employment is roughly determined by adding productivity growth, population growth and a time preference variable. As people put off consumption into the future, the time preference variable declines. Productivity growth is low, population growth is low and people are preferring to consume less currently. So it might seem reasonable that the natural real interest rate has fallen from its historic range of around 3%. But has the natural real interest rate gone negative? No… It should be positive when the natural level of real GDP is reached in about a year, but not quite as high as 3%. In the video, I say 1.5%. Pimco said that the Fed forecasts reaching its target with a 2% natural real rate by 2019! Well, we won’t have to wait that long.
Bubble-logic and the Fed’s “To Taper or Not to Taper” - Yves Smith -- One of the amusing things right now is that there isn’t much debate in equity-land as to whether to be long or not. The prevailing sentiment is you gotta stay the course until the fat lady sings, or at least clears her throat, in the form of the Fed saying it will really, finally, for sure, start the taper. And of course the Fed wants to have its cake and eat it too. The central bank, in the possession of overwhelming evidence that QE is not doing much for the real economy, very much would like to exit QE but without deflating asset prices. So it hopes that repeatedly insisting that it has absolutely no intent of raising interest rates any time soon will be sufficient to placate the Bond Gods and their drinking buddy, Mr. Market. Now with the central banks’ super cheap money, by design, driving investors into riskier assets, talk of fundamentals seems, well, antique. But behaviorally, something a smidge more complicate is going on. Superficially, this is all typical late bull market/bubble behavior. Even if investors think valuations are strained and downside risks aren’t trivial, they are reluctant to leave the party early, since they get punished for lagging their comparable group. So as Keynes said, it’s better to be ruined in a conventional manner. Their incentives are that it’s actually better for them to stay in too long and get crushed in the rush for the exit, so long as they can succeed in getting no worse stomped on than their colleagues. No investor can afford to admit to their clients that the Fed is dictating their strategy. They all have spiels generally of the form of how they do serious analysis of some sort to come up with their particular picks. They therefore need to craft a description of current conditions that makes them being long make sense given how they profess to invest. I posit that in a lot of cases, they become victims of their own PR.
If Money Printing Failed in Japan, Why Would It Work in the U.S.?: What the Federal Reserve is doing in the U.S. -- its effort to get the economy going via its money printing program -- has already been tried by the second-largest economy in the world: Japan. Unfortunately, the easy monetary policy implemented by the Bank of Japan didn't spur the Japanese economy. So why would it work for the U.S. economy? One of the core purposes of easy monetary policy by the Federal Reserve was to improve lending so businesses would borrow money and grow (hopefully creating jobs) and consumers would borrow and spend (creating economic activity). All of this would lead to improved consumer confidence. The Bank of Japan started a scheme to increase lending in Japan in 2010. It gave funds to its biggest banks to lend to companies. It set aside 21.5 trillion yen for this scheme; but sadly, only 8 trillion yen has been used. (Source: Reuters, October 17, 2013.) Easy money policies, and a program specially designed to give money to banks to lend out to companies, did not work in the Japanese economy. And consumer confidence in the Japanese economy remains bleak. The index that tracks consumer confidence in the country stood at 41.9 in November. At the beginning of the year, it hovered near 45.0. A subset of consumer confidence, an index tracking consumers' willingness to buy durable goods, stood at the lowest level of the year in November at 42.4 compared to 44.9 in January. (Source: Japan's Cabinet Office, December 10, 2013.) The bottom line: after years of easy money policies and with a national debt-to-GDP multiple of 205%, there's been no improvement in consumer confidence or consumer spending in the Japanese economy.
If QE is "heroin", what is "methadone" and how do we avoid "side effects"? - The Federal Reserve remains concerned about exiting the massive bond buying program that has been in place for over a year now. The program has become a bit of a trap (see post), creating a dependence on unsustainable levels of stimulus. The concern is that in an environment where inflation is at historically low levels, cutting back on monetary stimulus could put significant downward pressure on prices, creating deflationary pressures and forcing the Fed to resume or even increase the program (similar to Japan). Using the addiction analogy, this is the equivalent of a relapse risk for those suffering from substance abuse. It turns QE from an extraordinary crisis fighting mechanism meant to be used only under extreme situations into an ongoing monetary policy tool. The Fed desperately wants to return to the days of simply adjusting short-term rates to drive policy. So how does one minimize the impact of taper to reduce the probability of returning to "unconventional" programs? One approach is something that opiate addiction clinicians have been using for some 30 years. An effective treatment for heroin addiction is the use another, less dangerous opiate called methadone. It reduces withdrawal symptoms without creating intoxicating or sedating results, helping many addicts quit. So if heroin is analogous to the Fed's QE program for the economy, what is the equivalent of methadone? Many are arguing that lowering the Interest on Excess Reserves rate (IOER) could potentially counteract some of the QE withdrawal symptoms. IOER is currently at 25 basis points, and while that was considered to be extraordinarily low back in 2008 when it was introduced, in the days of record low short-term rates many view it as being too high. That's because banks are quite comfortable paying near-zero on deposits (including deposits from the Federal Home Loan Banks) and receiving 25bp on reserves - a riskless way to generate revenue (see post). That spread according to some is holding back credit expansion in the US. The chart below shows growth in non-cash assets of all banks operating in the US - an unsettling trend for many economists.
How to Stop Financial Panics? Say Hello to Qualitative Easing - How can governments stop financial panics wrecking their economies? A paper published by the Bank of England on Friday proposes a radical solution: a new breed of central bank-like institutions that buy and sell assets to prevent destabilizing swings in prices. Roger Farmer, a UCLA economics professor and the current holder of a research fellowship at the BOE, writes that financial crises are a frequent occurrence and often hurt citizens not yet born, never mind those who have to live through them. Citing evidence from past stock market crashes and the more-recent fallout from the subprime housing collapse in the U.S., Mr. Farmer argues that asset market volatility wreaks havoc in the real world. Some people will pay twice as much for a home than a neighbor who purchased theirs only a few years earlier. School leavers seeking work in a recession may earn far less throughout their lives than near-contemporaries lucky enough to have found a job in a boom. Mass unemployment frequently follows financial collapse. His solution: “qualitative easing,” and new institutions to implement it. Mr. Farmer argues that the Federal Reserve’s purchase of riskier assets such as mortgage-backed securities was crucial to reviving the stock market in 2009 and spurring economic recovery. Such qualitative easing should become a permanent part of economic policy, he says, and carried out by a new type of institution, modeled on a central bank, that’s charged with fostering greater financial stability and hence a more stable economy by smoothing unwanted fluctuations in markets for stocks and other assets. “By stabilizing asset markets, we can maintain demand and prevent the specter of persistent unemployment,” Mr. Farmer writes.
Federal Reserve control of the short-term interest rate -- Once upon a time, U.S. monetary policy was conducted with its primary target defined in terms of the fed funds rate, which is the interest rate on an overnight loan of Federal Reserve deposits between private banks or other institutions that hold accounts with the Fed. A bank that ended the day with more deposits in its account with the Fed than needed to meet its required balances could lend those funds to another bank that found itself short. The interest rate on these loans was very sensitive to the total level of excess reserves in the system. The Fed's direct control of available reserves gave it near control of the interest rate on loans of fed funds, which was what made the fed funds rate a credible target for implementation of the FOMC's policy directives. Nevertheless, overnight loans of fed funds continue to be made and the interest rate on those loans continues to be reported. Last week, for example, the fed funds rate averaged 0.08% (8 basis points). If you lent $1,000 every day all year long at that rate, you'd have earned about 80 cents in interest at the end of the year. There are a couple of things that are surprising about a fed funds rate of only 0.08%. First, why in the world would an institution lend fed funds to another bank for 8 basis points when it could just hold those reserves overnight in its account with the Fed and earn 25 basis points in the form of the interest that the Fed pays on reserves? A recent analysis by Liberty Street Economics provides the answer. Most of current fed funds lending is being done by government-sponsored enterprises (GSEs) like the Federal Home Loan Banks, which have deposits in accounts with the Fed but, unlike private banks, don't get credited with any interest if they hold those balances overnight. The GSEs thus have an incentive to lend out any extra reserves on the fed funds market, because 80 cents is better than nothing.
Key Measures Shows Low Inflation in November - The Cleveland Fed released the median CPI and the trimmed-mean CPI this morning:According to the Federal Reserve Bank of Cleveland, the median Consumer Price Index rose 0.2% (2.2% annualized rate) in November. The 16% trimmed-mean Consumer Price Index increased 0.1% (1.2% annualized rate) during the month. The median CPI and 16% trimmed-mean CPI are measures of core inflation calculated by the Federal Reserve Bank of Cleveland based on data released in the Bureau of Labor Statistics' (BLS) monthly CPI report. Earlier today, the BLS reported that the seasonally adjusted CPI for all urban consumers was unchanged (with annualized rate of 0.4%) in November. The CPI less food and energy increased 0.2% (1.9% annualized rate) on a seasonally adjusted basis. Note: The Cleveland Fed has the median CPI details for November here.
Key Inflation Measures Still Weak as Fed Meets - Both of the government’s consumer inflation measures are trending well below the Federal Reserve’s 2% target, complicating the central bank’s decision on whether to curtail its easy-money policies this week. The consumer price index advanced 1.2% in November from a year earlier, the Labor Department said Tuesday. The personal consumption expenditures price index, the Fed’s preferred gauge, increased just 0.7% in October from a year prior, according to a Commerce Department report earlier this month. The weak inflation, which reflects soft consumption and wage growth, stands as a potential impediment to the Fed slowing the pace of its $85 billion per month in bond purchases. Policymakers are discussing the future of the program at their meeting Tuesday and Wednesday. An improving labor market and a budget deal among Washington lawmakers has some economists forecasting that the Fed could announce a move to slow its bond buying on Wednesday. Persistently weak inflation would support officials who favor of continuing the program into next year, particularly with evidence that prices could continue to rise very slowly. “Low inflation is one reason we don’t expect a Fed move to taper this week,” While both inflation measures have been weak, the CPI has outpaced the PCE index for more than a year. That’s partly because the CPI places greater weight on housing prices. Shelter costs account for nearly a third of CPI versus only 15% of the PCE index. Tuesday’s report showed shelter prices are up 2.4% from a year earlier — double the pace of overall inflation. The largest component of the shelter index, the estimated cost for homeowners to rent their house, rose 0.3% in November from October. That’s the largest monthly gain in five years.
Headline November Inflation Unchanged, Below Consensus; Core Inflation Higher Than Expected - As we noted earlier today, if there was one piece of news that could tip the scales away from a December taper announcement, it was a November inflation number that came in below expectations. Which it did: the headline November inflation print came in unchanged, on expectations of a 0.1% increase for the month, and up 1.2% for the year, below the 1.3% expected. However, before you BTFATH, note that core inflation - the Fed's preferred metric - actually was higher than expected, with prices ex food and gas, rising 0.2% in November on expectations of a 0.1% increase. Indeed, looking at the components, the headline inflation number was dragged down by gasoline prices which dipped 1.6% in November and overall Energy costs which fell 1.0%. Also notable: apparel inflation was -0.4% in November - the third consecutive month of declines. However, back to the core number, annual inflation was up 1.7% Y/Y just shy of the Fed's target, while core service inflation is up 2.4%.
What is the best way to measure inflation? - There is more than one measure of inflation, so, which one should people pay attention to? The two main candidates are the Consumer Price Index (CPI) and the Personal Consumption Expenditures index (PCE). Which of the two is the better measure? And once that question is decided, is core inflation -- inflation with the effects of changes in food and energy prices removed -- better than an overall measure of inflation? An Economic Letter from the Federal Reserve Bank of San Francisco describes the differences between the CPI and the PCE (which is denoted as PCEPI), and why the Fed prefers the PCE: For most of its history, the Federal Reserve used the CPI to set policy and forecast inflation. However, in February 2000, the FOMC began using the PCEPI to frame its inflation forecasts. The PCEPI and CPI share many of the same features. For example, the PCEPI, like the CPI, is designed to track the prices of goods and services consumed by households, and it includes much of the same data. However, the PCEPI differs from the CPI on many dimensions. The FOMC cited three of these as reasons for switching its focus from the CPI to the PCEPI (Board of Governors 2000). First, the PCEPI’s formula adjusts to changing consumption patterns, while the CPI is based on a basket of goods and services that is largely fixed. Second, the PCEPI is revised over time, allowing for inflation to be tracked as a more consistent series. Third, the PCEPI's larger scope of goods and services provides a more comprehensive picture of the nation's consumer spending than the CPI. Thus, while the media tends to focus on the CPI, most economists believe that the PCE is a superior measure, and Fed watchers should certainly be paying more attention to the PCE than the CPI. However, as the Economic Letter notes, the two measures tend to converge over time, though there can be large differences at some points in time.
Econ Chart Update – Fed Policy and PPI – ZIRP and QE are DEflationary! - The headline Producer Price Index for November was down 0.1%, in line with the consensus guess of economists. What’s going on? Aren’t QE and ZIRP supposed to be inflationary? Isn’t the Fed shooting for 2% inflation? Yes, but wait! The Fed has been doing QE and ZIRP (Zero Interest Rate Policy) for nearly 5 years and for the past year and a half, there’s been no “inflation.” Zero. Zilch. Nada. And Japan has been doing some form of QE and ZIRP for over 20 years, and they’ve been stuck with deflation the whole time.Get the picture? QE and ZIRP are deflationary. Apparently, central bankers don’t get it because it’s against their religion–the mystical belief that their policy of printing money and holding interest rates at zero will stimulate inflation if they just do it for long enough. There’s no basis for it in fact, but they go on believing. Faith is a critical element of central banking. Central banking represents all of the world’s great religions–Christianity, Islam, Buddhism, Shintoism, Judaism, Zoroastrianism, Witchcraft, Devil Worship, and Economics, the last three especially so. The Fed started ZIRP in late 2008 and began printing money hand over fist with QE1 in early 2009. Producer prices had collapsed in 2008 after the commodity bubble blowoff earlier in 2008. That blowoff was an echo of the housing and credit bubble that grew out of years of easy central bank policy and lax regulation. We know how that ended. After the Fed cut rates to zero on the heels of the 2008 crash and started printing money, prices rebounded through QE 1 and 2, but only to their previous level. But look what happened with QE3 and 4 which began late in 2012. No inflation.
Weird is Normal -- Three years ago, Nick Rowe produced this post describing a “weird world” – a world in which the equilibrium interest rate is at or below the long-term growth rate of the economy, rather than above it as we are used to. In such a world, bubbles are inevitably created as investors search for positive yield. This is also the world recently described by Larry Summers. But I don’t think this world is weird. I think it is actually normal, and we have been living in a weird world of unstable Ponzi schemes that eventually crash and reset. I’ve argued that investors have no right to expect real returns on safe assets that are persistently above the real growth rate of the economy. There would be continual transfer of wealth from younger to older and from income-dependent to the asset-rich. The younger and poorer would gradually become either more impoverished or more indebted, while the older and richer became wealthier. Eventually the system would become unsustainable and there would be a crash in which asset holders lost considerable amounts of their wealth. Andy Harless, it seems, agrees with me: “Most economists think that the natural real interest rate is normally positive. I have my doubts, but never mind, because I'm ditching the whole concept. Once we start correcting for expected normal growth rather than expected inflation, we are clearly not dealing with a natural rate concept that can be presumed to be normally positive. If we are talking about a risk-free interest rate, then the need for physical capital returns to compensate for risk would make it very hard to achieve an equilibrium with the interest rate as high as the growth rate, let alone higher.”
Why stagnation might prove to be the new normal - Is it possible that the U.S. and other major global economies might not return to full employment and strong growth without the help of unconventional policy support? I raised that notion — the old idea of “secular stagnation” — recently in a talk hosted by the International Monetary Fund. My concern rests on several considerations. First, even though financial repair had largely taken place four years ago, recovery has kept up only with population growth and normal productivity growth in the United States and has been worse elsewhere in the industrial world. Second, manifestly unsustainable bubbles and loosening of credit standards during the middle of the past decade along with very easy money were sufficient to drive only moderate economic growth. Third, short-term interest rates are severely constrained by the zero lower bound: real rates may not be able to fall far enough to spur enough investment to lead to full employment. Fourth, in such situations falling or lower-than-expected wages and prices are likely to worsen performance by encouraging consumers and investors to delay spending, and to redistribute income and wealth from high-spending debtors to low-spending creditors. The presumption that normal economic and policy conditions will return at some point cannot be maintained. Look at Japan, where gross domestic product is less than two-thirds of what most observers predicted a generation ago, even though interest rates have been at zero for many years. U.S. GDP is more than 10 percent below what the Congressional Budget Office predicted before the financial crisis.
Larry Summers On Why "Stagnation Might Be The New Normal"... And Bubbles -- Larry Summers, who was nearly picked by Obama as the next Fed Chairman before for some inexplicable reason the Economist lobby deemed him "hawkish" and that he would put a halt to the Fed-Treasury cross monetization complex, is no stranger to providing hours of entertainment with his aphoristic quotes. Recall from October 2011, where he said that the solution to record debt is more debt: "The central irony of financial crisis is that while it is caused by too much confidence, too much borrowing and lending and too much spending, it can only be resolved with more confidence, more borrowing and lending, and more spending." Larry Summers, source This of course led to his pronouncement last month that the US economy needs "bubbles" to "grow", which promptly won him accolades from none other than his former basher Paul Krugman, best known for this line from 2002: "To fight this recession the Fed needs…soaring household spending to offset moribund business investment. Alan Greenspan needs to create a housing bubble to replace the Nasdaq bubble." Yes, somehow this person was seen as hawkish. Either way, it seems Larry was modestly disgruntled with the prevailing assessment of the media world ascribing to him the title of the next Krugs, in proposing a policy of endless bubble booms and busts, and as a result, he decided to take to the pages of that hallowed bastion of "free and efficient markets", the FT, to explain what he really meant. His full essay is below but the punchline is as follows: Some have suggested that a belief in secular stagnation implies the desirability of bubbles to support demand. This idea confuses prediction with recommendation. It is, of course, better to support demand by supporting productive investment or highly valued consumption than by artificially inflating bubbles. On the other hand, it is only rational to recognize that low interest rates raise asset values and drive investors to take greater risks, making bubbles more likely. So the risk of financial instability provides yet another reason why preempting structural stagnation is so profoundly important.
The 1% is Hogging so much of our Income that it's Holding the Economy Back - We all know that inequality has been rising and the average American household has been suffering. There is a myth that says all this suffering is necessary, that extreme inequality is the by-product of a rapidly growing economy—or worse, that it’s a good thing because it motivates everyone to work hard and climb the long ladder to the One Percent.Even a brief glance at the historical record reveals just how perverted this hypothesis is.For one thing, the economy has not been growing rapidly since inequality started climbing. From 1950 to 1980, “real gross domestic product (GDP)”—the output of the economy, adjusted for inflation—grew by 3.8 percent per year. From 1980 to 2010, it grew by 2.7 percent per year. (Since then, it’s been even worse.)So income inequality hasn’t been “growth-enhancing” at all. In fact, just the opposite. The United States isn’t alone in this experience. Economists at the International Monetary Fund recently compiled the most comprehensive data set to date: 140 countries over 6 decades. They consistently found that countries with less inequality experienced stronger, more sustained economic growth and fewer, less severe recessions.
U.S. Economy Expands at 4.1 Percent Rate - The U.S. economy grew at a solid 4.1 percent annual rate from July through September, the fastest pace since late 2011 and significantly higher than previously believed. Much of the upward revision came from stronger consumer spending. The Commerce Department’s final look at growth in the summer was up from a previous estimate of 3.6 percent. Four-fifths of the revision came from stronger consumer spending, primarily in the area of health care. The 4.1 percent third quarter growth rate came after the economy expanded at a 2.5 percent rate in the second quarter. Much of the acceleration reflected a buildup in business stockpiles. Economists believe growth has slowed to between 2 percent and 2.5 percent in the current quarter, in part because they believe inventory growth has slowed.
Q3 GDP Revised up to 4.1% -- The BEA reports: Real gross domestic product -- the output of goods and services produced by labor and property located in the United States -- increased at an annual rate of 4.1 percent in the third quarter of 2013 (that is, from the second quarter to the third quarter), according to the "third" estimate released by the Bureau of Economic Analysis. ... The GDP estimate released today is based on more complete source data than were available for the "second" estimate issued on December 5, 2103. In the second estimate, the increase in real GDP was 3.6 percent ... With this third estimate for the third quarter, increases in personal consumption expenditures (PCE) and in nonresidential fixed investment were larger than previously estimated. The upward revision to the percent change in real GDP primarily reflected upward revisions to personal consumption expenditures and to nonresidential fixed investment that were partly offset by a downward revision to residential fixed investment.Here is a comparison of the second and third estimates of GDP. PCE was revised up from a 1.4% annualized increase to 2.0%. Note: Analysts are also upping their forecasts for Q4 GDP. As an example, from Merrill Lynch: The data continue to come in stronger than expected and so we have raised our forecast for 4Q GDP growth from 1.2 to 2.1%.
Third-Quarter Growth in U.S. Revised Higher on Services - Gross domestic product climbed at a revised 4.1 percent annualized rate, the strongest since the final three months of 2011 and up from a previous estimate of 3.6 percent, Commerce Department data showed today in Washington. The gain exceeded the most optimistic projection in a Bloomberg survey. Inventories accounted for a third of the increase in GDP in the third quarter, showing companies were confident about the prospects for demand. Stronger retail sales in October and November underscore the Federal Reserve’s view that the world’s largest economy is improving. “This is a very good sign for momentum going into the fourth quarter.” The median forecast of 72 economists surveyed by Bloomberg projected a 3.6 percent gain in GDP, the value of all goods and services produced in the U.S. Forecasts ranged from 3.3 percent to 3.8 percent.
US growth of 4.1% validates Fed move - FT.com: The US economy grew at its fastest rate in nearly two years in the third quarter of 2013 after revisions boosted the annualised rate of expansion from 3.6 to 4.1 per cent , days after the Federal Reserve said it would start scaling back its $85bn-a-month monetary stimulus. Critically, almost all of the upward revision was due to stronger consumption, which grew at an annualised rate of 2 per cent rather than 1.4 per cent. This suggests greater underlying momentum in the economy. The revision in growth adds to a series of recent data that suggests the US economy is accelerating and validates the Federal Reserve’s decision this week to taper its asset purchases from $85bn to $75bn a month. The figures provide a fresh hint that 2014 growth could be better than expected as the economy finally accelerates after a five-year struggle. “The US economy has flattered to deceive several times in recent years, looking like it was set for a period of faster growth only to fall flat,” said Joseph Lake, US analyst for the Economist Intelligence Unit. But Mr Lake says he thinks this time is different. “We expect the US to embark on a sustained economic upswing in the coming quarters.” A rapid increase in business inventories was still a big reason for growth in the third quarter, contributing 1.7 percentage points of the total expansion. But the consumption revision meant that final sales of domestic product, which is a better indicator of underlying demand in the US economy, was revised up from an annualised increase of 1.9 to 2.5 per cent.
GDP Q3 Third Estimate: Upside Surprise at 4.1% - The Third Estimate for Q3 GDP, to one decimal, was revised upward to 4.1 percent from the 3.6 percent Second Estimate. Investing.com had forecast no change at 3.6 percent. The GDP deflator used to calculate real (inflation-adjusted) GDP was unchanged at 2.0 percent. Q3 GDP of 4.1 percent is a a substantial move from the 2.5 percent of Q2 and this highest quarterly reading since the 4.9 percent of Q4 2011. Here is an excerpt from the Bureau of Economic Analysis news release: Real gross domestic product -- the output of goods and services produced by labor and property located in the United States -- increased at an annual rate of 4.1 percent in the third quarter of 2013 (that is, from the second quarter to the third quarter), according to the "third" estimate released by the Bureau of Economic Analysis. In the second quarter, real GDP increased 2.5 percent. The GDP estimate released today is based on more complete source data than were available for the "second" estimate issued on December 5, 2103. In the second estimate, the increase in real GDP was 3.6 percent (see "Revisions" on page 3). With this third estimate for the third quarter, increases in personal consumption expenditures (PCE) and in nonresidential fixed investment were larger than previously estimated. The increase in real GDP in the third quarter primarily reflected positive contributions from private inventory investment, PCE, nonresidential fixed investment, exports, residential fixed investment, and state and local government spending that were partly offset by a negative contribution from federal government spending. Imports, which are a subtraction in the calculation of GDP, increased. The acceleration in real GDP growth in the third quarter primarily reflected an acceleration in private inventory investment, a deceleration in imports, and accelerations in state and local government spending and in PCE that were partly offset by a deceleration in exports. [Full Release] Here is a look at GDP since Q2 1947 together with the real (inflation-adjusted) S&P Composite. The start date is when the BEA began reporting GDP on a quarterly basis. Prior to 1947, GDP was reported annually. To be more precise, what the lower half of the chart shows is the percent change from the preceding period in Real (inflation-adjusted) Gross Domestic Product. I've also included recessions, which are determined by the National Bureau of Economic Research (NBER).
Q3 GDP Revised Up AGAIN (6 graphs) The third (and final) estimate of real GDP for the third quarter from the BEA reveals another large upward revision, from 2.8% in the advance estimate to 3.6% in the second, and now to 4.1% annualized growth. As mentioned in an earlier post, much of this increase came from the big pop in inventory investment (contributing 1.67 percentage points to the 4.1% increase)–likely meaning it will be unwound over the coming quarters. The drop in government spending over the last several years is also of note. As mentioned by the Action Economics team: “We now have a 6.4% cumulative drop in real government spending since Q2 of 2010, versus a smaller 3.8% drop after the Vietnam War but a larger 11.8% drop after the Korean War.” There was also a large revision in the new intellectual property category, from 1.7% to 5.8%; however, the category is still too new to make any comments about expected revisions. One negative that stands out for the overall health of the economy is the rise in both initial and continuing claims. Claims are averaging 374k in December, higher than September and October. As always, there may be many “explanations” delivered ex-post….such as “the holiday season”, “computer glitches in California”, “storms”, etc. Be that as it may….initial claims have moved up over the past couple of months.
Revision Shows U.S. Growing at Fastest Rate Since 2011 - — The United States economy grew at a torrid 4.1 percent annual pace in the third quarter, the Commerce Department said Friday. That is the strongest growth in nearly two years, and only the third time the economy has expanded that quickly since 2006. The Commerce Department revised its estimate of third-quarter growth to 4.1 percent from 3.6 percent in this release. The refined estimate is based on “more complete source data,” the department said, showing personal consumption and investment in things like factories to be higher than previously thought. Economists had expected the final estimate of growth to be unchanged from that earlier 3.6 percent. But data showed that consumers have stepped up their spending on health care, houses and cars as the strengthening recovery has led to a sharp drop in the unemployment rate and rising home values have improved household balance sheets. The Commerce Department bumped up its estimate of consumer spending, which accounts for more than two-thirds of economic activity, to a 2 percent rate from 1.4 percent, reflecting higher spending on goods and services. The newfound strength has spurred the Federal Reserve to begin to unwind its bond-buying program, cutting its monthly purchases of Treasury and mortgage-backed debt. “In light of the cumulative progress toward maximum employment and the improvement in the outlook for labor market conditions, the committee decided to modestly reduce the pace of its asset purchases,” the Fed said in a statement this week. The growth came from a broad range of sources: personal consumption, exports, investment in new factories and houses, state and local government spending and a rise in business inventories. Federal spending cuts and rising imports were a drag on growth, the department said. Economists expect growth to slow in the fourth quarter, in part because some of the upswing has resulted from businesses building up their inventories
Final Q3 GDP Revision Smashes Expectations, Prints Nearly 50% Higher Than Initial Estimate - When a month ago, the BEA released its first revision to Q3 GDP, the lament from even the biggest sycophants of data manipulation was that the bounce in estimated Q3 economic output from 2.84% to 3.61% was driven entirely by inventory accumulation, while personal consumption as a % of the final GDP number actually declined from 1.04% to 0.96%.Sequentially, the ever missing personal consumption was revised up 2% vs the estimated up 1.4%, far above the highest estimate of 1.6%, and also the prior 1.4% print. Which is why absolutely nobody was surprised to see the BEA mysteriously keep virtually every other GDP component unchanged but boost Personal Consumption Expenditures from 0.96% of GDP to 1.36%. The end result is that the GDP reported in the first revision number has been boosted once again to a simply ludicrous 4.1%, smashing expectations of a 3.6% print. Putting this "revision" in perspective, the final GDP is now 45% higher than the first GDP estimate of 2.84%, and there is a whopping 1.5% delta between the first and final revision, which in our record books is the biggest revision on record.
Holy Cow! Q3 GDP Revised Up to 4.1% - Q3 2013 real GDP had yet another blow out revision upward and is now 4.1%. Originally GDP was reported to be 2.8% for the third quarter, then it was revised to 3.6%. Now we have another revision showing a whopping large third quarter GDP. This is the largest quarterly economic growth since Q4 2011. Increased consumer spending was the cause for the large estimate jump as PCE was revised upward by 0.4 percentage points Changes in inventories accounted for 40% of Q3 GDP. Actual economic demand is now stronger in the third quarter than in Q2. As a reminder, GDP is made up of: Y= C+I+G+(X-M), where Y=GDP, C=Consumption, I=Investment, G=Government Spending, (X-M)=Net Exports, X=Exports, M=Imports*. GDP in this overview, unless explicitly stated otherwise, refers to real GDP. Real GDP is in chained 2009 dollars. The below table shows the Q3 revisions and percentage point spread between the major components of Q3 GDP. Investment shot way up and changes in private inventories is part of the investment component of GDP. This next table shows the percentage point spread breakdown from Q2 to the new Q3 GDP major components. Here we see consumer spending is down in comparison to Q2. Exports show less growth but imports also decreased. Consumer spending, C in our GDP equation, now shows more growth than Q2. Most of consumer spending, was in goods, which added 1.03 percentage points to GDP growth contribution. Services was significantly revised and now adds 0.32 percentage points. The 2nd revision showed services only adding 0.02 percentage points to Q3 GDP. Health care alone was 0.31 percentage points of Q3 GDP. Below is a percentage change graph in real consumer spending going back to 2000. Graphed below is PCE with the quarterly annualized percentage change breakdown of durable goods (red or bright red), nondurable goods (blue) versus services (maroon).
Main Reasons For "Upward Revised" Q3 Personal Spending: Healthcare And Gasoline - Earlier today, the Bureau of Economic Analysis surprised everyone by announcing a final Q3 GDP growth of 4.1% compared to 3.6% in the first revision (and 2.8% originally), driven almost entirely by the bounce in Personal Consumption which rose 2.0% compared to estimates of 1.4%. As a result many are wondering just where this "revised" consumption came from. The answer is below: of the $15 billion revised increase in annualized spending, 60% was for healthcare, and another 27% was due to purchases of gasoline. The third largest upward revision: recreation services. On the flip side, the biggest revision detractors: transportation services and housing and utilities. In other words, the BEA thought long and hard what it could revise and decided on the following: in Q3 the US economy was revised to the strongest since 2011 because Americans, it would appear, were gassing up more to visit (and pay) their doctor, and then going to the movies.
Finally, Americans Are Spending More—Exactly What the Economy Needs -- Will economic growth equal wage growth? That’s the biggest economic question of 2014. Like everyone, I was uplifted by today’s news that third quarter GDP figures were revised upward from 3.6 percent to a whopping 4.1 percent. What’s particularly good news is that unlike growth that comes from the restocking of depleted inventories—which basically tells you how weak things were in the sense that businesses unsure of demand wait till the last-minute to restock shelves—this revision was due to, gasp, consumer consumption. Personal consumption was revised up from 1.4 percent to 2.0 percent, thanks to a big jump in consumer spending. As I’ve written many times, we can’t have a robust recovery in an economy that’s made up 70 percent of consumer spending until people spend more. In the third quarter, we got evidence that they finally are. So, how long until we can stop holding our breaths that we’re finally in a more robust recovery? “I’d say that even one more quarter of better consumer spending would make me feel pretty good,” says Princeton professor and economist Alan Blinder, with whom I spoke this morning. Now, we just have to hope that job creation starts spreading into the middle, rather than just being at the ends—there are currently plenty of jobs for PhDs and burger flippers, but not so much in between. For more on how salaries and labor markets might shake out in 2014, listen to the latest episode of WNYC’s Money Talking, where I discuss this with Charlie Herman and Bloomberg Businessweek’s Diane Brady. (podcast)
Highlights from the Third-Quarter GDP Revision - The U.S. economy expanded in the third quarter at a faster pace than previously estimated. Five key figures in Friday’s revision from the Commerce Department:
- 4.1%. The annualized increase in U.S. gross domestic product in the third quarter, the strongest quarterly gain since late 2011.
- 2.0%. The increase in personal consumption expenditures, reflecting accelerating consumer spending in the quarter. Previous estimates suggested consumption growth had pulled back.
- 2.5%. The gain in real final sales, or GDP less the change in private inventories. Latest number shows real final sales advanced at the best pace since the first quarter of 2012.
- 1.67. The contribution from the change in private inventories, in percentage points, to overall GDP growth. That was still the highest inventory contribution since the fourth quarter of 2011.
- 10.3%. The annualized gain in residential investment during the third quarter, the weakest advance since the second quarter of 2012. The number suggests the housing market slowed somewhat in the summer, when interest rates rose.
Three of 4 US coincident indicators now exceed pre-Great Recession peaks: The US economy, ex-employment, has now completely recovered from the 2008-09 "Great Recession." Industrial production, probably the pre-eminent indicator used by the NBER to mark recessions, in November for the first time exceeded its pre-recession peak, by increasing a huge 1.1%. Here's the graph, normed to 100 at the 2007 peak: Two other coincident indicators of recession, real retail sales and real personal income, already exceeded the 2007 peak. If employment increases as it has recently, then sometime in the early part of next year it too will exceed its 2007 peak. The economy feels stagnant to the average American because wages are still stagnant at their 2007 levels, and on a per capita basis, i.e., adjusting for the subsequent population increase, all of the measures are still below their previous peaks. To reiterate something I said recently, the US economy is doing pretty well, most of the people in it, not so much.
Leading Indicators Suggest Economic Pickup in 2014 -- A closely watched index of leading economic indicators rose in November for the fifth straight month, suggesting a pickup in economic activity going into 2014. The Conference Board said on Thursday that its leading index increased 0.8% last month, after a downward revised 0.1% gain in October that originally came in at 0.2%. Economists surveyed by The Wall Street Journal also had expected the latest index to rise 0.8%. “The LEI continues on a broad-based upward trend, suggesting gradually strengthening economic conditions through early 2014,” said Ataman Ozyildirim, economist at the board. “Improving labor markets and new orders in manufacturing, combined with strong financial indicators, drove November’s gain.” Leading the index’s rise were the effects of yield spreads, declines in jobless claims and upbeat new orders in the manufacturing sector. That more than offset the drag posed by consumers’ still-tepid outlook on business conditions and by building permits, the report said. The coincident index increased 0.4% in November, after advancing 0.1% in October. The lagging index was unchanged last month, following a 0.3% rise in October.
Unperturbed by Government Shutdown, China Buys More Treasury Debt - China scooped up more Treasury debt in October than any other foreign investor, a sign recent U.S. fiscal troubles haven’t tainted the Treasury bond market’s status as a global safe harbor. China boosted its Treasury debt holdings by $10.7 billion in October to $1.3045 trillion, according to the latest monthly capital flows data released by the Treasury Department on Monday. Foreign investors overall added $24.4 billion in Treasury debt holdings in October. China primarily bought T-bills due in one year or less, known as T-bills with $8.4 billion added in October. China’s overall holdings of Treasurys at the end of October marks the second highest level following a record high of $1.3149 trillion set in July 2011, China is the largest foreign owner of Treasury debt. The U.S. government was partially shut down for 16 days in October when fears that the world’s biggest economy could miss debt payments sparked selloff in some short-term T-bills. But the Treasury debt market rallied after lawmakers reached a last-minute agreement in mid-October, pulling the U.S. from the brink of possible default. During the standoff in Washington D.C., Chinese officials urged the U.S. to get its fiscal house in order to protect the value of government debt holdings. Analysts say China, like many other investors, stepped in to buy when the turmoil subsided in the latter part of October. “Chinese officials have been saber rattling for some time,” “But in truth, Chinese officials know that as long as their foreign currencies reserves increase coupled with the realization that the U.S. economy is likely to lead other developed economies forward in 2014, China will continue to be net buyers of U.S. debt.”
Record High in U.S. Say Big Government Greatest Threat -- Seventy-two percent of Americans say big government is a greater threat to the U.S. in the future than is big business or big labor, a record high in the nearly 50-year history of this question. The prior high for big government was 65% in 1999 and 2000. Big government has always topped big business and big labor, including in the initial asking in 1965, but just 35% named it at that time. The latest update comes from a Dec. 5-8 poll. Gallup has documented a steady increase in concern about big government since 2009, rising from 55% in March 2009 to 64% in November 2011 and 72% today. This suggests that government policies specific to the period, such as the Affordable Care Act -- perhaps coupled with recent revelations of government spying tactics by former NSA contractor Edward Snowden -- may be factors. Currently, 21% name big business as the greatest threat, while 5%, a record low, say big labor. The high point for big labor was 29% in 1965. No more than 11% of Americans have chosen big labor since 1995, clearly reflecting the decline of the labor movement in the United States in recent decades. The historical high choosing big business, 38%, came in 2002, after a series of corporate scandals rocked major corporations including Enron and Tyco.
Slapping Trillions of Obligations Into the Diapers of the Next Generation - Stephanie Kelton - I get a huge volume of e-mail, but I don’t get the kind of hostile stuff that guys like Joe Weisenthal and Paul Krugman sometimes joke about. I got one today, though, and boy is this guy steaming over my MMT coloring book! Here’s the message: (hard copy) It’s hard not to sympathize with a guy like this. He apparently has kids, and he’s scared to death that his children and grandchildren will suffer real harm because Washington won’t get its fiscal house in order. And why wouldn‘t he think that? I mean, really. Politicians on both sides of the aisle have spent decades labeling the government’s finances a “fiscal train wreck” that will leave future generations with a “crushing burden of debt.” The mainstream media hypes these fears on a daily basis, and even NPR appears to be shilling for the debt scolds.So it’s no wonder a guy like this is blasting me. He had probably never before encountered anything that rejects, so forcefully, the entire compilation of debt and deficit tropes. He doesn’t strike me as a particularly open-minded guy, but I think I’ll send him this list of suggested readings anyhow. Maybe he hasn’t finished his holiday shopping.
The Government Spending to GDP Ratio: Down, Down, Down - Assessing the importance of direct government expenditures. One way to approach this issue is to examine the ratio of government spending on goods and services to GDP in nominal terms. Figure 1: Ratio of spending on goods and services (all levels) to GDP (blue), and ratio in Ch.09$ (red). Notice that in nominal terms, the government consumption and investment spending ratio is declining. The decline is even more pronounced when expressed using Ch.09$. Figure 2: Ratio of residual to GDP, in bn. Ch.09$, SAAR (red). Residual equals actual minus sum of components. Gray bar denotes the reference year. Source: BEA, 2013Q3 3rd release, and author's calculations. If the straight ratio of real magnitudes cannot be readily interpreted, given the failure of chain series components to sum up, then what can one do? An alternative is to plot the log ratio. The level of the series has no meaning, but the difference between any two points in series does.
US debt ceiling risk: out of sight, out of mind - The impasse over the US debt ceiling came and went - and with it the public's interest in the subject. The short-term treasury curve which became inverted back in October (see post) went back to normal. And yet the budget deal last week did nothing to avert another debt ceiling fight next year. CNN: - The [budget] deal would help Congress avert budget brinksmanship for awhile. But it does nothing to prevent another bruising battle over the debt ceiling, which lawmakers must address in just a few months. The bargain lawmakers struck in October lets the Treasury Department continue borrowing new money through February 7 without regard to the debt limit. Then, on February 8, the debt limit will automatically reset to a higher level that reflects how much Treasury borrowed during the nearly 4-month suspension period. At that point, if Congress hasn't agreed to raise the ceiling, Treasury can use "extraordinary measures," the special accounting maneuvers that let it keep paying the country's bills without going over the debt limit and risking default on the nation's obligations. But those measures are expected to run out sometime between March and June, although Treasury Secretary Jack Lew has warned that based on where things stand now they are not likely to last more than about a month. The can has been kicked down the road for a few months, and except for the somewhat elevated US sovereign CDS spread (see chart), all is well. The fact that just two months ago the US federal government was toying with the notion of a technical default (see discussion) is now just a bad dream. Out of sight, out of mind.
The GOP’s Great Depression agenda - Paul Ryan has set everyone’s socks ablaze with a new comment suggesting he wants to shake down the country again over the debt limit. Whether that is true is an important thing to figure out, but the deeper subtext here is that the Republican Party continues to organize itself around the kind of austerity agenda that, should they obtain enough power to implement it, would cause another recession immediately, possibly a very bad one. Let’s roll the tape:“We, as a caucus, along with our Senate counterparts, are going to meet and discuss what it is we want to get out of the debt limit,” Mr. Ryan said on Fox News Sunday. “We don’t want ‘nothing’ out of the debt limit. We’re going to decide what it is we can accomplish out of this debt limit fight.” The first thing that always comes to mind when top Republicans are saying crazy things is that it’s hard to know how serious they are being. As Steve Benen points out, Republicans’ last attempt to hold up the debt ceiling backfired spectacularly. It was a ransom demand so ludicrously irresponsible, so dangerous, such a violent insult to democratic legitimacy that Democrats literally had no choice other than to hold firm against it, across the board. So I suspect Steve is right when he says: Yesterday, Ryan raised the specter of yet another crisis, in which Republicans would threaten to hurt Americans on purpose, but here’s the thing: we now know he and his party won’t actually follow through. GOP lawmakers can hold the proverbial gun to the nation’s head, but party leaders have already made it abundantly clear that they’re not prepared to pull the trigger.
You Shouldn’t Outta Get Something Special for Just Doing Your Job -- Rep. Paul Ryan today on the need for Congress to once again increase the debt ceiling next year: We’re going to meet in our retreats after the holidays and discuss exactly what it is we’re going to try to get for this…We’re going to decide what it is we’re going to accomplish out of this debt limit fight. Well, excuse me fer livin’ but you don’t get something special for just doing your job. Once I arrive at work, I don’t knock I my boss’s door and ask for a bonus because I showed up. That’s the least part of my job. Just like if you’re a member of Congress, not defaulting on the national debt is the least part of your job. After mistakenly trying it the other way, President Obama recently made it clear that he’d no longer negotiate on the debt ceiling and I can’t imagine why he’d shift tactics. And yes, he did some ill-advised grandstanding on the issue when he was a Senator; that’s also an old tradition, done in the context of clear bipartisan intentions to raise the ceiling, as occurred uncontested–without threats of defaults to extract givebacks–18 times under President Reagan. I get it. They want something out of the deal. Well, here’s what the majority of their constituents want: do your freakin’ job like the rest of us and quickly implement a clean increase to the debt ceiling.
Lew warns Congress debt limit must be raised no later than early March - Treasury Secretary Jacob J. Lew formally told congressional leaders Thursday they must raise the debt limit by early March at the latest, warning the government has less ability to postpone a potential default than in the past. Some top Republicans have said in recent days they plan to try to get concessions from the Obama administration in exchange for raising the $16.7-trillion debt limit, which was suspended last fall until Feb. 7. With rumblings of another showdown over the politically volatile issue, Lew made clear Congress needs to "take prompt action to protect the full faith and credit of the United States." Treasury will be able to use so-called extraordinary measures to extend the nation's borrowing ability until "late February or early March," Lew wrote in a letter to House and Senate leaders. "While this forecast is subject to inherent variability, we do not foresee any reasonable scenario in which the extraordinary measures would last for an extended period of time," Lew said.
HERE WE GO AGAIN: Congress Has Two Months To Raise The Debt Ceiling - The White House and Congress are quickly veering toward another showdown over the debt ceiling. Treasury Secretary Jack Lew wrote in a letter to Congress on Thursday that the nation's borrowing limit will need to be raised by late February or early March. As part of the bill to reopen the government in mid-October, the debt limit was suspended through Feb. 7, 2014. The Treasury can use so-called "extraordinary measures" after that point to keep borrowing and paying the nation's bills for a few weeks thereafter. In his letter, Lew cited the recent bipartisan budget deal brokered by Rep. Paul Ryan (R-Wis.) and Sen. Patty Murray (D-Wash.) and urged a quick resolution to the debt ceiling. "In this spirit, I am writing to urge Congress to take prompt action to protect the full faith and credit of the United States by extending the nation's borrowing authority. It is incumbent on Congress to allow Treasury to finance the spending levels established in the budget agreement as well as the commitments previously approved by Congress," Lew wrote in the letter. The budget deal sets topline discretionary spending levels for the next two years, likely avoiding the threat of government shutdowns over that period. But it doesn't do anything to address the debt limit issue.
How the Budget Deal Perpetuates Austerity Policies - Yves here. This Real News Network segment provides an overview of the budget deal, cutting through the hype to lay bare its impact on ordinary Americans. It’s not a pretty picture.
Bernanke to Congress: Thanks for Not Wrecking the Economy (Any Further) The budget deal reached this month in Congress seemed to be a comforting factor in allowing the Federal Reserve to reduce the size of its bond-purchase program. Fed Chairman Ben Bernanke on Wednesday welcomed the modest agreement, saying renewed signs of cooperation may help boost confidence in the economy. “Relative to where we were in September and October, it certainly is nice there has been a bipartisan deal,” Mr. Bernanke said at a press conference following the central bank’s policy meeting. At the meeting, the Fed moved to reduce the size of its bond purchases by $10 billion per month, taking a small first step away from a policy intended to boost economic growth. Policymakers noted in their statement that the extent of fiscal policy restraint “may be diminishing.” That’s a change from late October when the Fed said fiscal policy was holding back growth.“Even if the outcomes are small, as this one was, it’s a good thing that they are working cooperatively and making some progress,” Mr. Bernanke said of Congress. 'It is also, at least directionally, what I have recommended in testimony,” he added, noting that the plan limits some short-term spending cuts while also taking steps to reduce the deficit over the long-term.
Did Boehner Grow A Pair Or Just Rent Them? -- It's been less than a week since House Speaker John Boehner (R-OH) surprised the political world by publicly and directly taking on the right wing groups -- and, by inference, the tea party wing of the GOP -- two days in a row. He then openly defied them by allowing the House to vote on a budget deal that was a compromise with Democrats they didn't like. Four days later the question is whether this was a permanent change for Boehner. Will he continue to tell the tea partiers in his caucus, the Club for Growth, Heritage Action and the others he so resoundingly criticized that they can go to hell, or was this a one-time event not likely to be repeated? The indications are that this was a not permanent change in the speaker's political testosterone level. Here's why.
- 1. The budget deal was the perfect situation for Boehner to come out swinging. The House GOP caucus was split differently on the budget than it had been at any time since the tea partiers came to prominence in the 2010 election with most members of the appropriations committee being an influential faction.
- 2. As one of the two people doing the negotiating, House Budget Committee Chairman Paul Ryan (R-WI) gave Boehner political cover for agreeing to the deal.
- 3. The White House may have been involved behind the scenes, but the president played no public role in the negotiations that produced the deal. This was important: Obama is so anathema to so many members of Boehner's caucus that just the hint of his being part of the discussions would have made it all but impossible for many House Republicans to vote for it.
- 4. The government shutdown the tea partiers and conservative groups are now widely and routinely blamed for was unsuccessful from virtually every angle and the tea partiers' approval rating is at one of its lowest levels ever. They were, in other words, politically ripe for the picking.
- 5. This was a small and, by federal budget standards at least, relatively noncontroversial deal that did not challenge anyones major budget priorities in a big way.
The Good, Bad, and Ugly of the Budget Compromise -- Yesterday, the Senate passed a procedural vote on the Ryan-Murray budget compromise by a vote of 67-33. All 33 votes in opposition came from Republican Senators, with 12 breaking away from their peers and voting in favor. The Senate Republican opposition was a stark contrast to the House of Representatives vote on the bill, which had approximately equal support from Republicans and Democrats. Senator Rob Portman (R-OH), former director of the Office of Management and Budget, was one of the twelve Senate Republicans to vote in favor. Although he acknowledged the agreement was less than ideal, he said, “I support the bipartisan budget agreement because it takes modest steps to reduce the deficit without raising taxes, relieves the sequester’s impact on our national security, and prevents another government shutdown.” Senate Majority Leader Harry Reid (D-NV) concurred, stating, “Although neither side got everything it wanted from this agreement, this legislation should help break a terrible cycle of governing by crisis.” The Senate is expected to give final approval to the bill as early as tomorrow, and President Obama has indicated that he will sign the bill into law. Politically, the Ryan-Murray budget deal is as much as can be expected from a divided government. Although entitlement reform is needed, and soon, to reduce the public debt, elected officials’ positions are too far apart to achieve any meaningful changes in the current Congress. Despite the lack of serious entitlement reform, the Ryan-Murray budget compromise is notable for the following reasons:
US budget deal: the good, bad and stupid - There was good news, bad news, and stupid news from the budget deal reached by the US House of Representatives this week. Probably the best news is that we can have a national day of gloating that there are no cuts to social security. "Grand Bargains" of the sort that would include such cuts seem to be off the table for now, thanks to a lot of grass-roots opposition. The whole idea that Social Security has any serious financial problems to begin with is an urban legend that has duped millions for decades, including (sadly) many journalists. It's long past time to retire that nonsense. The lesser good news is that some of the automatic or "sequestration" cuts in non-military (why does anyone use the euphemism "defense"?) spending for fiscal years 2014 and 2015 have been reduced. This should add about 250,000 jobs next year. Unfortunately, the gains from this are about cancelled out by the decision to cut off federal Emergency Unemployment Compensation for 1.3 million workers just after Christmas, since the loss of this spending will reduce growth and employment by about an equivalent amount. (Another 3.5 million are expected to lose benefits during 2014). This is especially mean to the long-term unemployed, since long-term unemployment is currently at twice or more than the level at which federal benefits have been eliminated in any of the previous recessions since 1959. America is a much richer nation today, but not kinder or gentler to the unemployed. We won't know until further legislation is passed exactly how the approximately $31bn in non-military, discretionary spending that has been restored by this budget will be distributed. So we don't yet know, for example, whether the 57,000 children cut off from the Head Start pre-school programs last year will get a reprieve.
Budget Deal’s Impact Is Only a Blip - It’s a two-year package that would replace $63 billion of sequestration cuts in 2014 and 2015, paid for by back-loaded fees and other spending cuts. No one should mistake it for great fiscal policy — it only partially defuses a fiscal time bomb set by Congress itself. So far, there is no action to extend unemployment benefits, despite historically high level of long-term joblessness. Still, grading on a steep curve, I give the deal a pass. It’s important, however, to use this little deal to make a broader point: policy makers have done serious long-term damage to an important part of the budget that has few defenders and many defunders: NDD, or nondefense discretionary spending. The new budget agreement has almost an imperceptible impact on that development. This is the part of the nondefense budget that Congress funds annually, as distinct from the “entitlement” programs that are automatically financed. Nondefense discretionary spending pays for environmental protections, education, job training, border security, low-income assistance including housing and Head Start, transportation, economic development and more. One-third of it goes to states and localities for K-12 education and infrastructure. Perhaps because that’s a diverse set of programs lacking a large and vocal constituency, NDD has become the part of the budget that both parties have been going after in recent budget deals (to be clear, and fair, there have also been cuts to the defense side). The chart above tells the story. It’s nondefense discretionary spending since the early 1960s as a share of gross domestic product, and yes, there are a bunch of lines in there toward the end, but you need them to explain the recent history of the bipartisan attack on this budget category.
The 5 Biggest Myths About The Budget Deal - Don't believe what you may have heard elsewhere about the budget deal. Here's the truth.
- Myth #1: This prevents another government shutdown. The deal may make a shutdown less likely, but it absolutely doesn't prevent one from happening.
- Myth #2: Congress has now passed a budget for the first time in years. Nonsense. This deal isn't a "budget" because (1) it only deals with appropriations (about 30 percent of all annual federal spending) and doesn't deal with taxes at all, and (2) it's not a congressional budget resolution. The House and Senate did pass their own budget resolutions earlier this year but this agreement is not a compromise between those two.
- Myth #3: This is the beginning of a new era of bipartisanship in Washington.More total nonsense: This is more wishful thinking and heavy duty prayer than serious analysis.
- Myth #4: There will be no budget-related crises over the next two years. This myth was exploded almost immediately after the deal was announced when House Budget Committee Chairman Paul Ryan (R-WI) and Senate Republican Leader Mitch McConnell (KY) announced that the GOP will not agree to the increase in the debt ceiling that likely will be needed by June without getting concessions on some as-of-yet unspecified issue(s) and the White House immediately rejected debt ceiling negotiations.
- Myth #5: This deal was a significant change in fiscal policy. Sorry, but $23 billion in lower deficits over the next 10 years does not constitute a material change in the U.S. budget outlook. In fact, $23 billion is literally a rounding error (.000575) when compared to my estimate of total spending over that same 10-year period.
Congress Targets Fed Workers' Pensions for Savings - Top lawmakers have found easy prey in their hunt for savings for Congress' budget deal: Federal workers' retirement programs, which are notably generous compared to the norm in private industry. Most federal civilian employees hired beginning in January will contribute 4.4 percent of their pay to their pension plans under the bipartisan budget agreement. Current government workers' rates will remain unchanged: Those hired in 2013 will continue paying 3.1 percent, while most on the payroll before then will keep contributing 0.8 percent. The workers say they've been singled out for a painful hit in the measure, which the House approved last Thursday and the Senate is expected to complete this week. "These are working class people," . "These are not people who can afford it." But with federal employees low on voter priority lists and a scant presence in most congressional districts, they proved an irresistible target for lawmakers. And at a time when pensions for private industry workers are edging toward extinction, some said diminished retirement programs are a sign of the times.
Not So Fast: New Budget Deal Leaves a Lot to Deal With - Hooray! Our dysfunctional, divided Congress managed to accomplish something. On Wednesday, the Senate approved a budget deal hammered out by Rep. Paul Ryan (R-Wis.) and Sen. Patty Murray (D-Wash.) by a 64-36 vote. Nine Republicans joined all of the Senate's Democrats in voting for the resolution. Since the House already passed the accord it will soon become official, pending President Barack Obama's signature. The new budget, which sets government spending levels for the next two years, has been hailed as a breakthrough—a deviation from the gridlock and last-minute spending deals that have plagued Congress since the 2010 election. The consensus fetishists of Washington love the deal, and are suggesting it means we can say goodbye to any threat of government shutdowns until at least late 2015. Congress can just wipe its hands clean of past debacles and head home for an easy holiday break.The truth? It's a tad more complicated. It's unlikely there will be another shutdown when funding expires on January 15: Republican support for the budget deal is a clear sign that they've learned their lesson about closing the government after their October debacle. But fights over federal spending have hardly been settled. The Ryan-Murray budget offers a broad framework for the budget numbers, but the details still need to be worked out. And there are a host of difficult decisions awaiting.
Military Pension Cuts Stay In Ryan-Murray Bill - Yesterday the Ryan-Murray budget passed broke through the filibuster in the Senate. The Democratic namesake of the agreement, Patty Murray, went on to the Senate floor to trash her own bill before voting for it, noting it did nothing to create jobs nor help the unemployed. Her defense relied on claims that the Republicans wanted an even worse budget. In other words, Murray echoed the new Democratic rationalization for selling out “embrace the suck.” Or, perhaps more aptly stated “this is the best we can do, sorry.” One provision of the bill that seemed to be so atrocious even the compromise at any price Democrats would fold on was the attack on military pensions. But no, while the budget is an incredible reckless give away to campaign contributors the defense industry when it comes to the lowly soldiers themselves that’s where the Democratic Party drew the line. At a news conference on Tuesday to oppose the budget deal, Graham asked: “Of all the people we could have picked on to screw, how could we have arrived here?” Military retirees stand to lose a full percentage point from their cost-of-living raises when they retire after a minimum of 20 years of service. The House passed the budget plan last week, and the Senate is expected to vote Wednesday.
The U.S. Government Is Paying Through the Nose For Private Contractors - The budget debate now consuming Washington often seems to come down to guns versus butter, or at least its contemporary manifestation, Reaper Drones versus food stamps. What gets lost in the increasingly caustic rhetoric is just how inefficient the US government is when it spends, especially when it is outsourcing tasks to hugely profitable private companies.Fortunately, the budget deal just worked out between the White House and Capitol Hill will prevent a government shutdown and all of its attendant global financial inconveniences. But it does nothing to curtail wasteful spending on companies that are among the nation’s richest and most powerful – from Booz Allen Hamilton, the $6 billion-a-year management-consulting firm, to Boeing, the defense contractor boasting $82 billion in worldwide sales.In theory, these contractors are supposed to save taxpayer money, as efficient, bottom-line-oriented corporate behemoths. In reality, they end up costing twice as much as civil servants, according to research by Professor Paul C. Light of New York University and others has shown. Defense contractors like Boeing and Northrop Grumman cost almost three times as much.
In Deficit Debate, Public Resists Cuts in Entitlements and Aid to Poor | Pew Research -- The latest national survey by the Pew Research Center, conducted Dec. 3-8 among 2,001 adults, finds majorities say it is more important to maintain spending on Social Security and Medicare and programs to help the poor than to take steps to reduce the budget deficit. Nearly seven-in-ten (69%) say it is more important to maintain current Social Security and Medicare benefits than to reduce the deficit, while 59% prioritize keeping current levels of spending for programs that help the poor and needy over deficit reduction.There is greater public support for cutting military spending in order to achieve deficit reduction. About half of Americans (51%) say reducing the deficit is more important than keeping military spending at current levels, while 40% say deficit reduction is more important. Views of tradeoffs between government spending and deficit reduction are divided along partisan lines, and the differences are especially pronounced when it comes to programs that aid the poor and needy. Fully 84% of Democrats say it is more important to keep current spending levels for these programs than to reduce the deficit. A majority of Republicans (55%) say cutting the deficit is more important than maintaining current spending for programs to help the poor.
Tax Reform Appears Dead - The chances of Congress working on tax reform next year have gone from very unlikely to effectively zero with the decision by President Obama to name Sen. Max Baucus (D-MT) ambassador to China. Baucus is chair of the extremely powerful Senate Finance Committee. Despite the long odds, Baucus has been working towards creating a comprehensive tax reform plan with House Ways and Means chair David Camp (R-MI). The plan has faced resistance from many fronts but the pair has between trying to make something work for almost a year Obviously, if Baucus is in China there is no way he can push for tax reform next year. It is also likely Baucus wouldn’t be entertaining taking this appointment unless it was clear his goal of tax reform was basically dead anyway. Tax reform can be added to the growing list of legislative goals that appear dead on arrival in Congress next year. Don’t expect this Congress to be any more productive in the second half of the term
A Tax Loophole For the Rich So Wide It Even Has a Name -- We've all heard about that terrible death tax, hated by the super rich across America. This is the inheritance tax where Uncle Sam is supposed to get 40% of the estate that is passed onto heirs. The reality is this tax is not paid unless someone has a very poor financial planner and attorney. There is a loophole in the law which allows billionaires and their heirs to pay nothing in taxes on inheritance. The popularity of the shelter, known as the Walton grantor retained annuity trust, or GRAT, shows how easy it is for the wealthy to bypass estate and gift taxes. The technique to bypass estate and gift taxes has cost the United States over $100 billion in revenues since 2000. Of course only the super-rich can afford such a labyrinth of tax shelters. Regular people don't pay taxes on inheritance. It is only estates exceeding $5,250,000 in 2013. Yet these people don't pay either, unless they stuffed it under the mattress and did not use the GRAT loophole of course. So, once again the laws do not apply for the super rich. It is no mere coincidence these people are major poliical campaign donors either.
Punking Ourselves to Death - Kunstler - The so-called Volker Rule for policing (ha!) banking practices, approved by a huddle of federal regulating agency chiefs last week, is the latest joke that America has played on itself in what is becoming the greatest national self-punking exercise in world history. First of all (and there’s a lot of all), this rule comes in the form of nearly 1,000 pages of incomprehensible legalese embedded in what was already a morbidly obese Dodd-Frank Wall Street Reform (ha!) and Consumer Protection (ha!) Act of 2012 that clocked in at 2000 pages, not counting the immense rafts of mandated interpretations and adumbrations, of which the new Volker Rule is but one. These additions were required because the Dodd-Frank Act itself did not really spell out the particulars of enforcement but rather left it to the regulatory agencies to construct the rules — which they did with “help” of lobbyist-lawyers furnished by the banks themselves. That is, the lobbyists actually wrote the rules for Dodd-Frank and everything in it, which means the banks wrote the rules. Does this strain your credulity? Well, this is the kind of nation we have become: anything goes and nothing matters. There really is no rule of law, just pretense. The Volker Rule was a lame gesture toward restoring the heart of the Glass-Steagall provisions of the Banking Act of 1933, which were repealed in 1999 in a cynical effort led by Wall Street uber-grifter Robert Rubin and his sidekick Larry Summers, who served serially as US Treasury Secretaries under Bill Clinton. The Glass Steagall Act of 1933 was about 35 pages long, written in language that was precise, clear, and succinct. It worked for 66 years. Banking during those years was a pretty boring business, commercial banking especially. Bankers made a nice living but nothing like the obscene racketeering profits engineered by the looting operations of today. Before 1980, the finance sector of the economy was about 5 percent of all activity. Its purpose was to allocate precious capital to new productive ventures.
Goldman loses the Volcker Rule battle over credit funds -- About a year ago we discussed the argument made by Goldman's lawyers that under the Volcker rule, banks should be allowed to invest in credit funds (see post). The rationale is that if banks can lend to companies directly, why can't they invest in funds who make the same types of loans? In particular, Goldman was defending its lucrative mezzanine fund business which provides junior capital to companies. Goldman and other banks compete with private equity firms such as Blackstone in managing credit portfolios for clients.The final Volcker Rule regulation seems to indicate that Goldman has lost that argument. (See great summary on Volcker Rule pertaining to private funds from Simpson Thacher - below)Simpson Thacher: - the Agencies were unpersuaded by industry comments that ... credit funds (which are generally formed as partnerships with third-party capital that invest in loans or make loans or otherwise extend the type of credit that banks are authorized to undertake on their own balance sheet) should also be excluded.That means Goldman and other banks will be limited to the standard 3% investment in the mezzanine or other credit funds they manage. And clients generally expect banks to commit significantly more of banks' own capital to funds they manage in order to avoid potential conflicts (such as having banks stuff these funds with bad investment banking transactions).This is a big win for private equity firms who will be able to grab market share of this business from banks. However it's not a great outcome for companies who rely on this type of financing, as lender competition declines.
Andrew Haldane: The Banker Who Cried 'Simplicity' - WSJ.com - Andrew Haldane rattled the financial world last year with a simple question: Why is it that border collies can catch Frisbees better than many humans, including ones with physics Ph.D.s? Mr. Haldane, the Bank of England's executive director for financial stability, was speaking at the Federal Reserve Bank of Kansas City's annual policy symposium in Jackson Hole, Wyo. It was August. He pointed out that catching a Frisbee requires the catcher to process, in real time, a brain-fryingly complicated set of physical and atmospheric factors: wind, gravity, the Frisbee's rotation and flight path. And yet "catching a Frisbee is remarkably common." The reason, he said, is that in complex decision-making problems, simple rules sometimes do just as well as complex solutions, if not better. You don't have to understand the science of Frisbee-catching to master the practice. If you tried to keep all the physics in your head, you'd probably be distracted or overwhelmed and miss the Frisbee. Dogs, like most humans who catch Frisbees, keep it simple. Less is more. That isn't financial regulators' instinctive MO, Mr. Haldane told the economists and policy makers. Confronting their own Frisbee-catching problem—preventing financial crises—central banks and other regulators have responded with evermore Byzantine and finely tuned rules. The world of finance has grown more complex and interconnected over the last three decades, he said, and the 2007-08 panic introduced further intricacies. "Yet despite this complexity," Mr. Haldane continued, "efforts to catch the crisis Frisbee have continued to escalate." He suggested that when it came to banks' capital requirements, a straightforward metric of solvency, such as a leverage ratio, might do better at predicting failure than one, like a risk-weighted capital ratio, that banks could more easily game.
Citigroup is the Real Reason We Need the Volcker Rule - Tom Adams - Last week, the rules for the Volcker Rule – that provision of the Dodd-Frank Legislation that was intended to prevent (reduce?) proprietary trading by banks – were finalized. As a consequence, there has been a lot of chatter among financial types around the internet about what the rule does and doesn’t do and how it is good or bad, etc. Much of the conversation falls into the category of noise and distraction about unintended consequences, impacts on liquidity and broad views of regulatory effectiveness. I call it noise, because in my view the real purpose of the Volcker Rule is to prevent another Citigroup bailout and therefore the measure of its effectiveness is whether the rule would accomplish this. As you may recall, Citigroup required the largest bailout in government history in 2008, going back to the government well for more bailout funds several times. The source of Citigroup’s pain was almost entirely due to its massive investment in the ABS CDO machine. Citi was an active underwriter for CDO’s backed by mortgage backed securities. Selling these securities was a lucrative business for Citi and other banks – far more lucrative than the selling of the underlying MBS. The hard part of selling was finding someone to take the highest risk piece (called the equity) of the CDO, but that problem got solved when Magnetar and other hedge funds came along with their ingenious shorting scheme. The next hardest part was finding someone to take the risk of the very large senior class of the CDO, often known as the super-senior tranche. As the frenzy of MBS selling escalated, though, the number of parties willing to take on the super-seniors was unable to match the volume of CDOs being created. Undeterred, Citi began to take down the super-senior bonds from the deals they were selling and holding them as “investments” which required very little capital because they were AAA.
Volcker Rule Report Card: Occupy the SEC (OSEC) Gives the Volcker Rule a Grade of “C-” [PDF]
The Financial Crisis: Why Have No High-Level Executives Been Prosecuted?, by Judge Jed S. Rakoff - Five years have passed since the onset of what is sometimes called the Great Recession. While the economy has slowly improved, there are still millions of Americans leading lives of quiet desperation: without jobs, without resources, without hope. Who was to blame? Was it the result, at least in part, of fraudulent practices, of dubious mortgages portrayed as sound risks and packaged into ever more esoteric financial instruments, the fundamental weaknesses of which were intentionally obscured? If the Great Recession was in no part the handiwork of intentionally fraudulent practices by high-level executives, then to prosecute such executives criminally would be “scapegoating” of the most shallow and despicable kind. But if, by contrast, the Great Recession was in material part the product of intentional fraud, the failure to prosecute those responsible must be judged one of the more egregious failures of the criminal justice system in many years. Indeed, it would stand in striking contrast to the increased success that federal prosecutors have had over the past fifty years, Michael Milken, the so-called savings-and-loan crisis, which again had some eerie parallels to more recent events, resulted in the successful criminal prosecution of more than eight hundred individuals, right up to Charles Keating. And again, the widespread accounting frauds of the 1990s, most vividly represented by Enron and WorldCom, led directly to the successful prosecution of such previously respected CEOs as Jeffrey Skilling and Bernie Ebbers.In striking contrast with these past prosecutions, not a single high-level executive has been successfully prosecuted in connection with the recent financial crisis, and given the fact that most of the relevant criminal provisions are governed by a five-year statute of limitations, it appears likely that none will be. It may not be too soon, therefore, to ask why.
Banks Are Playing Russian Roulette With Our Financial Security - The next major threat to the international financial systems is very likely to come from reckless investors gambling with derivatives, the dangerous betting vehicles that contributed to the 2008 collapse of much of the economy. Derivatives are the financial instruments that helped push the global economy to the brink in 2008, taking down American International Group (AIG) and Lehman Brothers Holdings, igniting the worst recession since the 1930s. Used properly, simple derivatives (literally: a financial asset that "derives" its value from that of an underlying asset) can reduce the risk of some financial transactions. But big-money gamblers can invest in any of a number of highly risky, extremely complicated kinds of derivatives for purely speculative purposes. When this happens, derivatives are just a form of very dangerous, virtually no-limit, betting. Oddly, and totally inappropriately, derivatives allow firms the option to record profits today that will supposedly come tomorrow. But if the bets are big and tomorrow's profits don't emerge, a financial house could implode.
Fed Said to Delay Bank Leverage Cap Until Basel Completed - The Federal Reserve has decided to delay imposing limits on leverage at eight of the biggest U.S. financial institutions until a global agreement is completed, according to two people briefed on the discussions. Fed officials want to wait for a finished rule from the Basel Committee on Banking Supervision before completing their own requirement for how much capital U.S. banks must hold as a percentage of all assets on their books, said the people, speaking on condition of anonymity because the process isn’t public. The international accord is shaping up as weaker in some respects than the U.S. plan. The Federal Deposit Insurance Corp. and the Office of the Comptroller of the Currency had favored finishing a U.S. rule by year’s end, said one of the people. The Fed’s wait-and-see position is aligned with groups representing the banking industry, who have argued for a delay on grounds that the regulations should be consistent. After the Dec. 10 adoption of the Volcker Rule that restricts banks from trading with their own money, the leverage ratio is one of the most significant unfinished U.S. initiatives to reduce risks that led to the 2008 global credit crisis.
Big Banks and the Failure of Bankruptcy - Simon Johnson - In modern American political discourse, it is unusual to see ideas explode before your very eyes. It’s much more typical for bad ideas to drift away quietly – or alternatively to stick around, year after year, despite being completely at odds with the facts. On Dec. 11, at a meeting at the Federal Deposit Insurance Corporation, there was a complete and public collapse of the notion that today’s large complex financial institutions could actually go bankrupt without causing a great deal of collateral damage. In a free and fair discussion before the F.D.I.C.’s Systemic Resolution Advisory Committee, proponents of bankruptcy as a viable option acknowledged that this would require substantial new legislation, implying a significant component of government support — or what would reasonably be regarded as a form of “bailout” to a failing company and its stakeholders. (I’m a member of the committee, and the events took place in the first session of the committee’s public hearing.) In other words, as matters currently stand, bankruptcy for a big financial company would imply chaotic disaster for world markets (as happened after Lehman Brothers failed). It is completely unrealistic to propose “fixing” this problem with legislation that would create a new genre of bailouts. Under current law – and as a matter of common sense – the Federal Reserve should take the lead in forcing megabanks to become smaller and simpler.
What happens to banks' balance sheets during a downturn - Credit underwriters pride themselves in their ability to cut lending when they sense that economic fundamentals have changed for the worse. But historical data suggests otherwise. At least during the past 6 downturns, lenders increased balance sheets during the onset of each recession. And loan portfolios continued to grow, with lending often slowing only closer to the end of (and/or after) the recession.But banks continue to insist that they will see the next recession coming and reduce exposure before the downturn. These "expected" balance sheet declines have been reflected in the stress tests that banks have been providing to the Fed, resulting in a more benign outcome. Given that the data clearly shows balance sheets rising, the Fed has decided to apply its own assumptions to how banks' loan portfolios will change in the next downturn. WSJ: - The Fed will now make its own projections about how bank balance sheets will fluctuate during a future recession, rather than rely on the banks for that data. The change is likely to produce different results in the 2014 tests, the Fed said. For instance, the central bank is likely to find bank assets will grow in a downturn, rather than contract as banks had projected in previous years. That could require firms to have more loss-absorbing capital or limit rewards to shareholders, though results will vary for each bank.It seems that in reality, lenders (at least on average) tend to be terrible at calling the next downturn. And often by the time underwriting standards actually tighten, the worst of the slowdown is already over.
Tapering would raise borrowing… Forward guidance needs some psychological bite - An article came out in the WSJ web site called Lenders Look to Fed Tapering to Lift Business Borrowing. One would think that tapering would discourage borrowing. Yet, we are in a situation where long-term low interest rates suppress borrowing. Here is the key line from the article referring to tapering… “Such a move would bring “some degree of certainty back to the” corporate market, Mr. Demchak said, adding that businesses could “see that as a sign of the economy coming back,” giving them more confidence to borrow.” The Fed would do better to have forward guidance to normal monetary policy in the near-term. Business would respond better to such a policy. Instead, forward guidance has been pointing toward a far away negative real interest rate with the implication that the US economy is in long-term decline… not a good message to motivate business. People respond better with deadlines and constraints … Students study more right before a test. As it is, I already see that a tighter monetary policy fits better due to a fall in the natural level of real GDP. But, psychologically businesses would feel more secure with a rising Fed rate. It is a sign of growth that would generate more and more investment. Remember, businesses invested just fine during the unnaturally high real interest rates of the 1980′s.
Unofficial Problem Bank list declines to 641 Institutions - This is an unofficial list of Problem Banks compiled only from public sources. Here is the unofficial problem bank list for December 13, 2013. Changes and comments from surferdude808: The first failure in six weeks and an action termination caused two removals from the Unofficial Problem Bank List this week. After removal, the list includes 641 institutions with assets of $219.4 billion. A year ago, the list held 845 institutions with assets of $312.97 billion. Next Friday, we anticipate for the OCC to provide an update of its enforcement action activity through mid-November 2013. Note on the unofficial list: Because the FDIC does not publish the official list, a proxy or unofficial list can be developed by reviewing press releases and published formal enforcement actions issued by the three federal banking regulators, reviewing SEC filings, or through media reports and company announcements describing that the bank is under a formal enforcement action. For the most part, the official problem bank list is comprised of banks with a safety & soundness CAMELS composite rating of 4 or 5 (the banking regulators use the FFIEC rating system known as CAMELS, which stands for the components that receive a rating including Capital adequacy, Asset quality, Management quality, Earnings strength, Liquidity strength, and Sensitivity to market risk. A composite rating is assigned from the components, but it does not result from a simple average of the components. The composite and component rating scale is from 1 to 5, with 1 being the strongest). Customarily, a banking regulator will only issue a safety & soundness formal enforcement when a bank has a composite CAMELS rating of 4 or 5, which reflects an unsafe & unsound financial condition that if not corrected could result in failure. There is high positive correlation between banks with a safety & soundness composite rating of 4 or worse and those listed on the official list.
Lurid Subprime Scams Unveiled in Long-Running Fraud Trial - Taibbi - Lost amid the hoopla over JP Morgan Chase's record-setting $13 billion settlement this fall was news of another monster court resolution – a $2.46 billion judgment, the largest ever awarded after trial in a securities fraud class action case, handed down in October against a HSBC acquisition called Household International. It's an old case, with the trial completed way back in 2009 and the fraud in question having all taken place between 1997 and 2002. But it has crucial ramifications for the present, for one key reason: The evidence uncovered in the Household suit should put to lie once and for all the oft-repeated myth – spread by many of America's most notable dumb people, from Rush Limbaugh to New York City Mayor-unelect Mike Bloomberg – that the financial crisis was caused by the government "forcing" banks to lend to poor people. In reality, of course, the subprime bubble exploded because financial companies and banks were in a mad rush to get as many iffy borrowers into loans as quickly as possible – and not because they were forced to, but because they made assloads of money doing so. Nowhere was that more in evidence than in this case, Lawrence E. Jaffe Pension Plan v. Household International, Inc., et al., where a major trafficker in subprime and "alternative" mortgage products schemed in every conceivable way to get low-income, high-risk borrowers into as many dangerous mortgages and refinance deals as they could.
Subprime Mortgage Loan Servicer Ocwen Agrees to $2.2 Billion Settlement - A $2.2 billion agreement is settling accusations against a large but little known player in the mortgage industry that escaped last year’s sweeping mortgage settlement. The Ocwen Financial Corporation, which has ridden its specialty in servicing subprime loans to become the fourth-largest mortgage servicer in the country, was accused of improperly handling the loans of homeowners after the financial crisis. The agreement with the Consumer Financial Protection Bureau and 49 states covers similar ground to a $25 billion settlement made last year with the largest banks. Ocwen was not included in the larger settlement because its nonbank status allowed it to slip through the cracks of the different regulatory agencies. The company, which is publicly traded, now falls under the oversight of the bureau, which began in 2011.
Acting Attorney General Announces Lawsuit Against Credit Suisse Arising From Sale of Over $10 Billion in Troubled Mortgage Backed Securities - Acting Attorney General John J. Hoffman and Division of Law Director Christopher S. Porrino announced today that the State has filed a lawsuit against Credit Suisse Securities (USA) LLC and two of its affiliates alleging that they offered more than $10 billion in residential mortgage backed securities trusts for sale while misrepresenting the risks involved in the investments, and failing to disclose to investors information about significant defects in the offerings. Filed today on behalf of the Bureau of Securities, the lawsuit alleges that Credit Suisse did not disclose to investors there had been a wholesale abandonment of underwriting guidelines designed to ensure that the mortgage loans underlying its securities trusts were made in accordance with appropriate lending guidelines.In addition, it allegedly was not disclosed to investors that numerous loan originators had poor track records of defaults and delinquencies, and some had even been suspended from doing business with Credit Suisse. Other material information that was not disclosed, according to the State’s lawsuit
Secret Inside BofA Office of CEO Stymied Needy Homeowners - Isabel Santamaria thought she finally caught a break in her effort to save her Florida home from foreclosure after nine frustrating months: She reached Bank of America Corp.’s Office of the CEO and President. What the mother of two autistic children didn’t know is that her case would find its way to contractors, including Urban Lending Solutions in Broomfield, Colorado, far from the bank’s headquarters in Charlotte, North Carolina. Bank of America hired the firm to clear a backlog of complaints about a federal program designed to prevent foreclosures. “It felt like a big deal, reaching the CEO’s office,” Santamaria, 43, said of having her June 2010 call escalated to what she was told was the bank’s top level. “It only happened because I complained to my congressman, the attorney general, television stations. They only put you there if you make a big stink, but once you’re there, they still don’t help you.” Bank of America, led by Chief Executive Officer Brian T. Moynihan, faced more than 15,000 complaints in 2010 from its role in the government’s Home Affordable Modification Program. Urban Lending, one of the vendors brought in to handle grievances from lawmakers and regulators on behalf of borrowers, also operated a mail-processing center for HAMP documents. Instead of helping homeowners as promised under agreements with the U.S. Treasury Department, Bank of America stalled them with repeated requests for paperwork and incorrect income calculations, according to nine former Urban Lending employees. Some borrowers were sent into foreclosure or pricier loan modifications padded with fees resulting from the delays, according to the people, all but two of whom asked to remain anonymous because they signed confidentiality agreements.
How far would Bank of America go to screw distressed homeowners? - A Bloomberg investigation has uncovered a secret office created by Bank of America called "the Office of the CEO and President" set up ostensibly to handle complaints homeowners trying to refinance in the government’s Home Affordable Modification Program. But when frustrated homeowners, and members of Congress and regulators, finally reached what they thought was the pinnacle of BoA where something might just be done to help them, they were really being shuffled off to a contractor site, Urban Lending, whose primary job appears to have been delaying the process until the homeowners could be forced into foreclosure. Urban Lending was one of the vendors hired to clear a huge backlog of complaints, at least 15,000 of them, that Bank of America had amassed. It was specifically "brought in to handle grievances from lawmakers and regulators on behalf of borrowers, also operated a mail-processing center for HAMP documents." Instead of helping homeowners as promised under agreements with the U.S. Treasury Department, Bank of America stalled them with repeated requests for paperwork and incorrect income calculations, according to nine former Urban Lending employees. Some borrowers were sent into foreclosure or pricier loan modifications padded with fees resulting from the delays, according to the people, all but two of whom asked to remain anonymous because they signed confidentiality agreements.
New ruling puts Fannie, Freddie in line for windfall MBS recovery - Has there ever been a more lopsided multibillion-dollar case than the Federal Housing Finance Agency’s fraud litigation against the banks that sold mortgage-backed securities to Fannie Mae and Freddie Mac? I don’t think U.S. District Judge Denise Cote of Manhattan, who is overseeing securities fraud suits against 11 banks that haven’t already settled with the conservator for Fannie and Freddie, has sided with the banks on any major issue, from the timeliness of FHFA’s suits to how deeply the defendants can probe Fannie and Freddie’s knowledge of MBS underwriting standards in the late stages of the housing bubble. But even in that context, Judge Cote’s summary judgment ruling Monday – gutting the banks’ defenses against FHFA’s state-law securities claims – is a doozy. In effect, Cote’s decision will permit FHFA to recover more from MBS issuers than Fannie Mae and Freddie Mac would have made if their MBS investments had paid as promised. Of course, FHFA and its lawyers still have to show that the banks knew or had reason to know that their offering documents misrepresented the mortgage-backed securities they were peddling to Fannie Mae and Freddie Mac. But if FHFA meets that burden, the banks can’t ward off claims under the state securities laws of Virginia and the District of Columbia by blaming Fannie and Freddie’s MBS losses on broad declines in the economy and the housing market. What’s more, those state securities laws give FHFA the right to rescission – or restitution of the entire purchase price of the MBS Fannie and Freddie bought – plus fees, costs and, most importantly, interest. The Virginia statute mandates that securities fraudsters chip up 6 percent interest – more than the scheduled interest rate in many of the MBS trusts in which Fannie and Freddie invested. The banks, in other words, are now exposed to liability far beyond the actual losses Fannie Mae and Freddie Mac suffered – and even beyond what FHFA’s wards would have earned if the MBS trusts had performed exactly as the banks said they would at the time of sale. That extra interest would be a true windfall for FHFA.
The F.H.A.’s Countercyclical Contribution - The Federal Housing Administration insures their mortgages so that they can get loans that lenders would otherwise not make. In fact, since the Great Depression, it has insured the mortgages of over 30 million low-wealth borrowers. And while the agency caused neither the housing bubble nor bust, it did significantly ramp up to help offset the worst of the damage, sharply expanding its market share. So yes, F.H.A. loan volumes grew quickly over these years, and in doing so helped stave off more foreclosures and even sharper declines in home prices. Without the F.H.A.’s actions, according to estimates by Moody’s Analytics, home prices would have fallen another 25 percent nationally. The agency also exposed itself — specifically its fund to cover losses (it is required to have cash on hand to cover at least 2 percent of its holdings) — to greater risk. Because of losses associated with that increased exposure, last year, for the first time in its 80-year history, the F.H.A. had to get a $1.7 billion plug from Congress for its insurance fund.. What steps has the agency taken to help improve its books? It raised borrowers’ fees and significantly tightened lending standards. Tougher underwriting has lowered early defaults to their lowest level in seven years; loan delinquencies and foreclosures are down about 20 percent. Beginning next year, it will reduce its maximum loan amount. Together, all of these changes are and will continue to reduce its market share. So what we have here is an agency ramping up in true countercyclical fashion to meet and push back on a vast market failure. Its ramp-up was not without cost, but it had demonstrably effective results in housing finance, one of the most damaged parts of the economy during the downturn. As its function becomes less needed — as private insurers wake from hibernation — it is pulling back.
CoreLogic: Almost 800,000 Properties returned to positive Equity during Q3 2013 -- From CoreLogic: CoreLogic reports 791,000 More Residential Properties Return to Positive Equity in Second Quarter CoreLogic ... today released new analysis showing approximately 791,000 more residential properties returned to a state of positive equity during the third quarter of 2013, and the total number of mortgaged residential properties with equity currently stands at 42.6 million. The analysis indicates that nearly 6.4 million homes, or 13 percent of all residential properties with a mortgage, were still in negative equity at the end of the third quarter of 2013. This figure is down from 7.2 million homes, or 14.7 percent of all residential properties with a mortgage, at the end of the second quarter of 2013... Of the 42.6 million residential properties with positive equity, 10 million have less than 20 percent equity. Borrowers with less than 20 percent equity, referred to as “under-equitied,” may have a more difficult time obtaining new financing for their homes due to underwriting constraints. Under-equitied mortgages accounted for 20.4 percent of all residential properties with a mortgage nationwide in the third quarter of 2013, with more than 1.5 million residential properties at less than 5 percent equity, referred to as near-negative equity. Properties that are near negative equity are considered at risk should home prices fall. ... “Fewer than 7 million homeowners are underwater, with a total mortgage debt of $1.6 trillion. Negative equity will decline even further in the coming quarters as the housing market continues to improve.” This graph shows the break down of negative equity by state. Note: Data not available for some states. From CoreLogic: "Nevada had the highest percentage of mortgaged properties in negative equity at 32.2 percent, followed by Florida (28.8 percent), Arizona (22.5 percent), Ohio (18.0 percent) and Georgia (17.8 percent). These top five states combined accounted for 36.4 percent of negative equity in the U.S." The second graph shows the distribution of home equity in Q3 compared to Q2. Close to 5% of residential properties have 25% or more negative equity, down from around 6% in Q2 and 8% in Q1. In Q3 2012, there were 10.5 million properties with negative equity - now there are 6.4 million. A significant change.
Lawler: Updated Table of Distressed Sales and Cash buyers for Selected Cities in November - Economist Tom Lawler sent me the updated table below of short sales, foreclosures and cash buyers for several selected cities in November.This is just a few markets, but total "distressed" share is down significantly, foreclosure are down in most areas, and short sales are off sharply year-over-year. The All Cash Share (last two columns) is mostly declining year-over-year. As investors pull back in markets (like Vegas and Phoenix) the share of all cash buyers will probably decline. Note: Existing home sales for November will be released on Thursday, and Tom Lawler is projecting the NAR will report sales of 4.98 million on a seasonally adjusted annual rate basis. The consensus is for sales to decline to a 5.05 million SAAR, down from 5.12 SAAR in October.
Wall Street Unlocks Profits From Distress With Rental Revolution -- On a rainy night in November, Mark Futral, wearing a red hooded sweatshirt, approached a white ranch house in Flowery Branch, a northeastern suburb of Atlanta, crowbar in hand. He adjusted a headlamp and slid his fingers under a front window to lift it open. His dog Bella, a 40-pound Rhodesian Ridgeback mix, barreled through and Futral followed, squeezing into an empty room with tan carpet peeling from the floor. It was the sixth home he’d broken into that day. Though he’s occasionally mistaken for a thief, Futral, 37, is working for Blackstone Group LP (BX), one of the world’s most sophisticated investors. For the past 18 months, he’s picked locks, shimmied under garage doors and crawled through windows to get into foreclosed homes the company has bought. The locksmith is a cog in a machine assembled by Blackstone to build a rental-home empire across the U.S. In less than two years, the New York-based firm has bought 41,000 properties, most out of foreclosure, in 14 metro areas to become the largest landlord of single-family residences in the country. It’s hired more than 10,000 plumbers, leasing agents and lawyers to transform a mom-and-pop business into one of Wall Street’s hottest investments.
How Risky Is It to Make a Non-QM Mortgage? And Is QM Going to Hold Back Access to Credit? -- One of the huge questions hanging over the mortgage market today is what will happen to access to credit for credit impaired or non-traditional borrowers. There is a real concern that the Dodd-Frank Act’s mortgage reforms will reduce the availability of mortgage credit because lenders’ fear liability for making mortgage loans that fail to qualify as “Qualified Mortgages” (QM) and are thus potentially subject to an Ability-to-Repay (ATR) defense. I've blogged on aspect of QM before (here, here, here, here, here, here, here, and here). Based on a preliminary analysis, I think this concern is overblown, and in this very long post I attempt to work through the potential liability for lenders that make non-Qualified Mortgages. (I note that all of this is my tentative readings of the statute; we really don’t know how courts will interpret it, and others may see better readings than I do now.) Still, my back-of-the-envelope calculation suggests that it is quite low in terms of loss given default and could probably be priced in at around 10 basis points in additional cost for a portfolio with weighted average maturities (actual) of five years. Even with rounding up, that's 25 basis points to recover additional credit losses, which is not a big impact on credit availability. I invite those who would calculate this differently to weigh in in the comments—it’s quite possible that there are factors I have overlooked here, as this is a really preliminary analysis. Ultimately, I don't think ATR liability really matters in terms of availability of credit. What matters is the lack of liquidity--meaning a secondary market--in non-QM loans, as lenders aren't going to want a lot of illiquid loans on their books, and that is a function of the GSEs' credit box, not CFPB regulation.
The Government Is Quietly Giving Way More Housing Aid To Rich People Than Poor People -- The Center for Budget Policy Priorities released a number of charts today that shows how much the federal government favors high-income households over low-income ones in housing benefits. This largely results from the fact that homeowners receive significantly more aid than renters and high-income Americans are much more likely to be homeowners. In 2012, the federal government gave out $240 billion in housing aid. Income data is not available for all of it, but of what is available, more than half went to those with incomes greater than $100,000 ($81.6 billion). Only $40 billion went to those with incomes less than $50,000. Overall, high income households receive four times as much in housing aid as low-income ones. The main reason for this is the majority of federal housing aid flows to homeowners, not renters. The mortgage interest deduction is the most well-known program that subsidizes homeownership. That deduction alone is larger than all federal rental aid combined. The federal government gave out about $60 billion in housing benefits to renters in 2012. It gave out more than three times that much to homeowners. Low-income households receive the vast majority of that rental aid, but the opposite is true of aid to homeowners. That flows primarily to high-income households. This comes at a time when renters are struggling to keep pace with rising housing costs. Fifty percent of renters now spend more than 30% of their income on housing. This has forced renters to cut back on other household necessities or live in inadequate units.
Mortgages Will Become More Expensive - Homebuyers are somewhat suddenly fighting a strong tide. House prices and interest rates have been moving higher while incomes have barely budged—and now lenders are set to stiffen the fees on those with smaller down payments and a less-than stellar credit score. This week, the mortgage giants Fannie Mae and Freddie Mac announced new guidelines that could add as much as a half point to the interest rate that a fixed-rate borrower pays. Fannie and Freddie do not originate new mortgages. But they buy about two-thirds of the conventional mortgages that banks underwrite.The tougher lending rules are set for March. But banks will begin phasing them in next month, when another set of federal rules known as ability-to-repay and the qualified mortgage also kick in. These rules establish stiff penalties for banks that write unconventional mortgages that later go bad. That means banks have less wiggle room to work with borrowers that may be self employed, at a new job or paid on commission. On top of all this, the Fed in January will begin winding down its bond-buying program, which has helped keep mortgage rates low.
Update: FHFA to Delay increase in Mortgage Fees -- From Nick Timiraos at the WSJ: FHFA to Delay Increase in Mortgage Fees By Fannie, Freddie Rep. Mel Watt (D., N.C.), the incoming director of the regulatory agency that oversees Fannie Mae and Freddie Mac, said Friday night he would delay an increase in mortgage fees charged by the housing-finance giants, which was announced earlier this month by that agency. Mr. Watt ... is set to be sworn in on Jan. 6 ... Upon being sworn in, "I intend to announce that the FHFA will delay implementation" of the loan-fee increases "until such time as I have had the opportunity to evaluate fully the rationale for the plan," he said in a statement.
MBA: Mortgage Applications Decrease in Latest Survey - From the MBA: Mortgage Applications Fall During Holiday-Shortened Week Mortgage applications decreased 5.5 percent from one week earlier, according to data from the Mortgage Bankers Association’s (MBA) Weekly Mortgage Applications Survey for the week ending December 13, 2013. ... The Refinance Index decreased 4 percent from the previous week. The seasonally adjusted Purchase Index decreased 6 percent from one week earlier to the lowest level since December 2012...."Mortgage applications fell further last week, with the market index falling to its lowest level in more than a dozen years,” said Mike Fratantoni, MBA’s Vice President of Research and Economics. “Both purchase and refinance applications fell as interest rates increased going into today's Federal Open Market Committee meeting." The average contract interest rate for 30-year fixed-rate mortgages with conforming loan balances ($417,000 or less) increased to 4.62 percent, the highest level since September 2013, from 4.61 percent, with points increasing to 0.38 from 0.26 (including the origination fee) for 80 percent loan-to-value ratio (LTV) loans.The first graph shows the refinance index. The refinance index is down sharply - and down 70% from the levels in early May. The second graph shows the MBA mortgage purchase index. The 4-week average of the purchase index is now down about 11% from a year ago.
Mortgage Applications Collapse To New 13-Year Low - Despite yesterday's exuberant spike in optimism from the NAHB sentiment index to 8 year highs, the delusion from reality appears to growing ever wider. This morning's "if we build them, they will buy'em" false headline spike in housing starts (seasonally-adjusted) is yet another delusional divergence as the mortgage applications index collapses (down 60% from 2013 highs) to a new 13-year low. New 13-year lows in mortgage applications... but, hey, seasonally-adjusted we'll just keep building...
Fed’s Mortgage Role Expands - The Federal Reserve's role in the mortgage market has expanded over the past three months and could remain large for now, even as the central bank attempts to shrink its bond-buying program.The Fed has been buying at least $40 billion in mortgage-backed securities each month, and often much more, along with $45 billion in Treasury bonds. The Fed said on Wednesday that it would reduce its monthly purchases of each type of debt by $5 billion beginning next month. A sharp rise in interest rates this summer ended the latest home-refinancing boom, crimping mortgage-bond issuance. But the Fed won't reduce its share of mortgage-bond purchases until January. Because bond production has tumbled, the Fed's share of total mortgage-bond purchases has risen significantly over the past three months.The Fed bought about 90% of new, eligible mortgage-bond issuance in November, up from roughly two-thirds of such bonds earlier this year, according to data from J.P. Morgan Chase. The Fed's large role in the mortgage market means that even as it reduces its bond purchases, the market could enjoy considerable support from the central bank in the near term. Mortgage rates stood at 4.6% last week for the average 30-year, fixed-rate mortgage, according to the Mortgage Bankers Association. Rates had been as low as 3.6% in May.
Originators react to taper news - With the Federal Reserve announcing today that it’s tapering its bond purchasing program by $10bn per month, mortgage interest rates are sure to go up. While many originators felt the timing on the taper was bad, others stressed that the reduction in the Fed’s quantitative easing program wasn’t the end of the world. “I think this is not the time to do it, because it’s going to raise interest rates, and if you couple that with the announcement by the FHFA about loan level adjustments, you’re eroding the market for consumers at the worst possible time,” said West Virginia broker Marc Savitt, president of the National Association of Independent Housing Professionals. Meanwhile, Kevin Laffey, branch manager for InLanta Mortgage, said he felt purchase business would probably weather the higher rates. “I think from a market point of view, it’s probably going to affect the refi business more than anything,” Laffey said. “As long as they don’t get too crazy about it, I think the (purchase) market is already factored that in.” Jon Marcoline, branch manager for FBC Mortgage, also recommended focusing on purchase business as rates go up.
Weekly Update: Housing Tracker Existing Home Inventory up 1.9% year-over-year on Dec 16th - Here is another weekly update on housing inventory ... for the ninth consecutive week, housing inventory is up year-over-year. This suggests inventory bottomed early in 2013. There is a clear seasonal pattern for inventory, with the low point for inventory in late December or early January, and then peaking in mid-to-late summer. The Realtor (NAR) data is monthly and released with a lag (the most recent data was for October; November data will be released later this week). However Ben at Housing Tracker (Department of Numbers) has provided me some weekly inventory data for the last several years. This graph shows the Housing Tracker reported weekly inventory for the 54 metro areas for 2010, 2011, 2012 and 2013. In 2011 and 2012, inventory only increased slightly early in the year and then declined significantly through the end of each year.Inventory in 2013 is now 1.9% above the same week in 2012 (red is 2013, blue is 2012).Inventory is still very low - and barely up year-over-year - but this increase in inventory should slow house price increases.
Existing Home Sales in November: 4.90 million SAAR, Inventory up 5.0% Year-over-year - The NAR reports: Existing-Home Sales Decline in November, but Strong Price Gains ContinueTotal existing-home sales, which are completed transactions that include single-family homes, townhomes, condominiums and co-ops, dropped 4.3 percent to a seasonally adjusted annual rate of 4.90 million in November from 5.12 million in October, and are 1.2 percent below the 4.96 million-unit pace in November 2012. This is the first time in 29 months that sales were below year-ago levels...Total housing inventory at the end of November declined 0.9 percent to 2.09 million existing homes available for sale, which represents a 5.1-month supply at the current sales pace, compared with 4.9 months in October. Unsold inventory is 5.0 percent above a year ago, when there was a 4.8-month supply.This graph shows existing home sales, on a Seasonally Adjusted Annual Rate (SAAR) basis since 1993. Sales in November 2013 (4.90 million SAAR) were 4.3% lower than last month, and were 1.2% below the November 2012 rate. The second graph shows nationwide inventory for existing homes. According to the NAR, inventory was declined to 2.09 million in November from 2.11 million in October. Inventory is not seasonally adjusted, and inventory usually increases from the seasonal lows in December and January, and peaks in mid-to-late summer. The third graph shows the year-over-year (YoY) change in reported existing home inventory and months-of-supply. Since inventory is not seasonally adjusted, it really helps to look at the YoY change. Months-of-supply is based on the seasonally adjusted sales and not seasonally adjusted inventory.
Existing Home Sales Go Negative for the First Time in 29 Months The NAR reported existing home sales plunged -4.3% from last month and are down -1.2% from last year. This is the first yearly decline in existing home sales since June 2011, a full 29 months ago. Unsold Inventory increased 5.0% from last year and represents a 5.1 months supply at current rates . Volume was an annualized and seasonally adjusted 4.90 million for November 2013. The national median existing home sales price, all types, is $196,300, a 9.4% increase from a year ago. Below is a graph of the median price. One needs to compare prices only a year ago for increases due to the monthly ups and downs in prices associated with the seasons. The recent plunge in the below graph might be seasonal in other words. The average home price for November was $244,500, a 7.3% annual increase. The NAR went into denial mode again on the declining sales and blamed a low supply as the cause. They also claimed there is this amazing pent up demand for homes being squeezedby mortgage interest rates and low housing inventory. Wages and the fact most Americans cannot afford a home never enters the NAR dialog. They do mention price increases and claim rents have increased at the highest pace in five years and annual home price increases are at the fastest pace in eight years. What is more interesting is the decline in distressed home sales. Foreclosures and short sales are now only 14% in November whereas a year ago they were 22% of all sales. The breakdown in distressed sales was 9% foreclosures and 5% short sales. Below is the discount obtained from these sales: Foreclosures sold for an average discount of 17 percent below market value in November, while short sales were discounted 13 percentSo called investors are still buying up existing homes. All cash buyers were 32% of all sales. NAR reports individual investors purchased 19% of the existing homes and 7 out of 10 investors paid cash. First time home buyers were 28% of the sales.The median time for a home to be on the market was 54 days. In November 2012 the median time an existing home was for sale was 70 days and this appears to be due to less short sales, which were on the market a full 120 days.
Existing Home Sales Tumble, Post First Annual Decline In 29 Months On Day After Taper Begins - If anyone is still wondering why back in June Zero Hedge first presented what the adverse impact on housing affordability as a result of soaring rates, today's NAR release on existing home sales should set all questions to the side. Because after rising in a seemingly relentless fashion, existing home sales have (and this is before the traditional downward revision by Larry Yun's conflicted organization which will expose all of its numbers as flawed regardless) finally hit a brick wall, and not only did November existing home sales tumble from 5.12MM to 4.90MM, missing estimates of 5.02MM, they also posted the first year over year decline in 29 consecutive months of increases. Of course, as a reminder only 40% of house buyers actually use a mortgage, and the remaining 60%, as Goldman estimated recently, are all cash. Which means that not only are the all cash buyers fading out of the housing market at an ever faster pace, but if left only to the mortgaged-buyers, then watch out below. Finally, and as usual, in addition to rising rates, Larry Yun was quick to cast blame on lack of inventory and supply. Perhaps he should speak to the likes of Bank of America which are keeping millions of empty units on its books following fraudulent foreclosure practices, in a desperate attempt to extract that one final bit of inventory subsidy from the housing market.
All-Cash Home Sales Reach New High - More Americans are buying homes in all-cash deals, according to a new report. But real-estate experts say this increase may not be a good sign for the health of the housing market, which may also be impacted by the Federal Reserve’s decision to pull back on its bond-buying program. All-cash purchases accounted for 42% of all sales of residential property in November 2013, up from 39% during the previous month, according to data from real-estate data firm RealtyTrac released Friday. “This is still a very cash- and investor-driven market,” says Daren Blomquist, vice president at RealtyTrac. The cities with the biggest month-over-month jumps in the number of all-cash sales, according to RealtyTrac, included Florida (63%), Georgia and Nevada (both 51%), South Carolina (50%) and Michigan (49%). This helped boost overall sales of U.S. residential properties, which sold at an annualized pace of 5.1 million in November 2013, a 1% increase from the previous month and a rise of 10% from a year ago.
Comments on Existing Home Sales - As expected, existing home sales declined in November. But lower existing home sales, and slower price appreciation, doesn't mean the housing recovery is over. What matters for jobs and the economy are new home sales, not existing home sales. And I expect the housing recovery to continue. A key story in the NAR release this morning was that inventory was up 5.0% year-over-year in November. Inventory is still very low, but year-over-year inventory has now turned positive, and I expect inventory to continue to increase. With the low level of inventory, there is still upward pressure on prices - but as inventory starts to increase, buyer urgency will wane, and price increases will slow. The NAR does not seasonally adjust inventory, even though there is a clear seasonal pattern. Trulia chief economist Jed Kolko sent me the seasonally adjusted inventory (see graph of NAR reported and seasonally adjusted). This shows that inventory bottomed in January (on a seasonally adjusted basis), and is now up about 8.4% from the bottom. On a seasonally adjusted basis, inventory was up 1.7% in November, even though the NAR reported inventory declined NSA. The NAR reports active listings, and although there is some variability across the country in what is considered active, most "contingent short sales" are not included. "Contingent short sales" are strange listings since the listings were frequently NEVER on the market (they were listed as contingent), and they hang around for a long time - they are probably more closely related to shadow inventory than active inventory. However when we compare inventory to 2005, we need to remember there were no "short sale contingent" listings in 2005. In the areas I track, the number of "short sale contingent" listings is also down sharply year-over-year.Another key point: The NAR reported total sales were down 1.2% from November 2012, but conventional sales were probably up from November 2012, and distressed sales down. The NAR reported that 14% of sales were distressed in November (from a survey that isn't perfect): Last year the NAR reported that 22% of sales were distressed sales. So total sales were down slightly, distressed sales down sharply and conventional sales were up. That is a positive sign. The following graph shows existing home sales Not Seasonally Adjusted (NSA)
Average 30-year mortgage rate moves up to 4.47% - Mortgage buyer Freddie Mac said Thursday the rate on the 30-year loan increased to 4.47% from 4.42% last week. The average on the 15-year fixed loan rose to 3.51% from 3.43%. A government report issued Wednesday showed that U.S. builders broke ground on homes in November at the fastest pace in more than five years, strong evidence that the housing recovery is accelerating despite higher mortgage rates. Data from the National Association of Realtors released Thursday showed the number of people who bought existing homes last month declined for the third straight month as higher mortgage rates made home-buying more expensive. To calculate average mortgage rates, Freddie Mac surveys lenders across the country on Monday through Wednesday each week. The average doesn't include extra fees, known as points, which most borrowers must pay to get the lowest rates. One point equals 1% of the loan amount. The average fee for a 30-year mortgage was unchanged at 0.7 point. The fee for a 15-year loan declined to 0.6 point from 0.7 point.
The Multi-Pronged Mortgage Debacle Next Year (So Long, “Housing Recovery”) - The feverishly awaited taper announcement, after months of deafening Fed cacophony, is in the can. But mere talk of ending it has sent mortgage rates soaring – and mortgage applications plunging to the “lowest level in more than a dozen years,” lamented the Mortgage Bankers Association. The Refinance Index has crashed. The all-important Purchase Index is now 12% lower than last year. People who need mortgages to buy homes – hence, not hedge funds, private equity firms, oligarchs, and other sundry investors – have been throttling back. Sales of existing homes slumped for the third month in a row in November, down 4.3%, to a seasonally adjusted annual rate of 4.9 million, 1.2% below last year – the first annual decline in over two years. It’s just getting too darn expensive. Home prices have soared over the last two years. And mortgage rates have soared since May. A toxic concoction.The average contract rate for 30-year mortgages with conforming loan balances ($417,000 or less) rose to 4.62%, up from 3.59% in early May. Where will mortgage rates go when the Fed actually stops trying to repress them? Interesting times. Now comes part three of the debacle, after soaring home prices and mortgage rates. It was drowned out by the hullaballoo over the Fed’s taper announcement. It came from our favorite bailed-out, taxpayer-owned Fannie Mae and Freddie Mac that purchase mortgages from banks and then either keep them on their books or stuff them into MBAs that they sell with some guarantees. Biggest buyer? The Fed. It has been plowing $40 billion a month into them – to be reduced to $35 billion in January.
FNC: House prices increased 6.5% year-over-year in October - From FNC: FNC Index: October Home Prices Up; Pace Slows The latest FNC Residential Price Index™ (RPI) shows October home prices are up, albeit at a slower pace than previous months. The index, constructed to gauge underlying property value based on non-distressed home sales, showed a 0.3% month-over-month increase from September to October—its weakest acceleration in eight months. Sustained by moderate economic growth and job creation, housing market fundamentals are expected to improve continually as indicators of distressed mortgages and home foreclosures continue to point to new lows. As of October, completed foreclosure sales nationwide contributed 13.9% to total home sales, up slightly from September’s 13.4% but down from 17.0% a year ago..... Based on recorded sales of non-distressed properties (existing and new homes) in the 100 largest metropolitan areas, the FNC 100-MSA composite index shows that October home prices increased from the previous month at a seasonally unadjusted rate of 0.3%. The two narrower RPI indices (30- and 10-MSA composites) also rose at a slower pace than previous months. On a year-over-year basis (YOY), home prices continue to accelerate moderately, up 6.5% from the same period a year ago, the fastest growth in more than seven years. (August 2006 was the last time the YOY growth measured similar magnitude.) The 30-MSA and 10-MSA composites recorded slightly faster YOY price appreciation. The 100-MSA composite was up 6.5% compared to October 2012. The FNC index turned positive on a year-over-year basis in July, 2012. This graph shows the year-over-year change for the FNC Composite 10, 20, 30 and 100 indexes. Even with the recent increase, the FNC composite 100 index is still off 25.2% from the peak. I expect all of the housing price indexes to show lower year-over-year price gains soon.
Housing Starts, Permits Surge On Seasonal Adjustments, Rental Units - Today's key economic data point, aside from the FOMC announcement of course, was the monthly Housing Starts and Permits report. And with November starts printing at 1091K, a massive 202K unit surge compared to the revised 889K in October, this was the highest monthly print since early 2008 and biggest monthly jump since... January 1990! Supposedly builders just can't get enough. Well, maybe. Until one again looks below the headlines, where one finds that a substantial portion of the jump is once again due to the builders' bet that rental housing demand will continue growing, as multi-family unit starts soared from 281K to 354K - just shy of the highest print since 2008 as well. However, there was more: because if one assumes a major surge in seasonally adjusted data, there should be a matched surge in NSA data too. There wasn't, and in fact the NSA print rose by a very modest 5.5K to 82.8K actual houses started in November. Additionally, the single-family print barely rose from 49.2 to just 51.9, well below the highs seen in the summer of 2013, when unadjusted single-family starts were higher than the November print from March until August! In fact, at 51.9K, single unit homes are back to mid-2011 levels. Thank you seasonal adjustments.
Housing Starts at 1.09 million Annual Rate in November - This report is for three months due to the government shutdown; September, October and November. From the Census Bureau: Permits, Starts and Completions Privately-owned housing starts in November were at a seasonally adjusted annual rate of 1,091,000. This is 22.7 percent above the revised October estimate of 889,000 and is 29.6 percent above the November 2012 rate of 842,000. Single-family housing starts in November were at a rate of 727,000; this is 20.8 percent above the revised October figure of 602,000. The November rate for units in buildings with five units or more was 354,000. Privately-owned housing units authorized by building permits in November were at a seasonally adjusted annual rate of 1,007,000. This is 3.1 percent below the revised October rate of 1,039,000, but is 7.9 percent above the November 2012 estimate of 933,000. Single-family authorizations in November were at a rate of 634,000; this is 2.1 percent above the revised October figure of 621,000. Authorizations of units in buildings with five units or more were at a rate of 346,000 in November.The first graph shows single and multi-family housing starts for the last several years. Multi-family starts (red, 2+ units) increased in November (Multi-family is volatile month-to-month). Single-family starts (blue) increased sharply to 727,000 SAAR in November. The second graph shows total and single unit starts since 1968. This was well above expectations of 952 thousand starts in November. I'll have more later ... but this was a solid report..
Comments: Housing Starts and Mortgage Index - A few comments:
• The MBA purchase index is down about 10% year-over-year, and this has led to some articles like this from CNBC: Mortgage applications plummet amid uncertainty Purchase applications though are down 10 percent, mirroring a slowdown in home sales in many previously hot markets. The slowdown in existing home sales is mostly due to less investor buying and fewer distressed sales (fewer cash buyers). Declining distressed sales, but increasing conventional sales - even if total sales decline - is a good sign! And an important note on the Purchase Index: the index is probably understating purchase activity due to a change in the mix of lenders. The MBA index is useful, but housing starts and new home sales provide better information.
• Overall the housing starts report was encouraging with total starts at a 1.09 million rate on a seasonally adjusted annual rate basis (SAAR) in November. This was well above the consensus forecast of 952 thousand SAAR.
• And the increase wasn't just in the volatile multi-family sector; single family starts were at the highest level since early 2008.
• Also housing starts are up significantly from the same period last year. Over the first eleven months of 2013, total starts are up over 19% compared to the same period in 2012. The increases in starts slowed in the 2nd half of 2013, but this has been a solid year for residential investment growth.
• Even with another significant year-over-year increase, housing starts are still very low. Starts averaged 1.5 million per year from 1959 through 2000, and demographics and household formation suggests starts will return to close to that level over the next few years. This suggests significantly more growth in housing starts over the next few years.
Quarterly Housing Starts by Intent compared to New Home Sales -- In addition to housing starts for November, the Census Bureau also released the Q3 "Started and Completed by Purpose of Construction" report this morning. It is important to remember that we can't directly compare single family housing starts to new home sales. For starts of single family structures, the Census Bureau includes owner built units and units built for rent that are not included in the new home sales report. For an explanation, see from the Census Bureau: Comparing New Home Sales and New Residential Construction We are often asked why the numbers of new single-family housing units started and completed each month are larger than the number of new homes sold. This is because all new single-family houses are measured as part of the New Residential Construction series (starts and completions), but only those that are built for sale are included in the New Residential Sales series. However it is possible to compare "Single Family Starts, Built for Sale" to New Home sales on a quarterly basis. The quarterly report released this morning showed there were 120,000 single family starts, built for sale, in Q3 2013, and that was above the 90,000 new homes sold for the same quarter, so inventory increased in Q3 (Using Not Seasonally Adjusted data for both starts and sales).
Vital Signs: Housing Numbers Are Worth the Wait - Economy-watchers had to wait a long time for housing starts number, but their patience was rewarded. After the government shutdown delayed the housing data, the Commerce Department said starts were little changed in September and October and then jumped 22.7% in November. At an annual rate of 1.091 million, November starts were at the highest reading since February 2008. (The split shows multi-unit starts are back to their pre-recession level, but single-family homes stand at well less than half of their boom numbers.) Commerce also reported building permits averaged more than 1 million over the past three months. Both series suggest momentum in the housing sector. But there is reason for caution. The 30-year mortgage rate is back above 4.5%. That’s not historically high, but combined with rising home values, higher rates limit affordability. Plus, as noted in Wednesday’s Wall Street Journal, borrowers with less than pristine credit will face higher mortgage fees in 2014, another deterrent for some potential buyers.
Why the Home-Building Industry is About to Take Off - Good news for the construction industry this morning: The Commerce Department announced that on a seasonally-adjusted basis there were 1,091,000 new residential construction projects begun in November, a 22.7% increase, or the biggest one-month jump since 1990. As you can see from the chart below, the absolute number of new projects–called housing starts–is at its highest since 2008. It’s never a good idea to draw hard conclusions from one month of data, but the trend is obviously positive, and the jump in construction in November backs up predictions from analysts like Goldman Sachs’ Tom Teles, who believes that the home construction industry could add 300,000 to 500,000 jobs next year, and possibly twice that number if construction-related fields are taken into account. Last year may have been the year where we saw home prices recover, but it’s increasingly looking like 2014 is the year where the economy will benefit more broadly from those price increases.
Econ Chart Update- Single Family Starts Outrun Sales- Construction Employment Lags, Multifamily Booms - The way the media is reporting this morning’s housing starts news, you would think that housing is booming. The headline number for total starts, seasonally adjusted and annualized (in other words total statistical BS) was reported at 1.09 million units. The consensus expectation was for 950,000. The headline writers went nuts on that. But the chart above provides some perspective. It shows the actual monthly numbers, not seasonally adjusted, along with lines showing the year to year trend for the current month going back to 2000 for perspective. The “recovery” in total starts is mostly driven by the boom in multifamily. Single family starts are well off the lows, but they are still only half of the levels 2000-2002, when the US was in another recession. Not shown on the chart, the current level of single family starts is only equal to 1991 levels. That’s in spite of the fact that the nation’s population has grown by 25% since then. And 1991 was a terrible year.Two other trends are notable on the chart. The gap between single family starts and sales is growing. Supply is outrunning demand in new single family construction. Inventory is building. That trend will force a slowdown in starts at some point unless sales increase faster, which doesn’t seem likely.Meanwhile single family construction employment is stuck near the depression lows. Builders have found ways to increase production without increasing employment much. There’s no contribution to overall employment growth here. S0 much for the widely touted recovery in housing starts. It’s not what the headlines make it out to be.
Rising interest rates will negatively impact US housing in 2014 - One disagrees with Bill McBride a/k/a Calculated Risk at one's peril, especially when it comes to housing, but that is what I am about to do. Bill (link: http://www.calculatedriskblog.com/2013/12/update-looking-for-stronger-ec...) has written that he is looking for stronger economic growth in 2014 in part because he expects that "the housing recovery should continue." Unless the interest rate spike that began in April 2013 abates, I disagree that the housing recovery will continue, and that will have a negative effect on growth rates by the end of 2014. Below I have plotted the YoY changes in housing permits vs. the YoY percent change in 10 year treasury bonds for the last 60+ years. Both are averaged quarterly to distill signal from noise. Treasury yields are inverted so that a rise in yields is shown as a decline.First, here the period from 1962 to 1984: Permits are in blue, scaled so that 1=200,000 houses. Treasuries are in red: Next, here is 1984 to the present. Permits are scaled at 1=100,000 houses. Note that the two series move largely in sync. Specifically, a rise in 1% in interest rates YoY almost always leads to a decline of 100,000 or more housing permits a year, with usually no more than a 6 month lag. The only 3 exceptions are in 1968, for a short period between between the two parts of the "double dip" 1980 and 1981 recessions, and during the 2004-05 blowoff phase of the housing bubble. Further, only twice in the last 50 years have interest rates risen by over 2% YoY without a recession following. Finally, here is a close-up of the last 18 months:
Many Banks, Many Builders: Concentration in the Construction Industry - The home construction industry has always been fragmented, with small construction firms holding a larger market share than big firms. This fragmentation was especially noticeable during the housing boom. In 2005, for example, the top 10 construction firms in the country had just 25 percent of the market share, and the top 200 firms had less than 50 percent. One explanation for the fragmentation is that construction just doesn't have many economies of scale. Not surprisingly, these numbers started to shift during the recession, especially in areas hit harder by the housing bust—when bank lending to small builders all but disappeared. According to Bloomberg, the market share of the top 100 firms in the West and South grew by 10 percent during the crisis. In the Midwest, the market share of closings of the top 10 builders grew from 20 percent to 30 percent after 2007. Note that small banks—and therefore small bank failures—had also been concentrated in these three regions (see chart 1).
Research: The Long-Term Outlook for Residential Construction - From Jordan Rappaport, Senior Economist at the Kansas City Fed: The Long-Term Outlook for U.S. Residential Construction. Here is the complete paper. Excerpt: Long-term demand for both single- and multifamily housing can be projected by considering the observed, historical housing choices of different demographic groups defined by age and gender. By combining this information with U.S. Census Bureau forecasts for the size and composition of the country's population through 2035, we project the long-term path of the number of occupied housing units in the United States. This projected trend is well above the current number of occupied units, especially for multifamily housing. Closing the gap between actual occupancy and the projected trend will require a significant rise in construction over the next few years.However, the longer-term outlook for construction growth is significantly weaker. ...Under a baseline projection, single family starts increase by 150 percent from 2012 to their peak in 2021 (Chart 1). The annual level of starts at this peak is about the same as in 2002, one year into the single-family construction boom. Single-family construction is then projected to fall over the subsequent decade ...CR Note: I haven't looked at all Rappaport's assumptions for the longer-term, but I agree that demographics are favorable over the short term, and that we should expect single family starts to continue to increase over the next few years.
NAHB: Builder Confidence increases to 58 in December - The National Association of Home Builders (NAHB) reported the housing market index (HMI) was at 58 in December, up from 54 in November. Any number above 50 indicates that more builders view sales conditions as good than poor. From the NAHB: Builder Confidence Rises Four Points in December Builder confidence in the market for newly built, single-family homes improved four points to a 58 reading on the National Association of Home Builders/Wells Fargo Housing Market Index (HMI) for December, released today. This gain reflected improvement in all three index components – current sales conditions, sales expectations and traffic of prospective buyers. ... All three HMI components posted gains in December. The index gauging current sales conditions jumped six points to 64, while the index gauging expectations for future sales rose two points to 62. The index gauging traffic of prospective buyers gained three points to 44. Looking at the three-month moving averages for regional HMI scores, the South edged one point higher to 57 while the Northeast, Midwest and West each fell a single point to 38, 59 and 59, respectively. This graph show the NAHB index since Jan 1985
Homebuilder Confidence Spikes Back To Highest In 8 Years - Despite higher rates, collapsing mortgage applications, lower affordability, and fast money exiting the market, the NAR just won't back off their exuberant optimism that it will all end well. With the biggest beat of expectations in 7 months, the NAHB sentiment index re-spiked back to 58 - levels not seens since November 2005. Only the Northeast saw prospective buyer traffic drop notably (we are sto be blamed on the weather) as the survey saw a surge in the single-family-home-sales sub-index. Yay - 8 year highs in optimism... Seems a little overdone...
AIA: "Slight Contraction for Architecture Billings Index" in November - Note: This index is a leading indicator primarily for new Commercial Real Estate (CRE) investment. From AIA: Slight Contraction for Architecture Billings Index After six months of steadily increasing demand for design services, the Architecture Billings Index (ABI) paused in November. As a leading economic indicator of construction activity, the ABI reflects the approximate nine to twelve month lead time between architecture billings and construction spending. The American Institute of Architects (AIA) reported the November ABI score was 49.8, down from a mark of 51.6 in October. This score reflects a slight decrease in design services (any score above 50 indicates an increase in billings). The new projects inquiry index was 57.8, down from the reading of 61.5 the previous month. This graph shows the Architecture Billings Index since 1996. The index was at 49.8 in November, down from 51.6. Anything below 50 indicates contraction in demand for architects' services. This index has indicated expansion in 14 of the last 16 months. Note: This includes commercial and industrial facilities like hotels and office buildings, multi-family residential, as well as schools, hospitals and other institutions.
Vanishing rental affordability pressures families -- When President Kennedy was elected in 1960, only about a tenth of renters spent more than half their income on rent and utilities. Today, according to a biennial report on rental housing issued by Harvard's Joint Center on Housing Studies, fully one-quarter of all renters face such extreme rental cost burdens. Rental affordability problems have escalated every decade except for the 1990s, when the longest peacetime expansion in US history managed to temporarily halt the trend. The last dozen or so years have been especially harsh. Inflation-adjusted median incomes and rents moved in opposite directions even during the economic expansion phase of the 2000s. Then the Great Recession and Gradual Recovery took an even worse toll. After climbing by 1.4 million from 2001 to 2007, the number of households with extreme rent burdens increased by another nearly 2.5 million from 2007-2011. These extreme rental affordability problems are far worse among those with low incomes. Indeed, among renters with household incomes of $15,000 or less—roughly equivalent to full-time minimum wage work—a whopping seven in ten have extreme rent burdens. But even among those with incomes in the $15,000-$30,000 range, one-in-three are also burdened.
Change In US Net Worth - By Age Group -- By now it is a well-known fact that the Fed's monetary policies over the past 5 years (and really ever since Greenspan unleashed the Great Moderation) have been very successful at one thing: transferring wealth from the US (and global) middle class and handing it over to the already wealthiest strata of society, either through financial repression, zero savings rates, or generally boosting financial asset values, which as we showed hit a record $63.9 trillion in Q3, or over 70% of total. However, just like the general public's attention is focused on the quantitative components of the monthly payroll number and completely ignores the qualitative gains or losses in the US labor force, so the broad definition of "middle class" leaves quite a bit to be desired. So what happens if one quantizes society instead of by class with wealth of income cutoff ranges but instead by age? In that case, one gets the following chart prepared by the Urban Institute showing the change in net worth in the period 1983-2010 by age group. The discrepancy summarized: Young adults’ ability to grow their personal assets over the past 30 years has decreased considerably. Average wealth for individuals in their 20s and 30s dropped 7 percent from 1983 to 2010, while those 74 and over have seen wealth increase by 149 percent in the same time period. Figure 7 highlights the substantial changes in net worth by age, showing that Millennials today are financially worse off than their parents were at the same age
CPI unchanged in November, Core CPI increases 0.2% - From the Bureau of Labor Statistics (BLS): Consumer Price Index - November 2013: The Consumer Price Index for All Urban Consumers (CPI-U) was unchanged in November on a seasonally adjusted basis, the U.S. Bureau of Labor Statistics reported today. Over the last 12 months, the all items index increased 1.2 percent before seasonal adjustment. The index for all items less food and energy rose 0.2 percent in November. ... The 12-month increase in the index for all items less food and energy remained at 1.7 percent for the third month in a row.On a year-over-year basis, CPI is up 1.2 percent, and core CPI is up also up 1.7 percent. Both are below the Fed's target. This was close to the consensus forecast of no change for CPI, and above the consensus for a 0.1% increase in core CPI.
November 2013 CPI Inflation Little Change - The November 2013 Consumer Price Index (CPI-U) year-over-year inflation rate increased marginally but was constrained by a decline in energy prices. The Consumer Price Index (CPI-U) year-over-year inflation rate grew from 1.0% to 1.2% . Core inflation (CPI less food and energy) was unchanged at 1.7%. The Producer Price Index showed finished goods rose from 0.3% in September to 0.7% in November 2013. It is seldom that the CPI is lower than the PPI. As a generalization – inflation accelerates as the economy heats up, while inflation rate falling could be an indicator that the economy is cooling. However, inflation does not correlate well to the economy – and cannot be used as a economic indicator. Energy by far was the major influence on this month’s CPI. Over the last 12 months, the all items index increased 1.2 percent before seasonal adjustment.The energy index declined in November, offsetting increases in other indexes to result in the seasonally adjusted all items index being unchanged. The indexes for gasoline and for natural gas fell significantly, more than offsetting increases in the electricity and fuel oil indexes. The food index rose slightly in November, with the food at home index unchanged.The index for all items less food and energy rose 0.2 percent in November. Increases in the indexes for shelter and airline fares accounted for most of the increase, with the indexes for recreation and for used cars and trucks also rising. The indexes for apparel, for household furnishings and operations, and for new vehicles all declined in November. The all items index increased 1.2 percent over the last 12 months, a larger increase than the 1.0 percent rise for the 12 months ending October. The 12-month increase in the index for all items less food and energy remained at 1.7 percent for the third month in a row. The food index increased 1.2 percent over the last 12 months, while the energy index declined 2.4 percent.
Headline Inflation Ticks Up to 1.24% YoY, Core Inflation Essentially Unchanged at 1.72% -- The Bureau of Labor Statistics released the latest CPI data this morning. Year-over-year unadjusted Headline CPI came in at 1.24, which the BLS rounds to 1.2%, up from 0.96% last month (rounded to 1.0%). Year-over-year Core CPI (ex Food and Energy) came in at 1.72% (rounded to 1.7%), virtually unchanged from last month's 1.68% (rounded to 1.7%). Here is the introduction from the BLS summary, which leads with the seasonally adjusted data monthly data: The Consumer Price Index for All Urban Consumers (CPI-U) was unchanged in November on a seasonally adjusted basis, the U.S. Bureau of Labor Statistics reported today. Over the last 12 months, the all items index increased 1.2 percent before seasonal adjustment. The energy index declined in November, offsetting increases in other indexes to result in the seasonally adjusted all items index being unchanged. The indexes for gasoline and for natural gas fell significantly, more than offsetting increases in the electricity and fuel oil indexes. The food index rose slightly in November, with the food at home index unchanged. The index for all items less food and energy rose 0.2 percent in November. Increases in the indexes for shelter and airline fares accounted for most of the increase, with the indexes for recreation and for used cars and trucks also rising. The indexes for apparel, for household furnishings and operations, and for new vehicles all declined in November. The all items index increased 1.2 percent over the last 12 months, a larger increase than the 1.0 percent rise for the 12 months ending October. The 12-month increase in the index for all items less food and energy remained at 1.7 percent for the third month in a row. The food index increased 1.2 percent over the last 12 months, while the energy index declined 2.4 percent. More... The Investing.com consensus forecast was for no change MoM for headline CPI and a 0.2% increase for Core CPI. Their YoY forecast for Core CPI was spot on at 1.7%.The first chart is an overlay of Headline CPI and Core CPI (the latter excludes Food and Energy) since 1957. The second chart gives a close-up of the two since 2000.
CPI Unchanged But Shelter Costs Are On The Rise - The monthly Consumer Price Index had no change for November as the price of gas declined. CPI measures inflation, or price increases. While overall inflation was unchanged, consumers still did not get a break for the cost of sheltering oneself rose dramatically. CPI has only increased 1.2% from a year ago as shown in the below graph. This is a very low annual rate of inflation and believe this or not, deflation can really harm an economy. Core inflation, or CPI with all food and energy items removed from the index, increased 0.2%. Core inflation has risen 1.7% for the last year and since June 2011 has ranged from 1.6% to 2.3%. Core CPI is one of the Federal Reserve inflation watch numbers and 2.0% per year is their boundary figure. Graphed below is the core inflation change from a year ago. Core CPI's monthly percentage change is graphed below. Energy overall declined -1.0% and energy costs are now down -2.4% for the entire year. The BLS separates out all energy costs and puts them together into one index. This index includes gasoline which dropped -1.6% for the month and has declined -5.8% for the year. Natural gas is now up 1.0% from a year ago after a monthly decline of -1.8%. Energy costs are also mixed in with other indexes, such as heating oil for the housing index and gas for the transportation index. Below is the overall CPI energy index, or all things energy.
Vital Signs: Where Inflation Calls Home - Inflation news continues to be no news. Total consumer prices are up just 1.2% in the year ended in November, while core prices that exclude food and energy are up 1.7%. Both rates are below the 2% target set by the Federal Reserve. One area where inflation is above the Fed’s target is the cost of shelter. Owners’ equivalent rent–the imputed cost of renting one’s own home—increased 2.4% in the past year and has been above 2% since early 2012. OER comprises a large 24% share of the total CPI. Slowly climbing rents offer an offset to the price declines for some goods and the volatile swings in food and energy prices. That should provide some solace to Fed officials still worried about disinflation.
Weekly Gasoline Update: Down Three Cents - It's time again for my weekly gasoline update based on data from the Energy Information Administration (EIA). Rounded to the penny, Regular and Premium both fell three cents. Regular and Premium are down 55 cents and 48 cents, respectively, from their interim highs in late February. Cheaper gasoline means more money for holiday spending, and tomorrow's headline Consumer Price Index will no doubt reflect the trend lower. According to GasBuddy.com, no state is averaging above $4.00 per gallon, and only Hawaii is averaging over $3.80. Eight states (Oklahoma, Missouri, Minnesota, Arkansas, Kansas, Nebraska, New Mexico and Montana) are averaging under $3.00, up from five states last Monday.
Subdued inflation takes average wages to near 3 year high - Yesterday was the first time since I've been using the price of gas as a KISS method to track inflation that my forecast was off: non-seasonally adjusted CPI was -0.2% and seasonally adjusted was unchanged, vs. unchanged NSA and +0.3% seasonally adjusted as I had forecast. But YoY inflation was +1.2%, which was within 0.1% of my +1.3% forecast. One by-product of this subdued inflation, caused in large part by somnolent gas prices, is that real, inflation-adjusted wages are starting to rise again. Here's a graph of average hourly wages on non-supervisory workers adjusted by inflation for the last 10 years: Yes, real wages did spike higher during the Great Recession, because in late 2008 gas prices fell from $4.25 a gallon to about $1.50 a gallon. They declined in 2011 and 2012 as gas prices went back as high as $3.95 a gallon again. With the loosening of the Oil choke collar in 2013, however, real average wages as of yesterday rose to their highest level since February 2011, nearly 3 years ago. The trend has turned positive, with YoY real wages rising by about 1%, as shown in the graph below of the YoY% change in real wages:
Cheap Natural Gas Could Put More Money in Americans’ Pockets - Cheap natural gas could give Americans more cash to spend over the next decade. Bloomberg News A surge in natural-gas production has driven prices down 50% in the last eight years, a stunning development that is reducing Americans’ energy costs, according to a study by the Boston Consulting Group. By 2020, these savings from low-cost energy could amount to nearly 10% of the average U.S. household’s spending after taxes and paying for necessities, or about $1,200 a year, the report said. Economists say lower natural-gas prices will help U.S. businesses reduce costs, but there’s an important impact on consumers, too: The average U.S. household devoted about 20% of its total spending last year to energy, both directly (things like electricity and heating) and indirectly (higher costs for goods and services), BCG says. If Americans save more on energy and see lower prices when they buy goods, they might ramp up discretionary spending and propel the sluggish recovery. “We don’t know that consumers are going to necessarily spend all that money—but it does give them money that they can spend,” Consumer spending, which accounts for roughly two-thirds of the nation’s economic activity, has been resilient this year despite higher taxes and stagnant wages. One possible explanation is lower energy costs. Indeed, BCG says the average American household is already saving more than $700 a year. On Tuesday, the Labor Department said energy prices fell in November, helping muffle overall inflation. Prices at the gasoline pump have also fallen on average from nearly $3.70 in mid-July to below $3.25 as of Monday, according to the Energy Information Administration.
The Big Four Economic Indicators: Continued Strength in Real Retail Sales - Today's release of the November Consumer Price Index enables the calculation of Real Retail Sales for November. Elsewhere I've reported on nominal Retail Sales, and earlier today I posted an analysis of Real Retail Sales Per-Capita. As the adjacent thumbnail illustrates, this economic indicator has accelerated over the past two months. It was the first of the Big Four to reach new all-time highs, a feat it accomplished in February of this year. The question now, of course, is how this key indicator fares during the holiday season, which, for many retailers, is the make-or-break for calendar-year earnings. The chart and table below illustrate the performance of the Big Four and simple average of the four since the end of the Great Recession. The data points show the percent cumulative percent change from a zero starting point for June 2009. The latest data point is for the 53rd month. In addition to the four indicators, I've included an average of the four, which, as we can see, was influenced by the anomaly in the Personal Income tax management strategy at the end of last year with a ripple effect in the opening months of this year.
Big US online retailer to accept Bitcoin - Overstock plans to become the first big U.S. online retailer to accept Bitcoin, as Patrick Byrne, the company's libertarian chief executive, warms to the virtual currency as a refuge from government control. Mr Byrne told the Financial Times that Overstock planned to start accepting Bitcoin next year – possibly by the end of the second quarter – a decision that he said was driven mainly by his own political philosophy. "I think a healthy monetary system at the end of the day isn't an upside down pyramid based on the whim of a government official, but is based on something that they can't control," Mr Byrne said.
Hackers Love Black Friday, Just Ask Target - It wasn't just gullible shoppers were in a frenzy on Black Friday. Seems hackers love the marketing hyped retail bonanza as well. Target was hacked and a whopping 40 million credit and debit cards were ripped off from November 27th to December 19th. The speed of the massive theft is unprecedented in cyber-crime history. Target is the second largest generalized merchandise retailer in America. This is huge. The irony is extreme. Target just became a target for data theft. The data stolen is track data and this is the information on the magnetic strip of the card. Swipe your card in a Target magnetic card reader to make your purchase, it is 100% probable your information was stolen. This is pretty bad. Thieves got the customer name, card number, expiration date and even that three digit number on the back, often used for security. It is not clear if the hackers obtained the 4 digit pin used with debit cards and are doing a run on bank accounts. There are many ways hackers can access corporate servers to capture data. Something this large implies Target had a big wide gaping security hole somewhere. Yet initial reports are saying this attack was unique. It was distributed, coordinated theft. Instead of attacking a centralized server, the thieves hacked into each individual Target store. Although the cyber-crime technique is not confirmed, it is believes the actual credit and debt card readers had malicious software programmed right into them. Target has 1,797 stores in the United States, each one having at least 20 card readers. If the software was on the card readers, this might imply not just Target is vulnerable to such an attack.
Service Companies More Insulated From Comparison Shopping - Thanks to smartphone price apps, you might have paid less for gifts this holiday season than you did last year. But, according to Wednesday’s CPI report, shipping them to friends and family will cost you about 6% more than it did in 2012. That highlights the split between goods and service prices, a divergence that is widening thanks to technology. Consumer prices for all goods and services increased 1.2% in the year ended in November. Excluding food and energy, core inflation is running 1.7%. Both inflation rates are below the Federal Reserve‘s target of 2%. Look beyond the headline numbers, however, and you will see two different price trends. Core goods prices are down 0.2% in the year ended in November, while core service prices are up 2.4%. The gap is a function of many long-running forces. Globalization has increased competition among goods producers. Increased productivity has lowered the cost structure for U.S. manufacturers. Monday’s productivity report showed that while unit labor costs for all nonfarm businesses increased 2.1% in the year ended in the third quarter, unit costs for manufacturers slipped 0.2%.
Haircut Deficit: Kids Living in Basements a Drag on U.S. Services Spending - Consumer spending on services -- everything from rents and water bills to health care and haircuts -- is a laggard as the economy has recovered from the worst recession since the Great Depression. Such expenditures adjusted for inflation have risen 6.3 percent since mid-2009, compared with a 34 percent surge in outlays on durable goods such as automobiles and appliances, according to data from the Commerce Department in Washington. Slow services spending is “the culprit behind sluggish growth” of the economy, said Carl Riccadonna, senior U.S. economist at Deutsche Bank Securities Inc. in New York. Outlays have been held back by a slowdown in new household formation and meager wage growth. As young adults stay home with their parents rather than forging out on their own, spending on utilities and amenities such as cable television has languished. Purchases of durable goods have been quicker to recover. Some of the growth is driven by record-low interest rates, supporting auto sales that account for almost a quarter of the increase in spending on long-lasting items. Another contributor is pent-up demand for replacement of aging household goods such as appliances and furniture. Neither force has much effect on purchases of services, which are more likely than durable goods to be paid for in cash.
LA area Port Traffic in November - Container traffic gives us an idea about the volume of goods being exported and imported - and possibly some hints about the trade report for November since LA area ports handle about 40% of the nation's container port traffic.The following graphs are for inbound and outbound traffic at the ports of Los Angeles and Long Beach in TEUs (TEUs: 20-foot equivalent units or 20-foot-long cargo container). To remove the strong seasonal component for inbound traffic, the first graph shows the rolling 12 month average. On a rolling 12 month basis, inbound traffic was up 1.0% compared to the rolling 12 months ending in October. Outbound traffic increased 1.3% compared to 12 months ending in October. In general, inbound traffic has been increasing and outbound traffic had been mostly moving sideways. The 2nd graph is the monthly data (with a strong seasonal pattern for imports). Usually imports peak in the July to October period as retailers import goods for the Christmas holiday, and then decline sharply and bottom in February or March (depending on the timing of the Chinese New Year). Inbound traffic was up 13% compared to November 2012 and outbound traffic was up 17%. This suggests a pickup in trade in November.
Fed: Industrial Production increased 1.1% in November, Above Pre-recession Peak -- From the Fed: Industrial production and Capacity Utilization Industrial production increased 1.1 percent in November after having edged up 0.1 percent in October; output was previously reported to have declined 0.1 percent in October. The gain in November was the largest since November 2012, when production rose 1.3 percent. Manufacturing output increased 0.6 percent in November for its fourth consecutive monthly gain. Production at mines advanced 1.7 percent to more than reverse a decline of 1.5 percent in October. The index for utilities was up 3.9 percent in November, as colder-than-average temperatures boosted demand for heating. At 101.3 percent of its 2007 average, total industrial production was 3.2 percent above its year-earlier level. In November, industrial production surpassed for the first time its pre-recession peak of December 2007 and was 21 percent above its trough of June 2009. Capacity utilization for the industrial sector increased 0.8 percentage point in November to 79.0 percent, a rate 1.2 percentage points below its long-run (1972-2012) average. This graph shows Capacity Utilization. This series is up 12.0 percentage points from the record low set in June 2009 (the series starts in 1967). Capacity utilization at 79.0% is still 1.2 percentage points below its average from 1972 to 2012 and below the pre-recession level of 80.8% in December 2007. The second graph shows industrial production since 1967. Industrial production increased 1.1% in November to 101.3. This is 21% above the recession low, and slightly above the pre-recession peak. The monthly change for both Industrial Production and Capacity Utilization were above expectations. The consensus was for a 0.6% increase in Industrial Production in November, and for Capacity Utilization to be at 78.4%.
An Upside November Surprise In Industrial Activity - Industrial production beat expectations by a hefty degree in today’s November update. Output increased 1.1%, well above most estimates, including The Capital Spectator’s forecast for a modest 0.3% rise. In addition, October’s mild contraction was revised up to a modest gain. Although today’s release is good news for the economy, the trend may not be as strong as the latest monthly change implies. Nonetheless, it’s clear that industrial activity has picked up lately, which suggests that moderate growth in the near term remains a compelling macro prediction. Meantime, it's hard not to be impressed with the latest numbers. Industrial production's 1.1% surge for November is the best rate of monthly growth in a year. The sight of the manufacturing slice of activity inching higher in November only strengthens the case for arguing that the expansion in the industrial sector is widespread. More importantly, the year-over-year numbers show that industrial production’s pace has rebounded in recent months. For the first time since mid-2012, the Fed’s industrial production index has posted annual rates of growth above 3% for three months running. The deceleration that afflicted this indicator in the first half of this year (the low point was this past July’s dip to a mere 1.5% gain over the year-earlier month) has since given way to a substantially stronger set of comparisons.
Industrial Production Surges Due To Cold Weather Boost For Utility Demand - Stocks are un-surging on the "good" news in the headline beats for Industrial Production (biggest jump and biggest beat in 13 months) and Capacity Utilization (best since June 08). However, as is always the case, the underlying data hides some less than positive signs. The bulk of the gains in production were from Utilities (+3.9%) as colder-than-expected temperatures boosted demand (the same temps that retailers are crying about). Manufacturing output remains 3.6% below its pre-recession peak (though gains were broad-based). From the report: Industrial production increased 1.1 percent in November after having edged up 0.1 percent in October; output was previously reported to have declined 0.1 percent in October. The gain in November was the largest since November 2012, when production rose 1.3 percent. Manufacturing output increased 0.6 percent in November for its fourth consecutive monthly gain. Production at mines advanced 1.7 percent to more than reverse a decline of 1.5 percent in October. The index for utilities was up 3.9 percent in November, as colder-than-average temperatures boosted demand for heating. At 101.3 percent of its 2007 average, total industrial production was 3.2 percent above its year-earlier level. In November, industrial production surpassed for the first time its pre-recession peak of December 2007 and was 21 percent above its trough of June 2009.
The Big Four Economic Indicators: Industrial Production Surprises to the Upside -- Today's release of Industrial Production for November was a pleasant surprise to the upside, including an upward revision to October. The total index, according to the Fed economists "increased 1.1 percent in November after having edged up 0.1 percent in October; output was previously reported to have declined 0.1 percent in October." The November total index number more than doubled the Investing.com forecast of a 0.5% rise. Moreover, as today's report explains: "In November, industrial production surpassed for the first time its pre-recession peak of December 2007 and was 21 percent above its trough of June 2009. Capacity utilization for the industrial sector increased 0.8 percentage point in November to 79.0 percent, a rate 1.2 percentage points below its long-run (1972-2012) average." Industrial Production now becomes the second of the Big Four, along with Real Retail Sales, to set a new all-time high. The chart and table below illustrate the performance of the Big Four and simple average of the four since the end of the Great Recession. The data points show the percent cumulative percent change from a zero starting point for June 2009. The latest data point is for the 53rd month. In addition to the four indicators, I've included an average of the four, which, as we can see, was influenced by the anomaly in the Personal Income tax management strategy at the end of last year with a ripple effect in the opening months of this year.
Highlights from today’s report on industrial production: Durable manufacturing, autos and oil/gas extraction -- A few highlights from today’s Federal Reserve report on Industrial Production (data here):
- 1. Durable manufacturing increased by 4.5% from a year ago, and reached a new all-time high in November (see red line in top chart above).
- 2. Production of motor vehicles and parts also reached a new record high in November, with a 7.5% increase from last November (see blue line in top chart above).
- 3. Oil and gas extraction activity increased by 8.7% year-over-year and reached the highest level since the Fed started reported these data in 1972.
Bottom Line: The durable manufacturing sector of the US economy has made a complete recovery from the Great Recession, with current factory output levels above the pre-recession peak by 3.4%. Leading the recovery in durable manufacturing is the auto sector, with production levels now at all-time highs and above the pre-recession peaks by almost 7%. The shining star of the US economy remains the oil and gas sector, and extraction activity in that sector – thanks to the revolutionary technologies that are tapping oceans of previously inaccessible shale oil and gas –
Vital Signs: Manufacturing’s Long Climb - Manufacturing has clearly picked up in recent months. The manufacturing subindex of the Federal Reserve‘s industrial production report was 0.6% higher in November from the previous month and up 2.9% from a year earlier. But even amid the steady progress from the depths of the recession, the manufacturing sector still hasn’t fully recovered. The Fed factory gauge still remains 3.6% below its prerecession peak.
NY Fed: Empire State Manufacturing Activity "flat" in December -- From the NY Fed: Empire State Manufacturing Survey The December 2013 Empire State Manufacturing Survey indicates that manufacturing conditions were flat for New York manufacturers. The general business conditions index rose three points but, at 1.0, indicated that activity changed little over the month. The new orders index inched up, but remained negative at -3.5 ... Labor market conditions remained weak, with the index for number of employees holding at 0.0 for a second month in a row and the average workweek index dropping six points to -10.8. Indexes for the six-month outlook generally conveyed a fair degree of optimism about future conditions ... This is the first of the regional surveys for December. The general business conditions index was below the consensus forecast of a reading of 4.5, and shows little expansion.
Empire State Manufacturing Disappoints Expectations - This morning we got the latest Empire State Manufacturing Survey. The diffusion index for General Business Conditions disappointed expectations, posting a reading of 0.98, up from -2.21 last month, but below expectations. The Investing.com forecast was for 4.75. As Investing.com points out, "The Empire State Manufacturing Index rates the relative level of general business conditions New York state. A level above 0.0 indicates improving conditions, below indicates worsening conditions. The reading is compiled from a survey of about 200 manufacturers in New York state." Here is the opening paragraph from the report.The December 2013 Empire State Manufacturing Survey indicates that manufacturing conditions were flat for New York manufacturers. The general business conditions index rose three points but, at 1.0, indicated that activity changed little over the month. The new orders index inched up, but remained negative at -3.5, while the shipments index rose to 7.7. The unfilled orders index fell to -24.1, and the inventories index declined twenty points to -21.7; both indexes reached their lowest levels since 2009. The prices paid index was little changed at 15.7, and the prices received index climbed to 3.6. Labor market conditions remained weak, with the index for number of employees holding at 0.0 for a second month in a row and the average workweek index dropping six points to -10.8. Indexes for the six-month outlook generally conveyed a fair degree of optimism about future conditions, though to a lesser extent than in the November survey. Here is a chart illustrating both the General Business Conditions and Future General Business Conditions (the outlook six months ahead):
Brazil Snubs U.S.-Based Boeing In Retaliation For NSA Spying - Brazil has picked the Swedish aerospace company Saab to replace its aging fleet of fighter jets, after U.S. spying reportedly upset American-headquartered Boeing’s chances of winning the coveted deal. Defense Minister Celso Amorim said that the decision “took into account performance, the effective transfer of technology and costs,” but an anonymous government source told Reuters that “the NSA problem ruined it for the Americans.” In November, the U.S. technology firm Cisco Systems complained that the American spying had decreased demand for its products in China. The Brazilian fighter jet contract, worth $4.5 billion, has been negotiated over the course of three presidencies. France’s Dassault Aviation had also been in the running.
Chinese investors 'buying' US green cards for $1m -- As the US debates how to reform its immigration system - and deal with roughly 11 million undocumented immigrants living in the country - wealthy foreigners already have a legal route to a new life in America. A visa programme called EB-5 offers overseas investors the opportunity to get permanent residence - a green card - in return for $1m (£614,000). In areas with high unemployment, the visas are available for a $500,000 investment. The visas have been available since the 1990s, when Europeans were the main beneficiaries. But today Chinese citizens represent a majority of the applicants. While critics complain about foreigners "buying" their way into the US, the scheme's supporters told the BBC that the developers fund projects that create jobs in America.
U.S. Worker Output Rises at Best Pace in 4 Years - U.S. workers boosted their productivity from July through September at the fastest pace since the end of 2009, adding to signs of stronger economic growth.The Labor Department said Monday that productivity increased at a 3 percent annual rate in the third quarter. That’s up from an initial estimate of 1.9 percent and much stronger than the 1.8 percent rate from April through June. Productivity rose because economic growth was much stronger than previously estimated in the third quarter. Productivity is the amount of output per hour of work. Labor costs fell in the third quarter, evidence that inflation will remain low. Higher productivity enables companies to pay employees more without sparking inflation. But greater productivity can also slow hiring if it shows companies don’t need more workers to boost output. However, productivity growth has been mostly flat over the past year. That’s because the gains from the past six months have been offset by declines in previous six months. Worker productivity is improving along with economic growth. Hiring has accelerated since the summer and wages are gradually rising. The economy grew a 3.6 percent annual rate in the third quarter, much faster than the 2.8 percent rate previously estimated.
Labor Productivity Soars While Real Wages Languish in Q3 2013 -- The BLS Productivity & Costs report for Q3 2013 shows labor productivity increased a whopping annualized 3.0%. This is the largest increase in productivity since Q4 2009. Output increased 4.7% and hours worked increased 1.7%. Unit Labor costs dropped by -1.4% in Q3 2013. The reason labor productivity surged was increased economic output while worker hours did not increase as much. Below is a graph of the quarterly change in labor productivity. The basic equation for labor productivity is: Q/L, where Q is the total output of industry and L stands for labor. Output can be thought of what is produced from the fruits of labor. Examples would be the cars which come off the assembly line and burgers & fries being served up at McDonald's. Here is the BLS labor productivity formula: Labor productivity is calculated by dividing an index of real output by an index of the combined hours worked of all persons, including employees, proprietors, and unpaid family workers. L, or Labor, is measured in hours only. Nonfarm Business Output directly correlates to real GDP, minus the government, farms,all of those nonprofits and our infamous, often illegal nannies and gardeners, and equivalent rent of owner occupied properties. The output, or Q, is about 74% of real GDP reported. Farms, if you can believe this, only represent about 1% of output. Labor productivity is reported as annualized figures and both indexes are normalized to the year 2009. The main productivity numbers above are all business, no farms, where labor costs have a high ratio, about 60%, to output. These productivity statistics are referred to as nonfarm business.From Q3 2012, a year ago, annual productivity increased 0.3%, output increased 2.1%, and hours worked rose by 1.8%. Changes from a year ago show a little less worker squeeze in terms of hours worked. Labor productivity changes from a year ago is shown in the below graph.
Productivity growth rises to four-year high. Wages don’t -- The Department of Labor reported Monday that productivity in the nonfarm sector of the economy rose at an annualized 3.0 percent in the third quarter. Reuters reports: Productivity rose at a 3.0 percent annual rate after increasing at a 1.8 percent pace in the second quarter, the Labor Department said on Monday, driven by a 4.7 percent rise in output. [...] Unit labor costs—a gauge of the labor-related cost for any given unit of output—fell at a 1.4 percent rate in the third quarter, roughly double the originally estimated fall, underscoring the lack of wage-related inflation pressures in the economy. Unit labor costs had risen at a 2.0 percent pace in the second quarter.There is another way to label that lack of wage-related inflation. It translates, as it has for more than three decades, into wage stagnation. As we've seen for the past 35 years, productivity gains have, to put it mildly, not been equally shared. Since the turn of the twenty-first century, growth in wages has been flat. And that's been worse recently. The real (inflation-adjusted) median wage as measured by the Census is nearly $1,000 less than it was in 2007. Lawrence Mishel and Heidi Shierholz noted recently:
- • According to every major data source, the vast majority of U.S. workers—including white-collar and blue-collar workers and those with and without a college degree—have endured more than a decade of wage stagnation. Wage growth has significantly underperformed productivity growth regardless of occupation, gender, race/ethnicity, or education level.
- • The weak wage growth over 2000–2007, combined with the wage losses for most workers from 2007 to 2012, mean that between 2000 and 2012, wages were flat or declined for the entire bottom 60 percent of the wage distribution (despite productivity growing by nearly 25 percent over this period).
- • For virtually the entire period since 1979 (with the one exception being the strong wage growth of the late 1990s), wage growth for most workers has been weak.
Fed Study Shows Drop in Participation Rate Explained by Retirement; Let's Explore that Idea, in Depth and in Pictures -- A November Fed study on the Causes of Declines in the Labor Force Participation Rate by Shigeru Fujita at the Federal Reserve Bank of Philadelphia concludes "The decline in the participation rate in the last one-and-a-half years (when the unemployment rate declined faster than expected) is entirely due to retirement." Fujita based that statement on BLS surveys that look at the underlying reasons people give for nonparticipation. The CPS divides nonparticipants into three broad categories: disabled, retired, and others. The last category includes nonparticipation due to “discouragement.” Based on respondents' reasons for nonparticipation, weighted by age group, Fujita produced this chart (trendlines in red by me).I do not doubt for one second the chart represents responses given to the BLS. But is there any evidence the answers given to the BLS are correct? Let’s explore the question in a series of step-by-step charts. First a chart by Doug Short at Advisor Perspectives that shows participation rates of various age groups. Interestingly, the biggest decline in labor force in percentage terms is in the 50-54 group. However, that is not conclusive. Because older workers’ participation rates are lower, the increase in the share of old workers by itself pushes down the aggregate participation rate. To determine what is really happening, we need to look at age-group weighted effects on the participation rate. . By multiplying the age group population % by the age group participation rate, we can calculate contributions to the overall participation rate. The next chart does that. Does that prove or disprove the Fed thesis? The answer is neither. Looking at participation rates (percentages) in isolation cannot address the question. Because of demographic shifts, we need to look at the hard numbers, specifically the growth (or decline) in labor force relative to the growth (or decline) in population. IHere are the results.The decline in labor force relative to the growth in population is heavily concentrated in the 65 and older demographic. This is proof that the analysis by the Fed is indeed reasonable. A rally in the stock market is one possible reason. Also, there may may be a lot of teachers, police officers, and firefighters who just put in their required number of years to be eligeble to collect their pensions.
Accurate reporting - Lifted from an e-mail from Daniel Becker: Compare Fujita’s conclusion from the Fed paper, here http://philadelphiafed.org/research-and-data/publications/research-rap/2013/on-the-causes-of-declines-in-the-labor-force-participation-rate.pdf#page=7, with da Costa’s description in the WSJ. da Costa, “Philly Fed economist Shigeru Fujita argues that the shrinking of the U.S. workforce over the past year and half was “entirely due to retirement” of baby boomers.” http://blogs.wsj.com/economics/2013/12/09/work-force-is-shrinking-because-of-retiring-boomers-philly-fed-paper-argues/ Apparently what Fujita concludes has gotten lost in da Costa’s translation, and both writings are in English. The WSJ staff don’t concern themselves with that. A word, phrase or sentence left out here and there can significantly change the originals author’s meaning and the details presented in the body of the original report are wholly misrepresented. That’s what slanted media can do to the public’s understanding of issues, especially when the data being presented is complex and a bit arcane in a layman’s vernacular. Fujita’s conclusion: Lastly, unfortunately, I could not pin down an underlying cause of the increase in
nonparticipation among those who do not want a job. This appears to be an important area for future research.
Labor Force Participation Rates Revisited - Atlanta Fed's macroblog - In an earlier macroblog post, our colleague Julie Hotchkiss examined the decline in labor force participation from the onset of the Great Recession into early 2012, concluding that cyclical factors likely accounted for most of the drop. In this post, we examine how labor force participation has changed since the start of 2012 (and admittedly, we’re much less ambitious in our analysis than Julie). Motivating our analysis, in part, is the observation that much of the recent decline in the labor force participation rate (LFPR) is related to rising retirements (see the November 19 Research Rap by Shigeru Fujita). This is not surprising, as the percentage of individuals aged 65 and older in the population has been increasing sharply over the last half decade. That said, our approach indicates that the LFPR of prime-age workers (ages 25–54) continues to fall, and this is an important source of the overall decline in LFPR in the recent data. Such declines in LFPR in these age categories should be less related to retirement decisions, keeping on the table the possibility that a weak overall labor market remains a key drag on labor force participation. A straightforward decomposition illustrates that the decline in LFPR among prime-age workers is a major contributor to the overall decline in LFPR. To see this, we separate the change in LFPR into three components: one that measures the change due to shifts in the LFPR within age groups—the within effect; one that measures changes due to population shifts across age groups—the between effect; and one that allows for correlation across the two effects—a covariance term. It works out the covariance term is always very close to zero, so we will omit discussion of that term here. The analysis breaks the data down into five age groups: 16–24, 25–34, 35–44, 45–54, and 55+. The chart presents the decomposition from Q1 2012 to Q3 2013. Over this period, the overall LFPR declined by half a percentage point, from 63.8 percent to 63.3 percent. The blue areas represent the change due to within-age-group effects, and the green areas represent the change due to between-age-group effects. The sum of the bars is equal to the overall change in labor force participation.
Another look at labor force participation - DB's chart of the US unemployment rate (below) received numerous comments on Twitter. Clearly the projection of the linear decline continuing at the same rate is a bit aggressive. But many of the comments were dismissive of the measure altogether - arguing that these falling unemployment levels are not that meaningful in the face of the declining labor participation rate.There is no question that labor force participation in the US has been falling as more people drop out of the workforce. But that measure could be misleading because as the population ages, the workforce will shrink naturally. For example Canada is also experiencing declines in its headline labor force participation rate. But when adjusted for aging, its labor force participation is actually growing (see chart). Perhaps a better measure to use here is the so-called "activity rate" which is often used by OECD researchers to compare labor markets across different countries. It is defined as "the active population (employed plus unemployed) divided by the working age population." In other words, what proportion of the "working age" population is either working or is officially listed as unemployed. A decline in that rate would indicate "working-age" people leaving the workforce. And as the next chart shows, that is indeed the case. This tells us that about 3.5% of the working-age population has left the labor force since the start of the Great Recession. Should those people be also counted as unemployed? If so, here is what the unemployment rate trend would look like:
Why slowing US labor force growth is bad for US economic growth - Recall this bit from the recent Obama budget: In the 21st Century, real GDP growth in the United States is likely to be permanently slower than it was in earlier eras because of a slowdown in labor force growth initially due to the retirement of the post-World War II baby boom generation, and later due to a decline in the growth of the working age population. That gloomy prediction is reinforced by this new BLS analysis:Projections of the labor force and the aggregate economy serve as the basis for employment projections. Slower projected growth in the civilian noninstitutional population and declining labor force participation rates limit growth in the labor force, which in turn limits economic growth.The labor force is projected to grow 0.5 percent per year from 2012 to 2022, compared with an annual growth rate of 0.7 percent during the 2002-12 decade. Due to the aging baby-boom generation, workers ages 55 and older are expected to make up over one-quarter of the labor force in 2022.Projected declines in the labor force participation rates for both men and women are expected to slow labor force growth. The overall labor force participation rate is projected to decline from 63.7 percent in 2012 to 61.6 percent in 2022, continuing the trend from the past decade.–Slower labor force growth is expected to limit potential economic growth. Gross domestic product (GDP) is projected to increase by 2.6 percent annually from 2012 to 2022, slower than the 3 percent or higher rate often posted from the mid-1990s through mid-2000s.
Most Labor-Force Dropouts Will Return, New Paper Argues -- Americans who’ve left the labor force over the course of the Great Recession will almost certainly return to work as the job market continues to improve, according to a new paper released by the International Monetary Fund. The research paper, written by Federal Reserve economists Christopher Erceg and Andrew Leven, takes stock of the sharp decline in the U.S. labor force participation rate — the share of adults holding or seeking jobs — since the 2008 financial crisis. At 63% currently, the rate is around levels last seen in the late 1970s, calling into question whether the recent drop in the unemployment rate is really telling a story of a labor market on the mend.The U.S. jobless rate dropped from a peak of 10% in October 2009 to 7% in November. On the face of it, that’s a welcome move in the right direction, even though the rate remains historically high.The problem is that part of the decline is due to people dropping out of people from the labor force, which means they are no longer counted as unemployed. While the retirement of baby boomers naturally means declining job market participation rates, many economists have worried that the decline largely reflects would-be workers who have stopped looking for work. The paper suggests that many people who left the labor force will return as the economy grows. But the process will be slow. “Labor force participation may remain well below trend even as the economy begins recovery and the unemployment gap closes,” the paper said.
Number of the Week: Fewer Than Half of Young People Will Be in Work Force -- 49.6%: Share of American 16-24 year-old that will be working or looking for work in 2022, down from 66.1% in 1992, according to the Labor Department. It has been a rough few years, to say the least, for America’s young people. The unemployment rate for 16-24 year-olds neared 20% during the recession, and remains a brutal 14.1% even after four and a half years of economic recovery. Less than half of Americans under 25 were working in November; less than a quarter were working full-time. Economists now speak openly about the prospects of a “lost generation” of American youth. But the labor-market challenges facing young Americans go beyond the anemic economic recovery. There are also longer-term forces at work — forces that new projections released this week suggest will continue. All told, the youth participation rate fell from 66.1% in 1992 to 63.3% in 2002 to 54.9% in 2012. By 2022, labor department economists predict the rate will fall to 49.6% — in other words, more than half of young people will be neither employed nor unemployed. They will be out of the labor force entirely. It isn’t just that more young people are going to school, however. They’re also working less when they’re there. The employment rate among enrolled students fell to 38% in 2007, the prerecession peak, from 43% in 1990. And among teens, employment rates are near an all-time low. Meanwhile, young people face increasing competition for jobs from a perhaps unlikely source: Grandma and Grampa. The combination of better medical care and worsening retirement benefits in recent decades mean that Americans are working longer. As we noted earlier this year, a decade ago, a 16- or 17-year-old boy was twice as likely to have a job as his 70-year-old grandfather. Today, the grandfather is actually more likely to have a job than the boy.
Weekly Initial Unemployment Claims increase to 379,000 -- The DOL reports: In the week ending December 14, the advance figure for seasonally adjusted initial claims was 379,000, an increase of 10,000 from the previous week's figure of 369,000. The 4-week moving average was 343,500, an increase of 13,250 from the previous week's revised average of 330,250. The previous week was revised up from 368,000. The following graph shows the 4-week moving average of weekly claims since January 2000.
New Jobless Claims at 379K, Much Worse Than Forecast - The Unemployment Insurance Weekly Claims Report was released this morning for last week. The 379,000 new claims number was a 10,000 increase from the previous week's 369,000, a slight upward revision from 368,000. The less volatile and closely watched four-week moving average, which is usually a better indicator of the trend, rose by 13,250 to 343,500. Today's poor report is certainly not welcome news after yesterday's taper announcement from the Fed. Here is the opening of the official statement from the Department of Labor:In the week ending December 14, the advance figure for seasonally adjusted initial claims was 379,000, an increase of 10,000 from the previous week's figure of 369,000. The 4-week moving average was 343,500, an increase of 13,250 from the previous week's revised average of 330,250. The advance seasonally adjusted insured unemployment rate was 2.2 percent for the week ending December 7, an increase of 0.1 percentage point from the prior week's unrevised rate. The advance number for seasonally adjusted insured unemployment during the week ending December 7 was 2,884,000, an increase of 94,000 from the preceding week's revised level of 2,790,000. The 4-week moving average was 2,799,000, an increase of 4,250 from the preceding week's revised average of 2,794,750. Today's seasonally adjusted number was substantially higher than the Investing.com forecast of 334K.Here is a close look at the data over the past few years (with a callout for the past year), which gives a clearer sense of the overall trend in relation to the last recession and the volatility in recent months
Vital Signs: Jobless Claims Look Unreasonably Adjusted -- Once again, forecasters missed the direction in jobless claims: filing for unemployment benefits unexpectedly rose 10,000 last week after jumping a surprisingly large 64,000 gain in the previous week. But the increase in claims may not be signaling a worsening in labor markets. Forecasters point to the difficulty in seasonally adjusting weekly data this time of year. Even the Labor Department cites problems with seasonal adjustments.Why the challenge? Holidays don’t land in the same week every year. Thanksgiving, for instance, was in the 47th week of 2012, but the 48th week 48 of this year. Extreme weather events that dampen economic activity during one week can also influence the calculation of the following year’s seasonal factors. The seasonal factors for the rest of December and January are above 100, indicating a larger-than-average number of workers file claims this time of year. That’s not surprising since many companies lay off workers in December to book the cost of severance, etc. before year’s end. But the adjusted trend in filings will also be skewed by three upcoming federal holidays: Christmas, New Year’s Day and Martin Luther King Day. That means economy-watchers will have to wait until late January to get a true read on jobless claims. That’s the same time the Federal Reserve has scheduled its next policy meeting.
Congress Failing on Job Growth - Lawmakers are in a knot over everything from the Affordable Care Act to finding a rare congressional kumbaya moment for a budget deal. But perhaps you haven’t noticed—it seems as if the last thing anyone in Washington, D.C., wants to talk about is employment. That’s fairly strange, considering it’s still rather rough out there as far as job markets go. The general public feels the same way. Not that this should be a preferred pathway to quality living, but one suspects that if given a choice, most individuals would naturally gravitate to being employed over having health care. The latter typically gets prioritized once you make sure you have the ability to clothe, feed and house yourself. A recent United Technologies-National Journal poll discovered the obvious: Most Americans, 3-to-1, would rather Congress get to the business of boosting job growth. A majority in a later UT-NJ poll engaged in a bit of wishful thinking, with 56 percent confident that Washington would pass a jobs creation bill. On average, more than 64 percent of respondents to a YouGov poll said everyone in Washington—White House, Republicans and Democrats—should be doing more about the jobs situation. Still, Congress seems more obsessed with balancing budgets, eliminating deficits and fixing broken websites than creating jobs.
The New American - College Educated, Working Four Jobs and Broke - Is this the new America? Forbes profiled one guy in the heartland of America and look at this, he is college educated, able, working a ridiculous number of jobs and has no money. Bingham is 37 years old and has a college degree, but like many Americans, is stuck working many hours in low wage, part-time jobs. Each week, he works a total of about 60 hours in his jobs as a massage therapist, a waiter at a Mexican restaurant, a delivery man for sandwich chain Jimmy John's and a receptionist at his massage school He brings home about $400 a week, or $20,000 per year. They posted Bingham's work schedule and look at the insanity of this. Imagine just trying to get to each job and schedule those hours. Notice the low restaurant wage. These jobs are one of few where it is perfectly legal to pay below minimum wage by claiming workers make up the difference in tips. The food industry lobbyists have worked very hard to keep this exemption from federal minimum wage laws and is a huge reason restaurant work pays so low.
- - 24 hours waiting tables at Mexican restaurant Taco Republic. He makes tips plus $2.13, which is the federal minimum wage for tipped employees, like waiters.
- -30 hours delivering sandwiches for Jimmy John's, which pays him $7.35 an hour, plus tips.
- -3 one-hour massages, for a total of $60.
- -9 hours as a receptionist at his former massage school. (The amount of money he makes working at the school isn't included in his $400 weekly pay, since it goes directly to repay $9,500 worth of student loans.)
There are an estimated 7.7 million people stuck in part-time work because that's all they can get. or they got their hours cut due to not enough business. That's an increase of approximately three million people since before the great recession of 2008. Welcome to the new America.
Slate Tries Presenting Amazon’s Abusive Warehouse Jobs as Great Opportunities - Yves Smith - A mere day after strikes at Amazon warehouses in Germany, which caught the attention of the media in the US, Slate ran as its lead piece in Moneybox an article that bears all the hallmarks of being a PR plant: Amazon Warehouses Are the New Factories. I suspect the author, Emma Roller, wouldn’t recognize a factory if it fell on her. This piece is Dr. Pangloss meets neoliberalism. We are supposed to celebrate that blue collar workers can find employment at Amazon! And in a stunning display of fair and balanced reporting, there’s nary a mention of charges of abusive working conditions, intrusive surveillance, and unreasonable demands for worker output in the US, UK, and Germany. While factory work is certainly not glamorous, except in the really horrible settings like meatpacking plants (subject to frequent fines for OSHA violations; workers get repetitive stress injuries), the working conditions in factories beat those in Amazon warehouses, hands down. You’ll also notice how this Amazon puff piece averts its eyes from the working conditions in Amazon warehouses. The Los Angeles Times reported 100 degree temperatures and firings of injured workers in an Amazon warehouse in Allentown in 2011; the Seattle Times mentioned similar complaints about warehouses in Kentucky. While Amazon was embarrassed into providing more air conditioners, it appears it is doing only the bare minimum, and then only in response to media pressure.
Poverty nation: How America created a low-wage work swamp - Americans notoriously hate welfare, unless it’s called something else and/or benefits us personally. We think it’s for slackers and moochers and people who won’t pull their weight. So we’re not sure how to handle the fact that a quarter of people who have jobs today make so little money that they also receive some form of public assistance, or welfare – a proportion that’s much higher in some of the fastest growing sectors of the workforce. Or that 60 percent of able-bodied adult food-stamp recipients are employed. Fully 52 percent of fast-food workers’ families receive public assistance – most of it coming from Medicaid, food stamps and the Earned Income Tax Credit — to the tune of $7 billion annually, according to new research from the University of California-Berkeley’s Labor Center and the University of Illinois. McDonald’s workers alone receive $1.2 billion in public aid, the study found. This is an industry, by the way, that last year earned $7.44 billion in profits, paid their top execs $52.7 million and distributed $7.7 billion in dividends and stock buyback. Still, “public benefits receipt is the rule, rather than the exception, for this workforce,” the study concluded. Then there’s Wal-Mart, which as Salon recently reported, boasted to a Goldman Sachs conference that “over 475K” of its 1.3 million workers make more than $25,000 a year – which lets us infer that almost 60 percent make less. Democrats on the House Committee on Education and the Workforce estimated that the giant low-cost retail chain benefits from many billions in public-assistance funding; one Wisconsin “superstore” costs taxpayers at least $1 million a year in public assistance to workers’ families. Remember, too, that six members of the Walton family own as much wealth as 48 million Americans combined.
Congressional Scrooges Deny Unemployment Benefit Extension -- The latest budget deal does not extend unemployment benefits for some of the long term unemployed. This means without some Congressional action, unemployment benefits will only be available for 26 weeks in 2014. The current average time to be officially unemployed is 37.2 weeks, far exceeding the time one can receive regular unemployment insurance benefits in most states. Congress of course is off to enjoy their Christmas while 1.3 million people are kicked off the unemployment benefit rolls on December 28th. The 113th Congressional session is scheduled to end December 20th, so off they go to their million dollar homes and warm yuletide fires while 1.3 million more people are kicked to the curb. There are over four million official unemployed who have been so over 27 weeks. President Obama has given any possible extension the kiss of death by making a speech about it as we know Congress loves to ignore what the President wants. This time Obama is right, this is a terrible holiday message. Ho, ho, ho, out into the street you go! The Congressional Christmas gift is to deny unemployment benefits to approximately 1.3 million recipients immediately and cut off another 3.6 million recipients by the end of 2014, America gets an additional lump of coal as refusal to extend benefits will have a negative economic impact on the overall economy as well. The White House at least is strong on making their case, they released a white paper full of facts and figures to prove helping the long-term unemployed is good for America. The emergency unemployment compensation program was enacted in 2008 and extended unemployment up to 73 weeks. Below is a map of current total unemployment benefit weeks and all of this is about to disappear for 2014. Think about that fact while contemplating the official unemployed has remained at amazingly high levels. There are about 11 million official unemployed and this figure has remained static for some time. Beyond the official tally, there are millions more potential American workers who have dropped out of the count and not even considered in the official unemployment statistics. Hiring in America has only increased 24% since the height of the Great Recession, now over four years ago.
Unemployment Benefits Are Ending for 1.3 Million Americans. What's That All About? - On December 28, 1.3 million people will lose their unemployment insurance. That's because Congress failed to add an extension of those benefits into the budget deal that will likely pass the Senate this week. Here is some background: Who is losing unemployment benefits? The long-term unemployed. After state unemployment benefits run out—usually after 26 weeks—federal emergency unemployment benefits kick in for up to another 47 weeks. Since Congress didn't renew the program, 1.3 million Americans will be kicked off benefits, which average $1,166 per month. By the end of 2014, another 3.6 million will lose their benefits. Why are they called emergency benefits? In 2008, under President George W. Bush, Congress authorized emergency unemployment compensation to help the jobless cope with the recession, giving workers a total of 59 weeks of unemployment compensation. A year later, President Barack Obama signed a law giving the unemployed 14 more weeks of jobless benefits. At the height of the recession, Americans could get up to 99 weeks of unemployment pay. That number has since dipped to a maximum of 73 weeks. This is the first time since 2008 that Congress hasn't extended the program. Under another federal program initiated by President Richard Nixon, Americans can still get an extra 13 weeks of benefits if the unemployment rate in their state is high enough. (This threshold varies by state).
The one chart that shows why ending emergency unemployment benefits is a bad idea -- AEI’s Michael Strain: We shouldn’t let emergency federal benefits expire because the same fundamental logic that led to their being (correctly) enacted still holds today: The labor market is still in bad shape, the economy is still weak, there are three times as many unemployed workers as job openings. Simply put, as the chart above shows, it’s much harder for the long-term unemployed to find a job right now than it has been in the past when emergency federal benefits were allowed to expire. OK, I lied. Here is a second chart: Again, why would ending these benefits be a good idea (a) during perhaps the weakest economic recovery, both in terms of GDP and job growth in American history, and (b) at a time when technology may be radically changing the nature of work in America? Beyond that, Washington needs to push an agenda to get the long-term jobless working, ASAP.
White House Backs 3-Month Extension of Long-Term Jobless Benefits - The White House is backing a bipartisan proposal in the Senate to temporarily extend emergency unemployment benefits, with plans to mount a public campaign in coming weeks to gain support for the measure. White House Senior Adviser Valerie Jarrett said Wednesday that President Barack Obama would sign legislation proposed by Sen. Jack Reed (D., R.I.) and Sen. Dean Heller (R., Nev.) that would extend for three months the benefits for the long-term unemployed that expire at the end of the year. “We strongly support it and we think it will be bipartisan,” Ms. Jarrett said in an interview with Politico, predicting it will pass the House and Senate. “We’re hopeful that over the course of the next few weeks we’ll galvanize support for it,” Ms. Jarrett added. Senate Majority Leader Harry Reid (D., Nev.) has said he plans to make extending unemployment benefits the first order of business next year. As it stands, more than 1.3 million long-term unemployed people will lose jobless benefits at the end of the year. Messrs. Reed and Heller have proposed a bill designed to give Congress three months to come up with a long-term plan for unemployment benefits. One sticking point: The proposal doesn’t identify how lawmakers would pay for the extension; in the past, lawmakers have agreed to extend the program without specific revenues or savings to pay for it.
Unemployed Americans Speak Out as Benefits are Slashed at Christmas - Three days after Christmas this year, 1.3 million laid-off American workers will see their unemployment benefits stopped. In Pennsylvania, the number will be 87,000 people drawing their last check December 28. These are working people caught in the worst economic crisis in more than 70 years, one that will not end. Unemployment is still officially 7.0 percent - with nearly 11 million people officially unemployed and millions more out of the labor force or working part time despite wanting full-time jobs.
- "One of the hardest things I have ever had to do is sit my two kids down and tell them there might not be a Christmas this year." 40-year-old unemployed father from Eubanks, Kentucky
- If my wife loses her benefit before she finds a job, we lose our house." Philadelphia resident
- "Really need the EUC extended. I already tapped into my annuity last year and need to provide for my family. I work hard and long hours most of the time. Please help!" Laid-off father from York, Pennsylvania
- "I can't find work. I have been paying taxes for 35 years and demand an extension." Worker from Scranton, Pennsylvania
- "I am a single mother of four and was laid off almost six months ago. I have applied to at least four jobs a week every week and still haven't found a job that will support my family. I have a college degree and have always worked, till I was laid off, and will now have no choice but to turn to welfare if benefits are not extended. Please help!" Mother from Lincoln, Rhode Island
Without Unemployment Extension, Which States Would Be Hit Hardest? -- Unemployed Americans will likely see jobless benefits shrink next year, a casualty of Washington’s budget battles and a slowly improving economy. About 1.37 million people nationwide received emergency unemployment compensation at the end of November. That program, which provides an average of $300 a week in benefits to unemployed people once they exhaust their state benefits, is set to expire Dec. 28. Lawmakers didn’t include an extension of the program in a deal to set spending levels for the next two years. The budget agreement cleared Congress Wednesday. Democrats still want to renew the program, initiated at the height of the recession, and hope to revive it. But many Republicans oppose another round of extended benefits, noting the $26 billion price tag and potential incentive for people to continue receiving benefits rather than accept a new job. Some economists expect people to drop out of the workforce once they stop receiving a weekly check from the government, a development that could cause the unemployment rate to fall even if the economy isn’t adding many jobs. Emergency unemployment compensation can cover an additional 47 weeks of benefits in the worst-off states, bringing total coverage up to 73 weeks, according to a tabulation by the Center on Budget and Policy Priorities. New Jersey and Massachusetts will be among the hardest-hit states once the program ends.
Washington Points Fingers as Extra Jobless Benefits Run Out -- A top White House economic adviser chastised the House of Representatives on Friday for leaving town without extending emergency jobless benefits, just days before the aid for some 1.3 million long-term unemployed Americans is set to expire. White House National Economic Council Director Gene Sperling, in a conference call with reporters, said lawmakers should take up the matter immediately when they return in January. The benefits are largely set to run out on Dec. 28. “We have never as a country cut off emergency unemployment benefits when we’ve had this degree of long-term unemployment,” Mr. Sperling said. “It would be unprecedented and it would be insensitive to the struggles and the needs of these families.” Emergency jobless benefits were created five years ago to continue aid people who have exhausted their standard unemployment benefits, which tend to run for six months. They average roughly $350 a week. The jobless rate has fallen slowly from its October 2009 high of 10%, to 7% in November 2013. With the economy picking up steam and the stock market at record levels, many economists believe the jobless rate will continue falling in 2014. A number of Republicans have said they were open to extending the benefits, but they wanted the White House to craft proposals to offset the expected $25 billion annual cost. House Speaker John Boehner (R., Ohio) recently said he was happy to look at any plan from the White House, but Mr. Sperling said Friday that “We have had a plan and we have made clear that there is a plan – we believe that this should have been extended for 2014.”
North Carolina Shows How to Crush the Unemployed - The U.S. is about to cut the maximum duration of public support for the unemployed. The federal extension of unemployment insurance expires on Jan. 1. To see the consequences, look at North Carolina. I’ve been watching the state since July, when it cut the maximum length of benefit from 99 weeks to just 19, and reduced the weekly check from $535 to $350. Across the country, the unemployed will lose from 14 to 47 weeks of insurance when the extension ends. Five other states will join North Carolina in providing fewer than 26 weeks of payments -- the standard in the U.S until this year. What’s happened in North Carolina since July is an indication of what will happen nationwide. The picture is troubling. As intended, presumably, the number of North Carolinians receiving unemployment benefits has collapsed. It’s down by 45,000, or 40 percent, since last year. Expiring benefits aren’t the only reason for this. Far fewer are filing a claim in the first place. Initial claims are running at about half last year's rate. Unemployment insurance is a thinner safety net than it has been in decades. In addition, North Carolina’s labor force began to shrink. The state is experiencing the largest labor-force contraction it's ever seen -- 77,000 fewer people were working or searching for work this October than a year ago. This should, but won’t, settle a partisan debate. Cutting unemployment insurance apparently hasn’t encouraged the unemployed to look harder for work: It has caused them to drop out of the labor force altogether. To get unemployment insurance, you have to actively search for work and prove that you're doing so. The drop in the labor force suggests that this incentive was effective. Without it, more people just give up.
What Happens When Unemployment Benefits Are Cut? North Carolina Offers a Clue -- Nothing could be finer than to be in Carolina — unless you have been jobless for more than six months. Unless Congress acts (which looks unlikely), extended unemployment benefits will expire for millions of long-term U.S. job-seekers, 1.3 million immediately next week. How will that affect the labor pool? Michael Feroli, chief U.S. economist at J.P. Morgan, used the North Carolina experience to find out. Cutting out benefits can reduce the jobless rate in two ways, says Mr. Feroli, pointing to past economic literature. Under the employment effect, people will take jobs even if the work pays less than the job seekers want. In the participation effect, people will drop out of the measured workforce since actively seeking a job (a criterion for being labeled officially unemployed) no longer carries an advantage of receiving jobless benefits. The North Carolina government decided in July to end extended benefits even though the state still met the economic criteria under the federal program. Since then, the North Caroline jobless rate has fallen 1.5 percentage points to 7.4% while the U.S. rate is down just 0.4 point to 7.0%. From July until November, the North Carolina labor force declined by 0.8%, but the U.S. force fell by only 0.3%, according to Mr. Feroli. The labor-force participation rate is down 0.7 percentage-point in North Carolina vs. 0.4-point nationally. Over the same time period, employment in North Carolina has grown by 0.8% in the household survey measure and 0.7% in the establishment survey measure. National employment is up 0.1% in the household measure and 0.6% in the establishment measure.
What does North Carolina’s big cut in jobless benefits really prove? - Earlier this year, as The New York Times reported, the North Carolina legislature cut unemployment benefits, reducing (a) the maximum payout by a third and (b) the number of weeks residents can receive jobless aid. As a result, starting in July the state lost its eligibility for the federal Emergency Unemployment Compensation program. (This is the extended benefits program scheduled to expire nationally at year end.) So how’s that worked out in the Tar Heel State? Well, if you listen to Republicans, it’s worked out pretty well. The state’s unemployment rate has dropped to 8.0% in October from 8.8% in June. So clearly cutting jobless benefits creates jobs and gets residents back in the workforce, right? When you dig a bit deeper, things look less bright.
- 1.) In June, the month before benefits were cut, there were 416,314 residents classified as unemployed. In October, there were 371,756. That’s a decline in unemployment of 44,558.
- 2.) Over that same period, the number of employed residents only rose by 1,902 from 4,292,251 to 4,294,153. So what happened to those 42,656 residents who left unemployment but did not move to employment?
- 3.) The state’s labor force participation rate tells the story. It plunged from 62.2% in June, before the benefits cut, to 61.4% in October. If that rate had merely stayed steady, the state’s jobless rate would have increased to 9.1% rather than sharply declining.
In other words, it looks like the cut in unemployment benefits moved people out of the labor force rather than into employment. Likewise, the state employment rate — the share of adults with jobs — declined from 56.7% in June to 56.5% in October. Did reducing the number of North Carolina residents eligible for federal extended unemployment benefits boost employment? These data suggest it did not, a reality Washington policymakers might want to consider.
It’s Us or Them - The Paul Ryan budget, happily accepted by the Senator Patty Murray on behalf of the Vichy party, frees up vast sums for war, while imposing new burdens on the 99% who don’t benefit from wars. It cuts the pay of federal workers by making them pay more for their pensions, deletes unemployment insurance for 1.3 million long-term unemployed, and hikes user fees on air travel. It doesn’t raise taxes on the filthy rich, and it certainly doesn’t raise taxes on their corporations, trusts, endowments, foundations and other tax dodges designed to push the burden of taxation onto what’s left of the middle class. In other words, it’s a total win for the rage-filled Republicans and their Democratic allies, who happily embrace the suck. We now have a bipartisan agreement that we shouldn’t raise taxes on the filthy rich, now, or ever. How did we get to the point that the idea of taxing the oligarchy is so disgusting we can’t even mention it in public? We know the Republicans are controlled by the rich, but Democrats used to favor taxation as a proper tool of good government. And the Establishment used to see it the same way. The fantastically rich with their $90 million pied-a-terres, and their servants are in the public square arguing that taxes should be used to benefit them at the expense of everyone else. Krugman, DeLong, Bernstein and other economists will not publicly say that the goal of the oligarchs is to grab all the money and limit government spending to things that they like. There is no one, no economist, no liberal politician, no think tank, no advocacy group, saying loudly and forcefully that we should tax the rich at levels that will make this a decent society. The hyper-rich intend to screw the 99%. It’s us or them.
What Recovery? The Average Family Is Still Poorer Than it Was Seven Year Ago - Here’s a statistic that illustrates just how bad the recession was: Despite U.S. households gaining $21 trillion in household wealth since 2009, the average family is still poorer than it was in 2007. That’s right, according to research from economists William Emmons and Bryan Noeth of the Center for Household Financial Stability, the average U.S. household’s inflation-adjusted net worth is $626,800, 2% below its 2007 peak of $645,100. The green line in the above chart shows the trajectory of the average household’s inflation adjusted wealth. The red line shows non-inflation adjusted wealth per household, while the blue line shows the total net worth of American households–which is about 11.8% higher than its peak in 2007. The differences are driven by the fact that the population has grown quite a bit since 2007, so while total wealth has more than recovered, per household wealth has not. Research from Berkeley economist Emmanuel Saez has also shown that the recovery has been more uneven than even these data suggest. According to Saez, 95% of the wealth gains experienced between 2009 and 2012 have gone to the top 1%, which suggests that the median household is even worse off than the average-household figures in the above chart suggest.
Inequality isn’t ‘the defining challenge of our time’ - Ezra Klein - It’s increasingly clear that the organizing economic concern of the American left is — or is becoming — income inequality. It's the issue that led protestors to occupy Zucotti Park. It's the anxiety that powered Bill DeBlasio's campaign for mayor of New York. Last week, President Obama called it -- and the decline in social mobility it heralds -- "the defining challenge of our time." Income inequality is easy to worry about. It offends our moral intuitions. Its tears into the fabric of the American dream. "That we’re all created equal is the opening line in the American story," Obama said. "And while we don’t promise equal outcomes, we've strived to deliver equal opportunity."Those who aren’t unnerved by the datum that the income share of the top one percent has shot from about 10 percent in 1980 to more than 20 percent today can worry instead about inequality’s attendant consequence: declining social mobility. As Obama said, “A child born in the top 20 percent has about a 2-in-3 chance of staying at or near the top. A child born into the bottom 20 percent has a less than 1-in-20 shot at making it to the top. He’s 10 times likelier to stay where he is.” America now has less social mobility than countries such as Canada, Germany and France. But is inequality really the country’s most pressing problem? Imagine you were given a choice between reducing income inequality by 50 percent and reducing unemployment by 50 percent. Which would you choose?
Inequality As A Defining Challenge - Paul Krugman - It has taken an amazingly long time, but inequality is finally surfacing as a significant unifying issue for progressives — including the president. And there is, inevitably, a backlash, or actually a couple of backlashes. One comes from groups like Third Way; Josh Marshall, I think, characterized that kind of position best: That captures a lot of what the ‘Third Way’ is about: a sort of fossilized throwback to a period in the late 20th century when there was a market for groups trying to pull the Democrats ‘back to the center and away from the ideological extreme’ in an era when Democrats are the fairly non-ideological party and have a pretty decent record of winning elections in which most people vote. But there’s also an intellectual backlash, with people like Ezra Klein arguing that inequality, while an issue, doesn’t rate being described as “the defining challenge of our time”. This in turn infuriates others, with Steve Randy Waldman going medieval on Klein. Well, I’m not infuriated, but I would argue that Ezra has gotten this one wrong. And yes, I’ve expressed skepticism about the simple argument that inequality accounts for our slow recovery; the evidence surveyed in Jared Bernstein’s excellent new paper on the subject eases my skepticism somewhat, but it’s not entirely gone. The key point, however, is that the case for regarding inequality as a major, indeed defining challenge — and as something that should be at the center of progressive concerns — rests on multiple pillars. Taken together, the reasons to focus on inequality are overwhelmingly convincing, even if you can be skeptical about particular arguments.
Inequality and Unemployment Are the Same Problem - Dean Baker - In his Washington Post column this morning, Ezra Klein dismisses the problem of inequality and argues that progressives should instead focus on unemployment. While he will get no argument from me on the need to focus on unemployment, the idea that this is a separate issue from inequality is seriously misplaced. Ezra gets to this spot by first dismissing the idea that inequality harms growth. He is certainly right that the evidence is less conclusive than we might like, but I would attribute that largely to the reluctance of the economic profession to even consider this possibility. If we just do some simple arithmetic we can get an idea of the size of the effect of the upward redistribution of 10 percentage points of disposable income from the bottom 80 percent to the top 1 percent. If we assume that the bottom 80 percent would have spent 95 percent of this income and the top 1 percent would only spend 75 percent, then the difference would be 20 percentage points or 2 percent of disposable income. This would translate into a loss of demand of 1.6 percentage points of GDP. That is what would have to be made up by larger budget deficits, trade surpluses, or a flood of investment. While some of us have long warned of this scenario, leading economists like Paul Krugman and Larry Summers have just recently begun to take seriously the possibility of secular stagnation. For decades the profession has treated it as an article of faith that there could not be sustained shortfalls in demand so inadequate consumption due to the upward redistribution of income could not possibly be a problem.
Inequality and Incomes, Continued - Paul Krugman - Some further numerical thoughts on the right of inequality to be considered a “defining challenge.” Many of the participants in our economic discourse start with the working presumption that inequality is a second-order issue, that the effects of rising inequality — to the extent that these effects are considered worth mentioning at all — are minor compared with the effects of economic growth or the lack thereof. This presumption is so ingrained in the discourse that hardly anyone looks at the numbers. But when you do look at those numbers, you get a shock. In my previous post I looked at income changes since 2000, and argued that for the bottom 90 percent rising inequality has actually cost more than the economic slump. Obviously that calculation depends on the starting date — and you might also wonder whether the period since 2000 is exceptional. But look, first, at the long-term trend in inequality. Piketty-Saez have the income share of the bottom 90 percent falling from two-thirds in 1979 to one-half now; that’s roughly 0.9 percent lopped off their income growth per year, for more than three decades. CBO’s numbers aren’t exactly comparable, but they show the income share of the bottom 80 percent declining from 57 to 47 percent over 1979-2007, which means income growth 0.7 percentage point per year slower than in the constant-inequality case. Those are big numbers. They’re big enough that even if we restrict ourselves to the period 2007-13 — that is, to the Great Recession and the Not-So-Great Recovery — they suggest that the decline in middle-class incomes owes as much to rising inequality as it does to the depressed state of the economy. And this is true even though we’ve suffered the worst economic crisis since the 1930s!
President Obama and Paul Krugman are right: economic inequality is a “defining issue of our time” - Actually, I would argue, as President Obama did last week, that economic inequality is the defining issue of our time. But in a blog post today, Krugman characterized it as “a defining challenge,”, and I don’t want to put words in his mouth. In his post, Krugman makes four important points:
- 1) First, he says, the “sheer quantitative” impact of economic inequality has been extremely powerful. He notes “the income of the bottom 90 is about 8 percent lower than it would have been if inequality had remained stable.”
- 2) Second, the economic downturn has been caused, in part, by economic inequality.
- 3) Third, inequality has increased “the political power of the 1 percent.” This, Krugman observes, led to policy failures before and after the economic crisis — the deregulation and financialization of the economy, pre-, and austerity economics, post.
- 4) Finally, he points out that the causes of skyrocketing economic inequality are still somewhat mysterious. And since, he argues, we don’t fully understand what policies are needed to reverse the trend, “it makes very good sense for progressives to focus much of their energy on the issue.”
Krugman strengthens the case for #1 in a subsequent post. The only one of his arguments I would quibble with a bit is #4. While it’s true that the exact pathways that led to such alarmingly high rates of economic inequality are unknown, we have some pretty strong hypotheses. More importantly, the policy fixes for economic inequality are fairly clear: in no particular order, they include a higher minimum wage, stronger labor unions, a more progressive tax system, a more generous social welfare state, macroeconomic policies that promote a full employment economy, and much more powerful government regulations, particularly in the banking and finance sector.
Full employment, not inequality, should be the top priority - Ezra Klein - My Friday column arguing that inequality shouldn’t be elevated to “the defining challenge of our time” — or even the defining economic challenge of our time — has elicited a lot of really interesting responses. See Brad DeLong, Jared Bernstein, Paul Krugman, Larry Mishel, Ashok Rao, Matt Yglesias and Dean Baker, to start. I’ll add a few points.
- 1) It’s perhaps useful to begin with what I was not saying. I’m not saying inequality isn’t a serious problem. I’m not saying declining social mobility isn’t a serious problem. I’m not saying that the difficulty of finding firm evidence that inequality impedes growth means that inequality doesn’t impede growth. The column is about whether inequality should be seen as the central economic problem of our age. Amidst mass joblessness and weak growth, I’m skeptical.
- 2) Obviously this whole conversation is moot if inequality is a primary reason for mass joblessness and weak growth. I don’t find the evidence on that score hugely compelling. We've had nearly full employment during periods of high inequality (say, 2005) and we've had high unemployment during periods of relative equality (say, 1982). The same is true internationally: Some relatively equal countries suffer from extremely high unemployment (Portugal, for instance) while some relatively unequal countries are seeing fast growth and low unemployment (Singapore, say). But Dean Baker at the Center for Economic and Policy Research find this argument more persuasive, and you should read his case.
- 3) I’m quite convinced, however, that joblessness makes inequality much worse. As former White House economist Jared Bernstein writes, “Over the period when labor markets were tight 2/3′s of the time, incomes grew together. Over the period when labor markets were tight 1/3 of the time, they grew apart." Here's the graph:
What social science says about the impact of unemployment on well-being: it’s even worse than you thought -- While reading this odd and meandering New York Times op-ed this morning, I stumbled upon a link to a fascinating study from last year on the impact of unemployment on non-monetary well-being. It was conducted by Stanford sociologist Cristobal Young, who discovered that unemployment has an even more catastrophic effect on personal happiness that we thought. The study produced three major findings. The first is the devastating impact job loss has on personal well-being. Job loss, says Young, “produces a large drop in subjective well-being”: Job loss into unemployment, however, is a different matter; this brings on deep distress that is greater in magnitude than the effect of changes in family structure, home-ownership or parental status. The distress of job loss is also hard to ameliorate: family income does not help, unemployment insurance appears to do little and even reemployment does not provide a full recovery. The second finding is that while unemployment insurance (UI) is succesful as a macroeconomic stabilizer, it doesn’t make unemployed people any happier. UI, says Young:is not central to their sense of well-being… …[ I]t does little to support their identity, sense of purpose or self-regard. Third, job loss has a strong, lasting negative impact on well-being that may persist for years: [J]ob loss has consequences that linger even after people return to work. Finding a job, on average, recovers only about two thirds of the initial harm of losing a job. It is not clear how long it takes for the nonpecuniary effect of unemployment to heal.
Why Inequality Matters, by Paul Krugman - Rising inequality isn’t a new concern. But politicians, intimidated by cries of “class warfare,” have shied away from making a major issue out of the ever-growing gap between the rich and the rest. Still, the discussion has shifted enough to produce a backlash from pundits arguing that inequality isn’t that big a deal. They’re wrong. The best argument for putting inequality on the back burner is the depressed state of the economy. Isn’t it more important to restore economic growth than to worry about how the gains from growth are distributed? Well, no. First of all, even if you look only at the direct impact of rising inequality on middle-class Americans, it is indeed a very big deal. Beyond that, inequality probably played an important role in creating our economic mess, and has played a crucial role in our failure to clean it up. Start with the numbers. On average, Americans remain a lot poorer today than they were before the economic crisis. For the bottom 90 percent of families, this impoverishment reflects both a shrinking economic pie and a declining share of that pie. Which mattered more? The answer, amazingly, is that they’re more or less comparable — that is, inequality is rising so fast that over the past six years it has been as big a drag on ordinary American incomes as poor economic performance, even though those years include the worst economic slump since the 1930s. And if you take a longer perspective, rising inequality becomes by far the most important single factor behind lagging middle-class incomes.
Things That Shouldn't Have To Be Said - Poverty and associated income inequality can be thought of as big fucking deals even if they don't have any discernible impact on GDP or GDP growth. People may disagree about the appropriate social welfare function, but W=GDP is gibberish unless you truly believe that an economy with a GDP of one greater dollar is always preferable even if that "better" GDP involves Bill Gates earning all the monies and the rest of us earning none.
Moral Aspects of Basic Income - Both capital and labour are much more productive than they used to be. Mostly, this is a good thing. Producing more with less makes society richer. Greater supply should mean abundance for all. The problem is on the demand side. Productivity increases are great on the micro level and are great for supply but for aggregate demand they can end up being destructive. If you can make more with less labour, and so get rid of workers, who will be able to afford to buy the stuff you now make? After all, your workers are also consumers.As long as consumers keep their wallets closed, firms have no incentive to hire. Firms won’t invest in productive capacity when goods are still sitting on the shelf. So far, the trickle down tactic of quantitative easing to stimulate asset prices has been disappointing. Yes share prices have been rising but wages have not followed. It is time to try a trickle up policy. A number of us here at Pieria have argued that a basic income guarantee (also called a negative income tax) will not only reignite the economy and overcome secular stagnation, it will be the salvation of capitalism. Yes, it provides a safety net for the most unfortunate and yes, it reduces inequality, but most important, by creating steady and dependable demand, it cures capitalism’s only weakness, over-production. By putting money in consumers’ pockets, a basic income guarantees consistent demand and so gives the private sector confidence to hire and invest.
The Liberal Case Against a Universal Basic Income - With the coming referendum in Switzerland has come a flurry of commentary about a “Universal Basic Income” (UBI). There are some strange bedfellows from left and right are saying nice things about it. I suggest that it can be a distraction from more important things. If you don’t have time to read this, just consider that a payment of $10,000 to every U.S. adult, a pretty basic basic income, would cost $2.5 trillion. Game over. That aside, first off we need to distinguish between the objective of ensuring a minimum standard of consumption for all persons and the specifics of a UBI. You can support the first without the baggage of the second. More plausible ways to pursue the objective include: promote full employment, raise the minimum wage, rationalize and expand our system of refundable tax credits in the Federal individual income tax, federalize the Temporary Assistance for Needy Families program (reversing the welfare reform of 1996), establish the Federal government as an employer of last resort, support trade unions, and establish pay for caregivers. All of these in some combination are worth more of our time than a UBI. They are all more in keeping with our current system and our political culture. What’s wrong with the UBI? It is not the utopianism. The measures I note, if you scale them up, are pretty ambitious. Nor do I see incentive problems with a UBI or similar measures. I do not believe that the availability of a UBI would spawn an army of slackers and moochers.
In the War on Poverty, a Dogged Adversary -- When President Lyndon Johnson declared his war on poverty on Jan. 8, 1964, almost exactly 50 years ago, 19 percent of Americans were poor. “The richest nation on earth can afford to win it,” he reasoned, as he proposed a clutch of initiatives from expanding food stamps to revamping unemployment insurance. “We cannot afford to lose it.” A half-century later, our priorities have changed. In November, food benefits were cut for approximately 48 million Americans by an average of 7 percent, costing the typical recipient about $9 a month, as the emergency expansion of the food stamp program enacted in the depths of the great recession was allowed to expire. Next month, 1.3 million jobless workers are scheduled to stop receiving an unemployment check, after Congress’s refusal to prolong the extension of emergency jobless benefits to up to 73 weeks, from 26. Perhaps as many as five million people will lose their benefit over the next year. But while politicians’ attention has wandered, poverty remains uncomfortably close to where it was five decades ago. The official poverty rate today is 15 percent. But by a newly deployed, more comprehensive Census Bureau definition, which provides a more realistic tab on people’s needs and takes into account the effect of government benefits, 16 percent of Americans are poor. This is just 3 percentage points less than in 1967, the earliest year for which the data is available. It amounts to 50 million people. Why so many still? Did the United States wage a war on poverty, lose and move on?
The Undeserving » In this season of good will to all and general cheer let us talk of “The Undeserving.” They are an emotive topic. They divide people. Do they exist or are they a political scapegoat? I personally do not feel anyone is born undeserving. But some people achieve it. Some seem to take a cruel and degenerate delight in causing harm. Others become so out of weakness. They are faced with moral decisions in life and they take the easy path of closing their conscience to the harm they do others. We have all seen them. It may not be politically correct to label them for what they are but I do not like political corectness. So let us be honest. The feckless and irresponsible exist. They are people who think the state is there to look after them and clean up their mess. Who think nothing of spending other people’s money and then brazenly asking for more. They are people who make other people’s lives, honest and hard working people’s lives, a misery but laugh because they know the police can do little to them and the courts will just give them a slap on the wrist, if that, and then let them go. Free to walk straight back to do again whatever they feel like. They are a plague. The State, however, not only does little to stop them, it takes money from the pockets of the deserving and the honest in order to give it to these people. What I find oddest about the Undeserving is how the papers and politicians only ever seem to talk about the undeserving poor and never, ever the undeserving rich. Yet if we are keen to identify the one, then it is pure hypocrisy and worse, to not recognize the other.
This Chart Blows Up the Myth of the Welfare Queen - Here's a useful graph to keep handy for the next time Fox News airs a report about food stamp users buying lobster with their benefits. This month, the Bureau of Labor Statistics compared yearly spending between families that use public assistance programs, such as food stamps and Medicaid, and families that don't. And surprise, surprise, households that rely on the safety net lead some pretty frugal lifestyles. On average, they spend $30,582 in a year, compared to $66,525 for families not on public assistance. Meanwhile, they spend a third less on food, half as much on housing, and 60 percent less on entertainment. These figures, drawn from the 2011 Consumer Expenditure Survey, don't capture all non-cash perks some low-income families get from the government, such as healthcare coverage through Medicaid. But they give you a sense of the kind of tight finances these families deal with. Take the food budget: There were, on average, 3.7 people in each family on public assistance (I know, that sounds weird, but bear with me). So that $6,460 spent on food comes out to about $34 per person, per week. Not exactly a shellfish budget.
BLS: State unemployment rates were "generally lower" in November - From the BLS: Regional and state unemployment rates were little changed in October Regional and state unemployment rates were generally lower in November. Forty-five states and the District of Columbia had unemployment rate decreases from October and five states had no change, the U.S. Bureau of Labor Statistics reported today....Nevada and Rhode Island had the highest unemployment rates among the states in November, 9.0 percent each. The next highest rates were in Michigan, 8.8 percent, and Illinois, 8.7 percent. North Dakota continued to have the lowest jobless rate, 2.6 percent.This graph shows the current unemployment rate for each state (red), and the max during the recession (blue). All states are below the maximum unemployment rate for the recession. The size of the blue bar indicates the amount of improvement - Michigan, Nevada and Florida have seen the largest declines and many other states have seen significant declines. The states are ranked by the highest current unemployment rate. No state has double digit unemployment and the unemployment rate is at 9% in two states: Nevada, and Rhode Island. The second graph shows the number of states with unemployment rates above certain levels since January 2006. At the worst of the employment recession, there were 9 states with an unemployment rate above 11% (red). Currently two states have an unemployment rate at or above 9% (purple), nine states at or above 8% (light blue), and 22 states at or above 7% (blue).
November Job Gains Spread Across the U.S. - Almost all U.S. states contributed last month to the solid job gains that helped push the nation’s unemployment rate to a five-year low, a Labor Department report showed Friday. Payroll employment increased in 43 states in November and fell in seven states plus the nation’s capital, the department said in a report on state employment. Jobless rates decreased in 45 states and in the District of Columbia while holding steady five states. Some of the biggest gains were reported by states whose labor markets have been the weakest in the aftermath of the housing bust and recession. California added more than 44,000 jobs and its unemployment rate fell to 8.5% from 8.7%. Arizona added 15,000 jobs, pushing down its unemployment rate to 7.8% from 8.2%. Total U.S. payrolls rose by 203,000 in November, while the nation’s unemployment rate fell to 7%, the lowest level since November 2008. The unemployment rate in the District of Columbia fell to 8.6% in November from 8.9% the prior month, entirely reversing a spike tied to the 16-day federal government shutdown in October. North Dakota, which has long had the nation’s lowest unemployment rate thanks to its energy boom, showed further improvement with its rate falling to 2.6% in November from 2.7%. Both Nevada and Rhode Island registered
Counties in California Boast Wage Growth, While Texas Creates Jobs - Among the 10 largest U.S. counties, San Diego experienced the largest gain in average weekly wages, up 4.0% from June 2012 to June 2013, the Labor Department said Wednesday. That’s almost double the national increase of 2.1%. The professional and business services led the wage growth in San Diego County. Wages in that sector increased 9.2%. However, job growth in San Diego moved more slowly, increasing just 1.6% — matching the gain for the country as a whole. Fort Bend, Texas, located southwest of Houston, continued to be the leading county for job creation. Payrolls there jumped 7% during the 12-month period. The area is benefiting from the growing U.S. energy sector. Meanwhile, superstorm Sandy appears to have taken a toll on employment in southern New Jersey. Atlantic County, N.J., home to Atlantic City, suffered the largest decrease in employment of among the 334 largest U.S. counties from June 2012 to June 2013. The size of payrolls in the coastal community fell by 4.5% during the 12-month period. Within Atlantic, natural resources and mining had the largest decrease in employment, the Labor Department said.
Washington, DC city council raises minimum wage to $11.50/hr in 2016 (Reuters) - Washington's city council on Tuesday approved raising the minimum wage to $11.50 an hour, one of the highest rates among U.S. cities and part of the wealthy region's push to hike base pay. The minimum wage in the U.S. capital would rise in 2016 from the current $8.25, and then be indexed for inflation. The council gave unanimous final approval to the measure, which it first passed two weeks ago. Democratic Mayor Vincent Gray has opposed the measure, saying it was not known how it would affect the labor market, and urged an increase to $10 an hour instead. The unanimous vote means the council could pass it over Gray's veto. The federal minimum wage is $7.25 an hour. The District of Columbia Chamber of Commerce has called for raising the minimum wage to $10 over three years and then indexing it to inflation. The council coordinated raising the base wage with lawmakers in Montgomery and Prince George's counties, in Washington's Maryland suburbs. They approved similar measures last month. Once the higher pay takes effect, the three jurisdictions would form a region with 2.5 million residents and a minimum wage higher than any of the 50 states. Virginia, which borders Washington, requires employers to pay the federal rate.
When Lenders Sue, Quick Cash Can Turn Into a Lifetime of Debt - Five years ago, Naya Burks of St. Louis borrowed $1,000 from AmeriCash Loans. The money came at a steep price: She had to pay back $1,737 over six months. A single mother who works unpredictable hours at a chiropractor’s office, she made payments for a couple of months, then she defaulted. So AmeriCash sued her, a step that high-cost lenders – makers of payday [3], auto-title [4] and installment [5] loans – take against their customers tens of thousands of times each year. In just Missouri and Oklahoma, which have court databases that allow statewide searches, such lenders file more than 29,000 suits annually, according to a ProPublica analysis. . High-cost loans already come with annual interest rates ranging from about 30 percent to 400 percent or more. In some states, if a suit results in a judgment – the typical outcome – the debt can then continue to accrue at a high interest rate. In Missouri, there are no limits on such rates. Many states also allow lenders to charge borrowers for the cost of suing them, adding legal fees on top of the principal and interest they owe. After AmeriCash sued Burks in September 2008, she found her debt had grown to more than $4,000. She agreed to pay it back, bit by bit. If she didn’t, AmeriCash won the right to seize a portion of her pay. Ultimately, AmeriCash took more than $5,300 from Burks’ paychecks. Typically $25 per week, the payments made it harder to cover basic living expenses, Burks said. But those years of payments brought Burks no closer to resolving her debt. Missouri law allowed it to continue growing at the original interest rate of 240 percent [2] – a tide that overwhelmed her small payments. So even as she paid, she plunged deeper and deeper into debt. By this year, that $1,000 loan Burks took out in 2008 had grown to a $40,000 debt, almost all of which was interest. After ProPublica submitted questions to AmeriCash about Burks’ case, however, the company quietly and without explanation filed a court declaration [9] that Burks had completely repaid her debt.
Land of the free? America has 25 percent of the world’s prisoners - The United States has about five percent of the world’s population and houses around 25 percent of its prisoners. In large part, that’s the result of the “war on drugs” and long mandatory minimum sentences, but it also reflects America’s tendency to criminalize acts that other countries view as civil violations. In 2010, The Economist highlighted a case in which four Americans were arrested for importing lobster tails in plastic bags rather than in cardboard boxes. That violated a Honduran law which that country no longer enforces, but because it’s still on the books there its enforced here. “The lobstermen had no idea they were breaking the law. Yet three of them got eight years apiece.” When the article was published 10 years later, two of them were still behind bars. As The Economist put it: America imprisons people for technical violations of immigration laws, environmental standards and arcane business rules. So many federal rules carry criminal penalties that experts struggle to count them. Many are incomprehensible. Few are ever repealed, though the Supreme Court… pared back a law against depriving the public of “the intangible right of honest services”, which prosecutors loved because they could use it against almost anyone. Still, they have plenty of other weapons. By counting each e-mail sent by a white-collar wrongdoer as a separate case of wire fraud, prosecutors can threaten him with a gargantuan sentence unless he confesses, or informs on his boss. The potential for injustice is obvious.
Detroit Seeks to Pay UBS, BofA $230 Million to End Swaps - Detroit, the biggest U.S. city to file for bankruptcy, is seeking a permission to pay UBS and Bank of America $230 million to cancel payments on swaps that threaten the city’s revenue from casino taxes. A three-day trial began today before U.S. Bankruptcy Judge Steven Rhodes in Detroit on the city’s request to make the payment as part of a deal to cancel interest-rate swap contracts that have cost it about $4 million a month since July 2009. To pay for the settlement, the city wants Rhodes to let it borrow $350 million. Buying out the swaps will keep the casino taxes, one of Detroit’s best sources of money, from going to the banks, Corinne Ball, a lawyer for the city, told Rhodes today. “Cash is the lifeline for the city,” she said. Creditors led by bond insurer Syncora Guarantee Inc. oppose the settlement, saying it costs too much. The city hasn’t proved it would lose if it sued to cancel the contracts instead of settling with the banks, Syncora said. “The swap counterparties -- who have already made hundreds of millions of dollars off the city over the last seven years -- stand to make hundreds of millions more in one fell swoop,” Syncora said in court papers.
The Impacts of Expanding Access to High-Quality Preschool Education - President Obama’s “Preschool for All” initiative calls for dramatic increases in the number of 4 year olds enrolled in public preschool programs and in the quality of these programs nationwide. The proposed program shares many characteristics with the universal preschools that have been offered in Georgia and Oklahoma since the 1990s. This study draws together data from multiple sources to estimate the impacts of these “model” state programs on preschool enrollment and a broad set of family and child outcomes. We find that the state programs have increased the preschool enrollment rates of children from lower- and higher-income families alike. For lower-income families, our findings also suggest that the programs have increased the amount of time mothers and children spend together on activities such as reading, the chances that mothers work, and children’s test performance as late as eighth grade. For higher-income families, however, we find that the programs have shifted children from private to public preschools, resulting in less of an impact on overall enrollment but a reduction in childcare expenses, and have had no positive effect on children’s later test scores.
Georgia lawmaker: Force poor kids to ‘sweep the floors’ to get school lunches -- A Republican congressman from Georgia who is hoping to be party’s next Senate nominee said over the weekend that poor children should have to pay or sweep floors if they wanted to eat school lunches. “I’m on the Agriculture Committee, we have jurisdiction over the school lunch,” Rep. Jack Kingston explained to the Jackson County Republican Party in a clip obtained by The Huffington Post’s Amanda Terkel. “School lunch program is very expensive.” “But one of the things I’ve talked to the secretary of agriculture about: Why don’t you have the kids pay a dime, pay a nickel to instill in them that there is, in fact, no such thing as a free lunch?” he suggested. “Or maybe sweep the floor of the cafeteria — and yes, I understand that that would be an administrative problem, and I understand that it would probably lose you money.” “But think what we would gain as a society in getting people — getting the myth out of their head that there is such a thing as a free lunch,” Kingston added.
A Poor Educational System -- The sorry secret of higher education — from community colleges to brand-name universities — is that they’ve embraced the corporate culture of a contingent workforce. They’re turning lots of professors into part-time, low-paid, no-benefit, no-tenure, temporary teachers. It also means that these highly educated, fully credentialed professors have become part of America’s army of the working poor. They never know until a semester starts whether they’ll teach one class, three, or none — typically, this leaves them with take-home pay somewhere between zero and maybe $1,000 a month. Poverty. Overall, three-quarters of America’s higher-ed faculty members today are adjunct professors or off the tenure track. That means they’re attached to a particular school, but not essentially a part of it. Adjuncts usually get no benefits, no real chance of earning fulltime positions, no due process or severance pay if dismissed, no say in curriculum or school policies…sometimes not even office space. Like their counterparts at Walmart and McDonald’s, adjunct college professors aren’t treated as valuable resources to be nurtured, but as cheap, exploitable, and disposable labor.
The Kansas Regents (Casually) End Academic Freedom By William K. Black -- Wednesday, December 18, 2013, the Kansas Board of Regents drastically curtailed tenure and academic freedom. The state attorney general aided this action. The Regents decided that when university faculty use common forms of modern communication (“social media”) they no longer have the protections of tenure and academic freedom. The Regents’ policy change does not even mention tenure or academic freedom. The Regents acted without consulting the faculty and without any open debate. The Regent’s policy begins with a broad definition of “social media” that includes the primary means that many faculty members engage in academic discourse, such as “blogs” and videos of lectures, interviews, and congressional testimony posted on line, but also “any” “online publication.” Academics frequently publish their research “online” and even when they publish in print they often publish a version of the paper “online” (see, for example, my SSRN page) so that other academics can easily read it. The chief executive officer of a state university has the authority to suspend, dismiss or terminate from employment any faculty or staff member who makes improper use of social media. “Social media” means any facility for online publication and commentary, including but not limited to blogs, wikis, and social networking sites such as Facebook, LinkedIn, Twitter, Flickr, and YouTube. “Improper use of social media” means making a communication through social media that:
- ii. when made pursuant to (i.e. in furtherance of) the employee’s official duties, is contrary to the best interests of the University;
- iii. discloses without authority any confidential student information, protected health care information, personnel records, personal financial information, or confidential research data; or
- iv. subject to the balancing analysis required by the following paragraph, impairs discipline by superiors or harmony among co-workers, has a detrimental impact on close working relationships for which personal loyalty and confidence are necessary, impedes the performance of the speaker’s official duties, interferes with the regular operation of the university, or otherwise adversely affects the university’s ability to efficiently provide services.
How A For-Profit College Created Fake Jobs To Get Taxpayer Money: Eric Parms enrolled at an Everest College campus in the suburbs of Atlanta in large part because recruiters promised he would have little trouble securing a job. He'd seen the for-profit school's television commercials touting its sterling rates of job placement, and he'd heard the pledges of admissions staff who assured him that the campus career services office would help him find work in his field. But after completing a nine-month program in heating and air conditioning repair in the summer of 2011 -- graduating with straight As and $17,000 in student debt -- Parms began to doubt the veracity of the pitch. Career services set him up with a temporary contract position laying electrical wires. After less than two months, he and several other Everest graduates also working on the job were laid off and denied further help finding work, he says. Even that short-lived gig wasn't secured on the strength of Parms's degree. The college had paid his contractor $2,000 to hire him and keep him on for at least 30 days, part of an effort to boost its official job placement records, according to documents obtained by The Huffington Post. The college paid more than a dozen other companies to hire graduates into temporary jobs before cutting them loose, a HuffPost investigation has found.
College Student Debt Soars; College Presidents' Pay Skyrockets - Presidents of U.S. colleges and universities fundraise with donors, preside over graduation ceremonies and provide unversities with long-range strategic vision. They are also paid handsomely for their work. Forty-two private college presidents earned more than $1 million in 2011, according to a new analysis by The Chronicle of Higher Education. The median total compensation for a college president in 2011 was $410,523, up 3.2% from 2010. Of the 550 presidents’ salaries that were included in the analysis, 180 took home more than $500,000 in 2011 compared to 50 in 2004. The highest paid college presidents in 2011 were:
- Robert Zimmer, University of Chicago ($3.358 million)
- Joseph Auon, Northeastern University ($3.121 million)
- Dennis Murray, Marist College ($2.688 million)
- Lee Bollinger, Columbia University ($2.327 million)
- Lawrence Bacow, Tufts University ($2.223 million)
10 Colleges Where Grads Have the Most Student Loan Debt - Outstanding student debt from federal and private loans totals close to $1.2 trillion, and more than 7 million borrowers are in default on their loans, according to the Consumer Financial Protection Bureau. The student borrowing trend shows no signs of slowing down, either. Average student loan debt climbed to $29,400 for borrowers in the class of 2012, up from $26,600 for 2011 graduates and $25,250 for 2010 graduates, an annual report from The Institute for College Access & Success shows. Seventy-one percent of 2012 graduates took out loans. While those figures represent national averages, student borrowing habits vary widely from school to school. At Princeton University in New Jersey, for example, only 24 percent of 2012 graduates used student loans to help fund their education. Those who borrowed had an average debt load of just $5,096, according to data reported in an annual U.S. News survey. The debt data include loans taken out by students from their colleges, from private financial institutions and from federal, state and local governments. Loans to parents are not included. Wheelock College in Massachusetts is on the other end of the student-debt spectrum. Eighty-two percent of the class of 2012 took out loans. Those who borrowed carried an average debt burden of nearly $49,500, according to school-reported data. Graduates from Anna Maria College, also in Massachusetts, were not far behind, borrowing close to $49,200, on average.
How Should We Solve the Pension-Fund Crisis? - In Detroit, an emergency manager has steered the city into bankruptcy, in part to avoid its pension obligations. In Illinois, the legislature just passed a bill cutting pensions and raising the retirement age for state workers, in the hope of saving a hundred and sixty billion dollars in pension costs over the next thirty years. And these moves are only the most dramatic instances of a broader trend: between 2009 and 2012, forty-five states passed some kind of pension reform. Pensions are supposed to be dull and reliable. But they’re now the locus of bruising political battles.The reason is simple: though plenty of states and cities have managed to maintain healthy pension funds, in many places pension costs are eating up huge chunks of the budget. New Jersey’s and California’s pension funds are both in deep holes. San Diego now spends more than twenty per cent of its operating budget on pensions; San Jose spends a quarter of its budget on them. Illinois needs to come up with nearly a hundred billion dollars just to pay off obligations it is already committed to. In principle, providing for pensions isn’t difficult: governments set aside money every year to fund them, just as workers contribute a percentage of their salary every year. But that means raising taxes or spending less on things that voters like, so politicians often just let pension contributions slide, passing the bill on to future taxpayers. Politicians are adept at rationalizing such irresponsible behavior. When markets are up and pension funds are flush, they say that there’s no need to add money. When times are bad and tax revenue drops, they say that they can’t afford contributions.
401(k) Plan Abuses Finally Coming to Light - Yves Smith -- I doubt that I’m unusual in being a finance type who has heard about 401 (k) abuses and bad practices for a very long time. So it’s gratifying to see the Financial Times that something is finally being done to try to curb this behavior. But that is hardly the full extent of what is rotten in retirement fund land. Some of the failings reflect a combination of poor implementation of already not-so-hot finance orthodoxy. For instance, one mainstay of investing is to diversify across asset classes. It won’t increase your returns but it will lower your risk. But what is an asset class? Wellie, the academic work on this topic defines “asset” classes in very large buckets that (as least historically) really were distinct markets and therefore moved only weakly in synch with each other: stocks, bonds, real estate, cash. Later research added foreign stocks and foreign bonds. But then pension fund consultants, whose role is to be a liability shield for corporations and government entities that still run defined benefit plans, have proclaimed all sort of types of investments to be asset classes, like private equity funds and hedge funds versus distressed debt. If pressed, hedgies admit that the value they create is largely “synthetic beta” or portfolio diversification, which can be achieved way more cheaply than the classic “2 and 20″ fees (2% per annum, 20% of the gains, sometimes over a hurdle rate. But you can see the clear conflict of interest: the fund consultants have incentives to designate more investment strategies as “asset classes” so as to give them more to do and make their role look more significant.
Retirement Plans Attacked For 'Savings Inequality' – A report by the Washington-based National Institute on Retirement Security that found a significant racial disparity in retirement savings among working-age households appears to be setting the stage for introducing “income redistribution” concepts into the next round of debate over cutting Social Security benefits. What appears to be taking shape in Washington is an argument that 401(k) plans are a tax advantage enjoyed disproportionately by the rich. Meanwhile, cuts contemplated to Social Security to reduce future unfunded federal budget liabilities would be disproportionately disadvantageous to the poor. “A large majority of Black and Latino working-age households – 62 percent and 69 percent respectively, do not own assets in a retirement account, compared to 37 percent of white households,” according “Race and Retirement Insecurity in the United States,” a paper published this week by Nari Rhee, Ph.D., for the National Institute on Retirement Security. While emerging research on retirement savings has not resulted in calls to curtail 401(k) plans, the argument is not out of the question in a political environment in which economic outcomes are increasingly judged for their racial or class fairness
Enough Already - Here’s what I don’t understand. Does anyone seriously think that people are saving enough for retirement? Moreover, no one makes any money off their money anymore. If you want to make interest, you have to invest, and your investment has to be at least somewhat risky. So, why would anyone talk about cutting people’s Social Security benefits when it is as clear as day that the current benefits are going to be completely inadequate for a whole lot of people? Jim Kessler, senior vice president for policy and a co-founder of Third Way, said Friday morning that Sen. Elizabeth Warren’s (D-Mass.) backing of a plan to expand Social Security compelled him and the president of the group to hit back with a Wall Street Journal op-ed lambasting the plan and economic populism.“The impetus was really — we saw after the most recently, this push that okay, it’s time to really move the national Democratic Party to a much more liberal agenda, in this case, Senator Warren was the standard bearer — she’s on the cover of a lot of magazines,” . “We were a bit alarmed by that.” “That Social Security plan had been out there but really languishing — because Senator Warren has such a powerful compelling voice, she started talking about it, and it suddenly it became much more talked about and viable alternative.” These Third Way folks have been flogging this horse for decades at this point. It is a dead horse.
Social Security: Trust Fund Ratios, Solvency and the Reagan ‘Raid’ - What does or would it mean to say that Social Security was ‘solvent’? Under the rules that govern the Trustees of Social Security the test for any given year is pretty simple: did or will the year end with all obligations/cost met while still retaining assets equal to the next year’s cost. To determine this you take the year end Trust Fund Balance and divide by Cost to get a Trust Fund Ratio where 100 = 1 year. If the TF Ratio is 100 or above Social Security is solvent for that year, 99 or under not. It is important to note that a TF Ratio under 100 doesn’t mean any change in benefits being paid out, instead benefits can and under current law must be paid in full as long as there are any assets to draw on, that is a TF Ratio greater than 0. Still any number between 0 and 100 is worrisome. Is Social Security ‘solvent’ today? By this test certainly, at least for the Old Age/Retirement (OAS) Trust Fund, at years end 2012 OAS had a TF Ratio of 391. Has Social Security OAS always been ‘solvent’. Well no, and we can track its performance since 1937 in the following Table for the 2013 Report. By this simple TF Ratio test OAS was solvent every year from 1937 to 1965 and again from 1967 to 1970 only to fall under the 100 mark in 1971 enroute to its lowest year end point in 1982 at 14. At that point full payments of benefits were at serious risk, literally SOMETHING had to be done. And lo! the Greenspan Commission. More below.
How Much Interest Does Social Security Pay? - A reader asked what interest does Social Security pay on your “investment”? I think it is important to realize that this is not the important question about Social Security. Social Security is an insurance program and it doesn’t make any more sense to talk about the “interest” you earn on your “investment” than it would to ask what interest you earn on your car or home insurance. Or grocery budget. However a person should know what he is paying for his insurance and whether the insurance is worth the premium. In this sense it might be useful to make an estimate of Social Security’s “return on investment.” But such an estimate can be dangerously misleading if you do not keep in mind that you are paying for insurance. By using the 2013 and 2009 Trustees Reports, I have calculated some “returns” reasonably associated with the “premium”… the “payroll tax”… “invested.” My results compare fairly closely with some standard estimates of SS “return on investment” in the “average” case, and diverge widely in the case of lower earners and what I regard as a more likely pattern of earnings. Because SS is intended as insurance, the “earnings” of the “average worker” are not as germane to the task of Social Security as are the “earnings” of those who earn less than average. For a low lifetime earner… 45% of Average Wage, about 18,000 dollars per year in today’s terms: 7.23% if you count the tax paid by both the worker and the employer, to pay benefits for for the worker, or 8.74% to pay benefits for the worker plus wife. If you consider… as i do… that the low income worker would NOT get the employer’s share if the government did not require the employer to pay that share, the worker would have to earn from his share of the tax… 10.9% to get the same benefit for himself (without wife).
How to Control Entitlements, Especially Medicare - Becker -- Estimates of future spending on Medicare, the main government program for medical spending on persons over 65, indicate that it will rise by 2035 from its present level of about 3% of GDP to almost 6%. This is a ballpark estimate, and it makes assumptions about the growth over time in the number of persons of different ages who will be over 65, medical spending at different ages for those over 65, and the rate of growth of GDP over this time period. The growth in the number of persons over age 65 is the only one of these quantities that can be forecast reasonably accurately. Despite this uncertainty about what actual spending will be, I have a couple of suggestions to slowdown the growth of Medicare spending. The first one is the easiest in principle to implement; namely to raise the age of eligibility for Medicare (and for social security as well) to age 70. Social security was introduced in the 1930s when life expectancy at age 65 was more than seven years below what it is now. Moreover, the quality of life after age 65 was also much lower at that time since men and women were generally already “old” at age 65. Although Medicare was not introduced until the late 1960s, both the quality and quantity of life have also increased rapidly since then- for example, life expectancy at age 65 has risen by five years. The more numerous and healthier men and women currently who reach age 65 should be encouraged to continue working for at least several more years- probably to age 70- instead of being encouraged to retire to collect social security benefits and Medicare payments. Those between ages 65-70 would remain in employer’s health insurance plans or buy individual insurance. In either case, they would have greater incentive to economize on their health spending.
Is the Safety Net Just Masking Tape? - It’s easy for liberals to explain away setbacks to programs and policies that they favor — ranging from infrastructure investment to food stamps to increased education budgets — as the result of the intransigence of the Republican Party, with its die-hard commitment to slashing government spending on nearly every front. But that explanation is too facile. Two years ago, Mike Konczal, a fellow at the Roosevelt Institute, opened a productive line of inquiry in a blog post called “Are We at the Completion of the Liberal Project?” Konczal described two approaches to the liberal state. In the first, “you would have the government maintaining full employment, empowering workers and giving them more bargaining power.” In the second, “you would have a safety net for those who fell through the cracks.” These two approaches, according to Konczal, should not be looked at as an either-or proposition, but as mutually reinforcing and interdependent: “I don’t believe those two can exist without each other. Without a strong middle and working class you don’t have natural constituencies ready to fight and defend the implementation and maintenance of a safety net and public goods. The welfare state is one part, complimenting full employment, of empowering people and balancing power in a financial capitalist society.” In practice, Konczal writes, the political left has abandoned its quest for deep structural reform — full employment and worker empowerment — and instead has “doubled-down” on the safety net strategy. The result, in his view, is “a kind of pity-charity liberal capitalism.”
Of Course the Safety Net Redistributes Income…That’s Why It Works: Many conservatives have attacked social insurance programs such as Social Security and Obamacare because they redistribute income from the rich to the poor, the young to the old, or from makers to takers. But there is nothing unusual about the fact that insurance programs redistribute income among participants. If they didn’t, it wouldn’t be insurance. This is what insurance does. It pools risk and distributes the losses across the participants in the program. Fire insurance, for example, pools the contributions of participants, and when somebody experiences a loss from fire the money is redistributed from those who did not have a fire to those who did. Everyone understands that the fees they pay provide this protection, and they don’t object when the pooled contributions are redistributed to cover losses. Social insurance programs are fundamentally the same. When we start out in life, nobody knows for sure who will end up unhealthy, or poor in old age. So we pool the risk of this happening in programs such as Social Security and health insurance, and there is subsequent redistribution from those who do well in life to the less fortunate. Why do people object to social insurance programs if they are just like fire insurance and other forms of risk pooling?
How Medicare Subsidizes Doctor Training -- My Economic View column on Sunday looked at medical residencies, the biggest bottleneck in the supply chain for doctors. Most of this “graduate medical education” training is subsidized by Medicare, for somewhat strange historical reasons sustained by both legislative inertia and the stakeholders who benefit from it. Here’s some detail about how the subsidies work. When Congress established Medicare in 1965, it set up payments to subsidize residencies “until the community undertakes to bear such education costs in some other way.” Exactly what that meant was unclear, notes Fitzhugh Mullan, a physician and health policy professor at George Washington University. After all, who is this “community,” and why would it voluntarily take over this financial responsibility if the federal government was already paying for it? In any case, in 1983, Medicare devised a new version of the training subsidy that has essentially carried over until today. The subsidy comes in two parts. The first is officially for the “direct” costs of training new doctors (like their salaries, benefits, and teaching costs). The second, larger part is officially supposed to pay for the “indirect” costs that hospitals and health care centers incur because trainees are expected to be slow, inefficient, and otherwise generally increase the cost of care.
Vital Signs: Businesses Brace for Benefits Bump - Health insurance costs will make companies sick next year. Two surveys done by regional Federal Reserve banks show benefit costs, especially health benefits, are the No. 1 issue for companies next year. The New York Fed found 85.2% of New York state manufacturers say benefit costs are a major problem for their firm, up from 79.2% saying that in April 2011 when the question was last asked. And 80.2% think benefits costs will be even more of a problem a year from now. The main benefit headache is healthcare costs. The Philadelphia Fed polled area manufacturers about expected changes in costs for 2014. Health benefits are expected to rise, on average, by 7.9%, dwarfing all other expected increases, including for energy and wages. While the surveys focus on manufacturing, the healthcare challenge probably extends to all types of business, and has implications for future consumer spending. Paying more for health insurance means businesses have less for pay raises that would support more household shopping.
Obamacare Seen As Making Coverage Worse For Some: Poll — Americans who already have health insurance are blaming President Barack Obama's health care overhaul for their rising premiums and deductibles, and overall 3 in 4 say the rollout of coverage for the uninsured has gone poorly. An Associated Press-GfK poll finds that health care remains politically charged going into next year's congressional elections. Keeping the refurbished HealthCare.gov website running smoothly is just one of Obama's challenges, maybe not the biggest. The poll found a striking level of unease about the law among people who have health insurance and aren't looking for government help. Those are the 85 percent of Americans who the White House says don't have to be worried about the president's historic push to expand coverage for the uninsured. In the survey, nearly half of those with job-based or other private coverage say their policies will be changing next year — mostly for the worse. Nearly 4 in 5 (77 percent) blame the changes on the Affordable Care Act, even though the trend toward leaner coverage predates the law's passage. Sixty-nine percent say their premiums will be going up, while 59 percent say annual deductibles or copayments are increasing. Only 21 percent of those with private coverage said their plan is expanding to cover more types of medical care, though coverage of preventive care at no charge to the patient has been required by the law for the past couple of years. Fourteen percent said coverage for spouses is being restricted or eliminated, and 11 percent said their plan is being discontinued.
Nearly 15000 Obamacare sign-ups didn’t reach insurers -- Enrollment paperwork for nearly 15,000 Obamacare customers who signed up via HealthCare.gov never made its way to insurance companies, the Department of Health and Human Services announced Saturday. The disclosure reflects the considerable problems the Obamacare website’s “back end” faced in corresponding with insurers throughout October and November, even as administration officials were working around the clock to improve the website’s “front end” and enable consumers to shop for insurance. Still, HHS emphasized that enrollment records are now reaching their destination far more successfully, noting that since the beginning of December, the number of missing forms has been “close to zero.” “These significant improvements are due to the technical fixes put in place by the end of November,” the department explained in a blog post. The records in question – called 834 transaction forms – are typically sent to insurance companies after a consumer enrolls in a plan through the Obamacare exchanges. HHS blamed the early problems in transmitting 834s on transactions that “were either not being generated, or had errors due to larger technical system issues." Insurance companies had previously complained that they were receiving duplicated forms and forms with missing or inaccurate data. In the blog post, HHS said they’re working closely with insurers to corroborate enrollees’ information. “We are double and triple checking all enrollment data across systems,” the department said. “This week, we securely sent data files to 300 issuers participating in the Federal Marketplace — and we’re reconciling 834s with the issuers.”
Market Participation, aka Shopping, as a Toll of Neoliberalism: Obamacare as Case Study - Yves Smith - Corey Robin, appalled by the complexity and difficulty of selecting Obamacare policies, made a fundamentally important point about neoliberalism: Aside from the numbers, what I’m always struck by in these discussions is just how complicated Obamacare is. Even if we accept all the premises of its defenders, the number of steps, details, caveats, and qualifications that are required to defend it, is in itself a massive political problem. As we’re now seeing…. In the neoliberal utopia, all of us are forced to spend an inordinate amount of time keeping track of each and every facet of our economic lives. That, in fact, is the openly declared goal: once we are made more cognizant of our money, where it comes from and where it goes, neoliberals believe we’ll be more responsible in spending and investing it. The dream is that we’d all have our gazillion individual accounts—one for retirement, one for sickness, one for unemployment, one for the kids, and so on, each connected to our employment, so that we understand that everything good in life depends upon our boss (and not the government)—and every day we’d check in to see how they’re doing, what needs attending to, what can be better invested elsewhere. Most days, we don’t have time to do any of that. We’re working way too many hours for too little pay, and in the remaining few hours (minutes) we have, after the kids are asleep, the dishes are washed, and the laundry is done, we have to haggle with insurance companies about doctor’s bills, deal with school officials needing forms signed, and more… And people like shopping, right? Well, I’m one of those people who hates shopping and regards it as a tax on my time, even in settings where effort has been made to make it pleasurable. By contrast, who enjoys buying financial products? Even in the best of circumstances, you are making a bet on your future in some way (what do I think the markets will do? How much of this risk should I insure). Unless you have nerves of steel or a crystal ball, it’s hard to suppress the feeling of anxiety that events can play out in a way that will prove your choice to have been a lousy one.
Who disapproves of Obamacare? - I was somewhat surprised by these numbers: Fifty-three percent of the uninsured disapprove of the law, the poll found, compared with 51 percent of those who have health coverage. A third of the uninsured say the law will help them personally, but about the same number think it will hurt them, with cost a leading concern. I wonder if any of this poll was conducted in Spanish, and if not whether that would have changed the results. I found this interesting too:Of the uninsured who said they were not likely to sign up by the deadline, fully half said it was because of the high cost. Twenty-nine percent said they planned to go without coverage because they object to the government’s requiring it, and 11 percent said they did not need health insurance. And this: Seventy-seven percent of the uninsured said they disapproved of the mandate, compared with 65 percent of those who already have health insurance.
As Many Uninsured Oppose Obamacare as Favor It - Yves Smith - The uninsured, which along with those with existing conditions, would seem to be the clearest beneficiaries of Obamacare, and were thus assumed by many to favor it. But a new poll shows that on the whole far more distrustful that the Administration likely expected. The New York Times gives the results of a new poll: Fifty-three percent of the uninsured disapprove of the law, the poll found, compared with 51 percent of those who have health coverage. A third of the uninsured say the law will help them personally, but about the same number think it will hurt them, with cost a leading concern. Mind you, disliking the law is not necessarily the same as not signing up: Still, nearly six in 10 uninsured said having insurance would make their own health better. And 56 percent said they were more likely than not to get insurance by March 31, the deadline to enroll in coverage or face a tax penalty under the law. Thirty-five percent said they were more likely to pay the penalty….. And nearly six in 10 said they had not researched insurance on the online marketplace, even though, based on the demographics of the sample, many probably qualify for free or subsidized coverage. Cost was the big reasons for expecting not to sign up; nearly half of the ones who gave negative signals cited it as the reason. And across all uninsured, only 10% expected Obamacare to make insurance cheaper (notice the confusion of insurance with health care, since the ACA almost assuredly will give them access to lower-cost insurance. But the question remains whether their all in health care costs are lower or not, given the typical high deductibles with low premium plans). Mind you, some of the people who are finding they can’t afford the plans are distraught.
The Big Money Bets on Obamacare - Paul Krugman - As Greg Sargent has been pointing out for some time, the startup troubles of Obamacare have divided both the general public and the political class into two different intellectual universes. On one side, Republicans — both the base and the political leadership — have decided that health reform is already a failure; that conviction is actually helping the leadership rein in some of the crazies, by telling them that now is the time to wait and let the political payoff from Obamacare’s collapse fall into their laps. On the other side, Democrats see a law that got off to a terrible start but is getting rapidly better. Which is right? There’s data showing a sharp rise in enrollments, but there are continuing problems with the back end, and then there are dueling anecdotes. It would be hard to assess all this objectively even if political passions weren’t running so high. But one group has a strong incentive to be objective — and also has a much better perspective on what’s really going on than any lay observer. Namely, the insurance industry. So the shoe we’ve all been waiting to see drop — or not — was the surge of advertising urging people buying insurance through the exchanges to buy from me, me, me. That shoe has just dropped, with $500 million of advertising spending now in the pipeline. Insurers think this is going to work.
The Real Reason Healthcare Insurance Companies Are Now Encouraging Obamacare Enrollment: Fear of a pro-public-option or pro-single-payer political juggernaut by Beverly Mann - Greg Sargent, Washington Post, this morning: I’ve expected this for some time, and here it is: The Wall Street Journal reports that insurance companies are set to unleash hundreds of millions of dollars in advertising to entice potential customers on to the exchanges created by Obamacare. As the Journal puts it: Insurers … are capitalizing on an unprecedented opportunity in a shifting health-care market. Some seven million Americans are expected to buy health coverage on the new consumer exchanges, where people can compare insurance plans side by side. Sargent goes on to say that these plans were long in the works but were delayed because of the dysfunction of the federal website. I assume that’s accurate, but elsewhere in Sargent’s column, in the form of two new polls are hints of why this project has taken on real urgency. One poll, by Pew, published today in USA Today, shows a dramatic drop in support for Obama and Obamacare among 18- to 29-year-olds, results similar to those in another recent poll. Undoubtedly, although this won’t occur to most pundits, this drop reflects fallout from the Snowden revelations and also anger at Obama’s less-than-progressive (and certainly less-than-energetic) agenda. But there also is this: Only 41% of members of this age group approve of “his signature health care policy, while 54% disapprove.” But also there is this, from the other poll released this morning, taken for the Associated Press:In the survey, nearly half of those with job-based or other private coverage say their policies will be changing next year – mostly for the worse. Nearly 4 in 5 (77 percent) blame the changes on the Affordable Care Act, even though the trend toward leaner coverage predates the law’s passage. Sixty-nine percent say their premiums will be going up, while 59 percent say annual deductibles or copayments are increasing.
Obamacare Death Spiral Looks Unlikely, Study Finds (Reuters) - A threat to America's health insurance overhaul has been that young people would not buy coverage in new marketplaces, possibly pushing the program into a disastrous spiral of falling enrollment and rising premiums. But this worst-case scenario is looking more far-fetched, according to a study by the Kaiser Family Foundation, which sees just slight increases in premiums in 2015 even though enrollment of younger people so far is well below the Obama administration's target. Preliminary figures suggest roughly a quarter of Americans signing up to buy insurance under the policy have been between the ages of 18 and 34, below the administration's target of roughly 40 percent. Their money is crucial for the program's success because it helps compensate for the higher costs of insuring older Americans, who tend to have more health problems. The sweeping 2010 healthcare overhaul, known as "Obamacare", which created online insurance exchanges across the country, limits how much insurers can charge older, sicker Americans compared with younger, healthier ones. This helps make insurance more affordable for older Americans who most need it, but it requires the young to pay more to subsidize the old. The hitch is that if fewer young people buy coverage for 2014 than private insurers
What Stronger Health Spending Growth Means for Obama -- Gross domestic product growth was much faster than previously estimated in the third quarter, partly because health care spending was revised sharply upward. Consumer spending on health care services grew at an annual pace of 2.7 percent last quarter, instead of 0.9 percent, as the Commerce Department had previously reported. This news represents a double-edged sword for the White House. On the one hand, the Obama administration has been promoting evidence that health care spending has been slowing, a fact it has attributed in part to the Affordable Care Act (which is, of course, debatable). Friday’s data release complicates that narrative a bit. “It’s still the case that both nominal and real health care spending has generally been slowing, but the slowing isn’t quite as pronounced after today’s revision,” said Michael Feroli, chief United States economist for JPMorgan Chase. But on the other hand, greater consumer spending of any kind can contribute to faster economic growth, which the United States desperately needs right now. The administration would probably prefer that consumers devote more spending to other goods and services (like clothing or restaurants) rather than health care, but perhaps it will take what it can get. In its public statements, the White House has also emphasized the decline in growth of health care prices, not just health care spending. The chart below shows the latest trends in health care costs, as measured by the medical care component of the consumer price index, versus the overall consumer price index. As you can see, health care price inflation has indeed fallen over time.
Utter Chaos: White House Exempts Millions From Obamacare’s Insurance Mandate, ‘Unaffordable’ Exchanges -- It’s hard to come up with new ways to describe the Obama administration’s improvisational approach to the Affordable Care Act’s troubled health insurance exchanges. But last night, the White House made its most consequential announcement yet. The administration will grant a “hardship exemption” from the law’s individual mandate, requiring the purchase of health insurance, to anyone who has had their prior coverage canceled and who “believes” that Obamacare’s offerings “are unaffordable.” These exemptions will substantially alter the architecture of the law’s insurance marketplaces. Insurers are at their wits’ end, trying to make sense of what to do next. As many as six million Americans who purchase health coverage on their own have seen their plans canceled, because they don’t comply with Obamacare’s newly-imposed regulations. On the other hand, the bungled rollout of the law’s healthcare.gov website has meant that only tens of thousands of Americans have been able to enroll in new coverage under the law. This means that by January 1, 2014, less people will have health coverage under Obamacare than before. The White House has been working hard to fix the problems with the exchanges, with modest success. Henry Chao, the deputy Chief Information Officer at the Centers for Medicare and Medicaid Services, testified to Congress in November that 30 to 40 percent of Obamacare’s exchange software had yet to be constructed. Most critically, the systems needed to pay insurers—and thereby enroll people in coverage—had not yet been built.
Changing the ACA on the fly - Two things in just the last day or so. First, no individual mandate for people whose plans were cancelled. Nick already covered the legality of this. I’m concerned about the policy implications. Namely the following:
- It’s difficult for insurance companies to predict who will sign up for insurance and how much they think it will cost to cover them. They spent a lot of time figuring this out for 2014. Every time the administration changes the rules, it changes their calculations. As Every time you make an exemption, you likely make the risk pool a bit more unhealthy. This will screw up the insurance company calculations.
- Insurers will likely want to widen the risk corridors. I don’t see how the Obama administration can say no to this. They’re the cause of the added risk. We, as tax payers, will pick up the cost for this.
- This also makes the political case for the mandate much weaker. If you’re going to say that people who are newly uninsured are a “hardship”, how do you respond to claims that people who have been uninsured for longer aren’t under a “hardship”? Is being uninsured a reason to be exempt from the mandate? If so, this whole thing is screwed.
The second development is that catastrophic plans are now available for people who had their plans cancelled recently. These types of plans are cheaper than others in the exchanges, but have limited benefits. They cover a limited number of primary care visits a year and some basic preventive stuff – but that’s it. You’re likely on the hook for everything else until you hit the out-of-pocket maximum. My thoughts:
Obama Repeals ObamaCare - It seems Nancy Pelosi was wrong when she said "we have to pass" ObamaCare to "find out what's in it." No one may ever know because the White House keeps treating the Affordable Care Act's text as a mere suggestion subject to day-to-day revision. Its latest political retrofit is the most brazen: President Obama is partly suspending the individual mandate. The White House argued at the Supreme Court that the insurance-purchase mandate was not only constitutional but essential to the law's success, while refusing Republican demands to delay or repeal it. But late on Thursday, with only four days to go before the December enrollment deadline, the Health and Human Services Department decreed that millions of Americans are suddenly exempt. Individuals whose health plans were canceled will now automatically qualify for a "hardship exemption" from the mandate. If they can't or don't sign up for a new plan, they don't have to pay the tax. They can also get a special category of ObamaCare insurance designed for people under age 30. So merry Christmas. If ObamaCare's benefit and income redistribution requirements made your old, cheaper, better health plan illegal, you now have the option of going without coverage without the government taking your money as punishment. You can also claim the tautological consolation of an ObamaCare hardship exemption due to ObamaCare itself.
Obamacare's Next Hurdle: Getting People To Pay - Healthcare.gov may or may not be fixed, depending on who one listens to (and if one reads the WSJ's, "Errors Continue to Plague Government Health Site" this morning, there is much more fixing left despite the administration's most sincere promises), but a greater issue is already looming: payment. "We have a bigger number of applicants than people who have paid," Aetna Chief Financial Officer Shawn Guertin said in an interview today in New York. "That’s a situation that I am a little bit worried about, that people will think they have completed the process but haven’t paid the premium yet." Whether Americans didn't realize there would be an actual payment involved in America's socialized healthcare system, or simply there is too much confusion over how the process is run, is irrelevant - the bottom line is that for whatever reason people are simply not paying their premiums. As Bloomberg reports, the disjointed process of having customers shop through the government-run marketplace and then pay insurers separately has created a risk that people who have chosen a plan won’t actually be covered Jan. 1. And if people don’t pay by Dec. 31, insurers may end up stuck with a disproportionate number of sicker and costlier customers. “You have to remember that many times we are dealing with low-income people,” . “They signed up and they certainly want the insurance, but do they have the money or have they changed their mind by Dec. 31? Nobody’s done this before.”
Advertising is Just One Small Cog in the Gaint Health Care Waste Machine - Insurance companies are going to spend about $300 million more on TV advertising next year mainly because of the new health care exchanges. From Washington Post: In all of 2012, health insurers spent $216 million advertising on local television stations. But that’s nothing compared to what they’re about to spend. According to trade association TVB, insurers will spend more than $500 million on local television ads in 2014. And that’s to say nothing of cable television ads and social media campaigns. This is a reminder of how wasteful it is to expand coverage via private exchanges. Only about 5-10 million people are probably going to sign up for coverage on the new exchanges this year. So the insurers are going to spend about $50 per new costumer on advertising plus the hundreds of million the government is also spending on behalf of their outreach, exchange operation, and navigators. Money that would not be spent if we simply expanded public insurance to the uninsured. Ultimately this spending is the equivalent 1-2 percent of what will be spent on exchange premiums next year and the cost will be passed on to regular people. Alone that isn’t much but this is only a small cog in the giant theft machine which is our private health care system. Premiums need to be several percent higher to cover the profit margins at private insurers and their exorbitant salaries. They also need to be higher to pay for huge administrative costs of having hundreds of different payers negotiating millions of different payment rates with thousands of different providers. Once all the many pieces are added together we are left with the most absurdly expensive health care system on earth
Hypocritical insurers accuse hospitals of conflict of interest -- Charity, it is said, begins at home. But as Tuesday's Wall Street Journal suggests, charity clearly ends with America's health insurance companies. As the Journal reports, insurers are battling charities and hospitals who have launched pilot programs to help pay for the health care premiums of lower-income Americans. But the carriers' campaign to prevent potentially sicker, more costly patients from becoming their customers isn't just cruel. As it turns out, the same insurers accusing hospitals of a conflict of interest are squeezing them using newly acquired billing services and increasingly limiting your choice of doctors to the physician practices they now own. As the Journal explained, charities in states like California have realized that small monthly stipends could enable those earning too much (that is, over 138 percent of the federal poverty level) to qualify for Medicaid to afford the purchase of subsidized insurance of the state health care exchange. And in the states which rejected the Medicaid expansion, hospitals which will be losing out on disappearing funds for treatment of the uninsured are fast concluding that helping them buy coverage will help their own bottom lines:
Solving the Shortage in Primary Care Doctors - Again and again, we hear that the country has too few doctors, particularly for primary care. And Obamacare is supposed to make the shortage much worse in the coming years as more Americans become insured and try to shoehorn themselves into already crowded medical offices. I had always assumed the culprit was medical school enrollment. But when I looked into those numbers, I found that they are actually increasing noticeably. Thanks to the opening of new medical schools and expanded admissions at existing ones, enrollment is projected to rise by 30 percent between 2002 and 2017, according to the Association of American Medical Colleges. It turns out that the real bottleneck is at the post-med-school step: residencies, those supervised, intensive, hazing-like, on-the-job training programs that doctors are required to go through before they can practice on their own. There has been little growth in residency slots; they totaled 113,000 in 2011-12, from 96,000 a decade earlier. Exactly why residencies have not increased faster is a subject of great debate in the health care industry. Hospitals, doctors and med students usually give the same explanation: Congress is too stingy. After all Congress, through Medicare, subsidizes the vast majority of residency slots, at $10.1 billion annually, or an average of $112,642 per resident per year. Obviously Washington is not keen on doling out more money for anything right now, especially not for Medicare. But there’s a bigger problem with that argument: It’s not clear that hospitals actually need taxpayer money to pay for more residents, because those residents might actually be turning a profit for those hospitals right now. It’s hard to know, though, because hospital accounting is so opaque.
Multivitamins won't boost health, waste of money: Researchers - Enough” with the multivitamins already. That’s the message from doctors behind three new studies and an editorial that tackled an oft-debated question in medicine: Do daily multivitamins make you healthier? After reviewing the available evidence and conducting new trials, the authors have come to a conclusion of “no.” “We believe that the case is closed -- supplementing the diet of well-nourished adults with (most) mineral or vitamin supplements has no clear benefit and might even be harmful,” concluded the authors of the editorial summarizing the new research papers, published Dec. 16 in the Annals of Internal Medicine. “These vitamins should not be used for chronic disease prevention. Enough is enough.” They went on to urge consumers to not “waste” their money on multivitamins. “The ‘stop wasting your money’ means that perhaps you're spending money on things that won't protect you long term,” editorial co-author Dr. Edgar Miller, a professor of medicine and epidemiology at Johns Hopkins Bloomberg School of Public Health in Baltimore, told CBS News’ chief medical correspondent Dr. Jon LaPook. “What will protect you is if you spend the money on fruits, vegetables, nuts, beans, low fat dairy, things like that ..exercising would probably be a better use of the money.”
The Selling of Attention Deficit Disorder - Severely hyperactive and impulsive children, once shunned as bad seeds, are now recognized as having a real neurological problem. Doctors and parents have largely accepted drugs like Adderall and Concerta to temper the traits of classic A.D.H.D., helping youngsters succeed in school and beyond. But Dr. Conners did not feel triumphant this fall as he addressed a group of fellow A.D.H.D. specialists in Washington. He noted that recent data from the Centers for Disease Control and Prevention show that the diagnosis had been made in 15 percent of high school-age children, and that the number of children on medication for the disorder had soared to 3.5 million from 600,000 in 1990. He questioned the rising rates of diagnosis and called them “a national disaster of dangerous proportions.” “The numbers make it look like an epidemic. Well, it’s not. It’s preposterous,” “This is a concoction to justify the giving out of medication at unprecedented and unjustifiable levels.” The rise of A.D.H.D. diagnoses and prescriptions for stimulants over the years coincided with a remarkably successful two-decade campaign by pharmaceutical companies to publicize the syndrome and promote the pills to doctors, educators and parents. With the children’s market booming, the industry is now employing similar marketing techniques as it focuses on adult A.D.H.D., which could become even more profitable.
New FDA Guidelines on Livestock Antibiotic Use: A Big Deal or Not? - Earlier this week, there was a lot of excitement (nay, elation) expressed over the new guidelines from the FDA on antibiotic use in production livestock situations (i.e., factory farms). It sounded like a huge thing. It sounded as if finally, the FDA was going to do something which would end up cleaning up the dynamic on large-scale factory farms so that regular usage of low dose antibiotics would be eliminated (and frankly, this is way after the horse, ahem, has long left the barn in terms of antibiotic-resistant bacteria being out in the population, but hey, what the heck). It’s all about antibiotic usage in feeds … to promote growth. Know what portion of the antibiotics in animal feeds?“… the amount of antibiotics used for growth promotion is minimal, explains Ron Phillips of the industry group Animal Health Institute. “Many people believe that all or most antibiotic use is for growth promotion,” says Phillips. “That is not the case. We estimate only 10-15 percent at best.” FDA Rules Won’t Reduce Antibiotic Use On Farms. The other thing is this: These are just ‘guidelines’ and are ‘voluntary’. Hello? So, the concept of public health benefit coming out of this — as in countries such as Denmark, where the general use of antibiotics in livestock feed and water is forbidden, though if an animal has a raging infection, a vet is allowed to Rx a specific dose of a specific antibiotic for a specific animal. But … it sounds good. This situation is not going to get any better until ALL antibiotics are taken out of livestock feeds and water, period, AND the general availability of antibiotics in farm supply stores like Tractor Supply (which has a refrigerator in every store with no lock on it, which is filled with large bottles of injectable antibiotics) is eliminated. Is that going to happen? I doubt it.
Accused of Harming Bees, Bayer Researches a Different Culprit — Bayer cares about the bees. Or at least that’s what they tell you at the company’s Bee Care Center on its sprawling campus here between Düsseldorf and Cologne. Outside the cozy two-story building that houses the center is a whimsical yellow sculpture of a bee. Inside, the same image is fashioned into paper clips, or printed on napkins and mugs. “Bayer is strictly committed to bee health,” said Gillian Mansfield, an official specializing in strategic messaging at the company’s Bayer CropScience division. There is, of course, a slight caveat to all this buzzy good will. Bayer is one of the major producers of a type of pesticide that the European Union has linked to the large-scale die-offs of honey bee populations in North America and Western Europe. They are known as neonicotinoids, a relatively new nicotine-derived class of pesticide. The pesticide was banned this year for use on many flowering crops in Europe that attract honey bees. Bayer and two competitors, Syngenta and BASF, have disagreed vociferously with the ban, and are fighting in the European courts to overturn it — leading one advocacy group, Corporate Europe Observatory, to call the three companies “the bee killers.” While others point at pesticides, Bayer has funded research that blames mites for the bee die-off. And the center combines resources from two of the company’s divisions, Bayer CropScience and Bayer Animal Health, to further study the mite menace.
EU says pesticides may harm human brains - Two neonicotinoid chemicals may affect the developing nervous system in humans, according to the EU. The European Food Safety Authority (EFSA) proposed that safe levels for exposure be lowered while further research is carried out. They based their decision on studies that showed the chemicals had an impact on the brains of newborn rats.One of the pesticides was banned in the EU last April amid concerns over its impact on bee populations. Neonicotinoids are "systemic" pesticides that make every part of a plant toxic to predators. They have become very popular across the world over the past two decades as they are considered less harmful to humans and the environment than older chemicals. But a growing number of research papers have linked the use of these nicotine-like pesticides to a rapid fall in bee numbers. Now EFSA, in a statement, says that it has concerns that two types of neonicotinoids, imidacloprid and acetamiprid, may "affect the developing human nervous system". They have proposed that guidance levels for acceptable exposure be lowered while further research is carried out. The decision has been based on a review of research carried out in rats. In the statement, EFSA said that the two neonicotinoids may "adversely affect the development of neurons and brain structures associated with functions such as learning and memory". Current guidelines, it went on, "may not be protective enough to protect against developmental neurotoxicity and should be reduced".
Bill Would Axe Corn Ethanol Mandate (Reuters) - A group of U.S. Senators introduced a bill on Thursday to eliminate the corn ethanol mandate but leave other elements of biofuels policy intact, arguing that current law raises the cost of food and animal feed and damages the environment. The bill, introduced by Dianne Feinstein, a California Democrat; Tom Coburn, an Oklahoma Republican; and eight cosponsors, faces an uphill battle as many lawmakers from agricultural states support the Renewable Fuel Standard that dictates rising volumes of ethanol made from grains, including corn, be blended into motor fuel. The bill supports development of advanced biofuels, including those made from soybean oil, grasses and trees, Feinstein said. But it would eliminate the mandate for corn-based ethanol, which currently represents the vast majority of biofuels produced in the United States. She said the corn mandate diverts a large proportion of the U.S. corn crop towards making fuel, raising animal feed and food prices. In the 2012 to ’13 marketing year, more than 4.6 billion bushels of corn was used for the production of ethanol and by-products, out of a drought-reduced total U.S. supply of 11.9 billion bushels, according to the U.S. Department of Agriculture. “I strongly support requiring a shift to low-carbon advanced biofuel, including biodiesel, cellulosic ethanol and other revolutionary fuels. But a corn ethanol mandate is simply bad policy,” Feinstein said in a statement.
China rejects fifth US corn cargo in a month, citing GMO strain - China has blocked a fifth cargo of US corn since mid-November after testing found a strain of genetically-modified (GMO) corn not yet approved for import. Three more cargoes may also be refused. A cargo of 59,100 tons was turned away on Tuesday in the eastern Chinese province of Zhejiang after quarantine officials found MIR 162 -- an insect-resistant GMO strain which the country’s agriculture ministry has yet to warrant, Reuters cited an official as saying. China, the world’s second largest corn consumer, has refused 180,000 tons of grain since mid-November. Observers believe it has less to do with the corn and more to do with other trade quarrels between the two countries. . Growing domestic corn surpluses may also explain some reticence to accept further US imports. Weak consumption from the animal feed industry looms large in China, as this year will likely yield a record corn harvest. Its corn output for 2013-2014 is expected to rise 5.9 percent to reach a new record for consumption.
Food (In)security: Are Farms The Next Terrorist Target? - In early 2002, United States Navy SEAL Team 3 stormed a cluster of caves in eastern Afghanistan. It was a known Al Qaeda storehouse; they expected guns, explosives, maybe even Osama bin Laden. Instead, the team found documents, hundreds of them, all planning a terrorist attack on the United States food supply. There were agriculture articles from American science journals, translated into Arabic. There were USDA documents. There was a comprehensive list of the most devastating livestock pathogens — foot-and-mouth disease (FMD), hog cholera, rinderpest. There was a separate rundown of crop diseases like soybean rust and rice blight. And, most alarmingly, there were training documents, detailing how to deploy these pathogens on farms. In the decade since the raid, this scare story has spread far and wide — in FBI trainings, at Congressional hearings on homeland security, in hawkish punditry. The details vary — sometimes it’s a small Navy SEAL team, other times it’s a full deployment of coalition forces. In some versions, the soldiers raided caves; in others it was an underground bunker or an Al Qaeda training camp. The document list varies, as does the year of the raid. But no matter the details, the takeaway message is the same: Our farms are targets
Banana Fungus, Insect Outbreak Threaten Global Supply - According to Scientific American, strains of a particular soil fungus -- Fusarium oxysporum f. sp. cubense, or Foc -- have struck a key variety of banana grown for export in Mozambique and Jordan. Scientists fear that if the banana fungus spreads further, the popular Cavendish banana could become critically threatened. The fungus, which has been found on several plantations, causes the incurable Panama disease, or Fusarium wilt, that rots bananas. In the 1950s, another strain of the banana fungus nearly wiped out the Gros Michel cultivar, once as common as the Cavendish variety. After the fungus decimated banana populations in Central and South America, producers switched to the Cavendish, which was resistant to the strain of fungus at the time. But scientists have long feared that the Tropical Race 4 strain of the fungus -- previously confined to areas of Asia and Australia -- would eventually spread around the world and wipe out the Cavendish supply, just as a previous strain did to the Gros Michel banana. "Given today's modes of travel, there's almost no doubt that it will hit the major Cavendish crops," With instances of the banana fungus recently popping up in the Middle East and southeast Africa, it seems it may not be long before Foc overtakes plantations in Latin America. "It only takes a single clump of contaminated dirt, literally, to get this thing rampaging across entire continents,"
Sinking Land Brings Calls for Pumping Alternative -- Amid a persistent drought, a growing population and a dwindling supply of surface water, much of Texas is searching for underground water resources. But a large swath of Texas — home to close to one-quarter of its population — is looking for water supplies anywhere but beneath its surface. A century of intense groundwater pumping in the fast-growing Houston metropolitan area has collapsed the layers of the Gulf Coast Aquifer, causing the land above to sink. The only solution is to stop pumping, a strategy that some areas are resisting. The geological phenomenon, unique to this part of Texas because of the makeup of the aquifer’s clay layers, is known as subsidence. Areas in and around Houston have sunk as much as 10 feet in 100 years, causing neighborhoods to flood, cracking pavements and even moving geologic faults that could lead to infrastructure damage. “It’s an upfront and personal issue when you’re on the coast and you see land loss,” said Mike Turco, who heads the subsidence districts responsible for addressing the problem in Harris, Galveston and Fort Bend Counties. “You have oil barracks that are out in Galveston Bay now.”
Hard truths about California's water future -- At the heart of California's vast and complex plumbing system, and the plan to re-engineer it with two tunnels under the Sacramento-San Joaquin River Delta, are two truths. The first is that failing to take any action at all will result in almost certain disaster. Climate change is altering the volume of annual Sierra snowpack that feeds the delta, sustains its fragile ecosystem and provides sufficient water to keep Central Valley crops growing and to quench the thirst of urban areas from the East Bay to Southern California. Levees, pumps and canals that were designed for yesterday's climate conditions cannot stave off environmental and economic collapse if precipitation levels drop or change form from snowfall to winter rain. The second truth is that none of the interests that have worked to craft the draft proposal released last week for public comment can get all the water it wants, because there simply is not enough of it. That's the whole point, and the central defining issue for much of California's history. To sustain the delta, much of the snowmelt and rainfall that moves down the Sacramento River must keep flowing to the San Francisco Bay in order to push back the brackish water trying to make its way inland. But restoration of the degraded delta, mandatory to protect endangered species as well as to keep the pumps online, won't happen by itself, and it must be paid for by customers who need to secure their Central Valley and Southern California supplies. There won't be enough water to keep urban users' rates from rising or to allow farmers to continue the historic overuse that has depleted valley groundwater and turned desert scrubland into orchards.
Climate change is scaring the fish due to acidified oceans -- At least one aspect of climate change makes even fish fretful. Ocean acidification – one of the consequences of an increasing level of carbon dioxide in the atmosphere – makes rockfish anxious, according to a newly published paper by a neuroscientist at Edmonton’s MacEwan University. “It’s actually very similar to a human being anxious at a very basic fundamental level,” said Trevor Hamilton. “[The fish are] afraid of any sort of stimuli that could be harmful.” Prof. Hamilton and his colleague, biologist Adam Holcombe, kept one group of fish in a tank with normal sea water and put a second group in a tank with sea water at levels of acidification expected in about 100 years. Both tanks were divided into black areas and white areas. In the normal tank, the fish more or less went about their business swimming freely between the two areas. But in the acidic tank, they tended to huddle in the dark area. “When the fish moved toward the dark side, that’s representative of them being more afraid,” said Prof. Hamilton. “We know that because when you give zebrafish, for example, drugs that in humans or other mammals would decrease anxiety, the zebrafish started exploring more.” The scientists were even able to figure out how the feeling of fear was created.The acidic water stimulated activity in a part of the fish’s neural system call the GABA receptor, which humans also have. As the GABA receptor struggled to restore electrochemical balance, it stimulated neural pathways, which created anxiety.
Study Adds to Arctic Warming, Extreme Weather Debate -- A new study for the first time found links between the rapid loss of snow and sea ice cover in the Arctic and a recent spate of exceptional extreme heat events in North America, Europe, and Asia. The study adds to the evidence showing that the free-fall in summer sea ice extent and even sharper decline in spring snow cover in the Northern Hemisphere is reverberating throughout the atmosphere, making extreme events more likely to occur.The study, published Sunday in the journal Nature Climate Change, is the first to find correlations between rapid Arctic warming and extreme summer weather events, since previous research had focused on the links between Arctic warming and fall and winter weather patterns. While the study adds to the body of evidence pointing to the outsized role the Arctic is playing in shaping weather patterns, it won't end the debate within the scientific community over whether and how what is happening in the Far North could be having such far-reaching impacts.There is virtually no controversy among climate scientists and meteorologists that massive changes have occurred in the Arctic environment during the past three decades, and that those changes are largely due to manmade greenhouse gas emissions.
World experiences hottest November in 134 years - The month of November was the hottest since record-keeping began in 1880, the US National Oceanic and Atmospheric Administration said Tuesday. The finding was based on globally averaged land and surface temperatures last month, NOAA said in a statement. “The combined average temperature over global land and ocean surfaces for November 2013 was record highest for the 134-year period of record,” NOAA said. The average temperature was 0.78 Celsius (1.40 Fahrenheit), above the 20th century average of 12.9 Celsius (55.2 Fahrenheit), NOAA said. It was also the 37th November in a row with worldwide temperatures above the 20th century average. In fact, the last 28 years have been warmer than normal, NOAA added.
We’re Still Losing Ice at the Poles - One of the key indicators and consequences of global warming is ice loss at the Earth’s poles. As the planet warms, on average and over time, every summer more ice melts. It refreezes in the winter, but again as temperatures rise, in general we’ll see less ice at any given time as compared to the year before. The situation for the two poles is different. In the north the Arctic ice floats on the ocean, and on the south the Antarctic ice is over land and sea. This means that they way they melt — how quickly, how much, even where specifically in those regions — are different. Still, the fact is the ice at both poles is melting. We’ve known this for quite some time. And some new data show it’s even worse than we thought. Measurements of Antarctic ice made by the European Space Agency’s CryoSat satellite show that it’s losing about 150 cubic kilometers (36 cubic miles) of ice on average every year just from the West Antarctica ice sheet alone. This is notably more than what had been previously estimated, and is likely to be more accurate due to the satellite’s better coverage and use of radar to measure ice thickness.The bulk of this loss is from melting glaciers, with their runoff flowing into the sea. This in turn is raising the sea level by about 0.3 millimeters per year (again, just from the West Antarctic ice sheet alone). It’s unclear if this increase in ice loss is due to faster thinning of the ice, or due to better coverage of the satellite in regions otherwise difficult to access. Either way, the ice is melting more rapidly than previously thought. This amount of loss is staggering; it’s equivalent to about a hundred billion tons. That’s equivalent in volume to a mountain about four kilometers (2.5 miles) high, roughly the size of a medium-size mountain in the Rockies. I’ll note that some people who deny global warming like to talk about ice in Antarctica increasing, not decreasing. This is at best misleading; the sea ice fluctuates every year, and has grown marginally recently, but this is tiny compared to the loss of land ice. Overall, Antarctica is losing ice, rapidly, with more melting every year.
This Antarctic Ice Shelf Will Be the Next to Collapse - Antarctica's crumbling Larsen B Ice Shelf is poised to finally finish its collapse, a researcher said Tuesday (Dec. 10) here at the annual meeting of the American Geophysical Union. The Scar Inlet Ice Shelf will likely fall apart during the next warm summer, said Ted Scambos, a glaciologist at the National Snow and Ice Data Center in Boulder, Colo. Scar Inlet's ice is the largest remnant of the vast Larsen B shelf still attached to the Antarctic Peninsula. (Another small fragment, the Seal Nunataks, clings on as well.) In the Southern Hemisphere's summer of 2002, about 1,250 square miles (3,250 square kilometers) of the enormous Larsen B Ice Shelf splintered into hundreds of icebergs. Scar Inlet is about two-thirds the size of the ice lost from Larsen B.Scambos and his colleagues at the NSIDC and in Argentina are tracking glaciers flowing into Scar Inlet so they can watch in detail how these ice rivers respond when their dams disintegrate. Many Antarctic glaciers have surged toward the sea after ice shelves collapsed, and leading scientists suggest that the shelves, the "tongues" of the glaciers that float on the ocean, act like dams. But Larsen B's disappearing act left little Scar Inlet holding back two big glaciers, and they seem to be tearing the ice shelf apart, Scambos said. Fractures and crevasses now incise the ice shelf.Scambos predicts that a warm summer — which causes widespread surface melting atop the ice shelf — will doom Scar Inlet. But the shelf's ice is so thin and fractured that it might collapse on its own, even without melting, Scambos said. "It's possible that if there's a summer warm enough to clear out the sea ice, it will simply fall apart," he said.
US Navy predicts summer ice free Arctic by 2016 -- An ongoing US Department of Energy-backed research project led by a US Navy scientist predicts that the Arctic could lose its summer sea ice cover as early as 2016 - 84 years ahead of conventional model projections. The project, based out of the US Naval Postgraduate School's Department of Oceanography, uses complex modelling techniques that make its projections more accurate than others.A paper by principal investigator Professor Wieslaw Maslowski in the Annual Review of Earth and Planetary Sciences sets out some of the findings so far of the research project:"Given the estimated trend and the volume estimate for October–November of 2007 at less than 9,000 km3, one can project that at this rate it would take only 9 more years or until 2016 ± 3 years to reach a nearly ice-free Arctic Ocean in summer. Regardless of high uncertainty associated with such an estimate, it does provide a lower bound of the time range for projections of seasonal sea ice cover." The paper is highly critical of global climate models (GCM) and even the majority of regional models, noting that "many Arctic climatic processes that are omitted from, or poorly represented in, most current-generation GCMs" which "do not account for important feedbacks among various system components." There is therefore "a great need for improved understanding and model representation of physical processes and interactions specific to polar regions that currently might not be fully accounted for or are missing in GCMs."
Faux Pause 2: Warmest November On Record, Reports NASA, As New Studies Confirm Warming Trend -- Last month saw the hottest global November surface temperature on record, according to the latest data from NASA. Earth’s surface temperature in °C for each November since 1880 (compared to base period, 1951-1980). Red line is smoothing with a 15-year filter. Now two new studies demolish the myth that warming — including surface warming — has not continued apace. Stefan Rahmstorf, Co-Chair of Earth System Analysis at the Potsdam Institute for Climate Impact Research, discusses the first paper at RealClimate: A new study by British and Canadian researchers shows that the global temperature rise of the past 15 years has been greatly underestimated. The reason is the data gaps in the weather station network, especially in the Arctic. If you fill these data gaps using satellite measurements, the warming trend is more than doubled in the widely used HadCRUT4 data, and the much-discussed “warming pause” has virtually disappeared. Cowtan and Way apply their method to the HadCRUT4 data, which are state-of-the-art except for their treatment of data gaps. For 1997-2012 these data show a relatively small warming trend of only 0.05 °C per decade – which has often been misleadingly called a “warming pause”….But after filling the data gaps this trend is 0.12 °C per decade and thus exactly equal to the long-term trend mentioned by the IPCC.And so the pause is faux. The second study also reveals “Global warming is unpaused and stuck on fast forward,” as environmental scientist Dana Nuccitelli explains at Skeptical Science:New research by Kevin Trenberth and John Fasullo of the National Center for Atmospheric Research investigates how the warming of the Earth’s climate has behaved over the past 15 years compared with the previous few decades. They conclude that while the rate of increase of average global surface temperatures has slowed since 1998, melting of Arctic ice, rising sea levels, and warming oceans have continued apace.
Global warming is unpaused and stuck on fast forward, new research shows - New research by Kevin Trenberth and John Fasullo of the National Center for Atmospheric Research investigates how the warming of the Earth's climate has behaved over the past 15 years compared with the previous few decades. They conclude that while the rate of increase of average global surface temperatures has slowed since 1998, melting of Arctic ice, rising sea levels, and warming oceans have continued apace. The widespread mainstream media focus on the slowed global surface warming has led some climate scientists like Trenberth and Fasullo to investigate its causes and how much various factors have contributed to the so-called 'pause' or 'hiatus.' However, the authors note that while the increase in global temperatures has slowed, the oceans have taken up heat at a faster rate since the turn of the century. Over 90 percent of the overall extra heat goes into the oceans, with only about 2 percent heating the Earth's atmosphere. The myth of the 'pause' is based on ignoring 98 percent of global warming and focusing exclusively on the one bit that's slowed. Nevertheless, the causes of the slowed global surface temperature increase present an interesting scientific question. In examining changes in the activity of the sun and volcanoes, Trenberth and Fasullo estimated that they can account for no more than a 20 percent reduction in the Earth's energy imbalance, which is what causes global warming. Thus the cause of the slowed surface warming must primarily lie elsewhere, and ocean cycles are the most likely culprit. Trenberth and Fasullo found that after the massive El Niño event in 1998, the Pacific Ocean appears to have shifted into a new mode of operation. Since that time, Trenberth's research has shown that the deep oceans have absorbed more heat than at any other time in the past 50 years.
Cows’ Role in Global Warming Seen Overlooked in Climate Talks - Cattle and other ruminants are probably the biggest human-related source of methane, a gas adding to global warming, and climate negotiators have paid too little attention to livestock, a team of researchers said. Cows, sheep, goats and buffalo produce “copious amounts” of methane in their digestive systems, Oregon State University wrote in an online press release, citing analysis published in the journal Nature Climate Change today. One of the most effective ways to cut the gas would be to reduce the global population of ruminant livestock, the university said. Ruminants, which ferment plants in a specialized stomach before digestion, are estimated to be the largest single human-related source of methane, with greenhouse-gas emissions from sheep and cattle 19 to 48 times higher than beans or grains per pound of food produced, according to the report. “Reducing demand for ruminant products could help achieve substantial greenhouse gas reductions in the near-term,” Helmut Haberl of Austria’s Institute of Social Ecology, a study co-author, was cited as saying in the statement. Lowering demand would be “a considerable political challenge,” he said. The number of ruminant livestock in the world has risen 50 percent in the past 50 years to about 3.6 billion animals, according to the report. About a quarter of the Earth’s land area is used for grazing, mostly cattle, sheep and goats.
Expanding the energy economy in the name of public health - Speaker after speaker at the Nobel Week Dialogue emphasized that one of the biggest challenges of the upcoming decades will be bringing more of the world's population into the energy economy, providing them with access to electricity and the other benefits that can accompany it, like refrigeration for food and medical supplies. The benefits don't stop there; Richenda Van Leeuwen of the UN Foundation noted that simply having access to lighting in the developing world can increase family income by about 15 percent. But it also matters how you get that energy. Van Leeuwen also noted that the indoor air pollution created by burning dirty fuels like wood and coal kills more people each year than malaria. The World Health Organization backs this up, putting the figure at two million deaths each year. The illnesses caused by this pollution can easily offset the 15 percent economic gain mentioned above through a combination of medical costs and lost productivity. Electricity would be an obvious solution to this problem, but how you get that electricity matters. As we mentioned earlier, building or expanding an electric grid may take years where it's actually an option; direct power and microgrids may make more sense for the immediate future. And even where a grid is possible, large-scale fossil fuel facilities create their own problems. Turning to the WHO again, we see that urban air pollution kills 1.3 million people a year, primarily in middle-income countries, where the pollution is often a product of fossil fuels (partly power generation, partly transportation).
How Much Nature Do We Have to Use? - If you want to grow your savings and avoid going into financial debt, you need to spend your money no faster than you earn it. To do this, you need to know exactly how much money you make and spend over a given period, and compare the two. Similarly, if you want to ensure that you are not overusing ecological assets—which provide the ecological services on which all human activities, including the economy, depend—you need to know how productive these assets are, and the rate at which you use them. Biocapacity, a measure of ecological productivity, reflects the rate at which ecosystems renew and regenerate. Most fundamentally, it encompasses the biomass useful to humans, including renewable resources like food, fiber and timber, and waste absorptive services, such as sequestering carbon from burnt fossil fuel. Biocapacity can be compared with the rate at which you are using these ecological services—your “Ecological Footprint.” “You” could be an individual, a country or even humanity as a whole. The comparison between the two figures—your Footprint and your territory’s biocapacity—shows whether you are living within your territory’s ecological means or exceeding them. If the latter, you are either importing renewable resources from elsewhere, depleting your own ecological assets by harvesting them faster than they are replenished or using the global commons. At a global scale, because there is nowhere else to obtain renewable resources, a biocapacity deficit means depleting ecosystems and/or dumping excess carbon into the atmosphere, where it then accumulates. Either option is obviously unsustainable—thus, the importance of knowing when you are exceeding capacity.
The Climate Change Scorecard - Until relatively recently, our burning of fossil fuels and spewing carbon dioxide into the atmosphere represented such a slow-motion approach to end times that we didn’t even notice what was happening. Only in the 1970s did the idea of global warming or climate change begin to penetrate the scientific community, as in the 1990s it edged its way into the rest of our world, and slowly into popular culture, too. Still, despite ever more powerful weather disruptions -- what the news now likes to call “extreme weather” events, including monster typhoons, hurricanes, and winter storms, wildfires, heat waves, droughts, and global temperature records -- disaster has still seemed far enough off. Despite a drumbeat of news about startling environmental changes -- massive ice melts in Arctic waters, glaciers shrinking worldwide, the Greenland ice shield beginning to melt, as well as the growing acidification of ocean waters -- none of this, not even Superstorm Sandy smashing into that iconic global capital, New York, and drowning part of its subway system, has broken through as a climate change 9/11. Not in the United States anyway. We’ve gone, that is, from no motion to slow motion to a kind of denial of motion. And yet in the scientific community, where people continue to study the effects of global warming, the tone is changing. It is, you might say, growing more apocalyptic. Just in recent weeks, a report from the National Academy of Scientists suggested that “hard-to-predict sudden changes” in the environment due to the effects of climate change might drive the planet to a “tipping point.” Beyond that, “major and rapid changes [could] occur” -- and these might be devastating, including that “wild card,” the sudden melting of parts of the vast Antarctic ice shelf, driving sea levels far higher.
Climate Change Could Make Planet Unlivable For Humans - Here’s a story to brighten your day, all these political problems could become moot – because humans will all be dead. Perhaps its worth noting that the worst case scenario is not rising sea levels that sink Florida (insert joke here) but an all out wrecking of the climate that humans can survive in. We can all kill ourselves without even firing off all those nuclear weapons at each other. … a set of perfectly serious scientists—not the majority of all climate scientists by any means, but thoughtful outliers—who suggest that it isn’t just really, really bad; it’s catastrophic. Some of them even think that, if the record ongoing releases of carbon dioxide into the atmosphere, thanks to the burning of fossil fuels, are aided and abetted by massive releases of methane, an even more powerful greenhouse gas, life as we humans have known it might be at an end on this planet. In the methane scenario rather than a more gradual change the climate would quickly transform into a hellscape and there would be a “point of no return” making those alterations permanent.Methane exists in the arctic areas now being melted by rising carbon dioxide levels which is compounding the problem. In the atmosphere, methane is a greenhouse gas that, on a relatively short-term time scale, is far more destructive than carbon dioxide (CO2). It is twenty-three times as powerful as CO2 per molecule on a 100-year timescale, 105 times more potent when it comes to heating the planet on a twenty-year timescale—and the Arctic permafrost, onshore and off, is packed with the stuff. “The seabed,” says Wadham, “is offshore permafrost, but is now warming and melting. We are now seeing great plumes of methane bubbling up in the Siberian Sea…millions of square miles where methane cover is being released.”The rapid temperature and climate change brought about by the methane could, in theory, be an extinction event. Human society could not reasonably adapt in time leading to a catastrophic breakdowns and perhaps even asphyxiation due to the new climate not being breathable.
Wind Power Rivals Coal With $1 Billion Order From Buffett - The decision by Warren Buffett’s utility company to order about $1 billion of wind turbines for projects in Iowa shows how a drop in equipment costs is making renewable energy more competitive with power from fossil fuels. Turbine prices have fallen 26% worldwide since the first half of 2009, bringing wind power within 5.5% of the cost of electricity from coal, according to data compiled by Bloomberg. MidAmerican Energy Holdings Co., a unit of Buffett’s Berkshire Hathaway, yesterday announced an order for 1,050 megawatts of Siemens AG (SIE) wind turbines in the industry’s largest order to date for land-based gear.Wind is the cheapest source of power in Iowa, and the deal indicates that turbines are becoming profitable without subsidies, according to Tom Kiernan, chief executive officer of the American Wind Energy Association trade group. That’s a boost for suppliers including Siemens, General Electric and Vestas Wind Systems, and a threat to coal miners such as Peabody Energy Corp. “If Congress were to remove all the subsidies from every energy source, the wind industry can compete on its own,” Kiernan said at a press conference at a Siemens factory in Fort Madison, Iowa, yesterday, when the order was announced.
Japan Passes Energy Sector Reform in Wake of Fukushima - The Fukushima nuclear crisis certainly had profound implications for Japan. In November 2013, Japan’s lower house and upper house successively passed legislation to start electricity sector reform in 2015. Nuclear energy, which used to account for 30 percent of Japan’s electric power, was discarded after the earthquake and Fukushima incident, leading to energy price hikes (see graph below). The new bill, designed to break up monopolies, curb electricity prices and facilitate the development of renewable energy through a series of liberal reforms, is the child of the Fukushima nuclear crisis. The reform plan consists of three stages. The bill in question provides the legal background for the first stage of reform – the creation of a national grid company in 2015. This entity, after merging different regional grids, will be authorized to instruct power companies to supply electricity to each other when needed to overcome supply shortages. This reform emphasizes electricity transfer among regions, making sure that power shortages during the Fukushima incident would not happen again. The second and third stages of reform seek to liberalize the sale of electricity to households and strip the major power firms of power transmission and distribution functions. The new bill’s supplementary provision included a plan to enact bills in 2014 and 2015 to stipulate these steps of reform.
Dozens of Sailors From USS Ronald Reagan Suffering From Cancer After Japan Earthquake Assistance - Over 50 Sailors who served on the USS Ronald Reagan are Suffering from Thyroid Cancer, Leukemia, and Brain Tumors after participating in Humanitarian assistance during the Japanese earthquake of 2011. During the Fukushima Nuclear rescue efforts, sailors onboard the USS Ronald Reagan and apart of the battle group that responded to the disaster, were exposed to high levels of radioactive material while afloat off the East coast of Japan. Crew members in their mid-20′s from the aircraft carrier USS Ronald Reagan are coming down with all sorts of radiation-related illnesses after being deployed less than 3 years ago to assist with earthquake rescue operations off the coast of Japan in 2011. It looks as though the onboard desalinization systems that take salt out of seawater to make it drinkable, were taking-in radioactive water from the ocean for the crew to drink, cook with and bath-in, before anyone realized there was a massive radiation spill into the ocean.
Tepco lost the layout drawing of pipes and drains in Fukushima plant / Office ruined and entirely contaminated - The layout drawings of pipes and drains and other important documents of Fukushima nuclear plant were lost, according to Tepco. Tepco’s vice president Aizawa and Fukushima chief Ono stated that in the press conference of 12/11/2013. The pipe / drain maps and other important documents were kept in the management office in Fukushima nuclear plant. However because the office was significantly damaged and also contaminated, still they can’t take out those documents. Some of those documents are also too contaminated to take out. Fukushima nuclear plant was designed decades ago. Even the vice presidents and Fukushima chief cannot comprehend the entire structure of the facility without the material. Tepco doesn’t have the actual plan to take those documents out yet.
Japan lacks decommissioning experts for Fukushima - Japan is incapable of safely decommissioning the devastated Fukushima nuclear plant alone and must stitch together an international team for the massive undertaking, experts say, but has made only halting progress in that direction. Unlike the U.S. and some European countries, Japan has never decommissioned a full-fledged reactor. Now it must do so at the Fukushima Dai-Ichi plant. Three of its six reactors melted down after the 2011 earthquake and tsunami, making what is ordinarily a technically challenging operation even more complex. The cloud over Japan's capacity to get the decades-long job done has further undermined the image of the nuclear industry with the public. Opinion surveys show a majority of Japanese are opposed to restarting 50 reactors that were put offline for safety and other checks in the aftermath of the disaster. Japan has been forced to import oil and gas to meet its power needs, burdening its already feeble economy. "Even for the U.S. nuclear industry, such a cleanup and decommissioning would be a great challenge," Decommissioning a nuclear power plant normally involves first bringing the reactor cores to stable shutdown, and then eventually removing them for long-term storage. It is a process that takes years. Throughout, radiation levels and worker exposure must be monitored.
Japanese gov’t to pay more for Fukushima cleanup - Japan's government announced Friday that it will increase the amount of money it's providing to the operator of the crippled Fukushima nuclear plant to step up cleanup and reconstruction efforts. The interest-free loans provided to Tokyo Electric Power Co. will be increased to 9 trillion yen ($90 billion), up from 5 trillion yen, according to government-adopted guidelines. The government also said it would try to recoup 3.6 trillion yen through the sale of TEPCO shares or other schemes under the state-backed fund organization for nuclear accidents. Originally, TEPCO was to be liable for all costs stemming from the 2011 meltdowns at the Fukushima Dai-ichi plant. But in September, the government decided to step in and provide financial help after contaminated water leaks and other mishaps triggered public concern about TEPCO's ability to manage the situation. The government's draft supplementary budget through March 2014 allocates nearly 48 billion yen ($480 million) for measures to deal with contaminated water leaks and storage of radioactive water at the plant, as well as the decommissioning of its three melted reactors. Additional cleanup projects are expected to be funded through a national public works budget, local media reports say. The decommissioning of Fukushima Dai-ichi's three wrecked reactors is expected to take decades and require expertise from around the world.
Radiation Effects In U.S. From Japan Nuke Accident -- Radiation reaching the United States from the nuclear meltdowns in Fukushima, Japan is causing significant harm; affecting newborn Human babies in California, Pacific Ocean sea life, and even inland wild life. Radiation is causing massive die-offs of sea life as well as mammals, birds and reptiles inland. High percentages of inland animals that are not already dead are losing their fur, bleeding from lesions all over their bodies and failing to reproduce. Radiation contamination of sea food is already confirmed and contamination of the inland food supply is now taking place as rain carries radiation from the Pacific ocean to inland farms. U.S. Government propagandists are claiming everything is all right - but they aren't even monitoring radiation levels - while scientists outside the government are warning the worst is yet to come. Newly released government projections (contained in this article) show parts of Hawaii, Alaska and the entire west coast of North America may become uninhabitable due to radioactive Cesium-137 making its way toward us in the Pacific.
Powder River Basin Coal on the Move - The broad high prairie of eastern Wyoming and southern Montana was once the bottom of a shallow sea, a rich subtropical swampland for millions of years. Layers of plants began forming peat beds 60 million years ago, later to be buried and compressed into bituminous coal strata. The erosion eventually left coal seams only a few feet beneath the land surface of what today is called the Powder River Basin. No other coal seam on the planet is so big, so close to the surface, and so cheap to mine, Today the massive deposits, enough to light the United States almost into the 23rd century, have become the center of a regional – and increasingly national – debate: Should this resource continue to be developed, how will it get to market and what is that market? The coal is so cheap that companies see profit in shipping it west via vast trains, a half-mile or more long, then clear across the Pacific Ocean to meet Asia's seemingly insatiable demand. There is also concern over the role coal plays in global warming and health impacts. Coal is the "dirtiest" fossil fuels, emitting mercury, nitrogen oxides, sulfur – and 2.5 tons of carbon dioxide for every ton of ore burned. Natural gas emits about half as much of the greenhouse gas. According to the Energy Information Agency, coal is source of 44 percent of global energy-related CO2 emissions.
Months After Banning Fracking, France Now Has A Carbon Tax - The French Parliament on Thursday adopted a budget for 2014 which includes a tax on carbon emissions from gas, heating oil and coal, according to a report in Platts. The money derived from the tax — which largely targets transport fuels and domestic heating — will be used to reduce emissions through increased installation of renewable energy throughout the country, according to the report. The move is projected to raise €4 billion, or $5.5 billion, per year by 2016, which can then spent on tax breaks for the wind and solar power industries. “Its operation is simple: part of domestic consumption taxes on fuels and fossil fuels will be based on CO2 emissions given off by their use,” Prime Minister Jean-Marc Ayrualt said when introducing the proposed tax in September, noting the tax will affect the petrol, diesel, coal, natural gas, and heavy fuel oil industries. “Throughout this transition, the Government will pay attention to the situation of the French, especially the poorest, who often worry about these changes.” According to Platts, carbon will be taxed at a rate of 7 euros per tonne emitted in 2014, and will rise to 14.5 euros per tonne in 2015. The rate will again rise in 2016 to 22 euros per tonne emitted. President Francois Hallande also pledged in September to reduce the country’s use of fossil fuels by 30 percent by 2030, and by 50 percent by 2050.
UK to Launch Fracking Bonanza - The British government is preparing to offer up fracking licenses across some two-thirds of the UK’s entire territory for shale oil and gas exploration by next summer as London eyes the drilling of over 2,800 new wells. The shale push would have the potential to supply about 25% of the UK’s annual gas needs and create up to 32,000 jobs, according to a government-commissioned report by engineering giant Amec.A new map published by the British government on Tuesday shows that shale gas exploration licenses will be made available for almost every county in England on a 37,000-square-mile chunk of territory that stretches from the center of Scotland to the south coast. Companies will be able to apply for the new licenses next summer, but there won’t be an immediate drilling bonanza due the permitting process that follows. Currently, there are 176 exploration license areas covering 7,300 square miles in the UK—mostly in Lancashire, Cheshire, Yorkshire and Sussex--and once the new licenses are offered up, only the county of Cornwall will be excluded. Earlier this year, the British Geological Survey estimated that a large area in the center of the country could contain around 1,300 trillion cubic feet (36.8 trillion cubic meters) of shale gas in place, even a small fraction of which could meet local demand for decades.
What Does Shell’s Decision to Cancel GTL Plant Say about US Shale Gas Boom? -- When Royal Dutch Shell pulled the plug on its U.S. gas-to-liquids project recently, the company offered the same explanation it used when it shut down its oil shale project earlier this year: Shell sees better opportunities elsewhere. This explanation--much like the I'm-resigning-to-spend-more-time-with-my-family explanation--tends to deflect questions about why things aren't working out. What's not working out for Shell is a planned $20 billion plant in Louisiana designed to turn natural gas into diesel, jet fuel, lubricants and chemical feedstocks, products typically produced by oil refineries. The plug was pulled, however, while the project was still in the planning stage. Shell did actually say a little more about why it is abandoning the project in this almost inscrutable piece of corporate prose: Despite the ample supplies of natural gas in the area, the company has taken the decision that GTL is not a viable option for Shell in North America, at this time, due to the likely development cost of such a project, uncertainties on long-term oil and gas prices and differentials, and Shell’s strict capital discipline. Now, here's the same paragraph translated into simple English: The plant is going to cost a lot more to build than we thought it would. Natural gas prices are going up and could easily make it uneconomical to produce diesel and jet fuel from natural gas when compared to making them from oil. And, we don't have unlimited funds to spend on everything we think of just to see if it works.
Why California will Never Fulfill its Shale Potential - There was an important study released by the Post Carbon Institute last week that gives us an insight into how long our great shale oil bonanza —or more likely, bubble— is going to last. As you might suspect, the thrust of the new report is bad news so we are unlikely to ever read much about it in the mainstream media, which continues to tell us about the bright energy-rich future ahead. By now we should all know about the technological wonder of “fracking” that has raised America’s oil production by over 2 million barrels a day (b/d) in the last few years and has reversed the decline of our natural gas production. The speed with which this has happened has been amazing and shows that if oil prices get high enough (oil has risen from $20 to $100+ a barrel in the last decade), then we can have all the oil we will ever want. Rapid increases in production, however, mean that the faster we use up something the sooner will come the day when production starts to decline—and that day may not be very far away. In the case of North Dakota, new drilling seems to be concentrating in four counties, known as sweet spots, which may be the only places where it is profitable to drill at today’s prices. As we are already extracting roughly a million barrels of shale oil a day from both North Dakota and Texas, the future of the industry was thought to be in California. Of course, anybody with the most rudimentary knowledge of geology should know that the earth under California and under the American Midwest are very different places. Remember the San Francisco earthquake, the San Andreas Fault, and that giant tectonic plate that disappears under California.
Pennsylvania Supreme Court Says It’s Unconstitutional For Gas Companies To Frack Wherever They Want - Some major parts of Pennsylvania’s two-year-old Marcellus Shale drilling law are unconstitutional, the state’s Supreme Court decided Thursday. As the Pittsburgh Post-Gazette reports, the court voted 4 – 2 that a provision that allowing natural gas companies to drill anywhere, regardless of local zoning laws, was unconstitutional. Seven municipalities had challenged the shale drilling law, known as Act 13, that required “drilling, waste pits and pipelines be allowed in every zoning district, including residential districts, as long as certain buffers are observed.”The Court said Act 13 “fundamentally disrupted” the expectations of Pennsylvania residents living in residential zones, and that the provision wasn’t in line with the constitution or Pennsylvania’s Environmental Rights Amendment. “To describe this case simply as a zoning or agency discretion matter would not capture the essence of the parties’ fundamental dispute regarding Act 13,” the ruling read. “Rather, at its core, this dispute centers upon an asserted vindiction of citizens’ rights to quality of life on their properties and in their hometowns, insofar as Act 13 threatens degradation of air and water, and of natural, scenic and esthetic values of the environment, with attendant effects on health, safety and the owners’ continued enjoyment of their private property.” “Now we can keep industrial activities away from our school and residences, and there’s been more and more of a push by the industry to locate closer to the residential areas.”
Chemicals Found In Water At Fracking Sites Linked To Infertility, Cancer - An analysis of water samples from hydraulic fracturing, or ‘fracking,’ sites found the presence of hormone-disrupting chemicals, according to a new study published Monday in the journal Endocrinology. “With fracking on the rise, populations may face greater health risks from increased endocrine-disrupting chemical exposure,” senior author Susan Nagel told The LA Times. The study tested surface water and groundwater samples in Garfield County, Colorado — one county at the center of the U.S. fracking boom — and found elevated levels of endocrine-disrupting chemicals, or EDCs. The chemicals have been linked to infertility, birth defects, and cancer. Dr. Meg Schwarzman, associate director of the Berkeley Center for Green Chemistry at UC Berkeley, told The LA Times that “even low levels of anti-estrogenic or anti-androgenic activity could potentially alter development in ways that are meaningful.” The researchers gathered samples from five sites where there have been natural gas production spills over the last six years and compared those to control sites where there is no fracking activity. The fracking sites “exhibited more estrogenic, anti-estrogenic, or anti-androgenic activities than reference sites with limited nearby drilling operations,” leading researchers to conclude that “natural gas drilling operations may result in elevated EDC activity in surface and ground water.” The first study to show the link between fracking and endocrine-disrupting activity, Nagel said the findings are “something the country should take seriously.” Of the 750 chemicals that have been reported to be used in fracking operations, more than 100 are known or suspected to be endocrine-disrupting, according to MedPage Today.
Statement by concerned health professionals of New York in response to a new study on hormone-disrupting contaminants in Colorado near fracking drilling sites - Of the 700-plus chemicals that can be used in drilling and fracking operations, more than 100 are known or suspected endocrine disruptors. Unique among toxic agents, endocrine-disrupting chemicals (EDCs) interfere with hormonal signals, are biologically active at exceedingly low concentrations, and, when exposures occur in early life, can alter pathways of development. In a two-part study published on December 16 in the journal Endocrinology, a team of researchers led by Susan Nagel at the University of Missouri reported a variety of potent endocrine-disrupting properties in twelve chemicals commonly used in drilling and fracking operations. The team also documented potent endocrine-disrupting activity in ground and surface water supplies collected from heavily drilled areas in Garfield County, Colorado, where fracking chemicals are known to have spilled. The levels of chemicals in these samples were sufficient to interfere with the response of human cells to male sex hormones, as well as estrogen. Five samples taken from the Colorado River itself showed estrogenic activity. The catchment basin for this drilling-dense area, the Colorado provides water to 30 million people.These results, which are based on validated cell cultures, demonstrate that public health concerns about fracking are well-founded and extend to our hormone systems. The stakes could not be higher. Exposure to EDCs has been variously linked to breast cancer, infertility, birth defects, and learning disabilities. Scientists have identified no safe threshold of exposure for EDCs, especially for pregnant women, infants, and children.
Oilsands Tailings Ponds Released Into Rivers? Industry, Governments Discuss -- Oilsands producers are talking with the federal and Alberta governments about conditions under which water from the industry's tailings ponds could be released into the environment. Officials say releases would only involve treated water and wouldn't happen until the end of a mine's life. Environmentalists are watching the discussions closely and warn that quality standards for released tailings water should be high. Alberta has a zero discharge policy for the oilsands. No water affected by processing is allowed back into the Athabasca River and even rain that falls on developed sites must be collected and stored. Most of that water is kept in tailings ponds. The ponds — covering 170 square kilometres with a toxic blend of hydrocarbons, silt, salts and heavy metals — have been a lingering headache for the industry. Alberta's energy regulator has already had to relax on enforcing regulations about cleaning up the ponds after companies pleaded they would simply be unable to meet their targets. But as the province develops new tailings regulations, there is general acknowledgment that something will have to be done with the water currently filling the ponds once contaminants have been removed and stored at the bottom of so-called end-pit lakes.
What A Year: 45 Fossil Fuel Disasters The Industry Doesn’t Want You To Know About - While coal, oil, and gas are an integral part of everyday life around the world, 2013 brought a stark reminder of the inherent risk that comes with a fossil-fuel dependent world, with numerous pipeline spills, explosions, derailments, landslides, and the death of 20 coal miners in the U.S. alone. Despite all this, our addiction to fossil fuels will be a tough habit to break. The federal Energy Information Administration in July projected that fossil fuel use will soar across the world in the come decades. Coal — the dirtiest fossil fuel in terms of carbon emissions — is projected to increase by 2.3 percent in coming years. And in December, the EIA said that global demand for oil would be even higher than it had projected, for both this year and next. Here is a look back at some of the fossil fuel disasters that made headlines in 2013, along with several others that went largely unnoticed.
BP, Chevron Accused Of Illegally Dumping Toxic Radioactive Drilling Waste Into Louisiana Water - The Louisiana parish of Plaquemines is taking on a group of oil and gas giants including BP and Chevron for allegedly dumping toxic waste — some of it radioactive — from their drilling operations into its coastal waters, according to a lawsuit removed to federal court on Thursday. Plaquemines Parish is claiming the companies violated the Louisiana State and Local Coastal Resources Management Act of 1978 by discharging oil field waste directly into the water “without limitation.” Worse, the companies allegedly failed to clear, revegetate, detoxify or restore any of the areas they polluted, as required by state law. The oil and gas companies’ pollution, along with their alleged failure to adequately maintain their oilfields, has caused significant coastal erosion and contaminated groundwater, the lawsuit said. The lawsuit is just one of nearly 30 that were filed in November by both Plaquemines and Jefferson parishes, targeting dozens of energy companies and their contractors they claim helped destroy and pollute coastal areas.Plaquemines’ suit says BP and Chevron should have known that the oilfield wastes, referred to as “brine,” contained “unacceptable and inherently dangerous” levels of radioactive materials called Radium 226 and Radium 228. Long-term exposure to radium increases the risk of developing several diseases, including lymphoma, bone cancer, leukemia and aplastic anemia, according to the EPA.
Study links BP oil spill to dolphin deaths -- US government scientists have for the first time connected the BP oil disaster to dolphin deaths in the Gulf of Mexico, in a study finding direct evidence of toxic exposure. The study, led by scientists from the National Oceanic and Atmospheric Administration, found lung disease, hormonal abnormalities and other health effects among dolphins in an area heavily oiled during the BP spill. The diseases found in the dolphins at Barataria Bay in Louisiana – though rare – were consistent with exposure to oil, the scientists said. "Many disease conditions observed in Barataria Bay dolphins are uncommon but consistent with petroleum hydrocarbon exposure and toxicity," the scientists said. Half of the dolphins were given a guarded prognosis, and 17% were expected to die of the disease, the researchers found. "I've never seen such a high prevalence of very sick animals – and with unusual conditions such as the adrenal hormone abnormalities," Lori Schwake, the study's lead author, said in a statement. The scientists caught, examined and released about 30 bottlenose dolphins from Barataria Bay in 2011, one year after the disaster. The area was one of the most heavily oiled areas following the April 2010 blowout of BP's deepwater well, that killed 11 workers and spewed millions of barrels of crude oil into the Gulf. Government scientists and conservation groups had been concerned from the outset about the effects on marine life of the vast amounts of oil that entered the water. But Wednesday's study, published in the peer-reviewed journal Environmental Science and Technology, produced the strongest evidence to date of the effects of the spill on marine life.
Northern Gateway pipeline approved by panel with 209 conditions -- Canada is better off with Enbridge Inc.’s Northern Gateway pipeline than without it, a federal panel said Thursday. In a decision that spans two volumes and nearly 500 pages, the three-member panel of environmental and energy regulators led by Sheila Leggett said the $6.5-billion project’s economic benefits outweigh the environmental burdens. The long-awaited approval includes 209 environmental, financial and technical conditions. Enbridge must set aside $950-million in liability coverage to cover costs of a potential spill, including at least $100-million available within 10 days in the event of a large rupture and $250-million of “no-fault” insurance, the panel said. “We are not celebrating,” Enbridge CEO Al Monaco told reporters after the decision was released. He acknowledged there was more work to do to build support for the project. Final say on the 1,177-kilometre pipeline now rests with the federal cabinet, which has 180 days to decide the project’s fate.
Senators Stabenow, Levin, Durbin question Enbridge's 60-year-old tar sands Line 5 under Straits of Mackinac, a high-consequence area - Oil giant Enbridge experienced a major backlash this week after three Democratic senators released a joint letter questioning the integrity of Enbridge’s expansion of a crude oil pipeline on the Straits of Mackinac. Line 5, according to the Petosky News, runs from Superior, WI, to Sarnia, Ontario, “passing through Michigan’s Upper Peninsula and crossing the Straits of Mackinac, a 5-mile-wide area where Lakes Huron and Michigan meet.” Earlier this year Enbridge boosted Line 5’s capacity by 2.1 million barrels above its previous threshold of 20 million. The joint letter by Sen. Stabenow (D-MI), Sen. Levin (D-MI) and Sen. Durbin (D-IL) states that the pipeline “passes inland along environmentally sensitive areas and beneath the Straits of Mackinac, which PHMSA [the Pipeline and Hazardous Materials Safety Administration] has identified as a high-consequence area. The increase in oil transported adds pressure to the aging pipeline, which has undergone only a few upgrades since it was first installed in 1953 … We are particularly concerned with the risks a leak or break in the pipe could pose to the Straits of Mackinac given this area’s strong currents, variable water temperatures and connections to both Lake Michigan and Lake Huron.” “We have worked for over three years on the investigation and levied the highest civil penalty in the agency’s history” for an Enbridge spill in the Kalamazoo River, PHMSA spokeswoman Patricia Klinger said. “In addition, PHMSA executed a consent agreement which imposed more stringent safety requirements for the entire Lakehead System, including Line 5.”
The North Dakota millionaires rocking oil markets - As the analysts note, the North Dakota production surge — which was under appreciated by the industry even as recently as this time last year — is beginning to have “profound” effects on the oil markets: The latest figures from the North Dakota Industrial Commission reveal another record production in the state of 942,000 b/d in October (see chart). This represents only a slight increase compared to the previous month (+1%) despite almost 200 additional wells and can partly be attributed to weather issues during the month. According to the same source, output should continue its upward trend over the coming period, yet the decline in oil prices is rendering drilling in some areas uneconomical. Nevertheless, the abundance of US shale oil is continuing to have a profound effect on markets. Last week, the US Energy Secretary noted that the US crude export ban may be outdated and could potentially be revised. However, the decision regarding whether crude exports should be allowed does not lie with the Department of Energy, although the agency has indicated it would be willing to provide support and analysis regarding this matter. Such a move, although not expected anytime soon, would benefit US refiners which are running out of flexibility to deal with the shale oil flood (see Benigni on Oil Markets, November). At the moment the bulk of the shale burden is being borne by US refiners, leading to a lingering WTI-Brent divergence. The possibility that the US may lift its export ban, however, could turn things around completely.
Mexico Readies to Join North American Oil Boom - U.S. oil production last month reached its highest monthly total in 25 years. South of the border, the story is different, though Mexico's decision to end a state oil monopoly in place for 75 years may consolidate the America's supremacy over the international energy market. Mexican legislators passed a reform ending the 75-year state grip on the energy sector in overwhelming fashion. Petroleos Mexicanos, the former monopoly known also as Pemex, is on course for nine straight years of production decline. That could change as the measure, passed Thursday, was lauded as the most significant measure for the Mexican economy since the North American Free Trade Agreement went into force in 1994. Mexico is one of the largest oil producers in the world, though production has declined steadily thanks in part to the loss from the Cantarell oil field and other major onshore plays. Mexican President Enrique Pena Nieto said the reform measure could boost production by 40 percent to 3.5 million barrels per day. The decline in Mexico's oil production posed a threat to an economy that in 2011 generated 34 percent of its revenue from Pemex. North of the Mexican border, U.S. Rep. Paul Ryan, chairman of the House Budget Committee, and Sen. Pat Murray, his counterpart in the Senate Banking Committee, proposed a budget measure that would open the shared maritime border between the United States and Mexico up for oil and gas drilling. That deal, the Transboundary Hydrocarbons Agreement, would give explorers access to 172 million barrels of oil and 304 billion cubic feet of natural gas.
North America to Drown in Oil as Mexico Ends Monopoly - The flood of North American crude oil is set to become a deluge as Mexico dismantles a 75-year-old barrier to foreign investment in its oil fields. Plagued by almost a decade of slumping output that has degraded Mexico’s take from a $100-a-barrel oil market, President Enrique Pena Nieto is seeking an end to the state monopoly over one of the biggest crude resources in the Western Hemisphere. The doubling in Mexican oil output that Citigroup Inc. said may result from inviting international explorers to drill would be equivalent to adding another Nigeria to world supply, or about 2.5 million barrels a day. That boom would augment a supply surge from U.S. and Canadian wells that Exxon Mobil Corp. predicts will vault North American production ahead of every OPEC member except Saudi Arabia within two years. With U.S. refineries already choking on more oil than they can process, producers from Exxon to ConocoPhillips are clamoring for repeal of the export restrictions that have outlawed most overseas sales of American crude for four decades. An influx of Mexican oil would contribute to a glut that is expected to lower the price of Brent crude, the benchmark for more than half the world’s crude that has averaged $108.62 a barrel this year, to as low as $88 a barrel in 2017, based on estimates from analysts in a Bloomberg survey. Five of the seven analysts who provided 2017 forecasts said prices would be lower than this year. The revolution in shale drilling that boosted U.S. oil output to a 25-year high this month will allow North America to join the ranks of the world’s crude-exporting continents by 2040, Exxon said in its annual global energy forecast on Dec. 12. Europe and the Asia-Pacific region will be the sole crude import markets by that date, the Irving, Texas-based energy producer said.
Energy Secretary Signals Support for Revisiting U.S. Crude Export Ban: U.S. Energy Secretary Ernest Moniz, speaking to the Platts Global Energy Outlook Forum in New York on Thursday, said that it might be time for the U.S. to reconsider its 40-year ban on crude oil exports. “Those restrictions on exports were born, as was the Department of Energy (DOE) and the Strategic Petroleum Reserve (SPR), on oil disruptions,” Secretary Moniz told reporters at the event. The export ban, DOE, and SPR were all created in the wake of the 1973 Arab oil embargo when supply shocks hit the American economy hard and instilled fear in its politicians. Forty years later, the energy landscape looks far different and it is time the federal government takes a fresh look at the efficacy of its energy export policy. To export crude oil a company must apply for an export license from the Department of Commerce (DOC). These licenses are notoriously difficult to attain and, with the exception of a handful of Canadian deals, few have been handed out. In 2013, the United States exported an average of 95,000 barrels of crude per day, with the lion’s share of that destined for Canadian refineries. This is up from 67,000 barrels per day in 2012, and 23,000 barrels per day in 2007. The export ban exacerbates the price differential between WTI and Brent, making the former very attractive to those that have a chance to purchase it. For this reason, Canadian refineries are pushing hard to see licenses granted, allowing them access to high quality and comparatively cheap crude to bolster their margins. Analysts predict that these crude exports to Canada might soon reach 200,000 barrels per day under the current licensing system.
The Black Gold Brigade - The U.S. military is the world’s largest buyer of oil, dropping about $20 billion a year on black gold and other energy types. Our military needs oil even more than our economy does. Even more than Exxon and BP and oil giants do. Our military consumes more gallons of gasoline a day than all but 35 nations on earth. Without oil, our ships can’t sail, our jets can’t fly, our helicopters can’t hover, and our tanks can’t roll. As of 2009, the Department of Defense emptied 360,000 barrels of oil a day. And that number skyrockets during a war. For every one of our occupations a vast range of fuel imperatives arise: high-octane jet fuel, auto diesel, marine diesel, electricity, natural gas, and so on.The increasingly prevalent drone program lends a particular currency to this insight: drones literally sit in the air for hours on end, some up to 40 hours at a time, their low-level buzz audible on the ground and in the small villages that are being surveilled for targets. To do that, to hang stationary in the sky and monitor—like a giant mechanical predator—the livelihoods of mostly poor Muslim populations, enormous stores of diesel fuel are required. The Predator Unmanned Aerial Vehicle (UAV) can store 600 pounds of high-octane jet fuel. The military has been testing in-air refueling, which would create floating gas stations capable of refueling swarms of drones that gathered around its octane-rich hub in unvarying, buzzing formation. As you might imagine, the per-gallon costs of this in-air replenishment are extravagant. The goal, of course, is to keep drones in the air longer, perhaps permanently. Keep in mind, we had 50 drones in 2001, and nearly 8,000 now. In keeping with humanity’s imitative character, seventy countries around the world now own drones.
US To Become Less Dependent On Foreign Oil? - Be Careful What You Wish For! - The US Energy Information Administration released on Tuesday an early version of its Annual Energy Outlook for 2014. The main item being that the United States will continue to develop its own oil and to press for more efficient cars in order to reduce demand on oil. The report from the federal government forecasts a rise in US oil production of another 800,000 barrels per day for the coming two years, but sees a rise by 2016 with the US reaching about 9.5 million barrels per day. The previous high was attained in 1970 when production had reached 9.6 million bpd. Predictions are that the oil boom is temporary and is expected to level off around 2020, but by then there should be a lot more fuel efficient cars on the roads that the drop in production will not be felt. But here there is the need for a word of caution. Being less dependent on Middle Eastern oil does not mean the United States should become a political recluse, retrench inside fortress America and damn the rest of the world and their problems. In the region of the Gulf, for example, the US counts many allies who are becoming extremely nervous at a USA hoping to step back from the region while across the waters they face a more powerful Iran with ever-growing political/religious ambitions. Up until now countries in the region felt somewhat protected largely because of their oil. Case in point was when Kuwait was invaded by Saddam Hussein in 1990 the US raised a powerful multinational coalition to throw him out of the oil producing state. But recent events, such as the distancing of once extremely close US-Saudi relation have started to cast doubts in the minds of the oil rich sheiks of the Gulf who are truly questioning America’s resolve in the region.
Saudi Royal Blasts U.S’s Mideast Policy - A leading Saudi prince demanded a place for his country at talks with Iran, assailing the Obama administration for working behind Riyadh's back and panning other recent U.S. steps in the Middle East. Prince Turki al-Faisal, an Arab royal and a brother of Foreign Minister Saud al-Faisal, said Saudi Arabia and other Gulf states were stunned by the secret American-Iranian diplomacy that led to the breakthrough deal between Iran and other world powers last month. His comments in an interview with The Wall Street Journal, rare in their bluntness, came on the sidelines of a security conference here at which he publicly blistered the U.S. for its role in Syria and in the region. The Arab royal said the failure by Washington and the United Nations to take decisive steps to end the violence in Syria—which has claimed over 130,000 lives—bordered on "criminal negligence." Last week, the State Department said it had suspended nonlethal aid to the Syrian rebels after warehouses they controlled in northern Syria were overrun by Islamic militants with ties to al Qaeda. Saudi Arabia has armed some of those same rebels.
Putin To Keep Ukraine Under Russian Influence With Natural Gas Deal - Amidst political chaos in Ukraine, Russian President Vladimir Putin and Ukrainian Prime Minister Viktor Yanukovych announced an agreement on Tuesday that will slash the price Ukraine pays Russia for natural gas supplies, along with a $15 billion loan that the two asserted comes with no strings attached. Previously, Putin had sought to bring Ukraine into its trade union of former Soviet republics, but the Russian president said that was not part of Tuesdays deal. “I want to draw your attention to the fact that this is not tied to any conditions,” Putin said at a press conference in Moscow. “I want to calm you down — we did not discuss the issue of Ukraine’s accession to the customs union at all today.” Putin said Russia would reduce Ukraine’s gas price by 30 percent to $268.5 per 1,000 cubic metres, along with investing $15 billion in Ukraine’s government bonds in an attempt to stave off a financial crisis. “Putin said it was a temporary move but did not elaborate,” Reuters reported. Ukraine has been rocked by weeks of protests centered in the capital city of Kyiv, with thousands of people remaining in Maidan Nezalezhnosti (Independence Square), despite the sub-zero temperatures. Their protests were set off by Yanukovych backing out of trade and economic agreements with the European Union that had been in the works for years. Polls showed that a strong majority of Ukrainians, even in the traditionally pro-Russian east, supported the accords. Stunned by Yanukovych’s sudden reversal and undeterred by a violent police crackdown on peaceful protesters, they’ve remained steadfast in their demand that the current government, including Yanukovych, must go.
Russia's Price for Buying Off Ukraine: $15B - Let us update this strange tale of Ukraine. Having told his opponents to in effect get lost since they didn't win any elections or succeed in gaining a vote of no-confidence, President Viktor Yanukovych headed to the Kremlin to speak to his Russian counterpart Vladimir Putin. What is the price of fealty to Russia? Gulf Cooperation Council bigwigs bought off Egypt for $9.9 billion (so far)--$5B from the Saudis and $4.9B from the Emiratis to wean it off the upstart Qataris. Meanwhile, Yanukovych was able to wangle a $15B bailout from Russia to buy that much worth of Ukrainian sovereign debt over the next two years. Not bad, eh? Ukraine sealed $15 billion of Russian financing and a one-third discount on energy imports from its neighbor as anti-government protesters in Kiev demanded to know what President Viktor Yanukovych had ceded in return. Russia will buy government debt this year and next and will cut the price it charges for natural gas to $268.5 per 1,000 cubic meters, President Vladimir Putin said today after meeting Yanukovych in Moscow. Ukrainian debt--certainly more than mildly distressed at this point--is slightly more relaxed as a result:
Gazprom Hopes to Sign Natural Gas Supply Contract with China in January - Alexei Miller, the Chief Executive at Gazprom, the Russian natural gas giant and world’s top gas producer, has suggested that they might finally be ready to sign a contract to supply China with natural gas, by the end of January. Gazprom has been in talks with CNPC, the state owned Chinese energy company, for years, trying to hammer out a deal that would open a huge new market to Russian gas exports. The former soviet country has been keen to expand into new markets in order to reduce its dependence on European customers, who in recent times have been trying to minimise their overreliance on Russian gas by developing their own reserves and sourcing imports from other countries. Unfortunately for Gazprom, China is well aware of the importance that their huge market could have in the future, and have used this advantage to negotiate tough conditions into the deal, making demands for large discounts compared to the price paid by European utilities. In September the two companies managed to sign an agreement that laid out the basic terms and conditions of the new supply contract. A Gazprom press release stated that: “All the major terms and conditions of future Russian natural gas supplies to the Chinese market via the eastern route were agreed on, namely, the export volume and starting date, the take-or-pay level, the period of supply buildup, the level of guaranteed payments, the gas delivery point on the border as well as other basic conditions of gas offtake.”
China Imported More Coal Than Any Country In History In 2012, As Projected Global Coal Demand Slows - Could the world slowly be getting off its coal addiction? Rather than rising demand for coal charging ahead at its recent breakneck speed, the world’s increase in demand for the fossil fuel will rise by 2.3 percent in coming years, according to a report released by the International Energy Agency (IEA) on Monday. This is a drop in expected coal demand increase over 5 years from 2012′s report, which pegged the number at 2.6 percent. This is not to say coal is anywhere near extinct yet, nor even that any theoretical “war on coal” is making any serious strides. Burning coal is still a huge portion of global carbon emissions. “Coal in its current form is simply unsustainable,” IEA Executive Director Maria van der Hoeven said. “Radical action is needed to curb greenhouse-gas emissions, yet that radical action is disappointingly absent.” Growth in coal demand outpaced all other fossil fuels in 2012 — by a jump of 170 million tonnes from the year before. China is still the 800-pound gorilla in the coal mine. That 170 million tonnes of demand growth was almost all represented by China’s 165 million tonne rise in demand last year. And China imported the most amount of coal that any country has ever imported in one year — 301 million tonnes.
China Solves Smog Problem - A new study funded by Greenpeace shows that a quarter of a million Chinese people died of air pollution from coal fired power plants in 2011. And the smog is worse this year. The analysis traced the chemicals which are made airborne from burning coal and found a number of health damages were caused as a result. It estimates that coal burning in China was responsible for reducing the lives of 260,000 people in 2011. It also found that in the same year it led to 320,000 children and 61,000 adults suffering from asthma, 36,000 babies being born with low weight and was responsible for 340,000 hospital visits and 141 million days of sick leave. The smog has been so thick that pilots couldn't land their planes. The Chinese government is instituting new requirements that pilots must be able to land planes in low visibility conditions to reduce flight delays and cancellations. China's smog problems may seem intractable, but Chinese government officials have found a solution. They are still planning to build more coal fired power plants, because, after all, you can't stop progress. They found a "common sense" solution that' ALEC and the Kochs will bring to America if we let them. The Shanghai environmental authority announced on Thursday that it has adjusted its air pollution standards to reduce the number of alerts, adding that they will still be frequent in winter. ... The municipality's Environmental Protection Bureau will now lift air pollution alerts when the concentration of PM2.5 — particulate matter smaller than 2.5 microns in diameter that can penetrate deep into human lungs — falls below 115 micrograms per cubic meter. Previously, the bureau lifted alerts after the concentration of PM2.5 dropped below 75 micrograms per cubic meter. (The U.S. EPA's 24 hour limit is 35.)
Chinese navy begins US economic zone patrols - FT.com: The Chinese military has started operating within the US’s exclusive economic zone, a move that could transform the dynamic between the dominant Pacific naval power and its main challenger. Admiral Samuel Locklear, commander of US forces in the Pacific, on Sunday confirmed the revelation from a Chinese military delegate at the Shangri-La Dialogue, a high-level defence forum in Singapore, that the People’s Liberation Army navy had started “reciprocating” the US navy’s habit of sending ships and aircraft into the 200-nautical-mile zone off China’s coast. Under international law, each country has the exclusive right to the economic resources inside a 200-nautical-mile zone off its coast, a zone different from coastal states’ 12-mile national waters. The US and most other countries interpret international law to allow a right of free passage for military vessels through the EEZ, but China disagrees and has long chided the US practice of frequent surveillance missions along the Chinese coast. “They are, and we encourage their ability to do that,” said Adm Locklear about China’s claim that its military was making forays into the US EEZ. He added that, as the exclusive economic zones of all coastal states account for about one-third of the world’s oceans, attempts to hinder or block free passage through them would cripple military operations. Adm Locklear declined to confirm how far exactly Chinese military vessels had come. But delegates said that, from what was known about the usual movements of the PLA navy, it was most likely that it had extended its radius of patrols and exercises to near Guam rather than Hawaii or the US mainland.
China confirms US warship near-collision: China says one of its warships "encountered" a US vessel, confirming US reports of a near-collision in the South China Sea earlier this month. The US said its guided missile cruiser USS Cowpens was forced to take evasive action as the two ships neared each other on 5 December. It has been described as the most serious Sino-US confrontation in the South China Sea since 2009. However, China said the incident was handled with "strict protocol". The US has said its ship was operating in international waters. But China claims parts of the South China Sea, and a state-run newspaper quoted an expert as saying that the US boat had been "harassing" China's aircraft carrier, the Liaoning, as it carried out drills.
Chinese Luxury Spending Growth Slumps To Lowest Since 2000 - China’s crackdown on extravagance and its anti-corruption campaign appears to be having a significant impact as Bain & Co reports that spending on luxury goods is estimated to grow at only 2% in 2013 - its slowest pace since 2000 (and dramatically lower than the 7% growth last year). "The mindset among global brands [in China] is changing from 'where do we find growth' to 'how do we create growth'," Bloomberg reports as "gifting" to high-ranking officials - one of the major growth engines of the industry - has crushed luxury watch sales down 11% in 2013. Ironically, given yesterday's mall-jumping news, female shoppers are picking up some of the slack with shoes growing 8-10%. New store openings fell by 33%. Via Bloomberg, China’s luxury spending grew this year at the slowest pace since at least 2000 as more shoppers traveled abroad and the government’s anti-corruption efforts curbed purchases, consultant Bain & Co. said. Spending in luxury goods is estimated to have increased about 2 percent in 2013, compared with 7 percent last year, the Boston, Massachusetts-based company said in a report released yesterday. Growth in 2014 will be at a pace similar to this year, it said. Demand for luxury items from Swiss watches and expensive liquor have slumped since President Xi Jinping ordered officials to cut down on lavish spending and stepped up investigations into graft.
Economists React: Is China’s Manufacturing Sector Losing Steam? - The HSBC “flash” purchasing managers index for the manufacturing sector, the first major piece of data showing how China’s economy performed in December, ticked down to 50.5, compared with a final reading of 50.8 the month before. Any figure above 50 represents expansion, but the figure confirms a gradual loss of momentum that was clear from November’s slower industrial production and fixed-asset investment. New export orders rose, a positive sign for the next few months, but finished goods prices fell, suggesting excess capacity remains a problem in many industries. Tighter credit conditions, too, are likely making life harder for companies. Below, economists weigh in. Some of their comments have been edited for style and clarity.
- –“The December HSBC Flash China Manufacturing PMI reading slowed marginally from November’s final reading. But it still stands above the average reading for the third quarter, implying that the recovering trend of the manufacturing sector starting from July still holds up. As a result, we expect China’s gross domestic product growth to stabilize at around 7.8% on-year in the fourth quarter.”
- – Hongbin Qu, HSBC –“This report serves another piece of evidence that the Chinese economy is no longer accelerating sequentially. In our view, tight liquidity conditions, which usually affect smaller manufacturers first, are one of the major factors. The Economic Work Conference that just concluded kept the prudent monetary policy stance for 2014 and set ‘debt risk management’ as one of the key policy tasks for the first time. Given this, we do not expect China’s domestic credit environment to improve any time soon, and as a result growth deceleration will probably resume.”
China cash injection fails to soothe markets - A rise in China's interbank interest rates on Friday showed that markets remain uneasy despite a cash injection by China's central bank, said dealers. The rates, which serve as the funding costs for pricing and investment, have been trending higher in recent weeks as the People's Bank of China (PBoC) had recently refrained from injecting further liquidity before Thursday's move. On Friday the seven-day repurchase rate -- a benchmark for interbank borrowing costs -- rose to 7.75 percent from Thursday's close at 7.06 percent, said Dow Jones Newswires. That came despite the People's Bank of China (PBoC) announcing before market close that it had "appropriately injected" an unspecified amount of cash into the market. The measure followed a spike in the seven-day rate to 9.8 percent earlier in the day, the highest since a cash crunch in June that unnerved global markets. Before Thursday's intervention, the central bank had for the past two weeks suspended a routine move to release liquidity -- owing to fears about a growth of bad debt that could weigh on the economy. But that sent jitters across the market, with big banks scrambling to increase their cash reserves as they struggled to meet regulatory requirements on capital by year's end, sending up interest rates that lenders charge to lend to each other, analysts said. This prompted the central bank to step in on Thursday by conducting short-term liquidity operations (SLOs) to inject cash.
China's 2014 central gov't budget may be RMB1.3 tn in the red - China's central government budget deficit in 2014 is still on track to break the 1 trillion yuan (US$164.7 billion) mark, reaching 1.3 trillion yuan (US$214.1 billion), according to an expert at a government research institute in China. The budget will undergo a structural adjustment, due to the financial support for the urbanization program, which will lead to stable expansion in the scale of bonds issued by the Ministry of Finance on the behalf of municipal governments, said the expert in an interview with the financial news website run by Beijing-based media group Caixin during a summit meeting organized by the website in Beijing on Dec. 18. Xu Shaoshi, director of the National Development and Reform Commission (NDRC), which directs China's macroeconomic policy, remarked last week that the government will maintain the current levels of investment growth, step up promotion of external demand, and adjust the central government's budgeted investments. Statistics show that the Chinese central government's budget deficit surged in 2019 to 950 billion yuan (US$156 billion), up from 2008's 180 billion (US$30 billion), and has been hovering at high levels ever since, to 1 trillion yuan in 2010, 850 billion yuan (US$140 billion) in 2011 and 800 billion yuan (US$132 billion) in 2012. The deficit is expected to hit 1.2 trillion yuan (US$197.7 billion) in 2013. From 2008-2013, the share of deficit in the central government's budget has jumped from 0.6% to 2.2% and is expected to advance further to 2.3%, a four-year high, in 2014.
Is the renminbi ready for the world? | Bangkok Post opinion: China is increasingly debating whether or not the renminbi should be internationalised, possibly joining the US dollar and the euro as an international vehicle currency (IVC) _ that is, a currency that other countries use to denominate the prices of their traded goods and international loans. Related to this is a debate about whether Shanghai can become a first-tier international financial center (1-IFC) similar to London and New York. First, a city can become a 1-IFC only if its national currency is an IVC. But, as London's status shows, a longtime 1-IFC can retain its position in the international financial system even if its currency is no longer an IVC. Second, the transaction cost of using a foreign currency as a medium of exchange is inversely proportional to the extent to which that currency is used globally. Similar economies of scale characterise foreign investors' use of a particular international financial center. As a result, there cannot be more than three or four IVCs and 1-IFCs. Third, a country's financial sector must be both open, with no capital-flow restrictions, and sophisticated, with a wide range of instruments and institutions. It must also be safe, with a central bank maintaining economic stability, prudential regulators keeping fraud and speculation in check, macro-prudential authorities displaying adequate financial fire-fighting capabilities and a legal system that is predictable, transparent and fair. Last and most importantly, successful convergence to IVC and 1-IFC status requires the national economy to be strong relative to other economies for a substantial period of time. The United Kingdom occupied a position of global economic leadership for more than a century. In 1914, the US/UK GDP ratio was 2:1, but the US dollar was not an IVC, suggesting that America's relative economic strength was inadequate. A decade later, in 1924, the ratio was 3:2 and rising _ and the US dollar had eclipsed the British pound as the most important IVC.
Japan takes defence policy into uncharted waters - In Japan the government of Shinzo Abe has approved a new defence policy designed to meet the challenge posed by a rising China. It is the latest step towards Abe’s longstanding and publicly-stated desire to change Japan’s pacifist constitution, drawn up after the Second World War, and redefine Japan’s ‘Self-defence force’. The defence budget will be boosted by five percent for the 2014-19 period, with a total of 174 billion euros available. The shopping list is impressive; 52 amphibious vehicles, five submarines, 17 VTOL aircraft, 28 stealth F-35 fighters, three spy drones, and two Aegis anti-missile destroyers. Abe is trying to sell his defence policy as one of positive and pro-active pacifism, offering more transparency to both Japan and its neighbours. The vertical take-off Osprey is typical of the equipement Japan wants; flexible and clearly destined to protect faraway maritime possessions. Last March China decided to boost its annual defence spend by 10 percent or 86 billion euros. That increase alone is more than double Japan’s 35 billion euro annual defence budget. China can and does spend a lot more than Japan.
Japan 2014/15 budget to reach record $930 billion - Japan's budget for next fiscal year will rise to a record above $930 billion, boosted by public works and military spending, government sources familiar with the process said on Monday. The government is in final negotiations on the general-account budget for the year from April, which will exceed 96 trillion yen ($931 billion), the sources told Reuters on condition of anonymity. The draft budget, to be approved by Prime Minister Shinzo Abe's Cabinet on December 24, will be up from this fiscal year's initial budget of 92.6 trillion yen.
BOJ Beat: Kuroda Ends 2013 Facing Heavy Dose of Skepticism - Since Gov. Haruhiko Kuroda led the Bank of Japan to sharply expand its monetary easing eight months ago, he has tried to convince the public through 17 news conferences and 22 public speeches that the central bank can meet its inflation goal in time. But his year-end report card doesn’t look impressive. Ten economists surveyed by the Wall Street Journal all said the central bank will have to step up its monetary stimulus sometime next year. One sees the BOJ acting in the first quarter, seven in the second or third quarters, and two in the fourth quarter. The survey was taken ahead of what will be the central bank’s last scheduled policy board meeting of the year Thursday and Friday. No policy change is expected. Fueling speculation for additional steps next year is a planned sales tax increase in April, which will likely hit consumption. Another impetus is the fact that a number of the BOJ’s nine policy-board members have recently signaled weakening confidence in Mr. Kuroda’s goal of achieving “2% inflation in two years” from the time he announced a massive easing program last April .
Japan Inc. Hoards Record Cash as Abe Targets Wage Gains - Japanese companies’ cash holdings rose to a record last quarter, highlighting Prime Minister Shinzo Abe’s struggle to spur the investment and wage increases needed to end a 15-year deflationary malaise. Corporate holdings of cash and deposits rose to 224 trillion yen ($2.15 trillion), up 5.9 percent from a year earlier, according to a Bank of Japan report released yesterday. The yen’s 17 percent slide against the dollar this year has boosted exporters’ profits, contributing to a cash pile similar in size to Russia’s gross domestic product. As Abe campaigns to reflate the world’s third-biggest economy, he’s relying on company spending to drive a longer-term recovery once the jolt from fiscal and monetary stimulus wears off. “Companies still have a deflationary mindset,” “It will take a while for them to start to increase investment and wages.’” The Bank of Japan’s latest Tankan survey showed large companies lowering their projections for investment this fiscal year, which ends in March. Regular wages excluding overtime and bonuses fell 0.7 percent in October from a year earlier, a 17th straight monthly decline.
Japan's trade deficit widens for 17th straight month - Japan's trade deficit widened for a 17th consecutive month in November to 1.29 trillion yen (around 12. 6 billion U.S. dollars), as a weak yen and rising import costs for fossil fuels outweighed an uptick in exports, the Ministry of Finance said in a report on Wednesday. The latest figure compares to a 1.31 trillion yen deficit expected by median economists in the recording period and marks a 35.1-percent increase from the same time a year earlier. The deficit for November is the third-widest gap since the finance ministry started keeping records in 1979, with the record run of monthly deficits taking its toll, as energy imports continue to ensure Japan's balance book stays in the red. Japanese policymakers leaning hard on the finance ministry and especially the Bank of Japan (BOJ) to ease its monetary policy and weaken the yen, in a bid to increase demand for Japanese goods from overseas markets, has served its purpose and export-reliant Japan saw an 18.4-percent rise of goods shipped overseas in the recording period, compared to a year earlier, the data showed.
Two key reasons for Japan's record trade deficit -- Japan's Ministry of Finance just released the nation's trade balance numbers, showing the trade deficit hitting a new record. While there are a number of reasons for this trend, two key items stand out:
1. Yen weakness has not generated the expected benefits in terms of exports due to slow global growth and challenging competitive landscape.
2. Recently domestic import demand has grown considerably, as buyers try to get ahead of next April’s consumption tax hike.
TPP offers early test of how far secrets law will cow Japan’s media - During the contentious talks that led to the 2007 free trade agreement between the U.S. and South Korea, the latter passed a law forbidding the release of information related to negotiations at the insistence of the Office of the U.S. Trade Representative (USTR). Consequently, several employees of a TV station that produced a news program critical of the FTA were jailed for divulging information about the talks, as was the government official who leaked that information. The USTR was reportedly afraid that public protests would work against it, and in fact violent demonstrations and even one public suicide took place in front of the venue where the talks were taking place. The South Korean government did as it was told. According to an essay by Toshihiro Yamanaka in the Asahi Shimbun on Nov. 24, the current negotiations between Japan and the U.S. as part of the Trans-Pacific Partnership (TPP) talks is running a similar course. Of the 112 registered journalists there, 105 were Japanese. He describes the USTR as being “irritable” in nature, and in Brunei the Americans were having all Japanese coverage translated immediately into English. They repeatedly accused their Japanese counterparts of failing to control the flow of information, such as proposed tariff elimination rates. Yamanaka says the Japanese media should report such matters because the outcome of any successful TPP talks will have a profound effect on Japanese trade policy. One of the few American journalists covering the talks in Brunei told him that no one in the U.S., “not even people from farm states,” know what the TPP is, so major news outlets didn’t send anyone.
Wikileaks TPP Revelations Prove US in “Left Field” With Trade Deal - Real News Network video & transcrpt - WikiLeaks recently released documents which shed light on the status of ongoing TPP negotiations. The revelations demonstrate deep disagreement between the United States and negotiating parties on the issues of intellectual property, agricultural subsidies, and financial services. Joining us in-studio to discuss the TPP is Kevin Zeese.
Trans-Pacific Partnership (TPP): Bigger and More Dangerous Than ObamaCare (Video) We all remember Representative Nancy Pelosi’s infamous statement that we have to pass the ObamaCare legislation so that we can find out what’s in it. That was in 2010 and Mrs. Pelosi was then speaker of the House of Representatives. Well, Congress followed her advice and passed ObamaCare, formally known as the Patient Protection and Affordable Care Act. Three years later, in October of 2013, tens of millions of Americans began finding out what was really in the bill, as they began receiving health insurance cancellations and/or massive premium hikes. They also began to learn that under ObamaCare the IRS has been given new powers to go after them, their businesses, and their bank accounts. And that is only the beginning. As with all legislation, the devil is in the details, and lots of devils keep popping out of the constantly evolving details, as dozens of federal agencies continue churning out thousands of pages of regulations to implement the misbegotten, misnamed Affordable Care Act. There are many important lessons from ObamaCare that we should apply to another huge project that could have a similarly devastating impact on our nation. In November 2009, President Obama announced his intention to have the United States participate in a so-called trade agreement known as the Trans-Pacific Partnership. I say so-called trade agreement because 80 percent of the proposed agreement deals with a great many issues besides trade.
Sen. Flake to GOP: Obama Needs Trade Powers - Republican Sen. Jeff Flake of Arizona asked members of his party to do something difficult – if not impossible. Mr. Flake said Republicans should put aside their distrust of President Barack Obama and vote to give his administration special powers to negotiate trade agreements. “Republicans need to resist the temptation to buy the misleading narrative that TPA [trade promotion authority] would simply give away the store to the Obama administration,” Mr. Flake said at the American Enterprise Institute, a conservative think tank. “Distaste for Mr. Obama isn’t enough to justify opposition to trade pacts that would raise U.S. living standards.” Many conservative Republicans, particularly those with tea party or libertarian leanings, are skeptical of international agreements, even when a Republican is in the White House. Some Republicans who view the so-called fast-track authority as a necessary step to help U.S. companies are finding it difficult to persuade conservative colleagues. The measure would give the administration the ability to negotiate trade deals that Congress could approve or reject but couldn’t change. Congressional committee leaders reached a deal and will likely introduce TPA early next year, aides said. Pro-business groups, including the Business Roundtable, are working to shore up support in Congress. Backers of Asia-Pacific trade talks known as the Trans-Pacific Partnership say TPA is needed to complete the deal, in part becasue it would stop other countries from second-guessing the U.S. trade representative’s office. Free-trade agreements hammered out abroad require approval in both chambers of Congress.
What a Currency Provision in a Trade Bill Means – Or Doesn’t — Senior U.S. lawmakers last week said a deal they reached on fast-track trade legislation would include language directing trade negotiators to consider currency issues as part of international talks. So what exactly does that mean? If history is any guide, it may not mean much. Under fast-track, Congress approves trade pacts on an up-or-down vote, without amending them. The Obama administration is hoping to get fast-track authority for a big pan-Pacific trade agreement it aims to complete next year. In its last fast-track law, which passed in 2002 and expired in 2007, Congress said the administration should establish “consultative mechanisms” that examine the impact of exchange rate movements, and to scrutinize whether other countries were using their currencies to gain a competitive advantage. “It was sufficiently vague and didn’t have benchmarks, giving the administration the ability to talk about it but not have to have to include it in any trade pact language,” says Gary Hufbauer, a senior fellow at the Peterson Institute for International Economics and former senior trade official at the U.S. Treasury. In other words, just because the currency language is in the fast-track bill doesn’t mean it will have force in the actual trade agreement. Experts point to the fact that the 2007 Free Trade Agreement signed with South Korea, which passed under the 2002 fast-track law, didn’t address currency policy. The U.S. Treasury has since chastised Seoul for keeping its currency undervalued, but the pact itself does not give industries a mechanism for recourse if they feel they have incurred losses because of currency issues.
Charts of the day, world manufacturing output, 2012 - The charts above are based on new data from the United Nations on GDP and its components for more than 200 countries, updated through 2012. Here are some highlights of the UN’s data update: The top chart compares the annual manufacturing output from 1970 to 2012 (measured in current US dollars) for the five countries that produced the most manufacturing output last year: China, US, Japan, Germany, and Korea. As I reported last year, China officially became the world’s largest manufacturer in 2011, with output in 2011 ($2.34 trillion) that was 20.6% higher than the $1.94 trillion (updated) of factory output in the U.S. In 2012, China’s manufacturing output increased by 9.7% to $2.556 trillion, while factory output in the US increased by 2.6% to $1.993 trillion. For the second year in a row, China was the world’s largest manufacturer and out-produced the US by 28.2%.
Worldwide Income Inequality: From Two Humps to One - To calculate a worldwide measure of income inequality, you need to work with data on the distribution of income for the population in every country--and for many countries, this data is mismatched and helter-skelter. You need to convert the income data for all countries into a common currency, like U.S. dollars. You then add up all the people in the world who fall into each income category. To do comparisons over time, you need to find data for different countries over time, and then also adjust for inflation. Christoph Lakner and Branko Milanovic of the World Bank take on this task in "Global Income Distribution From the Fall of the Berlin Wall to the Great Recession," published this month as Policy Research Working Paper 6719. Here's how the global distribution of income has shifted over time. It used to be said back in the 1960s that the global distribution of income was bi-modal--that is, it had one hump representing the large number of people who were very low-income and then a smaller hump representing those in the high-income countries. In the blue line for the global distribution of income 1988, the remnants of that bimodal distribution are still visible. But over time, the highest point in the income distribution is shifting to the right, and by 2008, the world has moved fairly close to having a unimodal or one-hump distribution of income.
The “Global Savings Glut” Is Conceptually Incoherent. “The Economy” Cannot “Save”: When you hear people talk about the Global Savings Glut, you can be quite sure they are talking about monetary “savings” — the global aggregate stock of money embodied in financial assets.What they don’t seem to realize is that the net holdings of global financial assets minus liabilities — claims and counterclaims — is always exactly zero. By accounting identity. Every financial asset is a claim against another party. For every asset (credit, claim) in the account of a financial-asset holder, there is a equal and opposite liability (debit, counterclaim) in the account(s) of some other party or parties. Sum up all those assets and liabilities, and you get zero. The gross quantity of financial assets (and liabilities) can increase, but the net quantity always remains the same.
Global junk bond issuance hits all-time high in 2013 - Global corporate junk bond issuance hit an all-time high in 2013, led by a surge in Europe, as corporates sought to take advantage of cheap borrowing costs and amid increased demand for the region's assets among global investors. Speculative-grade debt volume totaled $476.5 billion in 2013, the highest on record, and marking a 12 percent increase from 2012, according to data provider Dealogic. In Europe, high-yield volume rose 54 percent on-year to $121.9 billion - a contrast from the U.S., where issuance fell 6 percent to $259.5 billion from a record $274.8 billion in the previous year. Together, both regions accounted for 80 percent of global speculative-grade debt volume.
Across Asia, Bracing for the Fed ‘Taper’ - Policy makers around Asia are closely watching the Federal Reserve’s meeting tonight to see if the U.S. central bank decides to begin winding down its massive bond-buying program. Even if the U.S. central bank does “taper,” the impact on Asia likely won’t be as large as it was last May, when the first intimations by Fed Chairman Ben Bernanke of slower bond purchases caused a stampede out of emerging-market assets. That shock led central banks in the most exposed markets, such as India and Indonesia – where large current-account deficits heightened their vulnerability to capital outflows – to raise interest rates and take other steps to attract funding, while damping demand for imports. “Most people are already kind of braced for it,” said Tim Condon, head of Asia-Pacific research at ING. “But I could worry a bit about the rupiah. In this part of the world, Indonesian assets are probably the most vulnerable.” But the Fed has surprised before – such as in September, when markets initially believed the Fed would announce tapering. In the event, the Fed held off, and Mr. Bernanke chastised markets for not paying more attention to the Fed’s guidance that it intended to keep short-term rates low for a long time. With that message now internalized – and a few extra months for Asian policy makers to get their houses in order – the stage is set for stimulus to be reduced. The attitude seems to be that they may as well get this over with.
For Asia, Fed Taper Decision Means Few Policy Changes - The U.S. Federal Reserve’s move to begin modestly scaling back its bond-buying program will mean few immediate policy changes in Asia, where authorities have taken advantage of the long run-up to Wednesday’s tapering decision to prepare their economies and markets. Asian stocks were broadly higher Thursday morning, with Japanese stocks especially strong after the dollar surged to a fresh five-year high against the yen.That contrasted sharply with the reaction in May when Fed Chairman Ben Bernanke first raised the prospect of winding down the U.S. central bank’s massive economic stimulus. Emerging-market assets were slammed, with India and Indonesia – whose large current-account deficits made them acutely sensitive to outflows of capital — hardest hit in Asia.But policy makers in both countries have used the months since the initial taper talk in May to prepare their economies for the inevitable. They’ve raised interest rates, taken steps to open their economies and moved to damp demand for imports that contributed to their trade imbalances. “I presume the guys in Indonesia and India are going to be looking at the decision nervously, because those were the places most affected six months back,” “But they’ve already put up some barricades. They’re looking more robust than they were six months back.” One sign of their confidence was the Reserve Bank of India’s decision to hold interest rates steady at its policy meeting Wednesday, hours before the Fed was due to announce its taper decision. The RBI likely would have raised rates further if it feared another run on the rupee.
Tapering Talk: The Impact of Expectations of Reduced Federal Reserve Security Purchases on Emerging Markets - Fed tapering has started. A revival of last summer’s emerging economy turmoil is a real concern. This column discusses new research into who was hit and why by the June 2013 taper-talk shock. Those hit hardest had relatively large and liquid financial markets, and had allowed large rises in their currency values and their trade deficits. Good macro fundamentals did not provide much insulation, nor did capital controls. The best insulation came from macroprudential policies that limited exchange rate appreciation and trade deficit widening in response to foreign capital inflows. In a new paper, we attempt to shed light on these issues (Eichengreen and Gupta 2013). We use data for a cross-section of emerging markets to analyse who was hit by the Fed’s tapering talk and why. We focus on the change in exchange rates, foreign reserves, and equity prices between April 2013 (just prior to talk of tapering) and August 2013 (by which time the response was largely complete). (In September, new data on the condition of the US economy led Federal Reserve officials to make statements that moderated prior expectations of tapering).
Don’t Expect Indian Central Bank’s Breather to Last Long - Raghuram Rajan is keeping India-watchers on their toes. The Reserve Bank of India left its policy interest rate unchanged Wednesday, defying a broad consensus that the central bank would raise rates for the third straight time. Since becoming RBI governor in September, Mr. Rajan has earned a reputation as an inflation-fighter for tightening monetary policy to curb price pressures even as economic growth sputters. With Wednesday’s decision to keep the repo rate at 7.75%, the governor is responding to widespread unease about the slowdown: GDP growth has slipped to less that 5% in recent quarters from an average of 8% in the 10 years to 2012. He also is adding some nuance to his image as a hawk. Indian stock and bond markets cheered the hold, and the Federation of Indian Chambers of Commerce and Industry called it a “welcome breather.” The central bank did offer multiple assurances that it hasn’t taken its eye off “unrelentingly” high inflation. Mr. Rajan told reporters afterward that the decision was a “close call.” Of course, rate hikes aren’t aimed solely at inflation: They also help choke off demand for imports and reduce the trade deficit. And they should help draw in more funds, though higher rates haven’t done much to attract investors to Indian government bonds. The RBI’s statement warned against overreacting to economic data, cautioning that lags and other impediments to price adjustments mean “there is merit in waiting for more data to reduce uncertainty.” Indeed, the phrase Mr. Rajan used in his remarks was “wide bands of uncertainty.” The RBI said it will act if there isn’t a “significant” reduction in headline inflation in the next round of data, or if core inflation doesn’t fall. In that case, the policy response will be “appropriately calibrated,” Wednesday’s statement said.
India Leaks $344 Billion in Dirty Money -- While India has never been your standard Asian export powerhouse, it is one of the world’s largest exporters of one commodity: Dirty money. The total amount of dirty money India exported in the decade ended in 2011, came to a whopping $344 billion, making the South Asian country the world’s fifth largest developing country exporter of illicit cash after China, Russia, Mexico and Malaysia, according to a report this week by Global Financial Integrity, a Washington DC-based research and advocacy organization. The illicit outflows from crime, corruption and tax evasion grew more than 10-fold during those 10 years to reach $85 billion in 2011, the report said, as corruption in the south Asian nation grew at a faster pace than even the impressive expansion of the economy. For comparison, India’s exports for 2011 came to about $300 billion. “Markets cannot be left to themselves,” “As long as human beings are involved, there is no inherent or automatic mechanism to regulate behavior and ensure that everyone plays by the book. This is more so the case in developing countries with typically weaker governance,” A report by the same group, published in 2010, found that between 1948 and 2008, $213 billion, or at least $462 billion at 2010 prices, was illegally transferred overseas.
NAFTA’s Legacy: Growing U.S. Trade Deficits Cost 682,900 Jobs - Former President Bill Clinton claimed that NAFTA would create an “export boom to Mexico” that would create 200,000 jobs in two years and a million jobs in five years, “many more jobs than will be lost” due to rising imports. The economic logic behind his argument was clear: Trade creates new jobs in exporting industries and destroys jobs when imports replace the output of domestic firms. Fast forward 20 years and it’s clear that things didn’t work out as Clinton promised. NAFTA led to a flood of outsourcing and foreign direct investment in Mexico. U.S. imports from Mexico grew much more rapidly than exports, leading to growing trade deficits, as shown in the Figure. Jobs making cars, electronics, and apparel and other goods moved to Mexico, and job losses piled up in the United States, especially in the Midwest where those products used to be made. By 2010, trade deficits with Mexico had eliminated 682,900 good U.S. jobs, most (60.8 percent) in manufacturing. Claims by the U.S. Chamber of Commerce that NAFTA “trade” has created millions of jobs are based on disingenuous accounting, which counts only jobs gained by exports but ignores jobs lost due to growing imports. The U.S. economy has grown in the past 20 years despite NAFTA, not because of it. Worse yet, production workers’ wages have suffered in the United States. Likewise, workers in Mexico have not seen wage growth. Job losses and wage stagnation are NAFTA’s real legacy.
Fight Over Greek Feta Blocks US-EU Trade Talks - When one imagines the world's two largest bureaucracies - the European Union and the US - trying to coordinate what may be the world's most sophisticated free-trade agreement, one would expect things like genetically modified crops, chlorine-washed chicken, and beef quotas to be key sticking points. One would not expect Greek Feta cheese to be among the main hurdles. Which is precisely what it is, because as Kathimerini reports "a fight over who can call Greek-style cheese “feta” is blocking the way toward the world’s largest free-trade deal. Of course, in a world in which something as "consequential" as who gets to call Feta by its name will require days if not weeks of negotiations, one wonders why bother with trade when central planners can just print commerce and wealth all day long anyway. From the Greek media outlet: At a time of low economic growth on both sides of the Atlantic, EU-US free-trade negotiations seek to integrate two markets representing almost half the world’s economy in a sophisticated agreement going far beyond lowering tariffs.But food is different and the old issues that have bedeviled many trade talks around the world are likely to complicate the ambitious Transatlantic Trade and Investment Partnership (TTIP) between Brussels and Washington. The EU is determined to write into any deal its system of geographical indications, which protects countries’ or regions’ exclusive right to product names, such as France’s champagne, Greek feta cheese or Italian Parma ham. US groups say this demand “defies credibility” because in the cause of free trade, US producers would, for example, no longer be able to market cheeses as “feta.”
Sharp Decline in France PMI; Private Sector Employment Drops 21st Time in 22 Months - Those expecting an end of the recession in France got another jolt of reality this morning. The Markit Flash France PMI shows Sharper fall in output at French companies in December. Key Points:
- Flash France Composite Output Index falls to 47.0 (48.0 in November), 7-month low
- Flash France Services Activity Index drops to 47.4 (48.0 in November), 6-month low
- Flash France Manufacturing Output Index slips to 45.3 (48.0 in November), 7-month low
- Flash France Manufacturing PMI falls to 47.1 (48.4 in November), 7-month low
Both the manufacturing and service sectors signalled sharper reductions in output than in November. Services activity decreased for the second month running, and at the fastest pace since June. Meanwhile, manufacturers posted a marked decline in production, extending the current sequence of contraction to five months. Respondents indicated that lower new orders was behind the fall in output, in turn linked to caution among clients. New business decreased for the third month running. Staffing levels also continued to decline during December. Employment in the French private sector has fallen in 21 of the past 22 months. The solid reduction in December was reflective of falls across both the manufacturing and service sectors and was mainly linked by firms to a decrease in new orders. The rate of input price inflation in the French private sector eased from November and remained much weaker than the series average. Manufacturers posted the slowest rise in input costs in three months, while inflation in the service sector was the weakest since July. Companies continued to lower their output prices during December amid reports from panellists of strong competition for new business.
France could struggle to reverse 3Q downturn -Economic activity in France contracted for a second straight month in December, and at the fastest pace for seven months, a survey showed Monday, weighed down by weak demand for goods and services. The data suggest the likelihood the French economy will eke out some growth in the final quarter of 2013 after shrinking in the third quarter is slim. Data provider Markit said the preliminary reading of its composite purchasing managers index fell to 47.0 in December from November's 48.0. A reading below 50 shows private sector activity is shrinking. The slowdown came as new orders fell again across both the manufacturing and services sectors, while job cuts were again in evidence, highlighting the fragility of the economic situation. "The last flash PMI readings for 2013 paint a worrying picture on the health of the French economy," said Andrew Harker, senior economist at Markit. "The return to contraction in November has been followed up with a sharper reduction in December, with falling new business at the heart of this as clients were reportedly reluctant to commit to new contracts."
Germany and France economic divergence -- The Eurozone recovery continues to be uneven, powered primarily by a pickup in export-driven manufacturing and with only some nations participating. In particular we are witnessing a significant divergence between the area’s two largest economies, Germany and France. As German manufacturing firms gain momentum (see post), the French recovery has stalled. The Telegraph: - Figures showing private sector growth across the Eurozone have underlined the widening chasm between the bloc's economic giants, Germany and France, with the latter increasingly looking like the "sick man of Europe". … looking at the separate surveys, it is clear that Germany is pulling away from France. Germany's manufacturing sector grew at its fastest clip in 30 months, and services are expanding too. But in France, both sectors are in a sharpening decline. … it's the unbalanced nature of the upturn among member states that is the most worrying. France looks increasingly like the new 'sick man of Europe', as a second successive monthly contraction may translate into another quarterly decline in GDP, pushing the country back into a technical recession. In contrast, the December survey data round off a solid quarter of growth in Germany, in which GDP looks set to rise by 0.5pc. The following chart of manufacturing PMI trends tells the story of divergence. Note that a reading below 50 represents a contraction in the manufacturing sector.
Far Right in Eastern Europe Makes Gains as Syrians Arrive - The local leader of Ataka, a pugnacious, far-right party, Mr. Bozhinov lost his seat in the town council at the last municipal elections in 2011 but now sees his fortunes rising thanks to public alarm over an influx of Syrian refugees across the nearby frontier. Membership of the local branch of Ataka, he said, had surged in recent weeks as “people come up to me in the street and tell me that our party was right.” Ataka, which means attack, champions “Bulgaria for Bulgarians” and has denounced Syrian refugees as terrorists whom Bulgaria, the European Union’s poorest nation, must expel. An Ataka member of Parliament has reviled them as “terrible, despicable primates.” With populist, anti-immigrant parties gathering momentum across much of Europe, Ataka stands out as a particularly shrill and, its critics say, sinister political force — an example of how easily opportunistic groups can stoke public fears while improving their own fortunes. The influx of Syrian refugees has sown divisions across the European Union as the refugees add burdens on governments still struggling to emerge from years of recession. But Bulgaria is perhaps the most fragile of all the European Union’s 28 members. Modest as the numbers of refugees are here, the entry of nearly 6,500 Syrians this year has overwhelmed the deeply unpopular coalition government and added a volatile element to the nation’s already unstable politics.
Portugal top court blocks austerity pensions cuts - — Portugal’s constitutional court yesterday blocked a key and controversial austerity measure in the 2014 budget that provides for cuts of up to 10 per cent in civil service pensions. The ruling, which had been highly awaited by the markets, comes three days after the government said the troika of creditors — the European Union, International Monetary Fund and European Central Bank — approved the country’s performance so far under its €78-billion-bailout agreement six months before the programme is set to end. But the 13 court judges unanimously ruled that the measure was unconstitutional as it “violates the principle of trust”, according to the judgement that was read by a court spokesman. Savings under the reform of civil service pensions are key to the government’s declared target of bringing the public deficit down to 4 per cent of GDP next year. The savings have been estimated at €388 million, or one tenth of the austerity measures that total €3.9 billion. The government must now find the funds elsewhere.
EU reaches landmark deal on failed banks - FT.com: The EU has agreed a common rule book for handling failed banks, in a compromise that brings forward the date when senior creditors must face losses but still leaves room for governments to launch bailouts. In late-night talks in Strasbourg on Wednesday, negotiators for the European Parliament and EU member states brokered a deal on a bank recovery and resolution directive, which was intended to lift the burden of bank failure from taxpayers. The reform is one of the bloc’s most important attempts to shore up patchy national regimes for handling shaky banks, which were badly exposed by the financial crisis. Taxpayers have put about €473bn into European banks since 2008. It provides the legal framework for dealing with lenders in trouble at national level and will apply across all 28 member states from 2015. Its provisions would be enforced by a central authority in a eurozone banking union – a separate Brussels reform that is still under negotiation. The deal will bring in so-called bail-in rules for senior bondholders from 2016, two years earlier than envisaged by finance ministers in their common position agreed in June. Governments will be given more flexibility to recapitalise banks with public money, either after stress tests or during a systemic crisis. However, the interventions would only be possible under defined conditions and would need EU approval.
Germany appears to backtrack on EU banking deal - EU finance ministers have promised to agree on a so-called single-resolution mechanism--consisting of more centralized decision-making and financing for the shuttering or downsizing of failing banks--before the end of the year. But a letter sent by Wolfgang Schäuble to some of his counterparts sets clear limits on how far Europe's biggest economy is willing to go. Mr. Schäuble's letter, dated Dec. 12 and seen by The Wall Street Journal, was described by German officials as reiterating Berlin's concerns expressed in recent talks. At the heart of the disagreement is what to do when so-called bank resolution funds, financed by the banking sector, run out of money. Under the provisional agreement reached last week, euro-zone countries would start building up national resolution funds by imposing levies on their banks. Those national funds would be gradually merged over 10 years into a single European fund containing around €55 billion.Throughout the talks, Germany and other rich euro-zone countries such as Finland made clear that they didn't want their taxpayers to pay for problems that had developed in other countries' banks in the past. If the resolution funds prove too small to deal with a big bank's failure, taxpayers in the lender's home country should pick up the bill, they argued. France and some Southern European countries, meanwhile, have been pushing to use the euro-zone government bailout fund, the European Stability Mechanism, as the common backstop.
Not Fit for the Next Crisis: Europe's Brittle Banking Union - German Finance Minister Wolfgang Schäuble has negotiated a European banking union suited perfectly to his country's tastes. It looks like a victory, but it could prove to be very expensive if Europe or Germany face another financial crisis. Schäuble and his negotiators succeeded in ensuring that in 2016, the Single Resolution Mechanism will go into effect alongside the European Union banking supervisory authority. The provision will mean that failing banks inside the euro zone can be liquidated in the future without requiring German taxpayers to cover the costs of mountains of debt built up by Italian or Spanish institutes. They also backed the European Commission, which wanted to become the top decision-maker when it comes to liquidating banks. The Commission will now be allowed to make formal decisions, but only in close coordination with national ministers from the member states. But it goes even farther. Negotiators from Berlin have also created an intergovernmental treaty, to be negotiated by the start of 2014, that they believe will protect Germany from any challenges at its Constitutional Court that might arise out of the banking union. They also established a very strict "liability cascade" that will require bank shareholders, bond holders and depositors with assets of over €100,000 ($137,000) to cover the costs of a bank's liquidation before any other aid kicks in. The banks are also required to pay around €55 billion into an emergency fund over the next 10 years. Until that fund has been filled, in addition to national safeguards, the permanent euro bailout fund, the European Stability Mechanism, will also be available for aid. However, any funds would have to be borrowed by a national government on behalf of banks, and that country would also be liable for the loan.
Big rise in subordinated debt issuance by EU banks - Banks have taken advantage of yield-chasing investors to issue $90.7bn of subordinated debt for the year to date, a 41 per cent increase compared to the same period in 2012. It is the highest such volume since the $122.4bn seen in 2008 according to Dealogic, the data provider. The figures follow a deal agreed by European regulators earlier this month that will bring in so-called bail-in rules for senior bondholders from 2016, two years earlier than envisaged by finance ministers in their common position agreed in June. Banks are also expected to issue record amounts of loss-absorbing contingent convertible – or “coco” – bonds next year, which can either convert to equity or wipe out investors entirely if a bank’s capital ratio falls below a pre-agreed level.
Italy's Bad Loans Reach 14-Year Peak in October --The total amount of bad loans held by Italian banks continued to rise in October, data published Tuesday by the country's banking association showed, and has been at a 14-year high for three consecutive months. Gross bad loans grew by 22.9% on the year to 147.3 billion euros ($202.8 billion), ABI said, with bad loans net of impairment rising by 28% to EUR77.4 billion. ABI said that gross bad loans were 7.7% of total loans in October, compared with 7.3% and 7.5% in August and September, respectively. The gross figure is at a similar level to 1999, but is well below the record of 9.9% seen in December 1996. Bank executives say the Bank of Italy has started to inspect local banks within the framework of the asset-quality review that involves larger euro-zone banks ahead of the European Central Bank becoming their supervisor next year. Analysts expect some banks to post higher loan-loss provisions in the fourth quarter as a result of the inspections.
Unemployed told to leave Ireland in desperate move to slash welfare costs - Ireland is asking its citizens to leave the country if they can't find a job in a desperate bid to slash welfare costs. The Irish government has sent letters to approximately 6,000 unemployed people suggesting they should take jobs in other European countries in an effort to reduce unemployment benefits, the Financial Times has reported. Some of the jobs were poorly paid but came with a "Mediterranean" climate. An unemployed electrician was encouraged to move to Coventry, while another jobseeker was offered work as a bus driver in Malta. Dublin defended the move insisting that the positions are voluntary and no one is being forced to leave the country. Ireland is close to becoming the first euro zone nation to make a successful exit from its international bailout programme after the country's finances collapsed in the 2008 financial crisis. Unemployment has eased in recent months, falling to its lowest level in four years in November at 12.5 per cent, but youth unemployment remains a problem. Overall, one in four Irish under 25 is still unemployed.
S&P cuts EU's AAA rating, European officials dismiss move - Credit agency Standard & Poor's cut its triple-A rating of the European Union by one notch today, saying it had concerns about how the bloc's budget was financed, a view EU leaders and other officials dismissed as misguided. S&P's announcement came the day after the EU reached a deal to overhaul the region's banking sector, an agreement many commentators said fell short of expectations, although S&P said it had not factored into its credit assessment. "In our opinion, the overall creditworthiness of the now 28 European Union member states has declined," the rating agency said in a statement that came 11 months after it announced it had a 'negative' outlook on the bloc. "EU budgetary negotiations have become more contentious, signalling what we consider to be rising risks to the support of the EU from some member states." European officials said they were not surprised by the move to AA+ since S&P recently downgraded the Netherlands and has lowered its view on six other member states - France, Italy, Spain, Malta, Slovenia and Cyprus - in the past year. But they pointed out that the EU has no debt or deficit to speak of and its budget is a stand-alone entity financed by 28 countries, making it one of the most stable institutions and most reliable borrowers in the world.
S&P affirms Britain's triple-A rating but strips EU - Standard & Poor's confirmed Britain's last remaining triple-A credit rating but said it could be lost if the recovery did not take hold. However, it cut its rating for the European Union from AAA to AA-plus, citing rising tensions on regional budget negotiations. S&P said Britain continued to benefit from "exceptional monetary flexibility" as it affirmed the UK's long-term rating at AAA/A-1+. The rating agency said Britain's economy was recovering on the back of private consumption and residential investment but said the outlook remained negative, reflecting its "view of risks to the sustainability of economic growth". On the European Union, S&P said: "In our opinion, the overall creditworthiness of the now 28 European Union (EU) member states has declined.
Ring-fence costs could force retail banks to charge customers - Government plans to split banks between their retail and investment arms could put at risk free banking and lead to the closure of high street branches. A report by the Policy Exchange think tank says that costs will be increased if Coalition legislation to “ring-fence” banking operations are too rigidly enforced. Plans for the ring-fencing of banks came after the Government-backed Independent Commission on Banking recommended the policy in 2011. The legislation is about to complete its passage through Parliament. A later parliamentary commission chaired by the MP, Andrew Tyrie, said that the ring fence should be “electrified” with transgressions punished by the complete break-up of banks. The findings of the Policy Exchange study are significant because the organisation is known to be close to the Chancellor. Its chairman is Lord Finkelstein who has strong links to George Osborne.
Stumbling Toward the Next Crash -- Gordon Brown - In early October 2008, three weeks after the Lehman Brothers collapse, I met in Paris with leaders of the countries in the euro zone. Oblivious to the global dimension of the financial crisis, they took the view that if there was fallout for Europe, America would be to blame — so it would be for America to fix. I was unable to convince them that half of the bundled subprime-mortgage securities that were about to blow up had landed in Europe and that euro-area banks were, in fact, more highly leveraged than America’s. Despite the subsequent decision of the Group of 20 in 2009 on the need for rules to supervise what is now a globally integrated financial system, world leaders have spent the last five years in retreat, resorting to unilateral actions that have made a mockery of global coordination. Already, we have forgotten the basic lesson of the crash: Global problems need global solutions. And because we failed to learn from the last crisis, the world’s bankers are carrying us toward the next one. The economist David Miles, who sits on the monetary policy committee of the Bank of England, may exaggerate when he forecasts financial crises every seven years, but most of the problems that caused the 2008 crisis — excessive borrowing, shadow banking and reckless lending — have not gone away. Too-big-to-fail banks have not shrunk; they’ve grown bigger. Huge bonuses that encourage reckless risk-taking by bankers remain the norm. Meanwhile, shadow banking — investment and lending services by financial institutions that act like banks, but with less supervision — has expanded in value to $71 trillion, from $59 trillion in 2008.
Interest rates, growth and the primary balance -- Nick Edmonds objects to my assertion that real interest rates should be at or below the real growth rate of the economy (my emphasis): "Interest payments are just transfer payments, so their impact on stability has to be seen in the context of other transfer payments (principally taxes and benefits). Depending on the structure of these other transfers, there is no reason per se why the interest rate on safe assets has to be below the growth rate. (See for example http://www.levyinstitute.org/pubs/wp_494.pdf ) There is no public sector in Samuelson, so you don't get these transfer flows, but by the same token his assets aren't actually claims on anybody, so they can't really be thought of as safe assets. "Of course, it may be that excessive interest rates entail tax and transfer rates that are unpalatable, but that's a different issue." I don't think it's a different issue at all. It's the whole point. Not just "unpalatable", but unsustainable tax and transfer rates are inevitable if real interest rates on safe assets are too high. And this has serious implications not only for the welfare of future generations, but also for economic stability and long-run growth. As Left Outside points out, real interest rates persistently above the long-term expected real growth rate are effectively a subsidy of current generations by future generations.
BOE voted unanimously to keep rates, QE unchanged -- The Bank of England's Monetary Policy Committee earlier in December voted 9-0 to keep the central bank's interest rates and asset-purchase program unchanged, according to the minutes of the meeting published Wednesday. The interest rate was kept at a record low 0.5%, where it has stood since March 2009. The quantitative-easing program stayed at 375 billion pounds ($610.65 billion). "With unemployment remaining above the 7% threshold, the Committee's forward guidance remained in place, and no member thought it appropriate to tighten, or to loosen, the stance of monetary policy at the current juncture," the central bank said in the minutes.


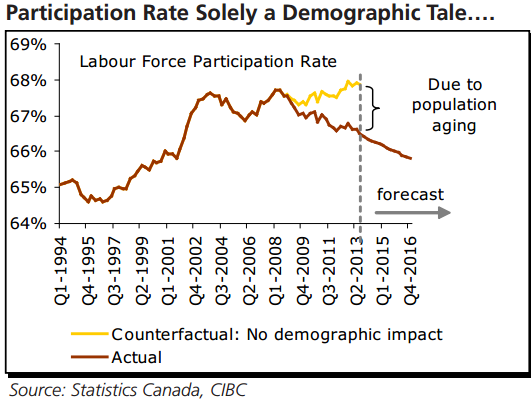
No comments:
Post a Comment