FRB: H.4.1 Release-- Factors Affecting Reserve Balances -- Thursday, December 05, 2013: Federal Reserve Statistical Release - Factors Affecting Reserve Balances of Depository Institutions and Condition Statement of Federal Reserve Banks
I Bet You Didn't Know the Fed owns 40% of All Treasuries Over 5 Years in Maturity - Talk about creating moral hazard. The Fed has cornered almost 40% of all Treasuries over 5 years in maturity. I’ve just discovered the killer aspect line from Quantitative Easing. The Fed’s 4 years of QE, QE1, QE2, and QE3 has accumulated 36% of all Treasury securities between 5 years and 10 years in maturity plus 40% of those government bonds over 10 years in maturity as well as 25% of all the mortgage backed securities not owned by Fannie Mae Fannie Mae and Freddie Mac Freddie Mac. Just how do you suppose Chairman Yellen will devise an exit strategy to this concentrated ownership that makes up some $3 trillion of the central bank’s $4 trillion balance sheet? Short of a miracle, Chairman Yellen faces one of the most imposing and possibly impossible challenges facing the financial markets over the next several years. If anything will derail the economy, force the stock market into a mighty retreat and destroy all hope of further expansion of the residential real estate market, it is the Fed’s quandry over the retreat from quantitative easing. And you can be sure that the potential overhang of Treasury securities and mortgage backed bonds overhanging the market are not going to look like bargains to the cash-rich central banks of China, Japan, Russia,or to the pension funds and endowments.
Chart Of The Day: The Fed Now Owns One Third Of The Entire US Bond Market - The most important chart that nobody at the Fed seems to pay any attention to, and certainly none of the economists who urge the Fed to accelerate its monetization of Treasury paper, is shown below: it shows the Fed's total holdings of the entire bond market expressed in 10 Year equivalents (because as a reminder to the Krugmans and Bullards of the world a 3 Year is not the same as a 30 Year). As we, and the TBAC, have been pounding the table over the past year (here, here and here as a sample), the amount of securities that the Fed can absorb without crushing the liquidity in the "deepest" bond market in the world is rapidly declining, and specifically now that the Fed has refused to taper, it is absorbing over 0.3% of all Ten Year Equivalents, also known as "High Quality Collateral", from the private sector every week. The total number as per the most recent weekly update is now a whopping 33.18%, up from 32.85% the week before. Or, said otherwise, the Fed now owns a third of the entire US bond market.
Fed officials call for clear plan on wind down of QE3 - The Federal Reserve should telegraph the end of its current massive round of bond-buying by committing to a set schedule for the wind-down, two top policymakers said on Thursday. Their embrace of the idea, after two others have publicly supported it in recent weeks, suggests it may be gaining traction ahead of a much-anticipated December 17-18 Fed policy meeting. The Fed, frustrated with the slow and halting pace of recovery from the 2007-2009 recession, has kept interest rates near zero for five years and has swelled its balance sheet to nearly $4 trillion to spur investment, hiring, and growth. Now that unemployment has fallen to 7.3 percent, from a post-recession high of 10 percent in 2009, financial markets are on edge about when the Fed will reduce its 15-month-old quantitative easing program, known as QE3 because it is the third such round. On Thursday, Atlanta Fed President Dennis Lockhart said the Fed should consider taking the first step in reducing its current $85-billion monthly bond-buying program at upcoming meetings, including December's, given the overall positive economic activity of late. "Once the decision is made, I favor providing the public as much clarity and certainty as possible about how the change will be executed," "It will be helpful to the transition process to provide as much certainty as possible about how this will be done," said Lockhart, a centrist along the Fed's policymaking spectrum. Dallas Federal Reserve Bank President Richard Fisher, one of the central bank's most hawkish policymakers, likewise lent his support to a timed and predictable wind-down of a policy that Fisher personally has opposed from the first. "We should define a very clear path: that is, once we start tapering, absent some major disruption or thing that comes out of the blue, a definite path as to when we reach zero,"
Fed Official: Tests of New Tool Are Going Well - An official responsible for implementing Federal Reserve monetary policy said Monday that tests of a new tool, designed to help the central bank control short-term interest rates when the time comes to tighten monetary policy, appear to be going well.The official, Federal Reserve Bank of New York executive vice president Simon Potter, leads the markets group for the arm of the central bank that deals directly with financial markets. Mr. Potter does not set monetary policy but he is responsible for working with financial markets to make the Fed’s policy objectives come to pass. Mr. Potter stressed in his speech that his comments, which came from the text of a speech prepared for delivery before a gathering of the Money Marketeers of New York University, were aimed at discussing Fed planning, and that they were not a signal of central bank policy. The tools Mr. Potter discussed are aimed at helping the Fed control short-term interest rates when it begins to tighten monetary policy. Most believe that will likely happen some time in 2015. Unprecedented actions by the Fed have left short-term rates effectively at zero percent over the last five years. Central bankers are now challenged with the task of conjuring up tools to eventually raise short term rates at a time where the Fed balance sheet is flush with a massive level of reserves. Mr. Potter said, “I’m assuming that [Federal Open Market Committee] policy will dictate that the balance sheet remains large, and that open market operations would be designed to achieve the Committee’s objectives in such an environment.”
Is QE lowering the rate of inflation? - The answer may be "yes," according to a new paper by Steve Williamson. In examining the effects of a QE experiment in his model economy, he reports the following (p. 16): Some of the effects here are unconventional. While the decline in nominal bond yields looks like the "monetary easing" associated with an open market purchase, the reduction in real bond yields that comes with this is permanent, and the inflation rate declines permanently. Conventionally-studied channels for monetary easing typically work through temporary declines in real interest rates and increases in the inflation rate. What is going on here? The change in monetary policy that occurs here is a permanent increase in the size of the central bank's holdings of short-maturity government debt - in real terms - which must be balanced by an increase in the real quantity of currency held by the public. To induce people to hold more currency, its return must rise, so the inflation rate must fall. In turn, this produces a negative Fisher effect on nominal bond yields, and real rates fall because of a decline in the quantity of eligible collateral outstanding, i.e. short maturity debt has been transferred from the private sector to the central bank. Williamson describes these findings on his blog here: Liquidity Premia and the Monetary Policy Trap.
Does QE cause deflation? - Noah Smith - Remember back in 2011 when Narayana Kocherlakota theorized that low interest rates cause deflation? Well, on Wednesday, Steve Williamson made a similar claim, writing that in a liquidity trap, QE will cause long-term deflation. Williamson based his post on this paper. In a testy response, Nick Rowe called Williamson's post "horribly wrong," lamenting: "What the hell has gone wrong with some of the best and brightest in economics?" Brad DeLong then jumped in, accusing Williamson of mistaking an unstable equilibrium for a stable one. Paul Krugman echoed that accusation. But David Andolfatto, in this excellent post, showed that DeLong and Krugman's criticisms are misplaced. In a typical New Keynesian model - the kind that now mostly dominates business-cycle theory, and the kind preferred by Rowe and Krugman - it's true that Williamson would be picking an unstable equilibrium. But Williamson is not using a New Keynesian model! Williamson's model is actually quite different. And as Andolfatto points out, there are macro models out there that are very similar to New Keynesian models, but have one small twist that makes the "QE-causes-deflation" equilibrium the stable one! So DeLong and Krugman have gone too far. They are arguing from their preferred model, and that's fine. But Williamson is simply using a different model than the standard model, and DeLong and Krugman have not yet examined that model carefully.
Nominal interest rates and inflation - Nick Rowe - This is for David Andofatto, in response to his recent post (and for anyone else who might be interested). If the central bank raises the nominal interest rate, what happens to actual and expected inflation depends on why people think the Bank did it. The representative agent cannot be assumed to know he is the representative agent. He observes the shocks that hit him, but does not observe the shocks that hit other agents. He cannot distinguish individual-specific from economy-wide shocks. Just because an agent has rational expectations does not mean he can solve the central planner's problem. That's why we need markets, to coordinate the plans and expectations of individual agents, each with their own local knowledge. Hayek, the socialist calculation debate, and all that. Only if the representative agent knew he was the representative agent would he be able to solve the aggregate version of the central planner's problem, just by introspection and rational expectations. Suppose the economy is humming along nicely, with actual and expected inflation at the 2% target, and actual and expected output at potential output. And then all of a sudden the Bank raises the nominal interest rate by 1%, for no reason at all. What happens next? Actual (and expected) inflation would need to rise by 1% to keep real interest rates the same and keep output at potential. But will it in fact rise by 1% and will output actually stay at potential?
Is QE deflationary or not? - We first proposed the idea that QE could be (but wasn’t necessarily) deflationary a couple of years ago. It was dubbed a counter-intuitive idea by Tyler Cowen. More recently, a similar proposition has been made by Stephen Williamson — though this time using models and proper math. His view is a little different to ours because it’s less focused on the safe asset squeeze and more on the conditions that generate a preference for cash over yielding paper in the first place. Hint: you have to think the purchasing power of cash will go up regardless. Our point was simply that when a squeeze on safe assets is created, and there is too much money chasing fewer safe securities, this can lead to a crowding out effect that encourages principal value-based destruction, much like what happens when too much money chases too few goods and services. In the latter scenario, money loses purchasing power against real-world output — on the presumption that goods or productive assets capable of making surplus goods will hold value better than over-supplied money . In the former, money loses purchasing power against financial stores of value — on the presumption that Treasury and other safe securities will hold value better than over-supplied money or productive assets that create too many surpluses, and are costly to run. Both panics hail from the same concern: that there is too much money and not enough of the stuff that money desires to be redeemed against.The difference, however, is that in one scenario money is chasing stores of value (tomorrow’s goods) while in the other money is chasing real-world goods (today’s goods).
Is QE deflationary? -- STEPHEN WILLIAMSON is an economist at Washington University in St Louis, specialising in monetary economics. He is also an instigator. And what he has most recently instigated is an epic blogospheric debate over whether quantitative easing—the practice of printing money to buy assets, and nightmare fuel for the hard-money set—is deflationary. Noah Smith has done a wonderful job keeping track of the vollies, so those interested in further reading should start there. A very horribly simplistic summary of the debate is: Mr Williamson argued that basic monetarist economics, as expressed in several equations, implies that QE should generate falling inflation; critics responded that his argument doesn't make sense and asked him to explain, in words, just how QE might generate falling inflation; Mr Williamson explained, in words, that his equations imply that QE should generate falling inflation. I think that's where things stand at the moment. And now seems as good a time as any for me to weigh in. Is QE deflationary? Yes, quite obviously so. Consider:
- A central bank that is deploying QE is almost certainly at the zero lower bound.
- QE will only help get an economy off the zero lower bound if paired with a commitment to higher future inflation.
- If a central bank is deploying QE over a long period of time, that means it has not paired QE with a commitment to higher future inflation.
- Prolonged QE is effectively a signal that the central bank is unwilling commit to higher inflation.
- QE therefore reinforces expectations that economic activity will run below potential and demand shocks will not be completely offset.
- QE will be associated with a general disinflationary trend.
Don't believe me? Here is a chart of 5-year breakevens since September of 2012, when the Fed began QE3, the first asset-purchase plan with no set end date:
Why is inflation low and steady? -- While some debate whether QE is causing low inflation… there is a practical view of low inflation from an article written by Chun Wang at Advisor Perspectives.Here are some excerpts…“A key factor allowing the Fed to maintain QE is the lack of inflation. You would think after multiple rounds of synchronized global money printing and a recovering global economy that inflation would be felt in more noticeable ways. But the reality is, among the G4 and major emerging countries, only Japan is creating inflation (Chart 1). Even emerging countries have seen inflation weaken in the last few months (chart not shown). The lack of inflation is global in scope, not just within the U.S.” “In the U.S., inflation is not much better either. At both the consumer and producer levels, inflation is weakening, not strengthening (Charts 2 & 3). This is puzzling because the Fed is one of the most accommodative central banks in the world, and the U.S. economy is in a better shape than most other countries.” The lack of inflation is actually encouraging QE. It is not that QE is causing low inflation.
PCE Price Index Update: The Core Measure Falls Further Below the Fed Target - The October Personal Income and Outlays report for October was published today by the Bureau of Economic Analysis. The latest Headline PCE price index year-over-year (YoY) rate of 0.74% is a decline from last month's adjusted 0.95% (previously 0.92%). The Core PCE index of 1.11% is fractionally lower than last month's adjusted 1.22% (previously 1.19%). As I pointed out last month, the general disinflationary trend in core PCE (the blue line in the charts below) must be quite troubling to the Fed. After years of ZIRP and waves of QE, this closely watched indicator has consistently moved in the wrong direction since early 2012 and, after flatling since May, it has now slipped lower. The adjacent thumbnail gives us a close-up of the trend in Core PCE since January 2012. The first chart below shows the monthly year-over-year change in the personal consumption expenditures (PCE) price index since 2000. I've also included an overlay of the Core PCE (less Food and Energy) price index, which is Fed's preferred indicator for gauging inflation. I've highlighted 2 to 2.5 percent range. Two percent had generally been understood to be the Fed's target for core inflation. However, the December 12 FOMC meeting raised the inflation ceiling to 2.5% for the next year or two while their accommodative measures (low FFR and quantitative easing) are in place. I've calculated the index data to two decimal points to highlight the change more accurately. For a long-term perspective, here are the same two metrics spanning five decades.
The Wrong Debate: Helicopter Drops vs. Quantative Easing - A central theme of this blog is that the economy is still starved of the monetary assets needed to restore full employment. That is, the ongoing shortfall of aggregate demand is at its core caused by a shortage of money and money-like assets relative to the demand for them. The question, then, is what can be done about this problem. I have long argued, along with other Market Monetarists, that the Fed could solve this problem by adopting a NGDP level target. Why would this help? The key reason is that it would create an expectation that some portion of the monetary base growth from the asset purchases would be permanent (and non-sterilized by IOER). That, in turn, would mean a permanently higher price level and higher nominal income in the future. Such knowledge would cause current investors to rebalance their portfolios away from highly liquid, low-yielding assets towards less liquid, higher yielding assets. The portfolio rebalancing, in turn, would raise asset prices, lower risk premiums, increase financial intermediation, spur more investment spending, and ultimately catalyze a robust recovery in aggregate demand. The key to the above story is that some portion of the monetary base expansion is expected to be permanent. If the public believes the Fed's asset purchases are not going to be permanent and therefore the price level and nominal income will not be permanently higher, the rebalancing will not take place. I bring this up because this same point applies to helicopter drops or any other kind of fiscal policy stimulus. Yet many of my fiscalist friends miss it. They seem to think that helicopter drop will solve the excess money demand problem, period. That is not the case if the Fed continues to hit its inflation target.
Why It Matters Whether the Fed Targets Inflation or Unemployment - Today, more than four full years since analysts at the National Bureau of Economic Research declared the last recession officially over, unemployment, at 7.3 percent, remains elevated. The jobless rate still exceeds the 2001 recession peak and stands not far below the higher peak from the 1990-91 downturn. How should Federal Reserve policymakers respond to this continuing crisis? And what new procedures might they put in place to ensure that nothing like it ever happens again? These questions are addressed in two studies released by top economists from the Federal Reserve Board, presented at a high-profile conference sponsored by the International Monetary Fund, and discussed widely in the popular press, including a recent article from the Wall Street Journal. William English, David Lopez-Salido, and Robert J. Tetlow argue that even when the current short-term interest rate is constrained by the zero lower bound, monetary policy can still provide additional support for a weak economic recovery if policymakers promise to keep that interest rate low for a prolonged period of time through a form of so-called “state-dependent forward guidance.” Their analysis suggests that in the United States today, it might be appropriate for interest rates to remain low until unemployment crosses a “threshold” as low as 5.5 percent. Dave Reifschneider, William Wascher, and David Wilcox propose a more permanent change to monetary policy. Going forward, they argue, the Fed should respond more vigorously to rising unemployment in the early stages of an economic downturn to prevent anything like a replay of what we experienced during 2008 and 2009.
Unemployment Won’t Hit 6.5% Until 2015, Fed Research Suggests - A new paper from researchers at the Federal Reserve Bank of Cleveland could assuage the concerns of some market participants who still doubt the Fed’s commitment to keep rates low even after the recovery picks up steam. The paper’s authors attempt to gauge when the U.S. unemployment rate, currently at 7.3%, might hit 6.5% — the threshold set by Fed officials for when they will start considering an increase in short-term interest rates. “The most likely outcome,” based on their model is unemployment hitting 6.5% in the first quarter of 2015, the authors write. That’s later than Fed officials’ projections of hitting the mark sometime in 2014, probably in the second half. Fed officials have stressed that reaching 6.5% would not necessarily trigger immediate rate increases. It is a threshold for “possible action,” she said in February. The Fed has held its benchmark short-term rate near zero since late 2008.The Cleveland Fed paper also suggests the central bank might delay the moment of its first rate increase by setting a new lower threshold for inflation. Fed officials have said they will not raise rates as long as inflation is projected to stay below 2.5% over two years. They could add that they won’t act as long as inflation is below a certain level. That’s something St. Louis Fed President James Bullard has advocated in recent months.The researchers find that setting an inflation floor of 1.5% would have just a modest impact on the timing of the first increase in short-term rates. But a 1.75% floor could cause “a considerable delay.”
Jobless Rate Hitting 7% Underscores Fed’s Mistake - We won’t know the precise impact of Friday’s jobs numbers on the Federal Reserve’s $85 billion-per-month bond-buying program until the central bank meets Dec. 17-18. But one thing’s for sure: the latest jobs report sure does underscore the Fed’s 7% mistake. Back in June, when Fed Chairman Ben Bernanke laid out a tentative timeline for winding down the bond-buying program, he said 7% is where the Fed expected the unemployment rate to be when it ended the purchases. He said central bank officials expected that to occur around mid-2014. Friday’s jobs report showed the jobless rate hit that level in November, and the Fed hasn’t even started scaling back the program. The jobless rate for May, the latest data Mr. Bernanke had when he laid out that guidepost, stood at 7.6%. Then it fell much more quickly than Fed officials expected, dropping to 7.4% in July and 7.3% in August. In September, the Fed surprised many market participants and held the quantitative-easing program steady. At his press conference after that meeting, Mr. Bernanke made no mention of the 7% guidepost he’d set out a mere three months earlier. When asked about it, he downplayed the importance.
Fed Watch: Stronger and Sustainable, But... The employment report produced a modest upside surprise with a gain of 203k jobs in November, remarkably close to my estimate of 211k from yesterday, which I might as well enjoy because it will never happen again. In addition, the unemployment rate fell to 7% while the labor force participation rates ticked up 0.2 percentage points. Smells like a tapering report. How will the Fed react to the inflation numbers? That seems to be the real question.The drop in the unemployment rate reveals the challenges with the Fed's forward guidance. As Victoria McGrane at the WSJ notes, Federal Reserve Chairman Ben Bernanke gave a clear signal earlier this year that the Fed expected its bond buying plan to be wound down by the time the unemployment rate hit 7%. We haven't even started the taper yet. I tend to think the 7% marker was the single biggest communications failure on the part of the Fed, and contributed greatly to the bond market volatility earlier this year. Of course, it is an error the Fed will never admit to. The steady recent gains in job growth coupled with the decline in the unemployment rate certainly put tapering on the table at the next FOMC meeting. But a policy move at that point seems premature. The issue of tapering is currently wrapped up with a host of issues as noted by Jon Hilsenrath at the WSJ: Waiting until January will give them a little more time to confirm their increasing optimism about the economy and more time to finalize their exit strategy from the bond program and prepare markets for how they’ll proceed. They still have lots of questions to answer about the overall thrust of their policies and how they communicate their plans. Some officials want to put a cap on the overall amount of bonds they plan to buy, rather than leave it open-ended. They’ve also been debating for several months whether to once again alter their guidance to the public about when they’ll raise short-term interest rates.
The US Economy Can’t Take QE - As has been the case throughout this recovery, ‘positive’ readings for both of these ISM surveys in 2013 have sparked optimism around the outlook, irrespective of what other data may indicate. The manufacturing ISM outcomes noted above are strong relative to history. The disparity between the manufacturing PMI and real GDP outcomes is difficult to justify without casting doubt over the index’s accuracy; to a lesser extent, the same can be said about the non-manufacturing ISM, with its 2013 burst to above-average levels out of kilter with the sub-trend domestic final demand growth of mid-2013. Arguably, the disparity in both sectors is being driven by two key factors: ISM respondents are typically larger firms with global exposure and comparatively strong market positions; also, the larger rise in production and activity versus employment points to a degree of spare capacity, limiting the pass through of momentum to the broader economy. To test this thesis, it is instructive to consider the NFIB small business survey. Firms surveyed by NFIB arguably focus more on the domestic economy than export markets. Being smaller, their market position is also likely to be weaker. Arguably, not only are these comparably smaller firms unable to benefit from global demand, but they are also finding themselves at a competitive disadvantage against larger competitors in the domestic market. Aside from the detail on activity and employment, the NFIB survey is also of use when considering smaller firms’ appetite for debt to fund expansion as well as banks’ willingness to provide the necessary funding. As at October, just 6% of respondents saw now as being a “good time to expand facilities”. It is hardly surprising then that “a record 66% expressed no interest in a loan” and that a record-low 28% of business owners reported borrowing on a regular basis. This is yet more evidence of QE’s very limited effectiveness in spurring activity in the real economy.
Raising Interest Rates Now Would Be a Tragic Error - The economy is skating on thin ice. It would be tragic if the Federal Reserve tightened monetary policy at this point. The reasons are clear, and I'd say incontrovertible. We still have to create millions of jobs to get us back to the level of 2007. Gross Domestic Product is only just starting to grow adequately, but the gap between its potential and actual growth is still enormous. And there is no inflation out there to worry about. Consumer prices are rising by 1 percent this year. The fear is deflation not inflation. Those who urge the Fed to start tightening now are living a bad dream from the 1970s. They think if inflation rises just a bit it will spread alarm and lead to a new wage-price spiral. This is nonsense. One has to live in the present, not the nightmare past. If the economy were operating at full employment, perhaps the inflation hawks would have a small case. I'd say full employment is perhaps 4.5 percent, others would say 5.5 percent. As I say, a long way to go. But the 7.3 percent level is not the byproduct of a strong recovery, but the opposite. Millions of people are not looking for work any longer and therefore not among the officially unemployed. You'd have to add more than two percentage points to the current unemployment rate if they were still looking — or even more. And the extremely slack labor market — which means outright suffering for millions — shows up as predicted in weak wages. Had employment been approaching a decent level, wages would be rising. In fact, wages for most have been falling, adjusted for inflation, for three years now. This is outrageous in a supposed recovery.
Fed Should Cut Interest on Reserves - By continuing to pay interest on reserves at a rate that not only matches, but exceeds the rate banks can earn on comparable risk-free assets such as short-term U.S. Treasury bills, the Fed has been working against itself, perversely sending deflationary impulses through the economy at a time when inflation is already too low. This is because a higher interest rate on reserves induces banks to demand more excess reserves. The Fed must then either conduct even larger open market operations simply to accommodate additional demand, or accept downward pressure on the money supply and inflation rate as the circular process of deposit creation gets curtailed by what, again, any college freshman should recognize as a decrease in the money multiplier. Reducing the interest rate it pays on reserves would allow the Fed to provide additional monetary stimulus, even as the federal funds rate remains at zero, so as to more effectively defend its two percent inflation target. Usefully, this same step might also allow the FOMC to scale back on its asset purchase programs, so that they focus solely on U.S. Treasury bonds and eschew the mortgage-backed securities the Fed has also been buying. This is important, since it would make clear that allocating credit to the housing sector, or any other specific area of the U.S. economy, is a task that is best left to private financial institutions, which profit when they make the right decisions and fail when they are wrong. The Fed, meanwhile, should concentrate on stabilizing prices. Paying a lower interest rate on reserves would allow it to do so more effectively
The Money Changers Serenade: A New Plot Hatches — Paul Craig Roberts -- Former Treasury Secretary Timothy Geithner, a protege of Treasury Secretaries Rubin and Summers, has received his reward for continuing the Rubin-Summers-Paulson policy of supporting the “banks too big to fail” at the expense of the economy and American people. Geithner has been appointed president and managing director of the private equity firm, Warburg Pincus and is on his way to his fortune. The Federal Reserve describes its policy of Quantitative Easing — the creation of new money with which the Fed purchases Treasury debt and mortgage backed securities — as a low interest rate policy in order to stimulate employment and economic growth. Economists and the financial media have parroted this cover story. In contrast, I have exposed QE as a scheme for pumping profits into the banks and boosting their balance sheets. The real purpose of QE is to drive up the prices of the debt-related derivatives on the banks’ books, thus keeping the banks with solvent balance sheets. This vast con game remains unrecognized by Congress and the public. At the IMF Research Conference on November 8, 2013, former Treasury Secretary Larry Summers presented a plan to expand the con game. Summers says that it is not enough merely to give the banks interest free money. More should be done for the banks. Instead of being paid interest on their bank deposits, people should be penalized for keeping their money in banks instead of spending it. Summers has the solution, and the establishment, including Paul Krugman, is applauding it. Once the economy officially turns down again, watch out.
Pimco's Gross warns easy-money policies increase global economic risk -- Easy-money policies by the Federal Reserve and other central banks have left the U.S. and other economies "increasingly at risk," bond guru Bill Gross warned. The co-chief investment officer at Pacific Investment Management Co., or Pimco, said that "investors are all playing the same dangerous game that depends on a near perpetual policy of cheap financing and artificially low interest rates in a desperate gamble to promote growth." The comments by Gross in his monthly investment outlook came as stocks opened lower Tuesday amid investor concern that recent upbeat economic data could lead the Fed to start reducing its monthly bond-buying stimulus program. Gross said Tuesday that stocks, bonds and other assets are artificially high because of the artificially low interest rates set by the Fed and other central banks to try to stimulate the recovery from the Great Recession.
Whom the Fed Is Enriching - At a November confirmation hearing, Janet Yellen was asked whether Federal Reserve policies had mostly benefited wealthy people, while doing little to improve life for the common man. After all, ultra-low interest rates and quantitative easing likely contributed to the run-up in stock prices over the last few years. We recently talked with Catherine L. Mann, a finance professor at Brandeis University’s International Business School, about her views on whether Fed policy was enriching the rich and leaving the middle-class and poor behind, and thereby increasing inequality. Here’s what she said: If you’re interested in the data behind her comments, take a look at the change in the S.&P. 500 stock index over the last few years:
Economists and Inflation: It's Also Interest Rates, not Just Wages -- Binyamin Appelbaum had an interesting post about how many economists would like to see a higher rate of inflation to help recover from the downturn. The piece emphasizes the role of inflation in lowering real wages, with the argument that lower real wages are necessary to increase employment. While there may be some truth to this point, it is worth fleshing out the argument more fully. At any point in time, there are sectors in which demand is increasing and we would expect to see rising real wages and also sectors where demand is falling and we would expect to see real wages do the same. Anyhow, when inflation is very low, the only way to bring about declines in real wages in these sectors is by having lower nominal wages. Since workers resist nominal pay cuts, we end up not having this adjustment and therefore we end up with fewer jobs than would otherwise be the case. The other important point is that higher inflation promotes growth in other ways. First and foremost it makes investment more profitable by reducing real interest rates. Firms are considering spending money today to sell more output (e.g. software, computers, Twitter derivatives etc.) in the future. If we can keep interest rates more or less constant and raise the expected rate of inflation, then firms will have much more incentive to invest. This process seems to be working successfully in Japan at the moment. Finally, inflation reduces debt burdens. Everyone who has debt in nominal dollars, such as homeowners, students, state and local governments, and the national government, will see the real value of its debt fall in response to inflation. This reduces their debt burden and makes it easier to spend.
A healthy natural real interest rate… Say “No” to secular stagnation -- I put together a video on the natural real interest rate. There is not one single natural real rate. It is like what Steve Waldman said… “The word natural is always used to hide the constructed context in which an outcome occurs…” The natural real interest rate goes lower, as policy tries to push real GDP higher. A lower natural rate is needed to promote an even higher level of borrowing for investment. Thus the natural interest rate is placed in the context of policy goals. Larry Summers sees the natural rate as negative within the context of pushing real GDP back to the high trend that existed before the crisis. Yet, my view is that real GDP has fallen to a lower trend, and thus a healthy natural real rate would not need to be negative. Secular stagnation involves the idea that the Fed rate will be at the zero lower bound for a long time. The model in the video shows how the Fed rate must stay at the ZLB if policy seeks to return real GDP to its natural level before the crisis. In my view, it is not wise to manipulate the economy back to the previous trend. The imagined benefits do not outweigh the certain risks. Moreover, economists like Paul Krugman seek to make the current real interest rate lower than the natural real interest rate. The effect would be expansionary and inflationary. Real GDP would theoretically rise back to previous trend… However, real GDP is increasing slowly not because the current real rate is still too high, but because the effective demand limit is constraining utilization of capital and labor at a new lower level. The video also covers negative real rates and inflation…
Elephant in the Room: Upward Redistribution, Concentrated Income and Wealth, and Secular Stagnation - Dean Baker quite rightly takes Robert Samuelson to task for his op-ed on the causes of secular stagnation. Samuelson: The problem might not be a dearth of investments so much as a surplus of risk aversion. For that, candidates abound: the traumatic impact of the Great Recession on confidence; a backlash against globalization, reduced cross-border investments by multinational firms; uncertain government policies; aging societies burdened by diminishing innovation and costly welfare states. Dean’s right that this doesn’t even touch on perhaps the most likely explanations. But Dean’s explanation also misses the the 800-pound gorilla: Actually the most obvious cause for most of the shortfall in demand is the trade deficit. Brad Delong, likewise, reels off four possible explanations today while ignoring what seems to me to be the most obvious one. How about a three-decade upward redistribution of income, and massive increases in wealth and income concentration? Add declining marginal propensity to spend out of wealth/income, and you get a so-called “savings glut” (aka “not spending”) and secular stagnation. The arithmetic of this is straightforward and inexorable. Extreme inequality and upward redistribution kills growth.
Wealth Concentration and Secular Stagnation - I’m rather terrified to find that Brad DeLong has replied to my recent post on this subject. I would expect greater inequality coupled with a higher propensity to save on the part of the rich to drive all asset yields down. Yet what we have seen has been a steep, prolonged fall in Treasury bond yields while stock-market equity yields have plateaued at about 5%/year: To reply to this specifically: I would point out that the conversation going around is about SecStag post-1980. And we did see a “steep, prolonged fall” in equity yields over that period. Why did it stop at 5% while Treasuries hit the floor? I’d suggest a pretty simple explanation: it’s because many/most financial investors evaluate “risk” based on historical price volatility including Sharpe ratios and the like (arguably inappropriately, but nevertheless). Equity prices are historically more volatile than Treasury prices, so investors demand a minimum yield in return for that (perceived) risk. Since they measure that volatility looking back over many decades, the risk perception doesn’t change much. There’s a floor. If they can’t get that minimum return for perceived risk, they’ll just buy bonds — especially Treasuries, which have zero risk if held to term.So basically, I don’t think post-1990 equity yields tell us much about the secular stagnation story.
“Saving” and Underconsumption - Some years ago Paul Krugman gave perhaps the best argument against the inequality-causes-underconsumption theory of secular stagnation: the idea that rich people spend less of their income/wealth, so if wealth/income is more concentrated there’s less spending and less GDP/prosperity.There are two parts to Krugman’s argument: theoretical and empirical. I find both to be weak or fatally flawed. Theory first: at any given point in time the rich have much higher savings rates than the poor. Since Milton Friedman, however, we’ve know that this fact is to an important degree a sort of statistical illusion. Consumer spending tends to reflect expected income over an extended period. If you take a sample of people with high incomes, you will disproportionally include people who are having an especially good year, and will therefore be saving a lot; correspondingly, a sample of people with low incomes will include many having a particularly bad year, and hence living off savings. So the cross-sectional evidence on saving doesn’t tell you that a sustained higher concentration of incomes at the top will lead to higher savings; it really tells you nothing at all about what will happen.
Fed's Beige Book: Economic activity increased "at a modest to moderate pace" -- Fed's Beige Book -- This document summarizes comments received from business and other contacts outside the Federal Reserve and is not a commentary on the views of Federal Reserve officials." Reports from the twelve Federal Reserve Districts indicated that the economy continued to expand at a modest to moderate pace from early October through mid-November. Activity in the New York, Cleveland, Richmond, Atlanta, St. Louis, Minneapolis, and Dallas Districts grew at a moderate pace, while Philadelphia, Chicago, Kansas City, and San Francisco cited modest growth. Boston reported that economic activity continued to expand. And on real estate: Residential real estate activity improved in Boston, Philadelphia, Chicago, St. Louis, Minneapolis, and San Francisco, while remaining steady or softening in other Districts. Some slowing in single-family home sales was attributed to seasonal factors. Nonetheless, sales remain largely above year-ago levels. Increasing demand, low to declining levels of inventory, and slowly rising new-home construction were cited by almost all Districts as reasons for a continued rise in home prices, but at a slower pace than was observed earlier in 2013. Historically low inventories of unsold homes were reported in Philadelphia, Richmond, Chicago, Kansas City, and Dallas. Chicago noted that the inventory of homes for sale is at a record low. In the Philadelphia, Cleveland, Kansas City, and San Francisco Districts, builders continued to face a scarcity of high-skilled trade workers. Boston, New York, Philadelphia, Cleveland, Richmond, and Chicago indicated that multifamily construction continued to experience moderate to strong growth, with strength concentrated in the apartment segment. Vacancy rates declined across most Districts.
Fed Beige Book: District by District Summary -- The Federal Reserve‘s latest “beige book” report Wednesday said overall economic activity continued to expand at a “modest to moderate pace” throughout the nation. The following are excerpts from a district-by-district summary of economic conditions from early October through mid-November.
Is Growth Getting Harder? If so, Why, and What Can We Do About It? -- Brad DeLong - Attention Conservation Notice: tl;dr. 9000 words trying to work my way through and in the process provide a reader's guide to the techno-growth stagnation arguments of Robert Gordon, Tyler Cowen, and Brink Lindsey. The arguments are powerful. The authors are very serious economists. I wind up skeptical, and optimistic--partly because I am a techno-optimist by nature, partly because I am a politico-optimist and I think the literature confuses the past generation's failures in distribution and demand-management due to political dysfunction with failures in accumulation and innovation, and partly because I have a different more micro-incremental conception of the process of economic growth than does Robert Gordon.
GDP Q3 Second Estimate Rises to 3.6% - The Second Estimate for Q3 GDP, to one decimal, rose to 3.6 percent from the 2.8 percent of the Advance Estimate. Investing.com had forecast 3.0 percent. The GDP deflator used to calculate real (inflation-adjusted) GDP was lifted slightly from 1.9 percent to 2.0 percent. Here is an excerpt from the Bureau of Economic Analysis news release:Real gross domestic product -- the output of goods and services produced by labor and property located in the United States -- increased at an annual rate of 3.6 percent in the third quarter of 2013 (that is, from the second quarter to the third quarter), according to the "second" estimate released by the Bureau of Economic Analysis. In the second quarter, real GDP increased 2.5 percent. The GDP estimate released today is based on more complete source data than were available for the "advance" estimate issued last month. In the advance estimate, the increase in real GDP was 2.8 percent (see "Revisions" on page 3). With this second estimate for the third quarter, the increase in private inventory investment was larger than previously estimated. The increase in real GDP in the third quarter primarily reflected positive contributions from private inventory investment, personal consumption expenditures (PCE), exports, nonresidential fixed investment, residential fixed investment, and state and local government spending that were partly offset by a negative contribution from federal government spending. Imports, which are a subtraction in the calculation of GDP, increased. The acceleration in real GDP growth in the third quarter primarily reflected an acceleration in private inventory investment, a deceleration in imports, and an acceleration in state and local government spending that were partly offset by decelerations in exports, in PCE, and in nonresidential fixed investment. [Full Release] Here is a look at GDP since Q2 1947 together with the real (inflation-adjusted) S&P Composite. The start date is when the BEA began reporting GDP on a quarterly basis. Prior to 1947, GDP was reported annually. To be more precise, what the lower half of the chart shows is the percent change from the preceding period in Real (inflation-adjusted) Gross Domestic Product. I've also included recessions, which are determined by the National Bureau of Economic Research (NBER).
GDP 3.6% Blowout Revision for Q3 2013 - Q3 2013 real GDP had a blow out revision and is now 3.6%. Originally GDP was reported to be 2.8% for the third quarter. As estimated, dramatically increasing inventory accumulation was the main cause of the large upward revision to GDP. Changes in inventories accounted for 46.5% of Q3 GDP. The increasing trade deficit shaved off 0.23 percentage points, as predicted. Actual economic demand is weaker in the third quarter in comparison to the 2nd. Additionally large inventory accumulation can imply a slowing economy. As a reminder, GDP is made up of: Y = C + I + G + (X-M) where Y=GDP, C=Consumption, I=Investment, G=Government Spending, (X-M)=Net Exports, X=Exports, M=Imports*. GDP in this overview, unless explicitly stated otherwise, refers to real GDP. Real GDP is in chained 2009 dollars.The below table shows the Q3 revisions and percentage point spread between the major components of Q3 GDP. As we can investment shot way up and changes in private inventories is part of the investment component of GDP. This next table shows the percentage point spread breakdown from Q2 to Q3 GDP major components. GDP percentage point component contributions are calculated individually. Here we see consumer spending is down in comparison to Q2. Exports show less growth but imports also decreased.
Q3 GDP Soars To 3.6% On Massive Inventory Accumulation; Consumption Contribution Lowest Since 2009 - On the surface, the first revision to the Q3 GDP print, which initially came at 2.8%, was tremendous: at 3.6% well above the 3.1% expected, nothing could be better. Unfortunately, once again reading between the lines shows that all the "growth" was completely hollow and entirely on the back of the ongoing massive inventory accumulation, which rose from 0.41% in Q2 to 0.83% in the first Q3 revision, to an epic 1.68% in the current revision, or nearly half of all the "growth" in the economy. As for the most important component of GDP - personal consumption it once again declined, and dropped from 1.24% of the GDP number in Q2 to 1.04% in the first revision, to just 0.96% in the final Q3 revision - this was the lowest consumption contribution to GDP since Q3 2009! Bottom line: the US consumer is getting ever weaker, even as retailers and producers are stocking up more and more inventory to take advantage of the lack of consumer spending power. Of course, as the inevitable inventory liquidation takes place at cost or lower levels, expect Q4 GDP to crater, and we now see a 1% Q4 GDP as very possibly in light of this massive inventory build up in the last quarter. But since that number won't be out until early 2014, stocks are sliding because today's surge in GDP means a December taper is even more likely.
Smart GDP Pop but a Lot of It Is Noisy Inventories - I must be brief, but the growth in real GDP underwent a large revision for Q3 of this year: up to 3.6% from 2.8%. Sure, that good news, but it warrants a closer look, because it could easily, and mistakenly, get sandwiched into a “green shoots” narrative that would lead you to believe things are improving faster than they really are. First, those are annualized quarterly growth rates, and especially when they’re driven by inventories–the most volatile top-line component of GDP–they’re noisy. So what you really want to do here is block out some noise and boost us some signal by taking year-over-year changes.That’s what I do in the figure below, along with an average over this time period of the past few years. As you see, growth has flitted around a trend just north of 2%. That’s about the economy’s trend growth rate right now, and again, what’s wrong with the trend?Well, I’ll tell you: we’ve settled into it–the trend, that is–too soon. We’ve yet to close the output gaps in either GDP or jobs that persist and continue to weigh on many households, for whom growth is more something they read about in the paper than experience themselves.After such a deep recession, you want a “bounce-back” period before you settle into the pattern of trend growth in the picture. To be clear, I’d much rather be there than south of that line, but policy makers must not take too much solace from the trend when it really represents an unsatisfactory “new normal.”Second, taking out the inventory build up, annualized growth for the quarter was 1.9%–again, right about trend. Typically, inventory buildup in one quarter is followed by draw downs in the next quarter, so again, while it’s very nice to see a “three” handle on today’s number, no one should be convinced yet that we’ve hit escape velocity.
U.S. Growth Faster Than Estimated as Businesses Stock Up - The economy expanded much faster than first thought in the third quarter, as the government on Thursday revised its estimate of growth in the period to a 3.6 percent annual rate from 2.8 percent. That was significantly better than the 3.1 percent pace economists had been expecting, and it marked the best quarter for growth since the first quarter of 2012, when output jumped by 3.7 percent. It also marked the first time since then that growth had exceeded 3 percent. Much of the improvement came from additional stocking up on inventory by businesses as well as a slightly improved trade picture. Inventory changes are notoriously volatile, so while the healthier signals would be welcomed by economists, inventory gains can essentially pull growth forward into the third quarter, causing fourth-quarter gains to slacken. Indeed, Wall Street was already estimating that the fourth quarter of 2013 would be much weaker than the third quarter, with growth estimated to run at just below 2 percent, according to Bloomberg News. The anemic pace of fourth-quarter growth also stems from the fallout of the government shutdown in October, as well as the continuing fiscal drag from spending cuts and tax hikes imposed by Congress earlier in 2013.
Why Is Business Investment Flatlining? - America’s economy is stabilizing after a rocky summer, but one of its main pillars is missing: Business spending. The Commerce Department reported Thursday that U.S. gross domestic product grew at an annualized rate of 3.6% in the third quarter on an inflation-adjusted basis, up from 2.5% in the previous quarter and an initial estimate of 2.8%. Yet growth in business spending on equipment was a big fat zero — following an already weak 3.3% showing in the second quarter — which means such spending contributed exactly nothing to the nation’s GDP. While this figure was revised up from an earlier decline, it’s only the second time since the recovery began in July 2009 that we haven’t seen business-spending growth in a quarter. Much of the nation’s growth last quarter was due to business investment, but the wrong kind — a massive buildup of inventories that’s likely to reverse in coming quarters if demand isn’t strong enough for companies to draw down stocks. A better gauge of the economy that excludes changes in inventories actually slipped to 1.9% in the third quarter from 2.1% in the second. Recent data, especially October’s solid jobs report, suggest the economy is slowly building underlying momentum, and even today’s report showed many cylinders of the economy — consumer spending, housing market-related investment, trade, even government spending — firing. Which makes the fact that business spending is AWOL all the more baffling. After splashing out early in the recovery, corporate executives have spent the past year hiding in a cave when it comes to shelling out on machinery and software.
Comments on Q3 GDP and Investment - The BEA revised up Q3 GDP to 3.6% (from 2.8% in the advance release). The main reason for the upward revision was more investment in inventory (the contribution from "Change in private inventories" was revised up from 0.83 percentage points in the advance release to 1.68 percentage in the second release). The change in private inventories tends to bounce around, and this will probably be a drag on Q4 GDP. Note: The BEA provides a summary of revisions Real Gross Domestic Product and Related Measures: Percent Change From Preceding Period and Contributions to Percent Change in Real Gross Domestic Product. Personal consumption expenditures (PCE) was revised down from a 1.5% annual rate to 1.4%, and residential investment (RI) was revised down from 14.6% to 13.0%. This is weak final demand (PCE and RI contributed 1.34 percentage point to GDP growth in Q3). This is the weakest final demand since Q2 2011. The good news is PCE will probably increase in 2014 with most of the impact of tax increases and budget cuts ending. But Q4 2013 will probably be another weak quarter impacted by the government shutdown, a negative contribution from private inventories, and still weak final demand. The following graph shows the contribution to GDP from residential investment, equipment and software, intellectual properties, and nonresidential structures (3 quarter centered average). This is important to follow because residential investment tends to lead the economy, equipment and software is generally coincident, and nonresidential structure investment trails the economy. For the following graph, red is residential, green is equipment and software, and blue is investment in non-residential structures. So the usual pattern - both into and out of recessions is - red, green, blue. Residential Investment (RI) made a positive contribution to GDP in Q3 for the twelfth consecutive quarter. Usually residential investment leads the economy, but that didn't happen this time because of the huge overhang of existing inventory.
Vital Signs: It’s the Inventories, Stupid - The third-quarter economy grew much faster than economists expected—but that’s not a good omen for this quarter. The Bureau of Economic Analysis now estimates real gross domestic product grew at a 3.6% annual rate over the summer, up from the 2.8% reported a month ago. The pace is the strongest since first quarter of 2012. The problem is that all of the upward revision came from inventory accumulation. Faster stockpiling contributed 1.68 percentage-point to growth, up from the original estimate of 0.83 point. All the other major demand categories contributed to growth (an unusual occurrence since government has been a drag of late and net exports fluctuate), but final demand growth slowed last quarter from the second quarter. The change in inventories last quarter was the largest so far in this recovery, suggesting some of the buildup was unintentional. Businesses will have to work down their overhang of supplies and good on hand. The inventory drawdown will cut into GDP growth this quarter.
Here Is The "Growth" - Inventory Hoarding Accounts For Nearly 60% Of GDP Increase In Past Year - As we reported earlier, while on the surface the headline revised Q3 GDP number was a stunner coming at 3.6%, the reality is that more than 100% of the growth from the initial estimate came from a revised estimate of how many private Inventories were stockpiled in the quarter. The reality was that of the $230 billion in total increase in SAAR GDP, $146 billion of this, or over 63%, was due to inventory stockpiling. So how does inventory hoarding - that most hollow of "growth" components as it relies on future purchases by a consumer who has increasingly less purchasing power - look like historically? The chart below shows the quarterly change in the revised GDP series broken down by Inventory (yellow) and all other non-Inventory components comprising GDP (blue). But where the scramble to accumulate inventory in hopes that it will be sold, profitably, sooner or later to buyers either domestic or foreign, is seen most vividly, is in the data from the past 4 quarters, or the trailing year starting in Q3 2012 and ending with the just released revised Q3 2013 number. The result is that of the $534 billion rise in nominal GDP in the past year, a whopping 56% of this is due to nothing else but inventory hoarding.
Today's Upbeat Macro Reports Probably Overstate Growth Prospects - This morning’s economic updates for the US paint an encouraging profile, but it may be a bit misleading. The Bureau of Economic Analysis revised second-quarter GDP up by a hefty degree, estimating that the nation’s output of goods and services increased 3.6% for the three months through September (seasonally adjusted annualized real rate). That’s substantially higher than the 2.8% gain in the advance estimate for Q3. There's also bullish macro news in today’s weekly report on initial jobless claims. But last week’s tally of new filings for unemployment benefits was probably pushed lower because of last week’s Thanksgiving holiday. Even so, when you consider the downward bias in new claims in the previous weeks, it’s still reasonable to assume that the labor market will continue to grow for the foreseeable future. As for the caveat in today’s GDP report, most of the upwardly revised pace of growth is due to a higher rate of expansion for inventories than previously estimated. Indeed, the increase in inventories in Q3 reflects the biggest advance since the late-1990s. The burning question is whether the surge in the level of inventories will be matched by stronger demand? And in a related question: If we see more demand, will that lead to more hiring?
Q3 GDP Revised Up and Employment Strong (9 charts) The last several days have given us a a second estimate of GDP for Q3, new data on personal income, the employment report for November, and new unemployment claims. The overall picture from them is one of a steadily improving economy, although personal income fell slightly, down 0.1%. The big news with the release of the second estimate of real GDP for the third quarter from the BEA was the large increase, from 2.8% to 3.6% annualized growth. However, much (most) of this increase came from the big pop in inventory investment–likely meaning it will be unwound over the coming quarters. The implication being that this alone should have little effect on forecasts of real GDP although there is an upside–inventory growth may also reflect positive expectations about future demand. Last year in Q3 inventory investment was also a large contributor (0.6 percentage points) to the overall 2.8% GDP growth. Following that, GDP growth in Q4 of 2012 was only 0.1; moreover there was a very large decline in inventories in Q4 of 2012. Still, even without the current inventory contribution to GDP growth (1.68 p.p.), GDP grew about 1.9%; perhaps not something to write home about, but certainly showing continued solid growth. Real personal consumption expenditures continue to climb steadily and investment has finally reached its level of Q4 2007. Government consumption and gross investment appears to have broken from a three year decline and has held steady for the last couple of quarters, although below the level at the beginning of the recession.The Employment Situation report from the BLS added more support to the overall picture, that is, one of solid growth. There have been four fairly strong months of employment growth, with nonfarm payroll employment increasing 203,000 for November, 200,000 for October, 175,000 for September, and 238,000 for August. Moreover there are positive signs in the goods sector, with goods employment up 44,000, and over half of that in the manufacturing sector. Unemployment initial claims continue to decline–noting of course the recent effects of the government shutdown. The employment rate declined to 7% putting it in the range that Fed Chairman Bernanke cited earlier in the year as a sign that the labor market was recovering. The positive angle on this estimate is that labor force participation increased as did the employment/population ratio. The increase was not enough to overcome the sharp drop in October.
US Recovery Shows New Strength with GDP Growth up to 3.6 Percent and Unemployment Down to 7 Percent - Data released this week by the Bureau of Economic Analysis showed that the U.S. economy grew at a respectable annual rate of 3.6 percent in the third quarter of 2013. That made it the first quarter since early 2012 for which growth was fast enough to make a significant dent in the output gap. The advance estimate released last month had put growth at 2.5 percent. The upward revision should be interpreted with caution, since, as the following table shows, it was due almost entirely to an increase in the estimated growth of inventories. Faster inventory growth is an ambiguous indicator. In some cases, it can mean that businesses are stocking up in anticipation of higher future sales, but inventories can also grow when firms produce more than they had hoped to sell or order raw materials but fail to use them at the rate they had expected. On a more positive note, the contribution of fixed investment was also revised upward, with residential and nonresidential structures leading the way. This week’s release reported downward revisions for the contributions of consumer spending and net exports. Exports increased slightly less than previously reported, and imports were slightly stronger. (Note that imports enter into the national account with a negative sign, so the revision in the contribution of imports from -0.3 percentage points to -0.43 percentage points indicates more imports of goods and services than previously estimated.) The federal government’s contribution to GDP was negative, as it has been for most of the past three years. However, decreasing federal government consumption and investment was more than offset by growth in state and local government spending.
The Output Gap: Cumulative Losses - Econbrowser - Today, I gave a presentation in the Wisconsin Alumni Association's Global Hot Spot series, entitled America's Macroeconomic Policies and the Global Economy. One figure from the presentation bears highlighting.. The figure in light blue italics is the cumulative loss in Chained 2009$ from 2007Q4 to 2013Q3. The figure in pink blue italics is the cumulative loss incurred from 2013Q4 through 2014Q4, assuming the WSJ mean forecast holds.Note that the potential GDP series is my adjusted series. CBO has not released an official series consistent with the recent BEA benchmark, which incorporates intellectual property; it may be that I have over-estimated potential relative to what CBO is planning to publish, but the general magnitudes are likely similar.Could we do more to close the gap? I think so -- see here; and also here, regarding extending emergency unemployment benefits.
Goldman Slashes Q4 2013 GDP Growth To 1.3% -- Of the 92 firms that offer their guesses at the GDP data, Goldman is now 6th lowest as today's construction spending disappointment pressured their estimate for Q4 2013 GDP to a mere 1.3%. Deutsche Bank's Joe Lavorgna still tops the list at 3.5% - so quite a dispersion.
A new measure of US GDP - GDP can be estimated by measuring either expenditure or income. Since a penny spent is a penny earned, both methods should give the same answer, but there is substantial measurement error in both estimates. This column presents a new method of measuring US GDP that blends these two estimates. According to the new measure, GDP growth is about twice as persistent as the current headline measure implies. The new measure also makes the current recovery look stronger, especially in 2013.
Why the US economy may be doing better than we think - There are two GDP measures. One looks at spending, the other income. The former gets the most press — it’s actually pretty hard to find US gross domestic income numbers – but both have their fans. The two measures often disagree, sometimes by a large margin. As a new study notes: … 2000 Q1 GDPE was 1.1% while GDPI was 8.1%, and the very next quarter GDPE was 7.5% while GDPI was 2.2%. Clearly, since they are supposed to measure the same underlying true GDP, one of them was badly wrong each quarter. Many other advanced economies will blend the two measures to come up with their official GDP number. In the study just referenced, a group of economists, including one from the Fed, created their own blended GDP number, GDPplus, which is handled by the Philly Fed. So what does GDPplus say about the US economy? In other words, most of the deceleration is GDPE over the past year appears to be a figment – pure measurement error sending an overly pessimistic signal about the pace of economic growth. It is likely closer to the truth that the US economy has continued to chug along over the past year (as it has through most of the recovery), at a pace that has been modest but fast enough to provide steady job growth and declines in the unemployment rate.
DJ Economic Sentiment Index Rises to 51.5 in November - The U.S. economy in November showed few negative signs from the government shutdown that occurred in October, according to a survey of newspaper stories on U.S. economic activity released Monday. The Dow Jones Economic Sentiment Indicator increased again to 51.5 after it rose to 49.7 in October from 48.9 in September. The November index is the highest reading since the multi-year high hit in June.“The ESI has been picking up since its modest late-summer pullback, suggesting steady positive momentum in the U.S. economy into the yearend, boding well for the November payrolls report,” . Indeed, the surprisingly strong October employment report–which showed 204,000 new jobs added in October–contributed to the positive coverage on the U.S. economy. Reports about new highs in stock prices also helped the index.“But the positive news doesn’t suggest the sort of economic strength that would make the Federal Reserve hurry to trim its asset purchase program,” The Fed is scheduled to hold its last 2013 policy meeting on December 17-18.
CBO: Federal Deficit declined Sharply in October and November compared to last year - From the Congressional Budget Office (CBO): Monthly Budget Review for November 2013 The federal government ran a budget deficit of $231 billion for the first two months of fiscal year 2014, $61 billion less than the shortfall recorded in October and November of last year, CBO estimates...Receipts for the first two months of fiscal year 2014 totaled $380 billion, CBO estimates—$34 billion more than receipts during the same period last year. ..Outlays for the first two months of fiscal year 2014 were $27 billion less than they were during the same period last year, CBO estimates. That decrease would have been slightly larger if not for shifts in the timing of certain payments from December to November (because December 1 fell on a weekend in both years). Without those timing shifts, CBO estimates, spending would have declined by $29 billion (or 5 percent). The most recent CBO projection put the fiscal 2014 deficit at 3.3% of GDP, down from 4.1% in fiscal 2013. These monthly deficits suggest even more improvement in fiscal 2014 than originally forecast.
GOP infighting rages: McConnell blasts Tea Party group for “utter nonsense” - Long the target of the Senate Conservatives Fund — a Tea Party-aligned super PAC that was instrumental in bringing about October’s government shutdown — Sen. Mitch McConnell is finally, on-record, fighting back. In an interview with the Washington Examiner, the Senate minority leader said that in the months and weeks leading up to the shutdown, many Republicans “were basically afraid” of groups like the Senate Conservatives Fund. “It’s time,” he said, “for people to stand up to this sort of thing.” McConnell didn’t spare his criticism of the Senate Conservatives Fund in particular, either. “The Senate Conservatives Fund is giving conservatism a bad name. They’re participating in ruining the [Republican] brand,” McConnell said. “What they do is mislead their donors into believing the reason that we can’t get as good an outcome as we’d like to get is not because of a Democratic Senate and a Democratic president, but because Republicans are insufficiently committed to the cause — which is utter nonsense.”
December 13 Is The Seinfeld Budget Deadline -- The budget conference committee that's been meeting sporadically since last month was given until December 13, that is, until a week from this Friday, to agree on some kind of deal. So what happens if there is no agreement by December 13? Absolutely nothing. Like Seinfeld, December 13 is the budget deadline that's about nothing.Yes, there will be headlines about how another budget-related committee, task force or working group -- think about the Bowles-Simpson (or BS) commission, the anything-but-super committee, and all of the other botched negotiations that have taken place the past few years -- has failed. That's bound to hurt a congressional approval rating that last week fell to its lowest level in history (see question 3) and doesn't have much further to fall. But there will be no immediate practical impact if the budget conference committee fails. In fact, as far as the federal budget is concerned, December 14 won't be any different regardless of whether the conference committee agrees to anything the day before. The real deadlines are January 15 -- when the current funding for the government expires and another shutdown is possible -- and January 18 -- when the next sequester is likely to happen. That means that the real budget deadlines are a month later than December 13 and that the conference committee failing to come with something over the next 12 days should not be taken as an indication of impending fiscal doom.
Pentagon in line of fire in US budget war - FT.com: The Pentagon and its supporters are increasingly pessimistic about avoiding sharp budget cuts next year as part of another round of spending reductions being imposed across the US government. US lawmakers have been inching towards a budget deal that would fund the government and ease the pain of some of the automatic, across-the-board cuts, known as sequestration. The deadline for a deal is December 13. The Pentagon was able to find some funds to offset the first round of sequestration cuts in 2013, but has less flexibility this time, and may not be granted any extra room to manage its spending in the budget deal. The Pentagon’s diminishing clout in Washington’s budget wars underlines the hardening change in mood in the US capital in the wake of the country’s withdrawal from Iraq and Afghanistan. Gordon Adams, a professor of international relations at American University in Washington, said that the budget experts in both the Democratic and Republican parties had taken control of the fiscal negotiations – pushing aside the traditional defence lobby in Congress. “The defence barons on Capitol Hill cannot stem the tide,” he said. If Congress does not reach a deal that lifts sequestration, the Pentagon will lose about $51bn from January, about 10 per cent of its annual budget.
Want to Cut Government Waste? Find the $8.5 Trillion the Pentagon Can’t Account For --If you thought the botched rollout of Obamacare, the government shutdown, or the sequester represented Washington dysfunction at its worst, wait until you hear about the taxpayer waste at the Defense Department. Special Enterprise Reporter Scot Paltrow unearthed the “high cost of the Pentagon’s bad bookkeeping” in a Reuters investigation. It amounts to $8.5 trillion in taxpayer money doled out by Congress to the Pentagon since 1996 that has never been accounted for. (The year 1996 was the first that the Pentagon should have been audited under a law requiring audits of all government departments. Oh, and by the way, the Pentagon is the only federal agency that has not complied with this law.)
Companies, academics say budget cuts threaten U.S. competitiveness (Reuters) - Mandatory U.S. budget cuts known as sequestration are resulting in job losses across the country and threaten to undermine U.S. competitiveness in the global economy, industry executives and academics said on Monday, urging Congress to reverse the cuts. Wes Bush, chief executive of Northrop Grumman, one of the biggest U.S. weapons makers, said his company had already reduced its workforce by 19 percent in recent years, and more cuts were likely unless U.S. lawmakers ended the across-the-board cuts required under sequestration. Bush, who is also the chairman of the Aerospace Industries Association, said arms makers realized that the end of the wars in Iraq and Afghanistan meant U.S. military spending would decline and that weapons needed to become more affordable. But he said the additional cuts now facing the Pentagon and other government agencies were reducing funding for critical research and development programs, which could hurt the U.S. economy and threaten national security in years to come. The Pentagon and its suppliers are bracing for $500 billion in additional sequestration budget cuts over the decade beginning in fiscal 2013, on top of $487 billion in reductions to spending that were already planned.
Government shutdown part 2? Democrats line up against stopgap spending bill - House Democrats of all stripes are lining up against a stopgap spending bill that further entrenches the blunt sequester cuts. GOP leaders could bring a vote as early as next week on a short-term continuing resolution (CR) likely to adopt the $967 billion sequester-level spending cap urged by many Republicans. But the pushback from Democrats this week has been near universal, with liberals and centrists alike vowing to join party leaders in opposition to any such measure. “I’m not going to support a short-term CR that leads to a $967 billion level,” Rep. Steny Hoyer (D-Md.), the House minority whip, said Tuesday during a press briefing in the Capitol. “I believe that hurts our national security, it hurts our economy and it undermines our responsibility of running government at a level that is productive for our people.”The opposition raises the chances of a government shutdown taking place in mid-January if a House-Senate budget conference fails to reach a deal on a broader framework to fund the government and scale back the sequester.
Budget Negotiators Seek Limited Deal as Opposition Mounts - U.S. negotiators will work through the weekend trying to craft a limited deal to ease automatic spending cuts as opposition emerged from targeted groups, including airlines and federal employees. .Democrats are resisting a proposal to increase the amount federal employees contribute to their pensions, while Republicans are challenging the concept of trading spending cuts for promises of future savings. Democrats are also demanding an extension of benefits for long-term unemployment insurance, either as part budget deal or as a separate measure. In case a budget deal isn’t reached, House lawmakers yesterday began discussing the outline of a short-term bill to fund the government, according to a Republican leadership aide. The bill would probably be for three months, after current authority expires Jan. 15. Representative Paul Ryan and Senator Patty Murray, the lead negotiators, aren’t finding it any easier to reach a deal by limiting their menu of options, said Representative Chris Van Hollen, the top Democrat on the House Budget Committee. “Narrowing the options doesn’t always make it easier,” said Van Hollen of Maryland. “You can still have a lot of disagreement over what the remaining options are.”
Another Year-End Fight: Emergency Jobless Benefits – To the list of bitter year-end fights in Congress, add an emergency jobless-benefits program that is set to expire three days after Christmas. With 1.3 million Americans at risk of losing the long-term benefits in several weeks, Democrats are hoping to pressure Republicans into renewing the compensation program, which was put in place in mid-2008 amid the worst U.S. recession since the Great Depression. Republicans, noting that the program has already cost $265 billion, say that after five and a half years, the economy has improved and the time has come for the federal backstop to end. “It was meant to be temporary, and we need to let the program expire,” House Ways and Means Committee Chairman Dave Camp (R., Mich.) said on Wednesday. “This has gone on longer than any emergency benefits in the history of the country.” Individuals are eligible for emergency compensation after they have exhausted their state benefits, which typically last for 26 weeks. When the U.S. economy was mired in recession, Americans were able to receive state and federal benefits for as long as 99 weeks combined. But as the economy has improved, Congress has shortened the duration of benefits, and it now allows for a maximum 73 weeks of combined benefits in states where the unemployment rate is above 9%. Democrats say Republicans want to abruptly cut a lifeline for jobless workers, and accuse them of overlooking the high number of people who are stuck without a job. Some 4.1 million people have been unemployed for 27 weeks or longer, government data show. That is down from the 6.7 million in 2010 but more than the 1.3 million in the month the recession hit.
Patent troll bill clears House with huge majority -- Continuing its progress through Congress, the Innovation Act -- a bill to restrain patent trolls -- has cleared the U.S. House of Representatives with an overwhelming majority of 325 to 91 despite opposition from the organizations most likely to feed new patents to the trolls. The bill's main sponsor, House Judiciary Committee Chairman Bob Goodlatte, said in an editorial this week that "we must put an end to abuse of the patent system and make the necessary changes to ensure that it serves its constitutional purpose: protecting innovators and their inventions." Even the White House supports reform.But a number of voices, most with vested interests, have been scrambling to protect the trolls even with the concerns of the big trolls taken into account with the reduction of the bill's impact on "covered business methods." This part of patent law is used more by large corporate patent holders and thus opposed by the likes of IBM, Microsoft, General Electric, and Adobe.
Distribution of US Federal Taxes - There are several main categories of federal taxes: individual income tax, the social insurance taxes that fund Social Security and Medicare, corporate income tax (which is ultimately paid by individuals), and excise taxes on gasoline, cigarettes and alcohol. This chart "The Distribution of Household Income and Federal Taxes, 2010." from the Congressional Budget Office shows the average tax rates paid in each category, broken down by income group. A few observations here:
1) It's important to remember that this is the average rate of tax expressed as a share of income. For example, those in the top 1% are almost surely paying the top marginal tax rate of about 40% on the top dollar earned. But when all the income taxed at a lower marginal rate is included, together with exemptions, deductions, and credits, this group pays an average of 20.1% of their income in individual income tax.
2) Average individual income taxes are negative for the bottom two quintiles. This arises because of "refundable" tax credits like the earned income tax credit and the child tax credit, which mean that many lower-income households not only owe zero in taxes, but receive an additional payment from the IRS.
3) In the calculations for effects of the corporation income tax, the underlying assumption is that high-income households end up paying much of the cost, because they are the ones who own most of the stock in these companies. In the calculations for excise taxes, the analysis is that low-income households pay a greater share of their income for these taxes, because they spend a greater share of their incomes on these products
Does Lowering Corporate Tax Rates Create Jobs? Answer is a resounding "no" - Linda Beale - For years (decades, actually), the American pro-wealthy right has argued that lowering corporate tax rates will create jobs. That is the presumed purpose behind the push by Dave Camp to enact a tax reform package with lower corporate rates, and the reason that even President Obama has voiced (tepid) support for lower corporate rates. Baucus at Senate Finance and Camp at House Ways & Means are part of an oft-cited "bipartisan consensus" (though its never clear whether there really is one) for cutting corporate tax rates through "revenue neutral" corporate tax reform. This is a consensus which, if it does exist, has resulted from decades of corporate lobbying in Congress and near-absolute capture of the media on the issue, combined with the proliferation of robotic economics and "law and economics" faculties who scribble endlessly about the "economics" of corporate and capital income taxation, producing studies that suggest policy based on simplifying assumptions commonly used by economists that ensure that the outcome of their mathematical games should have almost no application in the real world. So in spite of those many "studies", I've argued frequently in the past that there is no there there--i.e., that lowering corporate tax rates will do nothing to create jobs. Instead, I've said, it will simply deliver an even higher profit margin to be skimmed off by the highest paid executives and, possibly, shareholders. The higher profit margins are unlikely even to be used to increase workers' shares of the corporate revenues through higher wages, a place where they could most help the economy other than new jobs created. Thus, the drive for "revenue neutral" corporate tax reform (cut corporate taxes, cut expenditures elsewhere to make up for the decreased corporate tax revenues) is just another example of corporatism as an engine of the modern form of US class warfare.
New Study Confirms that Lower Corporate Tax Rates Don’t Create Jobs - Yves Smith - Tax maven Linda Beale today recaps this argument and summarizes new supporting evidence in the form of a study by the Center for Effective Government. As Beale reminds readers, I’ve argued frequently in the past that there is no there there–i.e., that lowering corporate tax rates will do nothing to create jobs. Instead, I’ve said, it will simply deliver an even higher profit margin to be skimmed off by the highest paid executives and, possibly, shareholders. The higher profit margins are unlikely even to be used to increase workers’ shares of the corporate revenues through higher wages, a place where they could most help the economy other than new jobs created. Thus, the drive for “revenue neutral” corporate tax reform (cut corporate taxes, cut expenditures elsewhere to make up for the decreased corporate tax revenues) is just another example of corporatism as an engine of the modern form of US class warfare. And why is Beale so confident in her view that corporations will take the funds saved through tax breaks and dispense it in dividends and higher executive pay rather than hiring staff or reinvesting? Because every time the US has done that, it’s precisely what happened. As tax expert Lee Sheppard wrote in Forbes:Even if Congress naively were to believe that tax-free repatriation of untaxed foreign profits were a good idea, we’ve been there, done that, and got bike oil on the T-shirt. In 2004, Congress granted a tax holiday, and companies with big stashes of offshore profits attributable to valuable intangibles—that’d be pharma and tech—repatriated billions of dollars in the form of dividends and executive bonuses. The Center for Effective Government study, The Corporate Tax Rate Debate: Lower Taes on Corporate Profits Not Linked to Job Creation, is particularly damning. It shows that small businesses, who have long been the engine for job growth, pay more in taxes than their grousing big company brethren, an average rate of 19% when you include Federal, state, and local versus 16.9% for the big boys.
Elizabeth Warren Attacks Beltway Powerhouse Third Way as Fronting for Wall Street - Yves Smith -- Wow, the gloves are finally coming off. Elizabeth Warren has been making good use of her Senate bully pulpit in terms of keeping the excessive power of the big banks and the haplessness of regulators in the headlines. More important in her use of her Senate microphone is Warren’s ongoing campaign to move the Overton window to the left on basic economic issues for what remains of the US middle class. It’s vital to note that positions that are regularly depicted in the media as “liberal” or “progressive,” such as strengthening Social Security and Medicare (even if it means raising taxes) and cutting defense spending in fact poll with significant majorities, so they are in fact both popular and centrist for those outside the elites. But because American politics are driven not by voters but by powerful monied interests. And perversely, those groups on the whole seem to believe that bleeding ordinary Americans dry is a winning strategy for them. Two operatives from the Washington think tank Third Way put Warren in their crosshairs for daring to suggest that Social Security be strengthened and the rich be taxed more in a Wall Street Journal op-ed on Monday. It’s critical to understand that Third Way presents itself as “centrist” which is code for “oligarchy promoters pretending to be reasonable” and has consistently advocated gutting Social Security and Medicare. As Dave Dayen wrote in 2010: But there is a constituency for this, and it begins and ends with Third Way, who wastes no time in telling the world that they can only be real manly men if they support cutting Social Security and health care for the poor, the elderly and veterans….The only proposals that are “serious” in Washington, according to Jonathan Cowan of Third Way, are the ones that hurt people who have no voice in the political process. In the name of “sacrifice.”
Private Equity and Monetary Thinking - Paul Krugman - There has been a kind of fun exchange between the think tank Third Way — which says it offers “fresh thinking”, although it looks pretty stale to me — and Elizabeth Warren. Third Way published a remarkably clumsy attack on economic populism, singling out the senator and Bill DeBlasio for special ire; Warren then raised the question of who, exactly, supports Third Way. The answer, big surprise, is Wall Street. But Felix Salmon argues that there’s a broader point here: the “2-and-20 crowd” — private equity and hedge funds — is putting a lot of money into sponsoring economic research. Some of it seems fairly detached from self-interest — the money George Soros and Bill Janeway have put into the Institute for New Economic Thinking doesn’t seem designed to make them even richer. But that’s not true across the board. And I have to say that Salmon gives me the chills when he notes that a lot of this funding seems to be heading into the study of monetary policy. What happens when a bunch of 2-and-20 guys plus economists who benefit from their largesse weigh in on monetary policy? You get something like the infamous Bernanke-is-debasing-the-currency letter of 2010. Strange to say, people who are either big rentiers themselves, market their services to rentiers, or both, are big on finding reasons why yields should go up even in a weak economy. One shudders to imagine the kind of “research” they’re likely to sponsor.
Value of Connections of the United States - It is well-known that who you know and who you are connected to matters greatly for your business success in many countries. This is nicely documented in several papers that show how connections to powerful politicians have a huge value in countries with weak institutions. US institutions do seem to work as they are supposed to. Recent work by Daron, Simon Johnson, Amir Kermani, James Kwak and Todd Mitton finds something quite different, however. Focusing on the announcement of Timothy Geithner as President-elect Obama’s nominee for Treasury Secretary in November 2008, they report robust and large returns to financial firms with connections to Geithner. Connections here are defined either from Timothy Geithner’s meetings with financial firm executives during the previous two years when he was the President of the Federal Reserve Bank of New York, or from his overlap on non-profit boards with these executives.
Whistle-blower tries to shed light on private-equity transaction fees - In 2007, Texas-based utility TXU agreed to the largest leveraged buyout ever: a $48 billion sale to Kohlberg Kravis Roberts & Co., TPG and Goldman Sachs. Since then, however, the renamed Energy Future Holdings has piled up $18 billion in losses, while revenue has dropped by nearly half. Buckling under a monstrous $44 billion debt load dating back to the LBO, the company is negotiating with creditors in an effort to fend off bankruptcy. KKR, TPG and Goldman all face substantial losses if Energy Future succumbs to bankruptcy. Still, they already have a little something to help numb their pain: Back when the deal closed, KKR and TPG each pocketed a $107 million "transaction fee," according to a regulatory filing. Goldman got $80 million. These nifty payouts are an important reason why private equity is perhaps the most lucrative game on Wall Street. In the past 10 years, private-equity firms have collected $2 billion in transaction fees, which essentially are bonuses the firms take for conducting their business of buying, managing and selling companies. Now a senior private-equity insider is trying to shine light on these little-known payments, which can constitute a sizable slug of revenue at the firms. The insider filed a whistle-blower complaint earlier this year with the Securities and Exchange Commission in which he contends that private-equity firms are violating federal securities law because they are acting as unlicensed brokers when they collect transaction fees
Investors Borrowing Like Drunkards to Buy Stocks Again?: Yesterday we learned sales for this year's Black Friday weekend declined for the first time since 2009. I have been warning my readers for months that falling consumer confidence would result in a pullback in consumer spending -- and that's exactly what's happening this holiday shopping season. According to the National Retail Federation, consumers spent an average of $407.02 from Thursday through Sunday, down about four percent from what they spent last year.The first decline in holiday spending since 2009 does not bode well for the economy, and as far as I'm concerned, it is an early indication of a weakening economy going into 2014. But there is one place people are spending. In fact, you can say they're spending so much here, they're borrowing to buy more! Investors have borrowed more money to buy stocks than at any other time in history! The chart below shows the use of margin debt on the New York Stock Exchange (NYSE). It stands at the record-high level.
How Risky is Citigroup’s New, Improved Version of a Once-Toxic Type of Synthetic CDO? - We are all still paying the price for the stream of ever more leveraged credit derivatives that fueled the world’s greatest credit bubble. It appears that some of these are attempting a comeback. Last week, the Financial Times reported that Citi is offering a new version of the now-infamous Leveraged Super Senior CDO (“LSS”). If it succeeds, the Bank could claim the benefit of insurance on a portfolio of corporate bonds, while the client (aka “counterparty”) only deposits a small fraction of the insured amount. The purpose of the first synthetic CDO, created by JPMorgan in the ‘90s, was to relieve the bank of risky debt it actually owned. The riskier LSS deals arrived circa 2005, and were mostly arranged by trading desks which did not own the referenced bond portfolio. Rather, they simply turned around and sold insurance on the full amount of corporate debt, using regular CDS. On a large scale, such transactions have the effect of lowering risk premiums (aka “spreads”). Ultimately, the borrowing costs of the corporations referenced in the portfolio go down, encouraging still more leverage. With bond yields decreasing, bond investors chase ever more leveraged instruments.In a recent interview with Der Spiegel, Nobel winning economist Robert Shiller warned: “… stock exchanges are at a high level and prices have risen sharply in some property markets… That could end badly”. A few days ago, the Financial Times reported that CMBS issuance has nearly doubled since last year to reach a post-crisis peak, as have CLO and CDO issuance. “US regulators have warned that banks are making riskier loans to companies in an effort to boost flat-lining profits and fight off competition from other types of lender” wrote the newspaper. As early as last February, in an article titled “Credit Super Nova!” Pimco’s Bill Gross warned: “our credit-based financial markets and the economy it supports are levered, fragile and increasingly entropic – it is running out of energy and time.”
You give me a capital requirement, I’ll give you a derivative to skirt it. | mathbabe -- I’ve enjoyed reading Anat Admati and Martin Hellwig’s recent book, The Bankers’ New Clothes, which explains a ton of things extremely well, including:
- Differentiating between what’s “good for banks” (i.e. bankers) versus what’s good for the public, and how, through unnecessary complexity and shittons of lobbying money, the “good for bankers” case is made much more often and much more vehemently,
- that, when there’s a guaranteed backstop for a loan, the person taking out the loan has incentive to take on more risk, and
- that there are two different definitions of “big returns” depending on the context: one means big in absolute value (where -30% is bigger than -10%), the other mean big as in more positive (where -10% is bigger than -30%). Believe it or not, this ambiguity could be (at least metaphorically) taken as a cause of confusion when bankers talk to the public,
Admati and Hellwig’s suggestion is to raise capital requirements to much higher levels than we currently have. Here’s the thing though, and it’s really a question for you readers. How do derivatives show up on the balance sheet exactly, and what prevents me from building a derivative that avoids adding to my capital requirement but which adds risk to my portfolio? I’ve been getting a lot of different information from people about whether this is possible, or will be possible once Basel III is implemented, but I haven’t reached anyone yet who is actually expert enough to make a definitive claim one way or the other.
Fed Eyes Financial System's Weak Link - Regulators have spent the past five years trying to siphon risk out of the financial system, but the Federal Reserve sees one major piece of unfinished business: short-term funding.In recent decades, such funding has become a sort of oil lubricating Wall Street's gears. Lenders—money-market funds, insurance companies, pension plans and others—provide temporary cash or securities to big banks, hedge funds, asset managers or other market participants that trade stocks and bonds. The borrowers can invest the cash or use securities-on-loan as leverage for other transactions. Relying on that system carries risks. The financial crisis proved that when Wall Street leans too heavily on short-term funding, a sudden hiccup in those loans can hobble financial firms, instigating a crisis that freezes lending for Main Street businesses.Problems in the short-term markets in 2008 were not unlike the bank runs—mass, simultaneous withdrawals of deposits—that preceded the Great Depression, according to academics and Fed economists who have studied the topic. During the worst of the crisis in the fall of 2008, many short-term lenders moved to pull their money back at the same time. Some hedge funds failed after they couldn't obtain short-term loans to pay money they owed elsewhere. Lehman Brothers, an investment bank more than a century old, suddenly faced bankruptcy that September in part because it couldn't secure overnight funding. The shock of Lehman's demise caused lenders to pull back even more, exacerbating the credit crunch. Risks posed by short-term funding have long been a concern at the Fed, and a string of recent public statements suggests the central bank may soon take aim at the ubiquitous practice.
Who’s Lending in the Fed Funds Market? - NY Fed - The fed funds market is important to the framework and implementation of U.S. monetary policy. The Federal Open Market Committee sets a target level or range for the fed funds rate and directs the Trading Desk of the New York Fed to create “conditions in reserve markets” that will encourage fed funds to trade at the target level. In this post, we use various publicly available data sources to estimate the size and composition of fed funds lending activity. The fed funds market consists of unsecured loans of U.S. dollars among depository institutions and certain other eligible entities, including government-sponsored enterprises (GSEs). It’s no easy matter to gauge the size of the market, as comprehensive data aren’t available. However, we can estimate its size and composition by aggregating data from publicly available regulatory filings, such as the FR Y-9C, call reports, and 10-Qs. We collect information from hundreds of institutions and use data from the highest level of each organization to avoid double counting. Although we can’t obtain a complete view of the market, our conversations with market participants suggest that these reports capture most fed funds transactions.We find that the fed funds market has shrunk considerably since the financial crisis and that lending activity is now dominated by one group of market participants. Federal Home Loan Banks play a key role in fed funds lending, accounting for almost 75 percent of total lending in the last quarter of 2012.
From LIBOR to Fed Funds: 5 facts about the interbank lending market in the US - Contracts worth hundreds of trillions - ranging from corporate loans to mortgages to rate swaps and LIBOR futures - are all priced based on a relatively small unsecured interbank lending market. Also a fairly large group of contracts (in the trillions) is linked to the fed funds rate, which is derived from the bank-to-bank loan market as well. Given its importance, here are some facts about the interbank lending market in the US.
1. The volume of unsecured loans among US banks has collapsed in recent years. Banks fund themselves with deposits, bonds, repo, commercial paper, etc. After the 2008 experience, borrowing from other banks is rarely a material part of banks' funding strategy. The situation in Europe's interbank markets is even worse.
2. While most of the LIBOR-based contracts are linked to the 3-month rate, the bulk of the interbank market on which these contracts are based is overnight. It is rare to see banks lending to each other for more than a week or two. This is the main reason that some trading desks were able and incentivized to manipulate the LIBOR index (1-3 month lending market often just didn't exist).
3. Some may find this a bit confusing but the overnight LIBOR rate and the "fed funds effective" rate are two different ways of measuring essentially the same thing: the rate at which banks lend dollars to each other overnight. The reason for the differences in the two indices is the universe of banks and the methodology used to determine the averages.
4. The largest lenders in the US overnight unsecured market are not even commercial banks. According to the NY Fed, most overnight liquidity is provided by the Federal Home Loan Banks (FHLBank System), which are government-sponsored entities (h/t Kostas Kalevras - @kkalev ). Unlike regular US banks, FHLBs receive zero rate on the reserve cash with the Fed.
5. It's enough of a problem that trillions worth of contracts are priced based on this shrinking market. Now consider the fact that the Fed's traditional tool to target monetary policy is based on the overnight interbank market where participants use government agencies to create a riskless arbitrage. And unless there is a change, the Fed will return to targeting the fed funds rate as its primary tool, once QE ends. That is why the pressure is building on the central bank to develop alternative methods (see post) for targeting short-term rates that will actually impact the broader economy.
Citigroup and JPMorgan Settle With EU Commission for Rigging Libor; U.S. Justice Department Stays Mum - Gary Gensler, the outgoing Chairman of the Commodity Futures Trading Commission, previously testified to Congress that he began investigating allegations that a global banking cartel was rigging the international interest rate benchmark known as Libor in the spring of 2008. One can prudently assume that around the same time, he made the issue known to the U.S. Department of Justice. It’s now almost six years later and yet two of the U.S. banks involved in the cartel, JPMorgan Chase and Citigroup, have yet to be charged by U.S. authorities. Today, JPMorgan and Citigroup have admitted participating in the Yen Libor financial derivatives cartel to the European Commission and accepted fines of €79.8m ($108.3 million) and €70m ($95 million), respectively. Citigroup avoided paying an additional €55m ($74.6 million) by being granted full immunity for one of its three charged infringements, ostensibly for its cooperation in the matter. The settlement announced today encompasses the rigging of two benchmarks, Yen Libor and its European equivalent, Euribor, in an effort by the financial institutions to make profits in the financial derivatives linked to those benchmarks.
The World Is Stuck Between A Rock And A Squishy Place - Kunstler - The rock is reality. The squishy place is the illusion that pervasive racketeering is an okay replacement for an economy. The essence of racketeering is the use of dishonest schemes to get money, often (but not always) employing coercion to make it work. Some rackets can function on the sheer cluelessness of the victim(s). Is it fair to suppose that money management is at the heart of the sort of advanced, complex economy that developed early in the 20th century? I think so. Of course, in order for money to have meaning, to function in such transactional relations, the people must be convinced that it legitimately represents its face value. Otherwise, money must be labeled “money” — that is, a medium of exchange suspected of false value. An economy that uses “money” — especially an economy of rackets — is an economy in a lot of trouble, and that is where ours is in December 2013. The trouble reached escape velocity in the fall of 2008 when a particular brand of racket among the Wall Street kit-bag of rackets got badly out-of-hand, namely the business of selling securitized bundled mortgages and their “innovative” derivative “products” to dupes unaware that they were booby-trapped for failure which would, perversely, hugely reward the seller of such trash paper. It turned out that all the large banks trafficking in such booby-trapped contracts ended up choking on them when “the music stopped” — that is, when the derivative “swaps” payoffs at the heart of this particular racket began to fail, sending up a general alarm that all such “products” were primed to blow up the entire “banking” system.
Bill Gross Explains What "Keeps Him Up At Night" - The choice extracts from Bill Gross' just released latest monthly letter: What keeps us up at night? Well I can’t speak for the others, having spoken too much already to please PIMCO’s marketing specialists, but I will give you some thoughts about what keeps Mohamed and me up at night. Mohamed, the creator of the “New Normal” characterization of our post-Lehman global economy, now focuses on the possibility of a” T junction” investment future where markets approach a time-uncertain inflection point, and then head either bubbly right or bubble-popping left due to the negative aspects of fiscal and monetary policies in a highly levered world. This year’s April taper talk by the Federal Reserve is perhaps a good example of this forward path of asset returns. Admittedly the reaction in the bond market was rather sudden and it precipitated not only the disillusioning of bond holders, but also an increase in redemptions in retail mutual fund space. But then the Fed recognized the negative aspects of “financial conditions,” postponed the taper, and interest rates came back down. Sort of a reverse “Sisyphus” moment – two steps upward, one step back as it applies to yields. ... investors are all playing the same dangerous game that depends on a near perpetual policy of cheap financing and artificially low interest rates in a desperate gamble to promote growth.
Gross’s Bond Fund Had Redemptions of $3.7 Billion in November - Bill Gross’s Pimco Total Return Fund, which lost its title as the world’s largest mutual fund in October, had its seventh straight month of withdrawals in November as investors continued to flee bonds. Clients pulled an estimated $3.7 billion from Pacific Investment Management Co.’s Total Return Fund last month, leaving it with assets of $244 billion at the end of November, Chicago-based research firm Morningstar Inc. said today in an e-mailed statement. Net redemptions for the fund this year through Nov. 30 are estimated at $36.9 billion, Morningstar said, on track to be the most ever for a calendar year. Investors are pulling money out of traditional fixed-income funds in anticipation that the three-decade rally in bonds is ending, and adding to stock funds, particularly low-cost index funds, as the bull market in U.S. equities is in its fifth year. U.S. bond mutual funds saw net redemptions of $133 billion in the five months through October, while stock funds received $56 billion in that period, according to the Investment Company Institute in Washington.
Regulators Set to Approve Toughened 'Volcker Rule' - U.S. regulators are expected to approve next week a toughened version of the Volcker rule, ushering in an era of stricter oversight for Wall Street with restrictions on the trading banks can do with their own money. Four of the five agencies wrestling over the rule since it was proposed by President Barack Obama in January 2010 said Tuesday that they will vote Dec. 10 on a finished version of the trading curbs. The fifth agency, the Securities and Exchange Commission, is likely to take action "on or about" the same day, SEC Chairman Mary Jo White said.Barring a last-minute surprise, the votes will result in tighter restrictions on certain trading activities that go beyond what regulators had agreed to just a few weeks ago, according to people familiar with the matter. Since then, regulators have been locked in tense negotiations that threatened to upend the provision. Under the final rule, regulators are expected to closely track trading activities with an eye on whether certain trades known as hedges are designed to post a profit rather than offset risks that accompany trading with clients. The finished version of the Volcker rule is likely to require that hedges be designed to reduce specific risks, according to a portion of the proposed rule reviewed by The Wall Street Journal. Hedging activity should shrink or alleviate "one or more specific, identifiable risks" such as market risk, currency or foreign-exchange risk, and interest-rate risk, the language says. "This is the new era of Big Brother banking," said Michael Mayo, an analyst with CLSA Americas. "Now banks' fortunes are more closely tied to the government."
Volcker Rule To Scrap "Portfolio Hedging", Would Make Trillions In Excess Deposits Inert - As we have been covering for the past year and a half, most explicitly in "A Record $2 Trillion In Deposits Over Loans - The Fed's Indirect Market Propping Pathway Exposed", when it comes to the pathway of the Fed's excess deposits propping up risk levels, it has nothing to do with reserves sitting on bank balance sheets as assets, and everything to do with excess deposits (of which there are now $2.4 trillion thanks to the Fed) which are used as Initial collateral by banks such as JPM and then funding such derivatives as IG9 in a failed attempt to cover a segment of the corporate bond market. These deposits originate at the Fed as a liability at the commercial banking sector to the excess reserve asset. That much is clear and undisputed, and was admitted by none other than JPM itself.
More Welfare for Wall Street: One in Three Bank Tellers Need Public Assistance - Bill Moyers - Big banks eating up taxpayer subsidies isn’t a new story. We heard a lot about the hundreds of billions of dollars doled out to Wall Street in the Troubled Asset Relief Program (TARP). And a May analysis by Bloomberg News estimated that the six largest banks alone had scooped up over $100 billion more in subsidies since 2009. But a new study finds that we’re also subsidizing their profits by keeping their low-wage workforce out of poverty. Danielle Douglas reports for The Washington Post: Almost a third of the country’s half-million bank tellers rely on some form of public assistance to get by, according to a report due out Wednesday. Researchers say taxpayers are doling out nearly $900 million a year to supplement the wages of bank tellers, which amounts to a public subsidy for multibillion-dollar banks. The workers collect $105 million in food stamps, $250 million through the earned income tax credit and $534 million by way of Medicaid and the Children’s Health Insurance Program, according to the University of California at Berkeley’s Labor Center. The center provided the data to the Committee for Better Banks, a coalition of labor advocacy groups that published the broader study, to be released Wednesday, on the conditions of bank workers in the heart of the financial industry, New York. In the that state alone, 39 percent of tellers and their family members are enrolled in some form of public assistance program, the data show.“This is the wealthiest and most powerful industry in the world, and it’s substantially subsidized by our tax dollars, money that we could be spending on child care or pre-K,”
Unofficial Problem Bank list declines to 645 Institutions - This is an unofficial list of Problem Banks compiled only from public sources. Here is the unofficial problem bank list for November 29, 2013. Changes and comments from surferdude808: The FDIC released details of its enforcement action activity through October 2013. For the week, there were nine removals that lower the Unofficial Problem Bank List to 645 with assets of $221.2 billion. At the end of November last year, the list held 856 institutions with assets of $326.4 billion. For the month, the list declined from 670 to 645 after one failure, six unassisted mergers, and 18 action terminations. It was the first month that an institution was not added to the list since its first publication in August 2009. Earlier in the week, the FDIC released third quarter industry results including figures of 515 institutions with assets of $174 billion on the Official Problem Bank List. The difference between the official and unofficial lists narrowed to 130 institutions and $47.2 billion of assets from 148 institutions and $58.6 billion of assets last quarter. For five quarters during 2009 and 2010, the official list had a higher count and more assets but subsequently the official list has declined at a faster pace. We anticipated the institution count difference could narrow to around 120. Still, the narrowing by 18 was the second most since the first quarter of 2013.
Bank of America to pay Freddie Mac $404 million in mortgage settlement - (Reuters) - Bank of America Corp will pay $404 million to Freddie Mac to resolve all repurchase liabilities on home loans sold to the government-controlled mortgage company from 2000 to 2009, the bank said on Monday. The settlement covers about 716,000 loans and compensates Freddie Mac for past losses and potential future losses related to denials, rescissions and cancellations of mortgage insurance, Freddie Mac said in a statement. Bank of America will pay a net $391 million, reflecting a $13 million credit for prior repurchases and adjustments, Freddie Mac said. Since 2010, Bank of America has agreed to pay more than $45 billion to settle various claims stemming from the U.S. housing and financial crisis.
Brewing Signs of Housing Trouble - We've all been wondering how home prices could be soaring when wages are so low and an estimated 10 million foreclosures have been completed. Now a wave of reports are pointing to more trouble in residential real estate. Many homeowners obtained home equity loans during the housing bubble and delinquencies on these loans are on the rise. The reason is the payments have ballooned up. For the first ten years of many home equity loans, the payments are low due to being only interest on the loan and not the principle. Year 11 can be a budget buster as the monthly payments suddenly balloon as principle of the loan is added to the monthly payments. U.S. borrowers are increasingly missing payments on home equity lines of credit they took out during the housing bubble, a trend that could deal another blow to the country's biggest banks. The loans are a problem now because an increasing number are hitting their 10-year anniversary, at which point borrowers usually must start paying down the principal on the loans as well as the interest they had been paying all along. More than $221 billion of these loans at the largest banks will hit this mark over the next four years, about 40 percent of the home equity lines of credit now outstanding. From the below graph of home equity loans we see a major increase around 2004. These are the maturing loans where the payments will jump up. The reason this is a problem is these loans can result in a 90% loss for the banks and for the first ten years, only interest payments are due on these loans, not principle. During the housing bubble, many homeowners took out equity loans to make ends meet, as well as an additional mortgage to purchase a home. Now the larger payments are coming due. Roughly 10.8 million households, or 21% of homes still have negative equity. Still if one adds up all of the numbers, this cannot be cataclysmic as assuredly not all $221 billion in home equity loans hitting the 10 year mark will default and cause a 90% loss for banks.
Government About to Destroy American Mortgages Permanently - Mortgages as we know them are going away in the next four years, warns Dick Bove, vice president of research at Rafferty Capital. Bove, one of the most widely-respected banking analysts in the world, is certain that will have devastating consequences for housing and the rest of the American economy. The removal of the two most important players in American mortgages – the Federal National Mortgage Association ("Fannie Mae") and the Federal Home Loan Mortgage Corporation ("Freddie Mac") – threatens the very foundation of the American economy, according to Bove. These two government-sponsored entities – along with the smaller Government National Mortgage Association ("Ginnie Mae", a government corporation that broke off from Fannie Mae) – issued 98% of the $1.4 trillion in mortgage-backed securities in the United States so far in 2013. These securities are sold in order to add liquidity to the mortgage market, thereby making funds available to borrowers. "If Fannie and Freddie go away, what then happens to the mortgage markets?" asks Bove. "The answer to that question is that we no longer have things like 20-year and 30-year mortgages because banks are not going to put that type of mortgage on their balance sheets. And we won't have fixed-rate mortgages." Bove says the banks he spoke with won't be able to provide 30-year mortgages in large quantities without Fannie Mae and Freddie Mac in the markets. "I've called a number of very large banks – the largest issuers of mortgages in the United States – and asked them, 'If there was no Fannie and Freddie, what would be the typical mortgage in the United States?' And, the answer is a 10- to 15-year adjustable rate mortgage." "It is no longer the goal of the United States government that every household should have its own home," say Bove. "In my view, that's a call for a return of public housing and all of the ills that went with public housing."
MBA: Mortgage Applications Decrease in Latest Survey - From the MBA: Mortgage Applications Fall During Holiday-Shortened Week - Mortgage applications decreased 12.8 percent from one week earlier, according to data from the Mortgage Bankers Association’s (MBA) Weekly Mortgage Applications Survey for the week ending November 29, 2013. This week’s results include an adjustment for the Thanksgiving holiday. ... The Refinance Index decreased 18 percent from the previous week and is at its lowest level since the week ending September 6, 2013. The seasonally adjusted Purchase Index decreased 4 percent from one week earlier. ... The average contract interest rate for 30-year fixed-rate mortgages with conforming loan balances ($417,000 or less) increased to 4.51 percent from 4.48 percent, with points increasing to 0.38 from 0.31 (including the origination fee) for 80 percent loan-to-value ratio (LTV) loans. The first graph shows the refinance index. The refinance index is down sharply - and down 69% from the levels in early May. The second graph shows the MBA mortgage purchase index. The 4-week average of the purchase index is now down about 8% from a year ago.
Is Bob Shiller Right? Mortgage Applications Collapse Back To 5 Year Lows - After the initial post-Taper-talk rate-rise-driven marginal-buyer-crushing collapse in mortgage applications in the US, the un-Taper provided a brief period of hope for the NAR and market apologists that all-cash buyers are all we need and mortgage applications dead-cat-bounced on the rate drop. However, all that hope ended in early November and as of this morning's print, mortgage applications have plunged back to the almost record lows of October 2008 (levels not seen since December 2000). As Bob Shiller recently explained, "we can't trust momentum anymore," in housing and the speculators are leaving the buildings.
Smaller Mortgage Lenders Lead Field - Big banks have been retrenching from the mortgage business recently, leaving smaller players to pick up larger chunks of business. As of the third quarter, smaller mortgage players held a 60% market share of the U.S. origination market, up from 39% in 2009, according to industry publication Inside Mortgage Finance. In the third quarter alone, the smaller lenders, defined as those outside the top five, gained about six percentage points of market share, according to data compiled by Paul Miller, an analyst with FBR Capital Markets. The trend is opening up opportunities for small companies such as loanDepot.com LLC, regional banks such as M&T Bank Corp. and larger mortgage players like Quicken Loans. The competition is benefiting consumers in some places, while helping find jobs for displaced workers. Some smaller lenders, looking to take advantage of the trend, have sold shares in initial public offerings. The midsize and smaller players have grown despite tightening their underwriting standards, much like larger banks have since the financial crisis. But the smaller banks' capital rules aren't as stringent as those that make mortgages a costly enterprise for the biggest firms.
Weekly Update: Housing Tracker Existing Home Inventory up 1.7% year-over-year on Dec 2nd - Here is another weekly update on housing inventory ... for the seventh consecutive week, housing inventory is up year-over-year. This suggests inventory bottomed early in 2013. There is a clear seasonal pattern for inventory, with the low point for inventory in late December or early January, and then peaking in mid-to-late summer. The Realtor (NAR) data is monthly and released with a lag (the most recent data was for October). However Ben at Housing Tracker (Department of Numbers) has provided me some weekly inventory data for the last several years. This graph shows the Housing Tracker reported weekly inventory for the 54 metro areas for 2010, 2011, 2012 and 2013.In 2011 and 2012, inventory only increased slightly early in the year and then declined significantly through the end of each year. Inventory in 2013 is now 1.7% above the same week in 2012 (red is 2013, blue is 2012). We can be pretty confident that inventory bottomed early this year. Inventory is still very low, but this increase in inventory should slow house price increases.
Fannie, Freddie, FHA REO inventory declined slightly in Q3 - The FHA has stopped releasing REO inventory as part of their monthly report, however they provided me the most recent data today (for October). In their Q3 SEC filing, Fannie reported their Real Estate Owned (REO) increased to 100,941 single family properties, up from 96,920 at the end of Q2. Freddie reported their REO increased to 47,119 in Q3, up from 44,623 at the end of Q2. The FHA reported their REO decreased to 32,226 (as of October), down from 41,838 in Q2. This reverses a recent trend of increasing REO inventory at the FHA. The combined Real Estate Owned (REO) for Fannie, Freddie and the FHA declined to 180,286, down from 183,381 at the end of Q2 2013. The peak for the combined REO of the F's was 295,307 in Q4 2010. This following graph shows the REO inventory for Fannie, Freddie and the FHA.
Lawler: Single Family Inventory Down Again, But Pace of Decline Slowed in Q3 -- From housing economist Tom Lawler: The overall SF REO inventory appears to have declined again last quarter, though the pace of decline slowed. Both Fannie and Freddie reported slight increases last quarter, reflecting modest increases in acquisitions (mainly in judicial foreclosure states) and declines in dispositions in part reflecting “market conditions. FHA’s SF REO inventory, in contrast, declined last quarter following increases in the previous two quarters. REO inventory both held by private-label securities and at FDIC-insured institutions also fell last quarter, though at a slower pace than the previous few quarters. (Note: I get my PLS inventory estimates from Barclays Capital, but only have data through August. For FDIC-insured institutions, I assume that the average carrying value is 50% higher than that at Fannie and Freddie). Note: This is most, but not all, of the lender owner foreclosure inventory, aka "Real Estate Owned" (REO). There is also REO for the VA, and some other non-FDIC insured institutions - but this is probably close to 90% of all REOs.
CoreLogic: House Prices up 12.5% Year-over-year in October - The CoreLogic HPI is a three month weighted average and is not seasonally adjusted (NSA). From CoreLogic: CoreLogic Reports Home Prices Increased by Less Than 1 Percent Month Over Month in October On a month-over-month basis, including distressed sales, home prices increased by only 0.2 percent in October 2013 compared to September 2013. Year over year, home prices nationwide, including distressed sales, increased 12.5 percent in October 2013 compared to October 2012. This change represents the 20th consecutive monthly year-over-year increase in home prices nationally.Excluding distressed sales, home prices increased 0.4 percent month over month in October 2013 compared to September 2013. On a year-over-year basis, excluding distressed sales, home prices increased by 11 percent in October 2013 compared to October 2012. Distressed sales include short sales and real-estate owned (REO) transactions. The CoreLogic Pending HPI indicates that November 2013 home prices, including distressed sales, are expected to remain at the same level month over month as October 2013, with a projected increase of 12.2 percent on a year-over-year basis from November 2012. This graph shows the national CoreLogic HPI data since 1976. January 2000 = 100. The index was up 0.2% in October, and is up 12.5% over the last year. This index is not seasonally adjusted, and the month-to-month changes will be smaller for next several months. The index is off 17.5% from the peak - and is up 22.9% from the post-bubble low set in February 2012. The second graph is from CoreLogic. The year-over-year comparison has been positive for twenty consecutive months suggesting house prices bottomed early in 2012 on a national basis (the bump in 2010 was related to the tax credit). This is the largest year-over-year increase since 2006.
Trulia: Asking House Price increases Slow in Hot Markets --From Trulia this morning: Trulia Price Monitor: Hottest Housing Markets Cool, While Warm Markets Heat Up In November, asking home prices rose 12.1 percent year-over-year (Y-o-Y), increasing in 98 of the 100 largest U.S. metro areas. Regaining a bit of steam since the slowdown began in July, asking prices rose 1.0 percent month-over-month (M-o-M) and 3.0 percent quarter-over-quarter (Q-o-Q). In fact, the quarterly increase is the fastest in five months, though still lower than in the spring....The slowing of asking home price gains is most apparent in the housing markets with the biggest price rebounds. The slowdown – measured as the difference in the Q-o-Q price changes between November and August – was more than two percentage points in Las Vegas, Oakland, Atlanta, Phoenix, Detroit, and Los Angeles. The price slowdown happening nationally is really a sharp deceleration in price gains in the hottest markets. Among the 100 U.S. largest metros, the quarterly price increase in the 10 metros where prices rose more than 20 percent Y-o-Y fell from 6.1 percent in August to 3.7 percent in November. But in the 56 markets where prices rose by less than 10 percent Y-o-Y, price gains actually accelerated in the most recent quarter, rising 1.6 percent in November compared with 1.3 percent in August. Prices accelerated in Philadelphia, Pittsburgh, and Miami, for instance. More from Jed Kolko, Trulia’s Chief Economist: Hottest Housing Markets Cool, But Warm Markets Heat Up
New-Home Sales in U.S. Rebound From One-Year Low - Purchases of new U.S. homes rebounded in October from the lowest level in more than a year, signaling buyers are starting to take higher mortgage rates in stride. Sales jumped 25.4 percent to a 444,000 annualized pace, following a 354,000 rate in the prior month that was the weakest since April 2012, figures from the Commerce Department showed today in Washington. The median forecast of 62 economists surveyed by Bloomberg called for 429,000. Home sales are regaining strength as gains in employment and stock prices help consumers adjust to this year’s increase in borrowing costs and property values, which have hurt affordability. Builders such Hovnanian Enterprises Inc. are optimistic about the outlook for the market, which will need to expand to meet the needs of a growing population. “The worst of the impact of higher mortgage rates seems to be behind us,” Economists’ estimates in the Bloomberg survey ranged from 375,000 to 450,000. The 25.4 percent increase from September was the biggest one-month surge since May 1980.
New Home Sales increased to 444,000 Annual Rate in October - Note: The New Home sales reports for September and October were both released today (delayed due to government shutdown).The Census Bureau reports New Home Sales in October were at a seasonally adjusted annual rate (SAAR) of 444 thousand, and sales in September were at a 354 thousand SAAR. August sales were revised down from 421 thousand to 379 thousand, and July sales were revised down from 390 thousand to 373 thousand. The first graph shows New Home Sales vs. recessions since 1963. The dashed line is the current sales rate. "Sales of new single-family houses in October 2013 were at a seasonally adjusted annual rate of 444,000, according to estimates released jointly today by the U.S. Census Bureau and the Department of Housing and Urban Development. This is 25.4 percent above the revised September rate of 354,000 and is 21.6 percent above the October 2012 estimate of 365,000."The second graph shows New Home Months of Supply.The months of supply decreased in October to 4.9 months from 6.4 months in September. The all time record was 12.1 months of supply in January 2009. This is now in the normal range (less than 6 months supply is normal). "The seasonally adjusted estimate of new houses for sale at the end of October was 183,000. This represents a supply of 4.9 months at the current sales rate." Starting in 1973 the Census Bureau broke inventory down into three categories: Not Started, Under Construction, and Completed. This graph shows the three categories of inventory starting in 1973.The inventory of completed homes for sale is near the record low. The combined total of completed and under construction is increasing, but still very low.The last graph shows sales NSA (monthly sales, not seasonally adjusted annual rate). In October 2013 (red column), 35 thousand new homes were sold (NSA). Last year 29 thousand homes were sold in October. The high for October was 105 thousand in 2005, and the low for October was 23 thousand in 2010.
Summer New-Home Sales Look Worse After Revisions - Rising interest rates appear to have taken a bigger bite out of new-home sales than previous reports have suggested. New-home sales in October jumped by 25.4% from September’s level, according to a government report Wednesday. But sales for June, July, and August were all revised down. Sales in August were 10% lower than previously reported, while June and July were revised down by 0.9% and 4.4%, respectively. And September’s figure was even worse. September hadn’t been reported as scheduled last month due to the government shutdown in October, and it showed that sales had dropped by 6.6% from August’s downwardly revised level. Sales in September ran at a seasonally adjusted annual rate of 354,000 units, which was 7.8% below the year-earlier figure, the first time in nearly two years that home sales have turned negative on a year-over-year basis. October’s report was much better, by contrast. Sales ran at a seasonally adjusted pace of 444,000. At that rate, there was a 4.9-month supply of homes on the market in October, down from 6.4 months in September (which was the highest level in two years). Housing enjoyed a brisk rebound to start 2013, as low interest rates and low supplies of for-sale homes spurred bidding wars and intense competition. But interest rates spiked in June, rising by more than a percentage point after the Federal Reserve suggested it could slow down its bond-buying campaign that has pushed down mortgage rates. Mortgage rates retraced some of that rise in late September, after the Fed decided it wasn’t ready to “taper” those bond purchases.
October New Home Sales Surge By Most Since 1980 As Median Price Drops To One Year Low - With the government shutdown which apparently had zero impact on the economy, moments ago the Census Bureau released not one but two New Home Sales reports together due to the delay in data reporting. The data showed that while in September new home sales declined from 379K to 354K annualized, or the lowest since early 2012, the subsequent rebound sent New Home Sales to 444K, or a 90K increase, +25.4%, in one month was the biggest month over month jump since May 1980! What was less noted is the prior revisions, with June revised 0.9% lower, July down 4.4%, and August revised by a whopping 10% lower. So what caused the October surge? Possibly it was pent up demand, because as the first chart below shows, an unbroken trendline suggests a modest decline in sales data net of the prior downward revisions. However, what was most likely the reason for the increase is that the Median new home sales price tumbled to $245,800, down from $257,400 and well below the recent highs of $279,300. In fact, this was the lost median new price in one year. Supply - meet demand, and equilibrium price.
A Different Perspective on the Sales of New Single Family Homes - New home sales in the United States look like they are on a tear, at least compared to levels from early 2010. Here is a graph from FRED showing how sales data for new single family homes has improved since just after the end of the last recession: Sales are up from their post-Great Recession low of 270,000 in February 2011 to August 2013's level of 421,000, a rather stellar overall increase of 57.4 percent in just two and a half short years. The annual level of 354,000 seen in September 2013 is also far from healthy despite the month-over-month gain of 25.4 percent. Here is a graph over the same time period showing the year-over-year percentage increase in sales: After sales fell by a whopping 32.5 percent in August 2010, the low point in sales "growth", they rose to their post-Great Recession year-over-year high of 35.6 percent in February 2012, a complete turn around. Since then, however, things have started to slip a wee bit with year-over-year sales rising by only 5.7 percent in July 2013, hardly a stellar performance. Now, as I am prone to do, let's put all of this into historical perspective. Here is a graph showing new home sales all the way back to 1963: With all of the data in mind, you can see how the current residential real estate market in the United States can hardly be termed "healthy". Ignoring the rather anomalous rise in sales between the years 2000 and 2006 (aka the housing bubble), it is clear that the number of new single family home sales is still extremely depressed. In fact, July's sales level of 390,000 homes was the 74th worst month on record out of all 608 monthly data points since January 1963.
Home Buyers Are Scarce, So Renters Take Their Place — Homeownership was out of reach for Tishri Hyman, a single mother of two with a good job but less than stellar credit. But three years ago, she found the next best thing: a brand new house, complete with a fireplace, that she could rent. Ms. Hyman and her daughters moved into what had been a model home in one of the many boom-time subdivisions around Atlanta that were originally intended for first-time buyers. But now thousands of similar single-family homes are being built for tenants, rather than owners. Around Atlanta, new five-bedroom, three-bath homes that once might have sold for a little less than $200,000 are now on offer for monthly rents of $1,300 — granite countertops and walk-in pantries included. Building homes to lease, rather than sell, has begun to make sense to home builders and investors because the pool of qualified first-time home buyers has shrunk even as the price of buying existing homes has risen enough to make new construction worthwhile again. According to census figures, the percentage of homes built specifically as rentals is still relatively small, at 6.2 percent in 2012. But that represents a record high.
Construction Spending increased in October - The release today was for both September and October. Construction spending decreased in September and increased in October (October was up from August). The Census Bureau reported that overall construction spending increased in October: The U.S. Census Bureau of the Department of Commerce announced today that construction spending during October 2013 was estimated at a seasonally adjusted annual rate of $908.4 billion, 0.8 percent above the September estimate of $901.2 billion. The October figure is 5.3 percent above the October 2012 estimate of $863.1 billion. Spending on private construction was at a seasonally adjusted annual rate of $625.7 billion, 0.5 percent below the September estimate of $629.0 billion. ... In October, the estimated seasonally adjusted annual rate of public construction spending was $282.7 billion, 3.9 percent above the September estimate of $272.2 billion.This graph shows private residential and nonresidential construction spending, and public spending, since 1993. Note: nominal dollars, not inflation adjusted. There has been a "pause" in residential construction spending, but the level is still very low and I expect residential spending to continue to increase. Private residential spending is 52% below the peak in early 2006, and up 43% from the post-bubble low. Non-residential spending is 28% below the peak in January 2008, and up about 33% from the recent low. Public construction spending is now 13% below the peak in March 2009 and up about 7% from the recent low. The second graph shows the year-over-year change in construction spending. On a year-over-year basis, private residential construction spending is now up 17%. Non-residential spending is down 3% year-over-year. Public spending is up 2% year-over-year
Real Median Household Incomes: Excruciatingly Slow and Erratic Improvement -- The Sentier Research monthly median household income data series is now available for October. Nominal median household incomes were down $230 month-over-month but up $704 year-over-year. However, adjusted for inflation, real incomes increased only $199 MoM and are up only $217 YoY (-0.4% and 0.4%, respectively). And these numbers do not factor in the expiration of the 2% FICA tax cut. The median real household income is up only 2.7% since its Financial Crisis trough set in the summer of 2011, now 26 months later. Improvement has been excruciatingly slow and erratic. The first chart below is an overlay of the nominal values and real monthly values chained in October 2013 dollars. The red line illustrates the history of nominal median household, and the blue line shows the real (inflation-adjusted value). I've added callouts to show specific nominal and real monthly values for January 2000 start date and the peak and post-peak troughs. The next chart is my preferred way to show the nominal and real household income -- the percent change over time. Essentially I have taken the monthly series for both the nominal and real household incomes and divided them by their respective values at the beginning of 2000. The advantage to this approach is that it clearly quantifies the changes in both series and avoids a common distraction of using dollar amounts.
Personal Income decreased 0.1% in October, Spending increased 0.3% - ... the BEA released the Personal Income and Outlays report for October: Personal income decreased $10.8 billion, or 0.1 percent ... in October, according to the Bureau of Economic Analysis. Personal consumption expenditures (PCE) increased $32.7 billion, or 0.3 percent. Real PCE -- PCE adjusted to remove price changes -- increased 0.3 percent in October, compared with an increase of 0.1 percent in September. ... The price index for PCE decreased less than 0.1 percent in October, in contrast to an increase of 0.1 percent in September. The PCE price index, excluding food and energy, increased 0.1 percent in October, the same increase as in September. On inflation, the PCE price index decreased at a 0.4% annual rate in October, and core PCE prices increased at a 0.9% annual rate. This is very low and far below the Fed's 2% target. The following graph shows real Personal Consumption Expenditures (PCE) through October 2013 (2009 dollars). Note that the y-axis doesn't start at zero to better show the change.The dashed red lines are the quarterly levels for real PCE. This is just one month of Q4, but this suggests an increase in the PCE contribution to growth (compared to Q3). Also Q4 this year should be better than Q4 2012 (there was essentially no growth in Q4 2012).
Biggest Drop In Personal Income Since Feb 2010 Can't Stop Borrowers Spending, While Savings Rate Plunges -- US personal income fell 0.1% MoM - missing the +0.3% expectations by the most since September 2011 - but that didn't stop spending which modestly beat expectations at +0.3%. The drop in incomes is the largest (absent the 2012 year-end debacle) since February 2010. Given the disparity, it is hardly surprising that the savigs rate dropped to its lowest since June. So unsaving is the route to freedom once again as borrowing helps drive durable good spending up 0.77% As a result, and as expected, the personal savings rate plunged from 5.2% to 4.8%.
Consumer Borrowing Rose $18.2 Billion in October - Americans boosted their borrowing in October, led by another big increase in auto and student loans and the biggest rise in credit card debt in five months. The Federal Reserve says consumers increased their borrowing by $18.2 billion in October to a seasonally adjusted $3.08 trillion. That is a record level and follows a September increase of $16.3 billion. The increase was led by a $13.9 billion rise in borrowing for auto loans and student loans. But borrowing in the category that covers credit cards rose by $4.3 billion following a decline of $218 million in September. It was the biggest monthly credit card gain since May and could be a sign that consumer spending will increase in coming months. Credit card borrowing has lagged other types of debt.
Credit-Card Debt Hits Three-Year High - U.S. consumers pushed their credit-card debt to a three-year high in October, a possible sign of their willingness to boost spending into the holiday season. Associated Press Revolving credit, which largely reflects money owed on credit cards, advanced by a seasonally adjusted $4.33 billion in October, the Federal Reserve said Friday. The expansion pushed total revolving debt to $856.82 billion, the highest level since September 2010. The expansion marked a reversal from the prior four months when revolving balances either declined or held nearly flat. Consumers’ reluctance to add to credit-card balances was viewed by some economists as a sign of caution. The turnaround came in a month that brought a 16-day government shutdown, which weighed on consumer confidence and left hundreds of thousands of government workers without paychecks for weeks. (That may have been one factor in the increased use of credit cards. The federal workers received back pay after the shutdown.) Total consumer credit, excluding home loans, rose by $18.19 billion in October, the largest gain since May. Economists surveyed by Dow Jones Newswires had forecast a $14.8 billion advance. Earlier Friday, a Commerce Department report showed consumer spending rose 0.3% in October from a month earlier. Those gains were largely driven by purchases of big-ticket items, including cars. The Fed report showed non-revolving debt, mostly auto and education loans, increased by $13.85 billion, or a 7.5% annualized jump. Such debt has been trending steadily higher since 2010, reflecting a surge in government-backed student loans and purchases of new autos.
Car And Student Loans Account For 95% Of All Consumer Credit Issued In Past Year - Today's consumer credit report did not tell us anything we didn't already know: in October, total consumer credit rose by $18.2 billion, the most since May 2013, with the usual massive historical revisions. However, of this $18.2 billion, $13.9 billion was non-revolving credit, while revolving (credit card) debt rose by $4.3 billion. Which means revolving credit is still a woefully low $856.8 billion, or well below the $1.02 trillion when Lehman failed, even as credit issued mostly by Uncle Sam to fund car purchases and liberal educations, has exploded. Total monthly consumer credit broken down by revolving and non-revolving. Finally, and most troubling, in the past year over 95% of all consumer credit has been used to purchase rapidly amortizing cars and even more rapidly amortizing college educations.
Record Crowds over Weekend, But Spending Declined — Retailers got Americans into stores during the start to the holiday shopping season. Now, they’ll need to figure out how to get them to actually shop.Target, Macy’s and other retailers offered holiday discounts in early November and opened stores on Thanksgiving Day. It was an effort to attract shoppers before Black Friday, the day after Thanksgiving that traditionally kicks off the holiday shopping season. Those tactics drew bigger crowds during the four-day Thanksgiving weekend, but failed to motivate Americans to spend. “The economy spoke loud and clear over the past few days,” said Brian Sozzi, CEO and chief equities strategist at Belus Capital Advisors. “We are going to see an increase in markdowns.” A record 141 million people were expected to shop in stores and online over the four-day period that ended on Sunday, up from last year’s 137 million, according to the results of a survey of nearly 4,500 shoppers conducted for The National Retail Federation. But total spending was expected to fall for the first time ever since the trade group began tracking it in 2006, according to the survey that was released on Sunday afternoon. Over the four days, spending fell an estimated 2.9 percent to $57.4 billion.
Black Friday Weekend Spending Drop Pressures U.S. Stores - The first spending decline on a Black Friday weekend since 2009 reinforced projections for a lackluster holiday, increasing chances retailers will extend the deep discounts already hurting their profit margins. Purchases at stores and websites fell 2.9 percent to $57.4 billion during the four days beginning with the Nov. 28 Thanksgiving holiday, according to a survey commissioned by the National Retail Federation. While 141 million people shopped, about 2 million more than last year, the average consumer’s spending dropped 3.9 percent to $407.02, the survey showed.The survey results, if borne out at cash registers in American malls and on website checkout screens, herald retailers’ likely return to Black Friday-type discounts this week and suggest added stress for several chains. Wal-Mart Stores Inc. (WMT) and Target Corp. (TGT) already cut profit forecasts after tepid sales gains in back-to-school shopping. “Retailers didn’t get what they wanted from Black Friday and they will need to make it up in the next three weeks,”
Black Friday Weekend Spending Drop Pressures U.S. Stores - The first spending decline on a Black Friday weekend since 2009 reinforced projections for a lackluster holiday, increasing chances retailers will extend the deep discounts already hurting their profit margins. Purchases at stores and websites fell 2.9 percent to $57.4 billion during the four days beginning with the Nov. 28 Thanksgiving holiday, according to a survey commissioned by the National Retail Federation. While 141 million people shopped, about 2 million more than last year, the average consumer’s spending dropped 3.9 percent to $407.02, the survey showed. The survey results, if borne out at cash registers in American malls and on website checkout screens, herald retailers’ likely return to Black Friday-type discounts this week and suggest added stress for several chains. Wal-Mart Stores and Target Corp. already cut profit forecasts after tepid sales gains in back-to-school shopping. While the NRF reiterated its forecast yesterday that total sales in November and December would increase 3.9 percent, the trade group has said it would revise the forecast if necessary later this month. “Retailers didn’t get what they wanted from Black Friday and they will need to make it up in the next three weeks,” Poonam Goyal, an analyst for Bloomberg Industries, said in an interview. “There will be some panic sales.”
Opening Stores On Thanksgiving Failed To Boost Retailers' Sales - Retailers opened more stores than ever on Thanksgiving Day this year in an effort to boost holiday sales and give customers more time to take advantage of Black Friday deals. But the earlier openings largely detracted from Black Friday's sales, leading to a lackluster Thanksgiving weekend for retailers, according to Morgan Stanley analysts. "Stores that opened on Thanksgiving Day saw a surge in traffic on the holiday but appeared to slow early morning Black Friday," analysts wrote in a recent note. "We are not convinced strong Thursday sales made up for softer Friday traffic." According to ShopperTrak, Black Friday traffic declined 11.4% and sales decreased 13.2% compared to last year. Foot traffic for both Thanksgiving and Black Friday rose 2.8% to more than 1.07 billion store visits, while sales over both days rose 2.3% to $12.3 billion compared to last year. A few retailers, including Macy's and Kohl's, opened on Thanksgiving for the first time this year. Others, including Wal-Mart, Kmart and Target, opened earlier than ever on the holiday.
Black Friday Sales Tumble 13% On Thanksgiving Thursday Opening Scramble - If somehow the scramble to open stores earlier and earlier on Thanksgiving day, until such time as the very Thanksgiving dinner had to be interrupted early for the annual rush out to the (un)friendly neighborhood Thug-Mart (Toys'R'Us opened at a ridiculous 5pm on Thanksgiving day) and punching people in the face just to get that 42 inch, 2010-model Plasma TV for $99, was supposed to boost overall sales instead of merely pulling them forward (see cash for clunkers), it didn't work. According to ShopperTrak, total Black Friday traffic plunged 11% and total sales fell 13.2%, the second consecutive year of declines following last year's 1.8%. The reason, as largely expected, is that a substantial portion of Friday shopping was pulled back to Thursday: as ShopperTrak founder Bill Martin said, "if retailers continue to promote Thanksgiving as the start of the holiday buying season, he thinks the holiday will eventually surpass Black Friday in sales. "We're just taking Black Friday sales and spreading them across a larger number of days," Martin said." Combining Thursday and Friday retail sales represented a 2.8% increase in traffic and a 2.3% increase in actual sales compared to the same period last year, which however took place against the backdrop of the most aggressively promotional environment ever, leading to even greater drops in retailer margins.
Drop in holiday sales reflects US social crisis - - US retail sales over the Thanksgiving weekend dropped for the first time in seven years, reflecting the impact of falling wages and mass unemployment on American households.Sales fell 2.7 percent from a year ago, to $57.4 billion, according to preliminary figures from the National Association of Retailers. The drop in sales came even as a record number of people went shopping over the holiday weekend and stores opened earlier than ever on Thanksgiving Day.The decline in sales came despite a single-minded focus by the media on the official launch of the holiday shopping season. On Thanksgiving eve, all three US broadcast networks led their evening news programs with enthusiastic reports of major retailers opening earlier in the day and consumers preparing to spend record amounts. The relentless media coverage was a transparent attempt to encourage people to flood the malls and increase spending. The sales figures give the lie to the claim of the Obama administration and the media that the US is in the midst of a genuine economic recovery. They are an expression of the reality, covered up by the media, that the conditions of life for broad sections of the population have declined drastically and are continuing to deteriorate.
Strung-Out Consumers, Desperate Retailers, Crummy Sales --Wolf Richter - During this festive time of the year, the whole world is intensely focused on American consumers, watching their every move under a digital microscope to parse if the universe is going to live or die. Retailers and the media joined forces to create hoopla and excitement and frenzy and the perception of once-in-a-lifetime deals. Stores opened on Thanksgiving, stayed open late at night, and opened early in the morning. And consumers dove right into this extravaganza. Chaos, mayhem, melees, and stampedes ensued. Black Friday Death Count arrived at, I don’t know how, 7 deaths and 90 injuries from shootings – over parking space, obviously – stabbings, tramplings, collapses, fights, pepper sprayings, exhausted shoppers falling asleep at the wheel…. “Because only in America people trample each other for sales exactly one day after being thankful for what they already have,” is how a tweet explained that phenomenon. The sacrifices of shoppers who paid the ultimate price, or almost did, will not be wasted. They did their patriotic duty and obeyed orders and went out there and, despite immense difficulties and bad weather, fought it out in the trenches, often mano-a-mano with other shoppers, to further our national goal of borrowing money to buy more baubles, devices, and rags made in distant countries and then re-exporting the detritus for recycling. The world economy is based on this. American consumers merely execute the plan. Consumers will have to focus. They will have to buy more, as every year, but do so in 18% fewer days. It will be a short and intense shopping binge. They must not take prisoners. They must shop till they drop, and when they drop, others must trample over them without slowing down. What the world got instead was a fiasco. The sacrifices of those patriotic shoppers who paid the ultimate or nearly ultimate price to crank up the Chinese economy were, according to preliminary data, wasted. On Saturday, research firm ShopperTrak, which uses video surveillance in 60,000 retail stores, estimated that foot traffic on Thursday and Friday rose 2.8% from last year, to 1.07 billion store visits. It extrapolated that retail sales increased 2.3% to $12.3 billion. But Thanksgiving shopping is new, with many big retailers open for the first time. So Thursday’s excitement was followed by a Black Friday debacle, when foot traffic plunged 11.4% and sales 13.2%.
America’s Role as Consumer of Last Resort Goes Missing - Not long ago, before the financial crisis and the global recession it triggered, economists referred to Americans as the consumers of last resort. When the U.S. grew at a healthy pace, its citizens were buyers, fueling demand for the goods China and other nations produced. They kept the world economy humming. The smallest U.S. current-account deficit since 1999 shows the trend, and the discovery of new domestic sources of oil and gas reinforces it. Exploration and production are adding to growth, and the country is spending less on imported energy. Cheaper fuel and raw materials are boosting manufacturing as well, making the U.S. more of a competitor to emerging-markets nations and less a reliable consumer of their goods. “Global growth is slowly becoming more of a zero-sum game,” says Manoj Pradhan, emerging-markets economist at Morgan Stanley in London and a former International Monetary Fund official. “U.S. growth is not reverting to the pre-crisis model, which created lift for everyone else.” A 1 percentage point pickup in U.S. economic growth typically boosted expansion elsewhere by 0.4 percentage point, according to Gustavo Reis, senior international economist at Bank of America Merrill Lynch. Now, he calculates, the benefit to other countries is moving toward 0.3 percentage point, adding $48 billion to the rest of the world economy instead of $64 billion.
Restaurant Performance Index increases in October - From the National Restaurant Association: Restaurant Performance Index Hit a Four-Month High in October Fueled by stronger same-store sales and traffic and a more optimistic outlook among restaurant operators, the National Restaurant Association’s Restaurant Performance Index (RPI) rose to a four-month high in October. The RPI – a monthly composite index that tracks the health of and outlook for the U.S. restaurant industry – stood at 100.9 in October, up 0.7 percent from September and the strongest level since June. In addition, the RPI stood above 100 for the eighth consecutive month, which signifies expansion in the index of key industry indicators. “The RPI’s October gain was driven by broad-based gains in the index components, most notably solid improvements in same-store sales and customer traffic,” The Current Situation Index, which measures current trends in four industry indicators (same-store sales, traffic, labor and capital expenditures), stood at 100.9 in October – up 1.0 percent from a level of 99.9 in September and the highest level in five months. A majority of restaurant operators reported higher same-store sales in October, and the results were a solid improvement over September’s performance. ... Restaurant operators also reported stronger customer traffic levels in October.
Preliminary December Consumer Sentiment increased to 82.5 - The preliminary Reuters / University of Michigan consumer sentiment index for December was at 82.5, up from the November reading of 75.1. This was well above the consensus forecast of 75.5. Sentiment has generally been improving following the recession - with plenty of ups and downs - and one big spike down when Congress threatened to "not pay the bills" in 2011. The decline in October and early November was probably also due to the government shutdown and another threat to "not pay the bills" As usual sentiment rebounds fairly quickly following event driven declines, and I expect to see sentiment at post-recession highs very soon.
Consumer Confidence Surges; Beats By Most On Record - Of course, why not. University of Michigan Consumer Confidence jumped from 75.1 to a preliminary 82.5 beating expectations by the most on record. While we remain below the July 2013 highs, current conditions soared to the highest since May and the economic outlook spiked to the highest since August. This is the biggest absolute improvement in current conditions since December 2008.... and that ended well eh? The last time current conditions jumped this much... it didn't end well...
Weekly Gasoline Update: Down a Penny or Two - It’s time again for my weekly gasoline update based on data from the Energy Information Administration (EIA). Rounded to the penny, Regular dropped two cents and Premium one cent. Regular and Premium are down 51 cents and 45 cents, respectively, from their interim highs in late February. According to GasBuddy.com, no state is averaging above $4.00 per gallon, and only Hawaii is averaging over $3.90. Three states (Oklahoma, Missouri and Kansas) are averaging under $3.00, up from two states last Monday.
Most Autos on U.S. Lots Since ’05 Has Ford Leading Cuts - Automakers entered their year-end sales push last month with the most cars and trucks on U.S. dealer lots in eight years, a buildup that’s poised to test the industry’s newfound pricing discipline. Inventory climbed to almost 3.4 million cars and light trucks entering November, according to industry data provider WardsAuto. At 76 days’ supply, that was the highest for the month since 2005.Carmakers have boosted production to meet demand that has left the industry on pace for the best sales year since 2007. Swelling supply raises the stakes for sales in November after deliveries missed estimates in October and slipped in September for the first time in 27 months. If buyers don’t absorb enough inventory, more automakers, including Toyota Motor Corp. and Honda Motor Co., may need to follow Ford Motor Co.’s lead by trimming production to avoid margin-slicing discounts. “Inventory has been so tightly managed, and it has been because demand has been there and production hasn’t been able to keep up,” “If you change that scenario around, the question is, does the discipline that we’ve seen the industry operate with lately stick around?” U.S. car and light truck sales in November probably climbed 5.2 percent to 1.2 million, the average of seven estimates in a survey by Bloomberg News. The monthly results automakers report tomorrow will include deliveries tallied through today, helping boost the number of vehicles sold, because the month ended over the weekend.
Auto Makers' Channel Stuffing Highest Since 2005 - While the abundance of commercials for cars across all media this time of year is nothing new, the manufacturers (and even more so the dealers) are likely getting more desperate. As Bloomberg reports, inventory climbed to almost 3.4 million cars and light trucks entering November - at 76 days of supply, that was the highest for the month since 2005. This should come as no surprise as we previously noted GM's post-crisis highs in channel stuffing as hope remains high that the recent slowdown in sales does not continue. The question, of course, is, "will manufacturers be responsible and curb production to keep inventory in check, or are some going to resort to old, bad habits and churn it out and then throw incentives on them." We suspect we know the margin-crushing answer. Via Wards Auto, the levels harken back to early in last decade when steep price discounting was used to prop volumes,...Excluding 2008 when the industry was heading into recession, LV inventory totaled 3.397 million at the end of October, highest for the month since 3.803 million in 2004. October’s 76-day supply, was the highest for the month since 77 in 2005. By comparison, sales in 2013 mostly have run at highs dating to 2007, suggesting inventory is getting ahead of the curve.
U.S. Light Vehicle Sales increase to 16.4 million annual rate in November, Highest since Feb 2007 - Based on an estimate from AutoData, light vehicle sales were at a 16.41 million SAAR in November. That is up 7.6% from November 2012, and up 8.3% from the sales rate last month. Some of the sales in November might be a bounce back from the weakness in October related to the government shutdown. This was above the consensus forecast of 15.7 million SAAR (seasonally adjusted annual rate). This graph shows the historical light vehicle sales from the BEA (blue) and an estimate for November (red, light vehicle sales of 16.41 million SAAR from AutoData). This was the highest sales rate since February 2007, and was probably due to some bounce back buying following the government shutdown. The growth rate will probably slow in 2013 - compared to the previous three years - but this will still be another solid year for the auto industry. The second graph shows light vehicle sales since the BEA started keeping data in 1967.
Vital Signs: Vehicle Sales Rev Up - Car sales continue to defy the notion of tight-fisted consumers. Sales of light trucks and cars increased about 8% to an annual rate of 16.4 million last month, a pace not seen since 2007. Pent-up demand and accommodative financing are supporting demand. Sales so far in 2013 are averaging an annual rate of about 15.5 million, up from the roughly 14.5 million pace in 2012. Further gains probably won’t be as strong as November’s or may have to come at the expense of heavy discounting done by auto makers. The November consumer confidence survey from the Conference Board showed plans to buy a new car in the next six months declined last month.
GM Channel Stuffing Surges To Second Highest Ever - Confused why the various US manufacturing indices have been on a tear in the past few months? Perhaps the fact that GM dealer lots are so full of cars they just couldn't wait for even more deliveries has something to do with it. Which is also why in addition to reporting sales numbers for November that were largely in line with expectations, amounting to 212,060 (even if total Chevy Volts sold YTD of 20.7K were -0.6% less than in the same period in 2012), or 13.7% more than last year (estimated called for 13.% increase), of which a whopping 51,705 was in the form of "channel stuffed" units to be parked on dealer lots. In fact, as the chart below shows, in the past three months, GM channel stuffing has exploded and soared by 150K units (the most ever for a 3 month period) from 628.6K to 779.5K. This represents the second highest amount of channel stuffing and is lower only compared to the 788.2K units "stuffed" exactly one year ago.
Auto Lending Standards Plunge: New Car Loans Average 110% LTV; Used Car Loans 133% LTV with 55% Subprime! Repossessions Up Sharply -- U.S. car sales are up. It's easy to explain why: car buyers borrow more as standards loosen The average loan on a new car climbed to $26,719 in the third quarter, up by $756 from a year earlier, and the most in at least five years, according to data collected by Experian Plc. Despite borrowing so much more, average monthly payments on new car loans rose only $6 to $458. That is because banks and finance companies were willing to lend at lower rates and grant borrowers more time to repay. Lenders made 26.04 percent of their loans on new cars to buyers with subprime credit scores, up from 24.84 percent a year earlier. For loans on used cars, the portion to subprime borrowers rose to 54.95 percent from 54.43 percent. As the lenders made bigger loans, they also extended credit further beyond the value of the vehicles. The average loan-to-value on new cars rose to 110.6 percent, up by 1.17 percentage points. On used cars it rose to 133.2 percent, up by 2.18 percentage points. Auto lenders often provide loans that exceed the value of cars they are financing because borrowers want cash to pay sales taxes and fees. Extra-long loans are becoming more common. Some 19 percent of new car loans were made for more than six years, up from 16.4 percent a year earlier. The percentage of loans 30-days delinquent was down in the third quarter to 2.58 percent from 2.67 percent a year earlier, Experian said. However, the average loss on loans gone bad jumped to $7,770 in the third quarter from $7,026 a year earlier and repossessions increased sharply, particularly for subprime borrowers.
AAR: Rail Traffic increased in November - From the Association of American Railroads (AAR): AAR Reports Increased Intermodal, Carload Traffic for November The Association of American Railroads (AAR) today reported increased U.S. rail traffic for November 2013 over November 2012. Intermodal traffic in November totaled 1,007,549 containers and trailers, up 7.8 percent (73,004 units) compared with November 2012. The weekly average of 251,887 intermodal containers and trailers per week in November 2013 was the highest weekly average for any November in history. Carloads originated in November 2013 totaled 1,145,353, up 1.3 percent (14,931 carloads) compared with the same month last year.... Excluding coal, U.S. carloads were up 5.3 percent, or 34,988 carloads, in November 2013 compared with November 2012. Excluding coal and grain, U.S. carloads were up 3.3 percent, or 19,303 carloads, in November. “U.S. rail traffic in November 2013 saw a big decline in coal carloads that was more than offset by gains in carloads of grain and petroleum products,” This graph from the Rail Time Indicators report shows U.S. average weekly rail carloads (NSA). U.S. rail carloads were up 1.3% (14,931 carloads) in November 2013 over November 2012, totaling 1,145,353 carloads for the month. That’s the fourth consecutive year-over-year monthly increase, the first time that’s happened in two years. The weekly average in November 2013 was 286,338 carloads ... Among the 20 commodity categories tracked by the AAR each month, grain had by far the biggest carload gain in November, with grain carloads up 15,685 (20.6%) over the same month last year. ... Carloads of petroleum and petroleum products averaged 14,532 per week in November 2013, up 20.0% over November 2012. The second graph is for intermodal traffic (using intermodal or shipping containers):Intermodal traffic is on track for a record year in 2013.U.S. railroads originated an average of 251,887 intermodal containers and trailers per week in November 2013, easily the highest weekly average for any November in history and up 7.8% (73,004 intermodal units) over November 2012. That’s the biggest year-over-year percentage change in nine months.
Amazon Floats the Notion of Delivery Drones -- Jeff Bezos, as always, is thinking outside the box — way, way outside. Sunday night on “60 Minutes,” Mr. Bezos, the Amazon founder, floated the notion of using drones to deliver packages. He showed Charlie Rose a video of a tiny helicopter seizing a package from a warehouse and airlifting it to a house. The drone then took off again. Amazon has already named its future delivery system Prime Air. “I know this looks like science fiction,” Mr. Bezos said. “It’s not.” Still, even the hyper-optimistic Mr. Bezos cautioned that there were “years of additional work from this point.” He told the show the hardest challenge would be convincing the Federal Aviation Administration that this is a good idea. Well, the F.A.A. and everyone else. The commercial use of drones was legalized early in 2012, but there has been a good deal of outcry about drones possibly being used for surveillance. Some communities are banning local police from using drones. How receptive they would be to e-commerce
Trade Deficit decreased in October to $40.6 Billion - The Department of Commerce reported this morning: [T]otal October exports of $192.7 billion and imports of $233.3 billion resulted in a goods and services deficit of $40.6 billion, down from $43.0 billion in September, revised. October exports were $3.4 billion more than September exports of $189.3 billion. October imports were $1.0 billion more than September imports of $232.3 billion. The trade deficit was close to the consensus forecast of $40.2 billion. The first graph shows the monthly U.S. exports and imports in dollars through October 2013. Both imports and exports increased in October. Exports are 16% above the pre-recession peak and up 5% compared to October 2012; imports are just above the pre-recession peak, and up about 4% compared to October 2012. The second graph shows the U.S. trade deficit, with and without petroleum, through October. The blue line is the total deficit, and the black line is the petroleum deficit, and the red line is the trade deficit ex-petroleum products. Oil averaged $99.96 in October, down from $102.00 in September, and up slightly from $99.76 in October 2012. Prices will probably decline further in November. The petroleum deficit has generally been declining and is the major reason the overall deficit has declined since early 2012. The trade deficit with China decreased to $28.9 billion in October, down from $29.4 billion in October 2012. A majority of the trade deficit is related to China.
U.S. Trade Deficit Drops to $40.6 Billion in October — The U.S. trade deficit fell in October, helped by America’s energy boom that lifted overall exports to an all-time high. The trade gap narrowed to $40.6 billion in October, the Commerce Department said Wednesday. That’s 5.4 percent lower than the September gap of $43 billion, which was higher than initially estimated. Exports rose 1.8 percent to a record $192.7 billion, buoyed by a 6 percent gain in petroleum exports. Imports rose 0.4 percent to $233.3 billion, the highest since March 2012. Oil imports rose 1.5 percent. The U.S. is benefiting from an energy revival, which has lessened its dependence on foreign oil. U.S. petroleum exports are up 9.3 percent in the first 10 months of this year compared with the same period in 2012. At the same time, petroleum imports are down 11.1 percent. The drop in oil imports has been helped by lower global prices. A smaller trade deficit can boost economic growth. It typically shows that American companies are earning more from sales overseas while U.S. consumers are buying fewer products from their foreign competitors. Through October, the deficit is running 10.6 percent below last year’s pace. The deficit is smaller because exports have risen 2.7 percent while imports are basically running at the same pace as last year.
Trade Gap in U.S. Shrank in October on Record Exports - The trade deficit in the U.S. narrowed in October for the first time in four months as exports climbed to a record. The gap decreased 5.4 percent to $40.6 billion from a $43 billion shortfall in September that was larger than previously estimated, the Commerce Department reported today in Washington. The median forecast in a Bloomberg survey of 63 economists called for a $40 billion deficit. Sales of goods to China, Canada and Mexico were the highest ever, pointing to improving global demand that will benefit American manufacturers. In addition, an expanding U.S. economy is helping boost growth abroad as purchases of products from the European Union also climbed to a record in October even as fiscal gridlock prompted a partial federal shutdown. “We are starting to see some recoveries abroad, and in general, stronger global growth is going to lead to a pick-up in export growth over time,”
US Deficit Shrinks To $40.6 Billion As October Petroleum Exports Rise To New Record - Moments ago, the Census Bureau announced that in October the US trade gap narrowed to $40.6 billion (which still missed expectations of "only" a $40 billion deficit) from an upward revised September deficit of $43 billion, as oil sales boosted exports to record level. Total exports rose to a record $192.7 billion up $3.4 billion from last month's $189.3 billion, while imports rose just $1 billion to $233.3 billion resulting in a $40.6 billion gap. Among the report highlights: October exports of goods and services ($192.7 billion), exports of goods ($135.3 billion), and exports of services ($57.4 billion) were the highest on record; October imports of goods and services ($233.3 billion) were the highest since March 2012 ($234.3 billion); and perhaps the best news for shale fans: October petroleum exports ($12.5 billion) were the highest on record.
Markit PMI shows stronger expansion for manufacturing in November -- The Markit PMI is at 54.7 (above 50 is expansion). This was up from 51.8 in October, and up from the November flash reading of 54.3. From Markit: PMI jumps to highest reading since January The final Markit U.S. Manufacturing Purchasing Managers’ Index™ (PMI™) registered 54.7 in November, signalling the strongest improvement in manufacturing business conditions since January. The headline index was up sharply from 51.8 in October (a one-year low) and above the earlier flash estimate of 54.3... Firms linked the marked rise in output to a stronger increase in new work intakes. Notably, new order growth was strong and accelerated to one of the fastest rates for over one-and-a-half years. [New orders were at 56.2 up from 52.7]Employment in the U.S. manufacturing sector increased for the fifth consecutive month in November. However, the rate of job creation slowed to a modest pace that was weaker than the average for 2013 so far.“The U.S. manufacturing sector has shown surprising resilience in the face of the government shutdown. The average PMI reading so far in the fourth quarter is unchanged on the average seen in the third quarter and the survey is consistent with production growing at an annualised rate of approximately 2.5%."
U.S. ISM Manufacturing Index Rose to 57.3 in November - Manufacturing unexpectedly accelerated in November at the fastest pace in more than two years, pointing to a pickup in business spending that will help propel the U.S. economy in early 2014. The Institute for Supply Management’s index rose to 57.3, the highest since April 2011, from 56.4 a month earlier, the Tempe, Arizona-based group’s report showed today. Readings above 50 indicate growth. The median forecast in a Bloomberg survey of economists was 55.1. Measures of orders, production and employment strengthened.The ISM measure has increased six straight months, the longest such stretch since the first 10 months of 2009, when the economy was emerging from recession. The gauge has averaged 56.6 over the past three months, the strongest since May 2011. For manufacturers, it’s been “certainly a different second half from the first half -- it’s meaningfully higher and stronger,” Bradley Holcomb, chairman of the supply management group’s factory committee, said on a conference call with reporters.
ISM Manufacturing index increases in November to 57.3 - The ISM manufacturing index indicated faster expansion in November. The PMI was at 57.3% in November, up from 56.4% in October. The employment index was at 56.5%, up from 53.2%, and the new orders index was at 63.6%, up from 60.6% in October. From the Institute for Supply Management: November 2013 Manufacturing ISM Report On Business® Economic activity in the manufacturing sector expanded in November for the sixth consecutive month, and the overall economy grew for the 54th consecutive month, "The PMI™ registered 57.3 percent, an increase of 0.9 percentage point from October's reading of 56.4 percent. The PMI™ has increased progressively each month since June, with November's reading reflecting the highest PMI™ in 2013. The New Orders Index increased in November by 3 percentage points to 63.6 percent, and the Production Index increased by 2 percentage points to 62.8 percent. The Employment Index registered 56.5 percent, an increase of 3.3 percentage points compared to October's reading of 53.2 percent. This reflects the highest reading since April 2012 when the Employment Index registered 56.8 percent. With 15 of 18 manufacturing industries reporting growth in November relative to October, the positive growth trend characterizing the second half of 2013 is continuing." Here is a long term graph of the ISM manufacturing index. This was above expectations of 55.2% and suggests manufacturing expanded at a faster pace in November.
ISM Manufacturing Index Rose 0.9% in November - Today the Institute for Supply Management published its October Manufacturing Report. The latest headline PMI at 57.3 percent is an increase from 56.4 percent last month and is the best reading since April 2011, thirty-one months ago. Today's number beat the Investing.com forecast of 55.0. Here is the key analysis from the report: Manufacturing expanded in November as the PMI™ registered 57.3 percent, an increase of 0.9 percentage point when compared to October's reading of 56.4 percent. A reading above 50 percent indicates that the manufacturing economy is generally expanding; below 50 percent indicates that it is generally contracting. A PMI™ in excess of 42.2 percent, over a period of time, generally indicates an expansion of the overall economy. Therefore, the November PMI™ indicates growth for the 54th consecutive month in the overall economy, and indicates expansion in the manufacturing sector for the sixth consecutive month. Holcomb stated, "The past relationship between the PMI™ and the overall economy indicates that the average PMI™ for January through November (53.7 percent) corresponds to a 3.6 percent increase in real gross domestic product (GDP) on an annualized basis. In addition, if the PMI™ for November (57.3 percent) is annualized, it corresponds to a 4.7 percent increase in real GDP annually." Here is the table of PMI components.
ISM Manufacturing PMI Hits Another Year High, 57.3% for November 2013 -- The November ISM Manufacturing Survey shows PMI increased 0.9 percentage points to 57.3%. This is another year high. Overall manufacturing looks strong with 15 of the 18 industries reporting growth. The employment index is at a high not seen since December 2012. New orders and production both increased. The ISM manufacturing index is important due to the economic multiplier effect. While manufacturing is about an eighth of the economy, it is of scale and spawns all sorts of additional economic growth surrounding the sector. PMI is a composite index using five of the sub-indexes, new orders, production, employment, supplier deliveries and inventories, equally weighted. This is a direct survey of manufacturers and every month ISM publishes survey responders' comments. Overall survey respondent comments were positive, with many implying demand has picked up. A few railed on the government negatively impacting their business due to shutdown games and other inefficiencies. New orders increased 3.0 percentage points to 63.6%. This is really strong growth, the index is in the 60's, and increasing. Generally speaking, ISM sub-indexes in the 60's and staying there are truly positive signs for the manufacturing sector. The Census reported October durable goods new orders decreased by -2.0%, where factory orders, or all of manufacturing data, will be out later this month, but note the one month lag from the ISM survey. The ISM claims the Census and their survey are consistent with each other. Below is a graph of manufacturing new orders percent change from one year ago (blue, scale on right), against ISM's manufacturing new orders index (maroon, scale on left) to the last release data available for the Census manufacturing statistics. Here we do see a consistent pattern between the two and this is what the ISM says is the growth mark: A New Orders Index above 52.3 percent, over time, is generally consistent with an increase in the Census Bureau's series on manufacturing orders.
Highest Manufacturing ISM Since April 2011, Employment Surge To April 2012 Levels Puts Taper Back In Play - If last week's Durable Goods miss was great news for stocks, today's latest surge in the manufacturing ISM contrary to recent diffusion indices suggestion a whipser print of about 53, may be just what the Chairwoman did not order. With a December print of 57.3, up from last month's 56.4, and well above expectations of a modest decline to 55.1, this was the highest headline Manufacturing ISM print since April of 2011, just when QE2 was about to end and the economy was said to enter the virtuous cycle. Looking at the internals, the New Orders print of 63.6, up from 60.6 is what led the headline higher. This was the highest print since April 2011. What was worse for Taper watchers is that the Employment index jumped from 53.2 to 56.5, the highest since April 2012, and indicative that the November NFP number on Friday, perhaps the most critical data point ahead of the December FOMC announcement, may surprise well to the upside. In that case, the Fed may have no choice but to finally do what it threatened it would do in September and adjust the monthly flow lower by $10-$15 billion especially since as we will show momentarily, the Fed now owns one third of all marketable 10 year equivalents!
Vital Signs: U.S. Manufacturers Importing More Demand -- The Institute for Supply Management reported Monday that its factory purchasing managers’ index unexpectedly rose to 57.3 in November from 56.4 in October. The latest PMI is the highest since April 2011. What’s important for the outlook is the high level of demand flowing into U.S. manufacturers. The orders index rose to 63.6, the fourth consecutive month above 60. The index has not run a string of 4 above-60 readings since early 2011. A good part of the demand is coming from overseas. The export index rose to 59.5 last month from 57.0 in October. The November reading was matched the 59.5 high set in February 2012. The expanding foreign demand for U.S. manufactured goods suggests the global economy is doing better.
New Data Hint At Accelerating Economic Recovery -- While some economy watchers have been disappointed by lackluster retail sales over the long Black Friday weekend, two other data points released Monday suggest the economic recovery is picking up steam. The Institute for Supply Management’s index of manufacturing activity shot up to 57.3, its highest reading in more than two years and the sixth straight month of increases. Any reading above 50 suggests an expansion of manufacturing activity, and Monday morning’s number beat economists’ expectations of 55, suggesting that the manufacturing economy has more spring in its step than many had thought. Even more encouraging for the U.S. economy was a report from the Census Bureau showing that construction spending in October rose to an annualized rate of $908.4 billion, 0.8 percent above September’s level and 5.3 percent higher than October 2012. These increases suggest that the sharp spikes in housing prices over the past 18 months are finally leading home builders to ramp constructing the hiring that goes along with it. As the chart below shows, the economy still has a long way to go before construction spending once again achieves its pre-crisis highs, but the trend bodes well for the economy going forward.
ISM vs the hard data - Two recent notes emphasise that the impressive recent ISM manufacturing readings in the US are probably as much about expectations of future performance as about what has already happened. Aichi Amemiya of Nomura notes that historical divergences between the ISM and the “hard data” have coincided with climbs in the equity market, suggesting that improved sentiment about the future is the common variable in both. Amemiya shows this by constructing a competing “hard-data based ISM manufacturing index” of five components that roughly mirror the five comprising the ISM.From the note (our emphasis): Our hard-data based index tracked the official ISM manufacturing index well since 1995 with some exceptions (Figure 1). We see relatively large discrepancies between the two in 2003 2004, 2010-2011 and the most recent three months. There are several possible explanations for this divergence. For instance, the ISM does not weigh responses based on respondents’ company sizes. Thus, the ISM index could overstate the status of the economy when the output of small firms jumps substantially. It’s hard to single out a primary cause of the divergence. However, in our view, firms’ expectations for the future might have led to the recent higher readings of the ISM manufacturing index than hard data suggest. Among the data we tested, a variation in the S&P 500 stock price index is well correlated with the divergence between the ISM manufacturing index and the hard-data based index. Although the ISM manufacturing index is designed to capture actual activities of manufacturers, survey responses likely reflect their outlook for the future which also feeds into stock prices.
US Factory Orders Fall 0.9 Percent in October - U.S. factories received fewer orders in October, as aircraft demand fell and businesses cut back on computers. The decline suggests companies were hesitant to invest during the 16-day partial government shutdown. Factory orders dropped 0.9 percent in October, the Commerce Department said Thursday. That followed a 1.8 percent increase in September. A big reason for the decline in October was a steep drop in orders for aircraft. But core capital goods, which are a proxy for business investment, dropped 0.6 percent, the second straight decline. Economists watch this category closely because it excludes volatile orders for aircraft and defense equipment. Much of the decline in that category came from a drop in demand for computers. Demand picked up for primary metals, household appliances and oil and gas field machinery. All of these are long-lasting goods. The government estimated demand for these products last week and revised their figures in the factory orders report on Thursday. The report also includes orders for non-durable goods, such as food, chemicals and paper. Those orders fell 0.2 percent and have declined for the past three months. The government's data have conflicted with other reports that show manufacturing is on an upswing. The Institute for Supply Management, a trade group, said Monday that factory activity grew last month at the fastest pace in 2 ½ years. It was also the sixth straight month that the survey showed improvement.
U.S. Factory Orders Fall On Weak Aircraft Demand New orders for U.S. factory goods fell in October as demand for aircraft and capital goods weakened, suggesting some cooling in manufacturing. The Commerce Department said on Thursday orders for manufactured goods dropped 0.9 percent after rising 1.8 percent in September. Economists polled by Reuters had forecast orders falling 1.0 percent in October. Factory orders were weighed down by a 5.7 percent decline in transportation equipment as bookings for civilian and defense aircraft and parts tumbled. Orders excluding the volatile transportation category were flat. The factory orders report adds to data such as durable goods orders and industrial production that have suggested a cooling in manufacturing activity. But these so-called hard data on manufacturing are lagging sentiment surveys which have shown strength in factory activity in recent months. Many economists view the sentiment surveys, including the Institute for Supply Management's report, as signaling a pickup in manufacturing next year. The Commerce Department also said orders for durable goods, manufactured products expected to last three years or more, fell 1.6 percent instead of the 2.0 percent drop reported last week. Orders for non-defense capital goods excluding aircraft - seen as a measure of business confidence and spending plans - slipped 0.6 percent in October instead of the previously reported 1.2 percent fall.
New Orders Drop Most Since July Led By Plunge In Defense - Despite a modest beat at the headline Factory Orders (-0.9% vs -1.0% expectation), this is still the largest drop in orders since July following a revision upward for last month. Non-defense capital goods saw a 3.4% plunge (SA) - also the largest drop since July and defense capital goods orders tumbled 15.8% (from a 19.1% rise last month). The volatility and broken seasonality (due to the government shutdown) makes this series extremely noisy but overall, despite the modest beat, the trend is down notably.
Where Factory Apprenticeship Is Latest Model From Germany - Mr. Klisch did what he would have done back home in Germany: He set out to train them himself. Working with five local high schools and a career center in Aiken County, S.C. — and a curriculum nearly identical to the one at the company’s headquarters in Friedrichshafen — Tognum now has nine juniors and seniors enrolled in its apprenticeship program. Inspired by a partnership between schools and industry that is seen as a key to Germany’s advanced industrial capability and relatively low unemployment rate, projects like the one at Tognum are practically unheard-of in the United States. But experts in government and academia, along with those inside companies like BMW, which has its only American factory in South Carolina, say apprenticeships are a desperately needed option for younger workers who want decent-paying jobs, or increasingly, any job at all. And without more programs like the one at Tognum, they maintain, the nascent recovery in American manufacturing will run out of steam for lack of qualified workers.
That ‘Made in U.S.A.’ Premium - “If my only option as a young designer was to make my clothing overseas, I could not have started my business,” she said. Yet Ms. Lepore says that when she signed a deal with J. C. Penney for a low-cost clothing line for teenagers — clothing that sells for about one-tenth the price of her higher-end lines — Penney could not afford production in New York. Of the 150 or so items she now has featured on Penney’s website, none are made in this country. “That price point can’t be done here,” Ms. Lepore said of lower-end garments. As textile and apparel companies begin shifting more production to the United States, taking advantage of automation and other cost savings, a hard economic truth is emerging: Production of cheaper goods, for which consumers are looking for low prices, is by and large staying overseas, where manufacturers can find less expensive manufacturing. Even when consumers are confronted with the human costs of cheap production, like the factory collapse in Bangladesh that killed more than 1,000 garment workers, garment makers say, they show little inclination to pay more for clothes. Essentially, to buy American is to pay a premium — a reality that is acting as a drag on the nascent manufacturing resurgence in textiles and apparel, while also forcing United States companies to focus their American-made efforts on higher-quality goods that fetch higher prices.
CEO Optimism at Highest Point in Nearly Two Years - Top executives at major U.S. companies are more bullish about the U.S. economy than they’ve been in almost two years, a sign that growth could finally accelerate next year.A quarterly survey released Wednesday by the Business Roundtable, a Washington trade group representing CEOs, found that optimism among leaders of large companies is at its highest point since early 2012.The survey’s economic outlook index increased to 84.5 in the fourth quarter from 79.1 in the third. Figures above 50 indicate economic expansion. Businesses expect sales to rise and they plan to boost capital investments and hiring in the next six months, the group said.And if Washington lawmakers can strike a budget deal, executives said they could be even more willing to spend.“Washington sorting themselves out would give businesses a more predictable environment to invest the cash on their balance sheets and hire people.”
ISM Non-Manufacturing: November Saw Slower Growth Than Expected - Today the Institute for Supply Management published its latest Non-Manufacturing Report. The headline NMI Composite Index is at 53.9 percent, signaling slower growth than last month's 55.4 percent. Today's number came in below the Investing.com forecast of 55.0, which was the same consensus posted by Briefing.com. Here is the report summary:The NMI® registered 53.9 percent in November, 1.5 percentage points lower than October's reading of 55.4 percent. This indicates continued growth at a slower rate in the non-manufacturing sector. The Non-Manufacturing Business Activity Index decreased to 55.5 percent, which is 4.2 percentage points lower than the 59.7 percent reported in October, reflecting growth for the 52nd consecutive month, but at a slower rate. The New Orders Index decreased slightly by 0.4 percentage point to 56.4 percent, and the Employment Index decreased 3.7 percentage points to 52.5 percent, indicating growth in employment for the 16th consecutive month, but at a slower rate. The Prices Index decreased 3.9 percentage points to 52.2 percent, indicating prices increased at a slower rate in November when compared to October. According to the NMI®, 11 non-manufacturing industries reported growth in November. Like its much older kin, the ISM Manufacturing Series, I have been reluctant to focus on this collection of diffusion indexes. For one thing, there is relatively little history for ISM's Non-Manufacturing data, especially for the headline Composite Index, which dates from 2008. The chart below shows Non-Manufacturing Composite. We have only a single recession to gauge is behavior as a business cycle indicator.
ISM Services Miss (Lowest Since June) As Employment Plunges To 6-Month Lows Being the major part of the US 'economy' the disappointing performance of the ISM Services (soft data) - printing at 53.9 missing expectations of 55.0 - should be a concern. Under the covers, the data is a little more worrying than the stil-in-expansion mode headline data miss. New orders, business activity, and perhaps most worrisome, the employment sub-index all slid with the latter at its lowest since May. Combined with the manufacturing PMI, the composite ISM index fell from 55.1 to 54.3 in November. Despite the data, respondents remain optimistic...though tempered by its slow pace. This is the lowest November print for ISM Services since 2006.
U.S. Arts Sector Is Bigger Than Tourism Industry - America’s arts and cultural sector is a half-trillion-dollar machine that’s larger than major industries such as travel and tourism, a new official estimate found. The arts contributed $504 billion to U.S. economic output in 2011, or 3.2% of gross domestic product, the Commerce Department said Thursday. The report is the first time the government calculated the sector’s size. The field, which ranges from dance performance to movie production to cable-television distribution, employed nearly two million workers and exported $39.3 billion of goods and services in 2011, the most recent year reported. The numbers were eye-opening even for people immersed in the sector. “The data shows dimensions of the economy that we’ve not highlighted in the past,” said Sunil Iyengar, research and analysis director at the National Endowment for the Arts. The report helps with “understanding what innovation does for the economy and the role of the arts in that.” NEA worked with Commerce to develop the methodology for the new annual accounting. The figures show the arts and cultural sector, which spans several industries, is larger than the U.S. travel and tourism sector. The Commerce Department produced a similar annual report that showed travel and tourism accounted for 2.8% of GDP in 2011.
Are Another 1.3 Million Americans About To Drop Out Of Labor Force (And Send Unemployment Plunging)? -- With even the Fed somewhat challenging the credibility of the official unemployment rate - as labor force participation collapses structurally - the possibility that if Congress does not act by Dec 28th, a further 1.3 million people will lose emergency aid and may be deemed 'out' of the labor force merely exaggerates an already farcical situation. As JPM's Mike Feroli notes, the "official" unemployment rate may drop up to 0.8 percentage points, but it won't mean the economy is any better. Is this the 'excuse' the Fed needs to transition from QE to forward guidance (with the public seeing only a rapidly collapsing unemployment rate as evidence of their success) even as the data that they are so "dependent" on becomes worse than useless? As we warned in November, the only two charts that matter ahead of Friday's likely distorted nonfarm payrolls report. First, the labor force participation rate, which plunged from 63.2% to 62.8% - the lowest since 1978! But more importantly, the number of people not in the labor force exploded by nearly 1 million, or 932,000 to be exact, in just the month of October, to a record 91.5 million Americans! This was the third highest monthly increase in people falling out of the labor force in US history.
US Jobless Claims Plunge to 298k, as Layoffs Slow - The number of Americans applying for unemployment benefits tumbled 23,000 last week to 298,000, nearly a six-year low that shows companies are laying off fewer workers.The Labor Department said the less volatile four-week moving average declined 10,750 to 322,250. Last week’s unemployment benefit applications nearly matched a September figure that was distorted by late reporting from California. When excluding the September report, last week’s figures were the lowest since May 2007. Applications have now fallen in seven of the past eight weeks, a hopeful sign for job growth at the end of the year. Last week included the Thanksgiving holiday, which can present challenges for seasonal adjustments. But government officials say there were no special factors affecting the report. Weekly jobless claims are a proxy for layoffs. The steady decline should help boost job gains at a time when hiring has accelerated.
New Jobless Claims at 298K, Much Better Than Forecast - The Unemployment Insurance Weekly Claims Report was released this morning for last week. The 298,000 new claims number was a 23,000 decline from the previous week's 321,000 (an upward revision from 316,000). The less volatile and closely watched four-week moving average, which is usually a better indicator of the trend, declined by 10,750 to 322,250. Here is the opening of the official statement from the Department of Labor: In the week ending November 30, the advance figure for seasonally adjusted initial claims was 298,000, a decrease of 23,000 from the previous week's revised figure of 321,000. The 4-week moving average was 322,250, a decrease of 10,750 from the previous week's revised average of 333,000. The advance seasonally adjusted insured unemployment rate was 2.1 percent for the week ending November 23, unchanged from the prior week's unrevised rate. The advance number for seasonally adjusted insured unemployment during the week ending November 23 was 2,744,000, a decrease of 21,000 from the preceding week's revised level of 2,765,000. The 4-week moving average was 2,796,500, a decrease of 32,500 from the preceding week's revised average of 2,829,000. Today's seasonally adjusted number came in well below the Investing.com forecast of 325K. Here is a close look at the data over the past few years (with a callout for the past year), which gives a clearer sense of the overall trend in relation to the last recession and the trend in recent weeks.
ADP: Private Employment increased 215,000 in November - From ADP: Private sector employment increased by 215,000 jobs from October to November, according to the November ADP National Employment Report®. ... The report, which is derived from ADP’s actual payroll data, measures the change in total nonfarm private employment each month on a seasonally-adjusted basis...Mark Zandi, chief economist of Moody’s Analytics, said, "The job market remained surprisingly resilient to the government shutdown and brinkmanship over the treasury debt limit. Employers across all industries and company sizes looked through the political battle in Washington. If anything, job growth appears to be picking up.” This was above the consensus forecast for 185,000 private sector jobs added in the ADP report.
Survey: U.S. Companies Add 215K Jobs, Most in Year — A private survey shows U.S. businesses last month added the most jobs in a year, powered by big gains in manufacturing and construction.Payroll processor ADP said Wednesday that companies and small businesses added 215,000 jobs in November. And ADP said private employers added 184,000 jobs in October, much stronger than its initial estimate of 130,000. The ADP numbers cover only private businesses and often diverge from the government’s more comprehensive report. Last month, the Labor Department said private businesses added 212,000 jobs in October. The Labor Department will report on November job growth Friday. Still, the figure suggests that hiring remained healthy in November after picking up in the prior three months. Manufacturing and construction firms each added 18,000 jobs. That was the biggest gain for manufacturers since early this year. Mark Zandi, chief economist at Moody’s Analytics, said the figures show that employers shook off the partial government shutdown in October and kept hiring, despite a drop in consumer confidence. Moody’s helps compile the ADP data. “That’s very encouraging as we make our way into next year,” Zandi said.
ADP: Job Growth "Appears To Be Picking Up" -- The US economy added a net 215,000 private-sector jobs last month, according to this morning’s ADP Employment Report—the biggest monthly gain in a year. The upbeat news suggests that the better-than-expected October payrolls report from the Labor Department isn’t a fluke after all. "The job market remained surprisingly resilient to the government shutdown and brinkmanship over the Treasury debt limit,” says Mark Zandi, chief economist of Moody’s Analytics, which produced today’s update in collaboration with ADP. “Employers across all industries and company sizes looked through the political battle in Washington. If anything, job growth appears to be picking up,” he advises in a press release with today's update. The upward bias isn’t terribly surprising if you’ve been watching the numbers in the weekly updates for initial jobless claims lately. As I noted in last week’s report on new filings for unemployment benefits, there’s been a conspicuous slide in claims recently, which implies that the growth rate in payrolls will improve in the near term. Today’s ADP update falls short of a slam-dunk confirmation that the labor market has turned a corner for the better, but the data du jour certainly inspires a brighter outlook. In particular, note how the monthly comparisons for the ADP data in the chart above (red boxes) have been trending higher in recent months. Something similar can be found in the Labor Department’s establishment data for private payrolls (gray bars), albeit in milder form.
ADP Employment Report Shows 215,000 Private Sector Jobs for November 2013 - ADP's proprietary private payrolls jobs report gives us a monthly gain of 215,000 private sector jobs for November 2013. This is the strongest growth for the year. The goods sector had the best showing in job growth since early 2012 and the service sector showed the largest job gains for the year. This report does not include government, or public jobs. While the official BLS employment report and ADP most often do not match on the monthly private payrolls figure, this still is a very positive report for jobs. Delving deeper into ADP's report, jobs gains were in the service sector were 176,000 private sector jobs, unusually high for the private service sector. The goods sector gained 40,000 jobs. Professional/business services jobs grew by 38,000. Trade/transportation/utilities showed the strongest growth with 45,000 jobs. Financial activities payrolls gained 5,000 jobs. Construction work, part of the goods sector, gained 18,000 jobs. Manufacturing came alive with 18,000 jobs for the month. Graphed below are the month job gains or losses for the five areas ADP covers, manufacturing (maroon), construction (blue), professional & business (red), trade, transportation & utilities (green) and financial services (orange). Moody's Mark Zandi was shocked at the low impact the government shutdown and debt ceiling crisis had, although most of America is crying O'Rly? over political shenanigans at this point and it seems the economy might be improving in spite of our government. The job market remained surprisingly resilient to the government shutdown and brinkmanship over the treasury debt limit. Employers across all industries and company sizes looked through the political battle in Washington. If anything, job growth appears to be picking up.
ADP Soars To 215K Smashing Expectations, Prior Months Revised Higher Reviving Tapering Fears -- Judging by massive revision in the October print, from 130K to 184K, or nearly a 50% error, one would think that instead of actually tabulating specific private jobs as it by definition does, using the data entering the ADP private payrolls system, the ADP makes its estimate of jobs based on high inaccurate surveys just like the BLS. Either that, or it was desperate to catch up on the upside to the BLS' own propaganda numbers, which are just as "realistic." That said, the November ADP print soared from 130K to an upward revised 184K in October blowing through expectations of 170K and printing at a whopping 215K. And so the Taper dance is back on as everyone will now expected Friday's NFP to come in scorching hot, and force the Fed to cut its monthly flow by a whopping $10 billion to $75 billion. The punchline from the report: Mark Zandi, chief economist of Moody’s Analytics, said, "The job market remained surprisingly resilient to the government shutdown and brinkmanship over the treasury debt limit. Employers across all industries and company sizes looked through the political battle in Washington. If anything, job growth appears to be picking up.” But... but... all the fearmongering. This is what the current and revised data looked like:
U.S. Payroll to Population Rate Steady at 43.7% in November: -- The U.S. Payroll to Population employment rate (P2P), as measured by Gallup, was steady at 43.7% in November. This rate is the same as it was in November 2012. Gallup's P2P metric estimates the percentage of the U.S. adult population aged 18 and older that is employed full time by an employer for at least 30 hours per week. P2P is not seasonally adjusted. However, because of seasonal fluctuations, year-over-year comparisons are often helpful in evaluating whether monthly changes are attributable to seasonal hiring patterns or true growth (or deterioration) in the percentage of people working full time for an employer. P2P for November 2013 is identical to P2P measured in the same month last year (43.7%), but is 0.4 percentage points lower than the 44.1% P2P from November 2010 and 2011. These results are based on Gallup Daily tracking interviews with almost 30,000 Americans, conducted Nov. 1-30 by landline and cellphone. Gallup does not count adults who are self-employed, working part time, unemployed, or out of the workforce as payroll-employed in the P2P metric. Gallup's unadjusted unemployment rate for the U.S. workforce was 8.2% in November, up from 7.3% in October. Unemployment fluctuates seasonally, as P2P does, and year-over-year change is often the most informative comparison. Unemployment was lower in November 2012 (7.8%) but also rose nearly a full point from 7.0% in October of that year. Gallup's seasonally adjusted U.S. unemployment rate for November is 8.6%, up from 7.7% in October. The rate is also higher than the 8.3% for November of last year. Gallup calculates this rate by applying the adjustment factor the government used for the same month in the previous year. Last year, the government adjusted November's rate upward by 0.4 points.
New Jobs at 203K Tops Forecasts, And Unemployment Rate Falls to 7.0% - Here is the lead paragraph from the Employment Situation Summary released this morning by the Bureau of Labor Statistics: The unemployment rate declined from 7.3 percent to 7.0 percent in November, and total nonfarm payroll employment rose by 203,000, the U.S. Bureau of Labor Statistics reported today. Employment increased in transportation and warehousing, health care, and manufacturing. Today's report of 203K nonfarm number was higher than the Investing.com forecast, which was for 180K new nonfarm jobs. And the substantial drop in the unemployment rate from 7.3% to 7.0% was better than the Investing.com expectation of a decline to 7.2%. As for nonfarm payroll revisions, the number for September was revised from 163K to 175K, and October was revised from 204K to 200K. This gives us a combined total of 8K higher than previously reported. The unemployment peak for the current cycle was 10.0% in October 2009. The chart here shows the pattern of unemployment, recessions and both the nominal and real (inflation-adjusted) price of the S&P Composite since 1948. Unemployment is usually a lagging indicator that moves inversely with equity prices (top chart) The second chart shows the unemployment rate for the civilian population unemployed 27 weeks and over. This rate has fallen significantly since its 4.3% all-time peak in April 2010. The latest number is 2.6% -- matching the previous peak in 1983. This measure gives an alternative perspective on the relative severity of economic conditions. The next chart is an overlay of the unemployment rate and the employment-population ratio. This is the ratio of the number of employed people to the total civilian population age 16 and over. The inverse correlation between the two series is obvious. The latest ratio is 58.6%, which is in the bottom half of the consistently narrow range (58.2% to 59.3%) since the end of the last recession.For a confirming view of the secular change the US is experiencing on the employment front, the next chart illustrates the labor force participation rate. To one decimal places we're at 63.0%, fractionally off the 62.8% interim low set last month. Today's level was first seen in March 1978.
November Employment Report: 203,000 Jobs, 7.0% Unemployment Rate - From the BLS: The unemployment rate declined from 7.3 percent to 7.0 percent in November, and total nonfarm payroll employment rose by 203,000, the U.S. Bureau of Labor Statistics reported today. .....Both the number of unemployed persons, at 10.9 million, and the unemployment rate, at 7.0 percent, declined in November. Among the unemployed, the number who reported being on temporary layoff decreased by 377,000. This largely reflects the return to work of federal employees who were furloughed in October due to the partial government shutdown...The civilian labor force rose by 455,000 in November, after declining by 720,000 in October. The labor force participation rate changed little (63.0 percent) in November. Total employment as measured by the household survey increased by 818,000 over the month, following a decline of 735,000 in the prior month. This over-the-month increase in employment partly reflected the return to work of furloughed federal government employees. The employment-population ratio increased by 0.3 percentage point to 58.6 percent in November, reversing a decline of the same size in the prior month. ... The change in total nonfarm payroll employment for September was revised from +163,000 to +175,000, and the change for October was revised from +204,000 to +200,000. With these revisions, employment gains in September and October combined were 8,000 higher than previously reported. The headline number was above expectations of 180,000 payroll jobs added. This graph shows the job losses from the start of the employment recession, in percentage terms, compared to previous post WWII recessions. The second graph is ex-Census meaning the impact of the decennial Census temporary hires and layoffs is removed to show the underlying payroll changes. The third shows the unemployment rate. The unemployment rate decreased in November to 7.0% from 7.3% in October. This increase in the unemployment rate in October was related to the government shutdown - and was reversed in the November employment report. The fourth graph shows the employment population ratio and the participation rate. The Labor Force Participation Rate increased in November to 63.0% from 62.8% in October (October decline was partially related to shutdown). This is the percentage of the working age population in the labor force.
November Jobs Report–First Impressions - Payrolls rose 203,000 last month and the unemployment rate fell from 7.3% to 7%, the lowest it has been since late 2008, according to this morning’s jobs report from the Bureau of Labor Statistics. It looks like a solid report, with job gains in most industries, a falloff in involuntary part-timers, a tick up in both the labor force (in part due to government workers returning from the October shutdown) and weekly hours, suggesting strengthening labor demand. In recent months, the decline in unemployment has often actually been a bad sign as it occurred because job seekers gave up hope and left the job market. In November, the 0.3 point decline in the jobless rate was instead driven by people getting jobs, as the labor force increased, a point I return to below. However, part of this, as noted, was a bounce back from last month’s report when the October government shutdown was in play. In that regard, November’s decline in unemployment is a good sign, but with the caveat that it reflects a significant number of people just coming back off of a short furlough. As the BLS commissioner noted, “Among the unemployed, the number of persons on temporary layoff declined by 377,000 in November, largely reflecting the return of federal workers who were furloughed in October due to the partial government shutdown.” Averaging over the past few months helps to separate the underlying signal re net job creation from the statistical noise inherent in monthly surveys (there’s noise in all survey data but in “high frequency data”—releases that come out over short time intervals—there’s more). Over the past three months, payroll gains have averaged 193,000 per month. Averaging over the past 12 months, the average is about the same: 191,000 per month. That is a decent/moderate trend, fast enough to consistently, albeit slowly, drive down the jobless rate.
November jobs report: a solid positive month (but still not good enough) -- In November 203,000 jobs were added to the US economy. The unemployment rate dropped sharply, down 0.3% to 7.0% -- and for once it included an increase in the labor forces as well as a decline in the number of people without jobs. There is little in this report for Doomers to latch onto - although the percent of the working age population that is employed remains near its post-recession low. First, let's look at the more leading numbers in the report which tell us about where the economy is likely to be a few months from now. These were almost all positive.
- the average manufacturing workweek rose 0.1 hour from 40.9 hours to 41.0 hours. This is one of the 10 components of the LEI and will affect that number positively.
- construction jobs increased by 17,000.
- manufacturing jobs rose by 27,000.
- temporary jobs - a leading indicator for jobs overall - increased by 16,400.
- the number of people unemployed for 5 weeks or less - a better leading indicator than initial jobless claims - fell by 300,000 reflecting the return to work of those laid off during the government shutdown and is near its post-recession low.
- The average workweek for all nonsupervisory workers increased by 0.1 hour from 33.6 hours to 33.7 hours.
- Overtime hours increased from 3.4 hours to 3.5 hours.
- the index of aggregate hours worked in the economy surged by 0.5 from 98.8 to 99.3. This is also a post-recession record.
- The broad U-6 unemployment rate, that includes discouraged workers declined from 13.8% to 13.0%, also a post-recession low.
- The workforce rose by 561,000. Part time jobs fell by -331,000.
Employment Report: Decent Report, Solid Seasonal Retail Hiring - A few key points:
• Most of the employment impact from the government shutdown was reversed in the November report.
• Earlier I noted four items that the Fed would probably be looking at to taper in December. Here were the two related to employment:
1) "If the unemployment rate declines back to 7.2% or so in November (the September rate), then the FOMC might taper." Since the unemployment rate declined to 7.0%, this was met.
2) "If the year-over-year change in employment is still around 2.2 million for November, the FOMC might taper." Employment was up 2.293 million year-over-year in November.
The other two items for the Fed are inflation (core PCE is only up 1.1% year-over-year), and a budget agreement by next week (seems likely). At this point, inflation is the question mark for the Fed.
• Seasonal retail hiring remained solid. See the first graph below - this is a good sign for the holiday season ("Watch what they do, not what they say")
Retailers hired 471 thousand workers (NSA) net in November. This was just below the level in 2012, and suggests that retailers expect decent holiday sales. Note: this is NSA (Not Seasonally Adjusted). Note: There is a decent correlation between seasonal retail hiring and holiday retail sales. Since the participation rate declined recently due to cyclical (recession) and demographic (aging population) reasons, an important graph is the employment-population ratio for the key working age group: 25 to 54 years old. In the earlier period the employment-population ratio for this group was trending up as women joined the labor force. The number of persons employed part time for economic reasons (sometimes referred to as involuntary part-time workers) fell by 331,000 to 7.7 million in November. These individuals were working part time because their hours had been cut back or because they were unable to find a full-time job. . These workers are included in the alternate measure of labor underutilization (U-6) that decreased to 13.2% in November from 13.8% in October. Unemployed over 26 Weeks This graph shows the number of workers unemployed for 27 weeks or more. According to the BLS, there are 4.066 million workers who have been unemployed for more than 26 weeks and still want a job. This was up slightly from 4.063 million in October. This is generally trending down, but is still very high. Long term unemployment remains one of the key labor problems in the US.
Highlights from the November Jobs Report - The November jobs report showed steady employment growth as 2013 draws to a close. U.S. payrolls rose by 203,000 last month and the unemployment rate dropped to 7%, the lowest level in five years. Here are highlights:
- Revisions: Employment gains for October and September were revised upward slightly by a total of 8,000. Employers added 200,000 jobs in October, down from an initially reported 204,000. But September’s gain was revised up to 175,000 from 163,000.
- Jobless Rate: The November unemployment rate decreased to 7.0% from 7.3%, below economists’ expectation of 7.2%, because more people joined the workforce and fewer people lost their jobs. The rate had risen slightly in October because government workers were furloughed during the 16-day partial government shutdown.
- Total payrolls: The economy has added more than 7.5 million jobs since employment bottomed out in February 2010 after the recession ended. Total payrolls last month hit a seasonally adjusted 136.8 million. Payrolls are still short of their January 2008 peak of 138.1 million workers.
- Winners: Employment rose in the sectors of transportation and warehousing (31,000 new jobs), health care (28,000) and manufacturing (27,000).
- Losers: Federal government employment continued to shrink, shedding 7,000 jobs in November. Over the past 12 months, the sector has decreased by 92,000 jobs.
- Earnings and Work Week: The average work week for private employees rose to 34.5 hours, in line with hours a year earlier. Meanwhile, the average hourly earnings for private employees edged up by four cents to $24.15. Higher incomes can translate into stronger consumer spending in the months ahead.
- Participation: The civilian labor force participation rate was stronger at 63% in November from a month ago. But it is down from 63.6% in October 2012.
November payrolls: +203,000, and unemployment rate at 7.0% - A good report, not much in the way of revisions, and a healthy fall in the unemployment rate accompanied by a climb in the labour force participation rate. Here are the main bits: The unemployment rate declined from 7.3 percent to 7.0 percent in November, and total nonfarm payroll employment rose by 203,000, the U.S. Bureau of Labor Statistics reported today. Employment increased in transportation and warehousing, health care, and manufacturing.Both the number of unemployed persons, at 10.9 million, and the unemployment rate, at 7.0 percent, declined in November. Among the unemployed, the number who reported being on temporary layoff decreased by 377,000. This largely reflects the return to work of federal employees who were furloughed in October due to the partial government shutdown. …Total nonfarm payroll employment increased by 203,000 in November. Job growth averaged 195,000 per month over the prior 12 months. In November, job gains occurred in transportation and warehousing, health care, and manufacturing.
November Payrolls Rise By 203K, Higher Than Expected; Unemployment Rate Drops To 7.0% - Last month, the expected NFP print was 120K, instead we got 204K. Today, the expectations was 185K, while the print, was almost an identical 203K, even as last month's was revised modestly lower to 200K. The unemployment rate dropped from 7.3%, which was also below the 7.2% expected, to only 7.0%. The unemployment rate was derived from a drop in the number of unemployed from 11.3K to 10.9K, while the labor force rose from 153.8K to 155.3K, which also led to a modest bounce in the labor force participation rate which rose from a 35 year low of 62.8% to 63.0%.
- From the Establishment survey:Total nonfarm payroll employment increased by 203,000 in November. Job growth averaged 195,000 per month over the prior 12 months. In November, job gains occurred in transportation and warehousing, health care, and manufacturing. (See table B-1.)
- From the Household Survey: Both the number of unemployed persons, at 10.9 million, and the unemployment rate, at 7.0 percent, declined in November. Among the unemployed, the number who reported being on temporary layoff decreased by 377,000. This largely reflects the return to work of federal employees who were furloughed in October due to the partial government shutdown. (See tables A-1 and A-11.)
Unemployment Rate Drops Dramatically to 7.0% - Welcome to the wild weird current population survey unemployment report where dramatic monthly swings cause paranoia and doubt. We shed light on these woolly figures and this month there is much to flash that light on. First, the unemployment rate dropped 0.3 percentage points to 7.0%. This is the lowest unemployment rate since November 2008. Yet, this month's unemployment rate drop might be artificial. At first glance, the labor participation rate increased by 0.2 percentage points, yet as a trend, the labor participation rate is way too low. There were 818,000 more people reported as employed in November, a huge jump, but some of the reasons for these wild swings are the Federal workers returning from the government shutdown. This article overviews and graphs the statistics from the Employment report Household Survey and while November is yet another funky month, contained within this report might be finally some positive signs labor market conditions are improving. First, part of the reason the unemployed declined is due to 377,000 Federal workers no longer counted as unemployed due to being temporarily laid off. Second, the Household survey changed the reference week from the one which includes the 12th of the month, to the week which includes the 5th of the month. While this seems trivial to move a survey up a week, it could very well be why we see more wild swings in the data. So our usual warning of don't rely on monthly changes and look at the trend applies even more so for this month.Below is a graph of the household survey employed and we can see this is the largest monthly change in employed persons since March 2009, ignoring benchmarks added to the month of January. That said, if we take October and November together we get a 93,000 gain in employed persons, which is probably the truth of the real gain in employed as the shutdown clearly threw a monkey wrench into the monthly figures. The cause of the massive increase is not new entrants to the ranks of the employed as those figures dropped by -58,000 for the month.
The Real US Unemployment Rate: 11.5% - While it may appear at first glance that the first chart below shows just one data series, what we have shown are two data sets: one presents, on an inverted axis, the Civilian Employment-to-Population rate, which unlike the unemployment rate as a fraction of the labor force (most recently printing at just 7%), has barely budged since the Lehman collapse. The other data set shows what an implied unemployment rate as calculated by Zero Hedge would be assuming a long-term average of 65.8% worker labor participation rate. As we reported earlier, according to the BLS this number most recently was 63.0%: a 20 bps rebound from the 35 year low posted in October, but still woefully wrong. The chart shows much more accurately what the real unemployment rate would be when looking at the overall noninstitutional population instead of the ever rising amount of Americans who for one reason or another are not in the labor force. On the next chart, we then proceed to juxtapose the implied unemployment rate with the officially reported BLS data. In short: applying a realistic labor force participation rate to the unemployment rate series, shows that the real US unemployment rate is now 11.5%, a 4.5% difference from the reported number, and the second highest ever, only better compared to October's 4.7%.
Jobs Added By Industry: Education, Transportation And Retail Winners; Information And Finance Losers - Curious where the November jobs gains and losses were, broken down by industry? The chart below should explain it all:
- Education and Health +40K, after gaining 30K in October; Job gains occurred in home healthcare services (+12,000) and offices of physicians (+7,000), while nursing care facilities lost jobs (-4,000)
- Transportation: +31K as logistics needs of the holiday season ramped up hiring
- Manufacturing: +27K in November after +16K in October; food manufacturing was +8K, while (channel stuffing of) motor vehicles and parts added anoterh 7K
- Retail trade, that old standby, added another 22K, following 46K additions in October for a total of 68K in the past two months.
- Within the industry, job growth occurred in general merchandise stores (+14,000); in sporting goods, hobby, book, and music stores (+12,000); and in automobile dealers (+7,000). Over the prior 12 months, job growth in retail trade averaged 31,000 per month.
- Financial Activities, or the highest paying jobs, lost 3K after gaining 7K the prior month
- Information, the second highest paying jobs, also lost 1K, after gaining 4K in the prior month
Payrolls & Personal Spending Rise As Income Dips - The labor market expanded again last month: private payrolls increased 196,000 in November, moderately more than expected, based on The Capital Spectator’s average econometric projection. Even so, last month’s gain fell short of October’s revised 214,000 rise, although the pace of growth in November still suggests that the economy is creating jobs at a slightly faster rate these days compared with the lesser gains in recent history. Meanwhile, today’s update on personal income and spending brings mixed news. Personal consumption expenditures advanced 0.3% in October—in line with expectations. Disposable personal income, however, retreated 0.2%--the first monthly instance of red ink since January. Let’s take a closer look at the numbers, starting with payrolls. The trend on this front continues to look encouraging, at least by the standard of the last several months. The absolute level of gains for private payrolls is in the upper range we’ve seen so far this year (although we’ve yet to see anything close to February’s extraordinary 319,000 surge). More importantly, the year-over-year growth rate continues to roll along at just over 2%, echoing the numbers for most of 2013. The steady increase by this yardstick suggests that the labor market's moderate expansion will roll on. The analysis is a bit more complicated for spending and income. First, the good news. The amount of personal consumption expenditures (PCE) ticked up in October, rising 0.3% over the previous month—a bit faster than September’s pace. Disposable person income (DPI), however, declined in October—the first time we’ve seen red ink here since January. But monthly numbers are noisy and so it’s best to refrain from reading too much into the short-run comparisons. Unfortunately, there’s a more troubling trend to consider.
Beneath the Headline Numbers, Not a Good Jobs Report -- Some of the skew in last month's job report related to the government shutdown was taken back today, as expected. The labor force stats and participation rate were exceptions, and details reveal much weakness.
- Last month employment fell by 735,000 due to the shutdown, this month it rose by 818,000.
- Averaging the two months, household survey employment only rose by 83,000 (a mere 43,500 per month)
- Last month, the change in those not in the labor force was +932,000. This month, the change was -268,000.
- Last month the labor force declined by 720,000. This month it only rose by 455,000.
- Averaging the two months, the labor force fell by 265,000. This explains the drop in the unemployment rate despite anemic employment growth on average.
- Last month the participation rate fell 0.4 percentage points to a new low, this month, only 0.2 percentage points were taken back.
- Payrolls +203,000 - Establishment Survey
- US Employment +818,000 - Household Survey
- US Unemployment -365,000 - Household Survey
- Involuntary Part-Time Work -331,000 - Household Survey
- Voluntary Part-Time Work +90,000 - Household Survey
- Baseline Unemployment Rate -0.3 to 7.0% - Household Survey
- U-6 unemployment -0.5 to 13.2% - Household Survey
- Civilian Labor Force +455,000 - Household Survey
- Not in Labor Force -268,000 - Household Survey
- Participation Rate +0.2 at 63.0 - Household Survey
Enormous Discrepancy Between Jobs and Employment - Now that employment distortions related to the government shutdown in October are behind us, let's take a detailed look at the recent and growing discrepancy between jobs as reported on the establishment survey and employment as reported on the household survey. Before diving into the details, it is important to understand limits on data, and how the BLS measures jobs in the establishment survey vs. employment in the household survey. Establishment Survey: If you work one hour that counts as a job. There is no difference between one hour and 50 hours. If you work multiple jobs you are counted twice. The BLS does not weed out duplicate social security numbers. Household Survey: If you work one hour or 80 you are employed. If you work a total of 35 hours you are considered a full time employee. If you work 25 hours at one job and 10 hours at another, you are a fulltime employee.Over time, and with revisions, the two data series move in sync (as they should in normal conditions): However, there has been a serious discrepancy between the two data series in the last month that is not apparent in the above chart. A few tables will show what I mean.
The BLS Report Covering November 2013: Effects of the Government Shutdown Fade, Part Time Work Increases - In the household survey on employment, seasonally unadjusted, the October government shutdown took out expected October highs and created losses in numerous categories. In November, these were largely reversed. The biggest ongoing hit is to the labor force which is still 490,000 smaller than it was in September. And while employment increased, unadjusted, 631,000, most of this was in part time jobs (554,000). Unemployment fell 504,000, reflecting that most of the net change in employment came from the unemployed finding work, and not from an influx of those defined as outside the labor force. The end of the government shutdown was also reflected in the decline of the official (adjusted) unemployment rate from 7.3% to 7.0%. My alternate calculation of this returned to its pre-shut down level of 12.6%. In the business survey in November, seasonally adjusted (trendline) 203,000 jobs were added to the economy. Taken together with October, 403,000 jobs were added. This is essentially unchanged from the 407,000 added during this period last year. And this November’s number is 44,000 smaller than last November’s 247,000. Trendline, job creation for the first 11 months of 2013 is running 9,000 a month higher than in 2012 (188,000 vs. 179,000). The general rule of thumb is that only job creation substantially over 200,000/month will significantly affect the nation’s unemployment crisis. Unadjusted, total nonfarm jobs increased 421,000, and the private sector grew by 309,000. Most of these jobs continue to be crap. One bright note was hours and earnings were both up slightly. Earnings for all workers are running ahead about 2.3% year over year.
Some Caveats in Huge Drop in Unemployment Rate - Much of that is due to people who were counted as unemployed last month because of the government shutdown, but the large number suggests that broader hiring was going on. The number of people in the labor force — those that are working or looking for work — also rose in November. That’s good news. A broader unemployment rate, known as the “U-6″ for its data classification by the Labor Department, also posted a huge drop last month. That rate includes everyone in the official rate plus “marginally attached workers” — those who are neither working nor looking for work, but say they want a job and have looked for work recently; and people who are employed part-time for economic reasons, meaning they want full-time work but took a part-time schedule instead because that’s all they could find.The drop in the U-6 rate was also influenced by the drop in the overall number of unemployed, but also driven by a relatively big drop in the number of people working part time, but who want full-time work. The ranks of part-time for economic reasons fell to 7.7 million, still worryingly high but lower than at any time since 2008. But here’s the bad news: the increase in the number of people in the labor force didn’t make up all the ground lost by the huge drop in October. Even though 455,000 people were added to those working or looking for a job, the labor force is still 265,000 people short of where it was in September. The participation rate, the labor force as a percent of the whole population, rose to 63% in November but is still down from 63.2% in October. That rate remains at its lowest level since 1978 when large numbers of women were entering the work force for the first time.
Short-Term Gains, Long-Term Trouble - Most of the job numbers, even when they look good, are still not even close to what they were before the Great Recession, which officially began in December 2007. The unemployment rate fell to 7 percent in November, the Labor Department says. It was 5 percent in December 2007. The total number of jobs rose 203,000 to 136,765,000. That is still 1,271,000 less than the peak, reached in January 2008. The number of unemployed workers fell below 11 million for the first time since late 2008. It was 7.6 million at the end of 2007.But one indicator is back to pre-recession levels. The number of people who have been out of work for less than five weeks fell to 2,461,000. That is the lowest figure since April 2007. As I noted in my Off the Charts column last week, it is long-term unemployment that is the biggest problem now. The number of people out of work for more than six months is 4,066,000. That is down 2.6 million from the peak, but before the Great Recession the figure had never been as high as three million. Through all the recessions of the post-World War II period, the share of unemployed who had been jobless for at least six months exceeded 25 percent once, in 1983, prior to this cycle. Now it is 37 percent, down from a peak of 45 percent.
Wanted: More Unemployment - It is bad news for the American economy that the unemployment rate fell in November. Yes, you read that correctly: We need higher unemployment. As I’ve noted repeatedly in recent months, the unemployment rate is an odd measuring stick for the health of the labor market. It basically tells us how many people are looking for work. It falls when people get jobs, which is good. But it also falls when people stop looking for work, which of course is not so good. In recent years a lot of people have given up on looking for work. As a result, the unemployment rate has gradually declined from 10 percent to 7 percent even as the share of American adults who are working has remained basically steady. It’s easier to see the trends if you skip over the government’s wacky data for the month of October, and compare November with September. The number of people that the government counted as unemployed fell by 348,000, driving the unemployment rate from 7.2 percent to 7.0 percent. But the number of people with jobs only increased by 83,000. In other words, for every person who found a job between September and November, three other people stopped looking. Explanations for this problem fall into two categories, both depressing.The first school holds that the economy is broken: We have entered an era of “secular stagnation.” We must resign ourselves to a smaller work force.The second school holds that the government is broken. There are steps we could take to grow faster but, for the most part, we are doing the opposite.
Vital Signs: Signs Point to Solid November Pay Gain - Growth in wages and salaries has been slowing. In October, the earnings category, which makes up the bulk of total personal income, rose a mere 0.1%. But Friday’s employment report indicates paychecks grew at a stronger pace last month.The employment report includes a trifecta of data that typically drive total wages and salaries in the economy. The three — payrolls, average hourly wage and average workweek — all increased in November. Bigger paychecks this time of year are welcome news for retailers since workers have more cash to spend during the holiday shopping season.
Number of the Week: Is Job Market Stronger or Just Playing Catch-Up? - 48,000: The difference between the three-month average jobs added now and July. Nothing puts the joy in holidays like a burst of job growth. Friday’s employment report showed the U.S. economy generated 203,000 new jobs in November on top of 200,000 added in October. Payrolls have grown by an average of 193,000 in the past three months, up from 145,000 in the three months ended July. The mix of job gains also is encouraging. Traditionally high-paying sectors such as manufacturing and transportation helped to pace hiring. An increase in the average hourly wage coupled with the total job gain and a longer workweek suggest a healthy increase in November personal income. What’s strange about the numbers is the timing: Businesses are hiring strongly in a quarter that is on track to post fairly weak output growth (thanks in large part to the third quarter’s inventory buildup). That raises the question: is the burst of hiring a catch-up for businesses that held back, or a sign of new momentum? The answer matters because makeup job growth won’t last. The problem is that we will need to see more information on demand to know whether the U.S. has actually entered a virtuous cycle of more demand generating more jobs and income, which adds to demand. The economy has given a head fake before, and the ho-hum start to holiday buying is a reason to be cautious now.
Low Labor Force Participation Is Not Due To Demographics…I have written extensively since the end financial crisis about the structural change to employment in the U.S. and the push to increase productivity to reduce employment costs and boost profitability. I addressed this issue specifically in "The Great American Divide" stating: "Suppressed wage growth, layoffs, cost-cutting, productivity increases, accounting gimmickry and stock buybacks have been the primary factors in surging profitability. However, these actions are finite in nature and inevitably it will come down to topline revenue growth. However, since consumer incomes have been cannibalized by suppressed wages and interest rates - there is nowhere left to generate further sales gains from in excess of population growth.""This is why the gap between corporate profits and the number of working employees is the highest level on record. Fewer workers, higher productivity and longer hours for the same pay, or less, equals higher corporate profits. This is great for executives, primarily the top 10% of wage of earners, who are compensated from rising share prices, bonuses and other performance related compensation. However, for the 'working stiff,' there is little reward for their labor." This "shift" has been critical to the employment landscape in the U.S. over the past 5-years as the number of individuals that are no longer counted as part of the "labor force" has risen above 90 million individuals which equates to roughly 36% of the entire working age population that are 16 years or older. The chart of the labor force participation rate shows this problem graphically.
Paths to Full Employment - Economists like me, who stress the importance of full employment, have a bad habit. We go on and on about the problem of slack labor markets – their negative impact on the living standards of middle- and lower-income families, their persistence in recent decades – and then we stop without saying what might be done about it. At best, our closing paragraph might include a nod at fiscal or monetary policy, but that’s it. In my recent public speaking I’ve been striving to correct that, by starting with the brief assertion (and, I’ll admit, a couple of slides) that the absence of full employment is a serious, long-term (“structural,” as Lawrence Summers recently put it) problem and then jumping right to five robust solutions to the problem. In this post, I’ll briefly elaborate those solutions. Of course, assuming these solutions are good ones, this leaves us only with a deeper problem: the absence of a political environment with even a sliver of hope of taking up any of these ideas. That will be the subject of a later post. For now, let it be known that as a longtime resident of Dysfunction Junction (i.e., Washington), I’m acutely aware of that problem. Here are five ideas, developed with Dean Baker in our recent book on the path back to full employment (wherein you can find more detailed discussions) and soon to be further elaborated, as you’ll read at the end:
The Workers Who Bring You Black Friday - The call from the temp agency comes in late October. "Can you lift fifty-pound boxes?”—and completed a worksheet of basic math problems. Now there’s a job. A warehouse just outside the city of Ontario, about forty miles east of Los Angeles, needs more bodies to meet the holiday crush. “Make sure you’re early.” Before hanging up she repeats the order. “Be early.” On an overcast Tuesday, I pull into the parking lot, fifteen minutes ahead of schedule. Looming to my left is a giant rectangle of windowless cement. At 800,000 square feet, the warehouse is the size of Madison Square Garden, big enough that any misplaced products are as good as lost. I get my picture snapped for an ID badge and join thirty other new hires in the cafeteria. After waiting twenty minutes, we are ushered into a room upstairs. A woman from the agency hands each of us a time sheet. For the sign-in, she tells us to write 8:30. “I know you were told to be here at 8:15,” she says, “but that was just to make sure you got here early.”And, like that, fifteen minutes are lopped from our paycheck. It’s a small but important lesson in what it means to be a “flexible” worker. We are not in control here. Shifts may last four hours, eight hours or twelve; start times will bounce around as well. I’m originally hired for a shift that begins at 7 am, but that later moves up an hour, to 8, and then, in a rush to move goods out the door, to four o’clock in the morning. In the online world of holiday shopping, where demand can surge and retreat with the click of (many) buttons, workers must respond in real time, shoving other commitments aside. For people without cars, the ever-changing schedule makes it hard to coordinate transportation. One middle-aged woman, caught off guard on a day we’re dismissed at noon, will spend three hours walking the eight miles home. That she returns for the next shift—rubbing her feet and complaining under her breath—is a testament to her “flexibility,” to how far she’s learned to bend in the new economy.
McDonald’s offers its low-wage workers advice on how much to tip their pool cleaners - McDonald's is really having trouble with the first rule of holes. Facing bad publicity over an employee helpline telling workers to apply for government assistance and an employee tips website offering budget advice like selling belongings on eBay, McDonald's has just kept digging. The fast food chain added a holiday tipping guide to that website, only to remove it after CNBC described the content: The tipping guide from etiquette maven Emily Post on McDonald's website lists several high-ticket suggestions for givers during the holiday season, including "a gift from your family (or one week's pay), plus a small gift from your child" for an au pair, "one day's pay" for a housekeeper and "cost of one cleaning" for a pool cleaner. The site also lists suggestions for dog walkers, massage therapists and personal fitness trainers.
Rich People Actually Don't Create The Jobs - As America struggles with high unemployment and record inequality, everyone is offering competing solutions to the problem. In this war of words (and classes), one thing has been repeated so often that many people now regard it as fact. "Rich people create the jobs." Specifically, by starting and directing America's companies, entrepreneurs and rich investors create the jobs that sustain everyone else. This statement is usually invoked to justify cutting taxes on entrepreneurs and investors. If only we reduce those taxes and regulations, the story goes, entrepreneurs and investors can be incented to build more companies and create more jobs. This argument ignores the fact that taxes on entrepreneurs and investors are already historically low, even after this year's modest increases. And it ignores the assertions of many investors and entrepreneurs (like me) that they would work just as hard to build companies even if taxes were higher. But, more importantly, this argument perpetuates a myth that some well-off Americans use to justify today's record inequality — the idea that rich people create the jobs.
A New Day, A New Danger: Temporary Workers Face Safety Hazards at Work - "From the minute one walks into that factory, one is hit by this incredible odor of [chemical] thinner ... It just goes right through you,” she recalled through an interpreter in an interview with Working In These Times. But soon, the noxious smell was the least of her concerns. While making plastic molds on her first—and last—day in April, Ramirez suffered a searingly painful burn on her hand. When she tried to report the injury to her temp-work agency, Staffing Network, she says dispatchers laughed at her and called the wound minor, pressuring her to drop the issue. Looking back now, she remembers seeing several other people at the plastics factory with burns on their arms and hands. But as Ramirez points out, many temporary workers don't report injuries to avoid potential employer retaliation. “[We're] very afraid of saying anything for fear of losing our jobs,” she says, who notes that she hasn't been called back to work by Staffing Network since she, as she puts it, "stood up for [her] rights." Temporary workers, or "temps," often go into work every day without even knowing what their job will entail, let alone what safety precautions they should take. These “contingent laborers" form a growing share of the workforce that is increasingly anonymous, dispersed, disorganized and, sometimes, in dire danger.
2.2 million jobless Americans face aid cutoff: About 1.3 million unemployed Americans are set to lose their extended jobless benefits by the end of December if Congress doesn't renew the program, delivering another blow to struggling households hit with recent cuts in food stamps. Another 850,000 people would run out of unemployment insurance from January through March when their roughly 26 weeks of state benefits end, according to the National Employment Law Project. "There's a view … that it would be too heavy a blow both to the economy and to struggling unemployed families to have both food stamp benefits and unemployment benefits all (be cut) within two months of each other," says Bob Greenstein, president of the Center on Budget and Policy Priorities. On Nov. 1, a temporary increase in food stamp benefits was phased out, affecting more than 47 million Americans. Some of those affected also receive jobless benefits, NELP says, though it had no specific data. In January, Congress renewed that program as part of the "fiscal cliff" deal on tax increases and spending cuts, but scaled it back. This year, the unemployed have received 14 to 47 weeks of emergency benefits, depending on their state's jobless rate, NELP figures show. Those benefits are slated to end Dec. 28, abruptly cutting off payments to the 1.3 million people already receiving them and ensuring that another 850,000 will get no more checks when their 26 weeks of state benefits expire between January and March.
The case for extending unemployment insurance, in one chart -- Congress is starting to take notice of the fact that more than 1.3 million people will lose their jobless benefits on Dec. 28 unless lawmakers renew an emergency aid program for the unemployed that's set to expire this year. House Democrats said on Thursday that they won't support a budget deal unless it includes a one-year extension of the Emergency Unemployment Compensation program, which would cost roughly $25.1 billion. In response, Republican Speaker John Boehner said he would "entertain" the idea of an extension but wants to see a specific proposal from the White House first. Naturally, this raises further questions: Where does it all end? Will a program that was meant to provide "emergency" aid to the long-term unemployed get extended indefinitely, year after year? And how much does the job market need to improve before this program can shrink back to normal levels?Over at the Center on Budget and Policy Priorities, Chad Stone offers one way to think about this question. Technically, we're still very much facing a jobs "emergency," even after years of recovery. That's particularly true for workers who have been out of work for 27 weeks or more — the people most likely to be affected by the cut-off in benefits:
Unemployment Benefit Lapse Will Cut Jobs, Report Says - The Obama administration, bolstering a sustained push by Democrats to extend emergency unemployment benefits, said today that a lapse may cost the U.S. as many as 240,000 jobs in 2014. An estimated 1.3 million unemployed workers would immediately lose benefits if the emergency program -- extended repeatedly since its inception in 2008 -- is allowed to expire on Dec. 28, according to the report drafted by President Barack Obama’s Council on Economic Advisers and the Labor Department. During 2014, 3.6 million more would have their benefits cut off.“In no prior case has Congress allowed special extended benefits to expire when the unemployment rate was as high as it is today,” the report said, citing the current jobless rate of 7.3 percent. As many as 23.9 million people have received the benefits since 2008, the report said. The administration’s analysis estimated the effect of extending the program for a full year, maintaining the current rules of the program and compared it to what would happen if the benefits were allowed to expire. Ending the extra benefits would have the effect of reducing the income of job seekers, driving down consumption. The resulting reduced demand would cost as many as 240,000 jobs, according to the report.
Unemployment benefits don’t discourage people from finding work…A new study shows that even generous unemployment benefits have zero impact on people’s drive to go out and find a job. The multinational study, conducted by Jan Eichhorn, a sociologist at the University of Edinburgh, and published in the October issue of Social Indicators Research ($$), discredits what many see as conventional wisdom. During a floor debate over extending benefits for the long-term unemployed, Senator Jon Kyl of Arizona put it directly: “Continuing to pay people unemployment compensation is a disincentive for them to seek new work.” Not so, Eichhorn reports. Although he found that the well-being of the unemployed varied dramatically from country to country according to various economic and demographic variables, the key finding was that the generosity of unemployment benefits had no effect at all on people’s drive to go out and try to find a job. “This means that claims about unemployment benefits resulting in complacent unemployed people who chose the situation and would be satisfied with it cannot be retained uncritically,” he wrote.
Strong Jobs Report Could Mean Bad News For Unemployment Benefits - The good news that the U.S. unemployment rate fell to 7 percent in November could be bad news for more than a million of the long-term unemployed whose federal benefits are scheduled to expire at the end of the month. In recent years Democrats have insisted that Congress maintain a special safety net for the long-term jobless specifically because the national unemployment rate hadn't fallen beneath an historical threshold. This particular talking point could now backfire. "Congress has never before allowed benefits to expire when unemployment was higher than 7.2 percent," Rep. Jan Schakowsky (D-Ill.) said in 2012. Indeed, Congress has provided extra weeks of federal unemployment compensation for people who use up the standard six months of state benefits in response to every recession for the past 50 years. The maximum combined state and federal benefits in states with high unemployment rates is currently 73 weeks. But what goes up, must come down -- it's always been a matter of when. The stakes are high: Between Christmas and the new year, 1.3 million long-term jobless will lose their federal benefits if Congress fails to reauthorize the Emergency Unemployment Compensation program. The Congressional Budget Office has estimated it would cost $26 billion to continue the benefits through next year.
Low bank wages costing the public millions, report says - Almost a third of the country’s half-million bank tellers rely on some form of public assistance to get by, according to a report due out Wednesday. Researchers say taxpayers are doling out nearly $900 million a year to supplement the wages of bank tellers, which amounts to a public subsidy for multibillion-dollar banks. The workers collect $105 million in food stamps, $250 million through the earned income tax credit and $534 million by way of Medicaid and the Children’s Health Insurance Program, according to the University of California at Berkeley’s Labor Center. The center provided the data to the Committee for Better Banks, a coalition of labor advocacy groups that published the broader study, to be released Wednesday, on the conditions of bank workers in the heart of the financial industry, New York. In the that state alone, 39 percent of tellers and their family members are enrolled in some form of public assistance program, the data show. “This is the wealthiest and most powerful industry in the world, and it’s substantially subsidized by our tax dollars, money that we could be spending on child care or pre-K,” said Deborah Axt, co-executive director at Make the Road New York, one of four coalition members.
The anatomy of median wage stagnation: paltry wage increases and gyrating gas prices - Periodically in the last 6 months I have written stories challenging the dominant narrative about "median household income" and "median wages." As to each measure, it has been suggested that there has been no real economic recovery because both fell since 2009. While paltry nominal wage increases averaging only 1.8% since 2009 are an important part of the story, at least as important has been the effect of huge swings in the price of gasoline. In the case of "median household income," I've shown that the measure is being swamped by the trend of Boomer retirements. Retirement of a wage earner on average causes a decline of about 50% in a household's income. Since households headed by retirees are included in the data, and Boomers are retiring at the rate of about 10,000 a day, the percentage of retiree-headed households is rising, and thus the dominant secular trend in median household income is likely to continue on a downward trajectory for the next decade or more. Despite that, measures of "median household income" have increased slightly since 2011, as shown in this graph from Doug Short's monthly update using data from Sentier Research:
The Post Only Calls It Redistribution When Government Policy Pushes Income Downward – Dean Baker -For the last three decades the government has pursued a wide range of policies that have had the effect of redistributing income upward. For example our trade policy, by deliberately placing manufacturing workers in direct competition with low paid workers in the developing world, has lowered the wages of large segments of the work force. By contrast, we have left in place the restrictions that protect doctors and other highly paid professionals from foreign competition, ensuring that their pay stays high. Similarly the too big to fail insurance that the government provides at no cost to large banks like Citigroup and Goldman Sachs allows top executives at these banks to pocket tens of millions of dollars a year. And our budget policy, which keep tens of millions of workers unemployed or underemployed, lessens the income not only of the unemployed, but reduces the bargaining power and wages of those who are employed. These and other government measures have the effect of redistributing income from ordinary workers to those at the top of the income distribution. Given this fact, it is peculiar that the Post would tell people in a piece on the growing strength of populists within the Democratic Party: "many Americans are uncomfortable with the notion of the government redistributing income far beyond what happens today in order to accomplish basic elements of the populist agenda."The question at issue is not the amount of redistribution, the question is the direction of the redistribution. The Post seems to want readers to imagine that the upward redistribution of the last three decades was just a fact of nature, as opposed to being an outcome of government policy. That is a major distortion of reality.
Worker Wage Inequality Myth Exposed - In America today there is a crisis. That crisis is economic inequality. The U.S. workforce has been blamed and dismissed for the growing gap between rich and poor. Much effort has gone into blaming the victim. Americans have been called fat, lazy and stupid along with the never ending drumbeat claim U.S. workers are uneducated and do not have enough technological skills. The droning mantra to blame workers themselves for the growing income gap just got a loud blast of not so fast. Now a new study blows that blame the workers mantra out of the water. There is no evidence that technological shifts, a lack of education or the lack of technical skills is the cause of the great, growing cataclysmic chasm of income inequality in the United States. Many economists contend that technology is the primary driver of the increase in wage inequality since the late 1970s, as technology-induced job skill requirements have outpaced the growing education levels of the workforce. The influential “skill-biased technological change” (SBTC) explanation claims that technology raises demand for educated workers, thus allowing them to command higher wages—which in turn increases wage inequality. Current SBTC models do not adequately account for key wage patterns (namely, rising wage inequality) over the last three decades. The great American workforce economic wipe out is not due to a lack of skills and education. This should be no surprise since America has the best higher education institutions in the world and is home to most of the technological innovations of the last 130 years.
It’s not just fast-food workers who are underpaid -- Akil Poynter, 20, works 30 hours a week at a St. Louis area McDonald’s, earning $7.35 an hour for manning the grill. Since the Florissant Valley Community College student can’t get by on that income, he took on a second job, preparing sandwiches and salads at a local Panera Bread. There he receives $7.95 an hour for another 25 hours of labor a week. Asked the difference between his two employers, Poynter says there isn’t much of one. Panera’s nicer surroundings and higher-quality food don’t translate to better working conditions. “The environment is different but the work is the same,” Poynter noted. “Workers are working their butt off every day to get their paycheck.” As a coalition of groups, including Fast Food Forward and Fight for 15, prepare to undertake one-day job action against fast-food establishments in 100 cities this Thursday, it’s worth taking a moment to contemplate Poynter’s words. While conventional fast-food companies like McDonald’s are receiving the bulk of public opprobrium for paying their workers a less-than-living wage, the reality is that what are perceived as more upscale businesses are not doing much better by many of their employees.
Better Pay Now, by Paul Krugman -The last few decades have been tough for many American workers, but especially hard on those employed in retail trade — a category that includes both the sales clerks at your local Walmart and the staff at your local McDonald’s. America is a much richer country than it was 40 years ago. But the inflation-adjusted wages of nonsupervisory workers in retail trade — who weren’t particularly well paid to begin with — have fallen almost 30 percent since 1973. So can anything be done to help these workers, many of whom depend on food stamps — if they can get them — to feed their families, and who depend on Medicaid — again, if they can get it — to provide essential health care? Yes. We can preserve and expand food stamps, not slash the program the way Republicans want. We can make health reform work, despite right-wing efforts to undermine the program. And we can raise the minimum wage. Although the national minimum wage was raised a few years ago, it’s still very low by historical standards, having consistently lagged behind both inflation and average wage levels. Who gets paid this low minimum? By and large, it’s the man or woman behind the cash register: almost 60 percent of U.S. minimum-wage workers are in either food service or sales. This means, by the way, that one argument often invoked against any attempt to raise wages — the threat of foreign competition — won’t wash here: Americans won’t drive to China to pick up their burgers and fries. Still, even if international competition isn’t an issue, can we really help workers simply by legislating a higher wage? The answer is that we have a lot of evidence on what happens when you raise the minimum wage. And the evidence is overwhelmingly positive: hiking the minimum wage has little or no adverse effect on employment, while significantly increasing workers’ earnings.
The Minimum We Can Do - -The idea of fairness has been at the heart of wage standards since their inception. This is evident in the very name of the legislation that established the minimum wage in 1938, the Fair Labor Standards Act. When Roosevelt sent the bill to Congress, he sent along a message declaring that America should be able to provide its working men and women “a fair day’s pay for a fair day’s work.” And he tapped into a popular sentiment years earlier when he declared, “No business which depends for existence on paying less than living wages to its workers has any right to continue in this country.” This type of concern for fairness actually runs deep in the human psyche. There is a widespread sense that it is unfair of employers to take advantage of workers who may have little recourse but to work at very low wages. People also strongly support banning transactions they see as exploitative of others — even if they think such a ban would entail some economic costs. Of course, if most minimum wage workers were middle-class teenagers, many of us might shrug off concerns about their wages, since they are taken care of in other ways. But in reality, the low-wage work force has become older and more educated over time. In 1979, among low-wage workers earning no more than $10 an hour (adjusted for inflation), 26 percent were teenagers between 16 and 19, and 25 percent had at least some college experience. By 2011, the teenage composition had fallen to 12 percent, while over 43 percent of low-wage workers had spent at least some time in college. Even among those earning no more than the federal minimum wage of $7.25 in 2011, less than a quarter were teenagers.
Battle for $15 minimum Wage; Should Companies Pay Workers More? Wal-Mart a Savior or a Pariah? - On Friday, Salon reported Breaking: Massive Black Friday strike and arrests planned, as workers defy Wal-Mart. Defying the nation’s top employer and a business model that defines the new U.S. economy, Wal-Mart employees and allies will try to oust shopping headlines with strike stories, and throw a retail giant off its heels on what should be its happiest day of the year. By day’s end, organizers expect 1,500 total protests in cities ranging from Los Angeles, Calif., to Wasilla, Alaska, including arrests in nine cities: Seacaucus, New Jersey; Alexandria, Virginia; Dallas; Minneapolis; Chicago; Seattle; and Ontario, San Leandro, and Sacramento, California. On December 1, the New York Times reported Wage Strikes Planned at Fast-Food Outlets. Seeking to increase pressure on McDonald’s, Wendy’s and other fast-food restaurants, organizers of a movement demanding a $15-an-hour wage for fast-food workers say they will sponsor one-day strikes in 100 cities on Thursday and protest activities in 100 additional cities. The movement, which includes the groups Fast Food Forward and Fight for 15, is part of a growing union-backed effort by low-paid workers — including many Walmart workers and workers for federal contractors — that seeks to focus attention on what the groups say are inadequate wages. Whenever Wal-Mart opens up a store it gets tens of thousands of applicants for a couple hundred openings. People want the jobs. Here's the deal. If you don't like the job, then don't take it. It really is as simple as that.
The Minimum Wage Used To Be Enough To Keep Workers Out Of Poverty—It’s Not Anymore: Raising It to $10.10 Would Lift a Family of Three Above the Poverty Line - As President Obama and others have noted, a parent who works full-time, year round at the federal minimum wage does not earn an income above the federal poverty line. This wasn’t always the case. Up until the early 1980s, an annual minimum-wage income—after adjusting for inflation—was enough to keep a family of two above the poverty line. At its high point in 1968, the minimum wage was high enough for a family of three to be above the poverty line with the earnings of a full-time minimum-wage worker, although it still fell short for a family of four. The falling minimum wage has led to poverty and inequality. Today, at the federal minimum wage of $7.25 per hour, working 40 hours per week, 52 weeks per year yields an annual income of only $15,080. As shown in the figure, this is below the federal poverty line for families of two or more. If the federal minimum wage were raised to $10.10 per hour, as Sen. Tom Harkin (D-Iowa) and Rep. George Miller (D-Calif.) have proposed (depicted by the dotted line), it would bring a minimum-wage income back above the poverty line for a family of three. The Harkin-Miller proposal would then index the minimum wage so that it is automatically increased for inflation each year, thereby preserving its real value and protecting full-time minimum-wage workers from falling into poverty.
Where The Minimum Wage Would Be If The Top One Percent Didn't Leave Workers Behind - If the minimum wage had grown at the same rate as the earnings of the top one percent of Americans the federal wage floor would be more than triple the current hourly minimum of $7.25. Instead, the minimum wage has been lower than a poverty wage ever since 1982. The New York Times compiled those and other basic facts about the minimum wage into an infographic. Together with demographic data about who actually holds minimum-wage jobs — less than a quarter of the minimum-wage workforce are teenagers, and nearly four in ten are over the age of 30 — the graphic makes the fundamental case for fighting inequality and economic hardship by raising the minimum wage. The horizontal red line in the Times graphic indicates the hourly wage necessary for a single parent working full-time with one child to avoid poverty:
When are minimum wage hikes most likely to boost unemployment? - When the wage profile for low-skilled workers is sloping upward with time, minimum wage increases are less likely to increase unemployment. After all, the employer might feel that with rising wages and rising productivity, those low-skilled workers might “grow into” the higher and legally mandated new wage rate. So maybe keep them, noting that the search costs of pulling in a good replacement will be higher too. Furthermore, even if some of those workers are laid off they have a higher chance of being reemployed elsewhere, due to the relatively strong labor market.What about when the wage profile for low-skilled workers is sloping downward over time? One would expect the opposite result to hold, namely that employers are less likely to hold on to workers when confronted with a mandated wage increase.For much of the 1990s, the labor market for less skilled workers was in decent shape. Since 1999 or so often it has been in bad or declining shape, excepting the “bubbly” years of 2004-2006. Therefore a minimum wage hike today would be more likely to boost unemployment than the minimum wage hikes of the past. And that unemployment is more likely to be long-term, corrosive unemployment than in previous decades. I do understand that a minimum wage hike, in the eyes of some, is more “needed” today, perhaps for distributional reasons. But can we admit it is more likely than average to lead to additional unemployment?
The Minimum Wage and the Laws of Economics - I can’t open the paper these days without stumbling onto something about the minimum wage, which I take to be a good thing as it’s a simple, popular way to help address the problem of very low-wage work in America. It’s not a complete solution; it’s not the only solution — it is, in fact, a relatively small-bore policy that sets an important labor standard: the government will compensate for the severe lack of bargaining clout among our lowest-wage workers by setting a floor below which we won’t allow their wages to fall. It’s also that case that we need to look carefully these days at any policies that will help offset income inequality and wage stagnation, especially ones with low budgetary costs, or in this case, virtually none. I will not rehearse the age-old arguments about unintended consequences, primarily job loss among affected workers. The economist Arindrajit Dube, who himself has made important contributions to our understanding of this issue, does so admirably in a recent comprehensive review. The fact is that along with the many changes in the national minimum over time, we now have dozens of states and localities with minimum wages higher than the federal minimum. If there were a problem with widespread job losses among intended beneficiaries, we’d probably know. Instead, I want to focus on a broader aspect of the itch that the minimum-wage increase scratches: the problem of job quality.
Should the US raise the minimum wage? (That’s not a hook. We actually don’t know.) - FT Alphaville - You can’t turn a virtual corner this week without tripping over a discussion about the US minimum wage. The case in favour of raising it has been made by Arindrajit Dube, Paul Krugman, Ed Luce, and Kevin Drum. Arguing against have been Tyler Cowen, Scott Winship, and Adam Ozimek. Peter Coy and Susan Berfield are comprehensive but meh on both its costs and benefits. Reluctantly in favour, maybe, if nothing better is possible, is Ryan Avent. And from earlier this year see also Felix Salmon (for), Dylan Matthews (against), and Annie Lowrey (explanatory piece). Culled from the posts linked above and a few other places, here are summaries of the arguments in favour and against, as we see them.
The Minimum-Wage Cure for Illegal Immigration - Last week, Ron Unz, a California businessman, submitted a ballot initiative to the California secretary of state that would raise the state minimum wage to $12 an hour in 2016 from the current $8. The federal minimum wage is $7.25. What is curious about the Unz initiative is that he is a conservative who defends a higher minimum wage on conservative grounds. In an interview with The New York Times, he said it would reduce government spending on welfare. A recent study from the University of California, Berkeley, estimated that welfare benefits for low-wage workers amount to $7 billion a year. More controversially, Mr. Unz also contends that a higher minimum wage would curb illegal immigration. He has made this argument for some years in a variety of liberal and conservative publications. Cleverly, Mr. Unz has turned the principal conservative argument against a higher minimum wage – that it would reduce jobs by making employment more expensive – into a virtue. As he wrote in a 2011 article in The American Conservative magazine, of which he was then the publisher: The automatic rejoinder to proposals for hiking the minimum wage is that “jobs will be lost.” But in today’s America a huge fraction of jobs at or near the minimum wage are held by immigrants, often illegal ones. Eliminating those jobs is a central goal of the plan, a feature not a bug.
One Answer to Low-Wage Work: Redistributing the Gains - Robert Reich - The President’s speech yesterday on inequality avoided the “R” word. No politician wants to mention “redistribution” because it conjures up images of worthy “makers” forced to hand over hard-earned income to undeserving “takers.” But as low-wage work proliferates in America, so-called takers are working as hard if not harder than anyone else, and often at more than one job.Yet they’re still not making it because the twin forces of globalization and technological change have reduced their bargaining power and undermined their economic standing — while bestowing ever greater benefits on a comparative few with the right education and connections (and whose parents are often best able to secure these advantages for them).Better education and training for those on the losing end is critically important, as will several of the other proposals the President listed. But they will only go so far.The number of losers is growing so quickly, and so much of the economies’ winnings are going to a small group at the top — since the recovery began, 95 percent of the gains have gone to the richest 1 percent — that some direct redistribution of the gains is necessary.
Obama Gets Real, by Paul Krugman - Much of the media commentary on President Obama’s big inequality speech was cynical. What struck me about this speech, however, was what he had to say about the sources of rising inequality. Much of our political and pundit class remains devoted to the notion that rising inequality, to the extent that it’s an issue at all, is all about workers lacking the right skills and education. But the president now seems to accept progressive arguments that education is at best one of a number of concerns, that America’s growing class inequality largely reflects political choices, like the failure to raise the minimum wage along with inflation and productivity. And because the president was willing to assign much of the blame for rising inequality to bad policy, he was also more forthcoming than in the past about ways to change the nation’s trajectory, including a rise in the minimum wage, restoring labor’s bargaining power, and strengthening, not weakening, the safety net. And there was this: “When it comes to our budget, we should not be stuck in a stale debate from two years ago or three years ago. A relentlessly growing deficit of opportunity is a bigger threat to our future than our rapidly shrinking fiscal deficit.” Finally! Our political class has spent years obsessed with a fake problem — worrying about debt and deficits that never posed any threat to the nation’s future — while showing no interest in unemployment and stagnating wages. This is going to change the discourse — and, eventually, I believe, actual policy.
How Do You Measure ‘Inequality’? - Economists track an index called the Gini coefficient, which measures the variance of income. A Gini coefficient of 0 means that everyone in a given society earns exactly the same amount (in other words, complete equality). A Gini coefficient of 1 means one person earns all the income and everyone else earns nothing (total inequality). The Gini coefficient in the U.S., as of 2011, was 0.477, according to a U.S. Census report. That’s up from 0.469 in 2010, and 0.397 in 1967, the first year it was reported. Census officials have broken it down to the county level. The county with the most inequality from 2006 through 2010, as measured by Gini, was East Carroll Parish in Louisiana, at 0.645. The lowest Gini index was measured in Loving County Texas, at 0.207. (Miami-Dade County in Florida had a Gini of 0.503, while New York County, a.k.a Manhattan, in New York had a 0.601 reading). The Central Intelligence Agency has aggregated Gini data from more than 100 countries, though some of its data can be rather old. It lists Lesotho (as of 1995) with the highest Gini index at .632. Sweden has the lowest Gini index, as of 2005, at .230. A Gini index of 0.477 would put the U.S. near countries like Mexico, Singapore, Ecuador, Madagascar, and China.
The cost savings of food stamps cuts versus the cost increases of diabetes care - As many of you are aware, food stamps were recently cut in this country. This has had a brutal effect on people and families and on neighborhood food pantries, which are being swamped with new customers and increased need among their existing customers. One thing that I come away with when I read articles describing this problem is how often they detail individuals who have been diagnosed with diabetes but can no longer afford to pay for appropriate food for their condition. As a person with a family history of diabetes, and someone who has been actively avoiding sugars and carbs to control my blood sugar for the past couple of years, I have a tremendous amount of sympathy for these struggling people. Because here’s the thing, and it’s not a secret: shitty food is cheap. If I need to buy lots of food (read: calories) for a small amount of money, I can do it easily, but it will be hell for my blood sugar control. I’m guessing I’d be a full-blown diabetic by now if I were poor and on food stamps. And that brings me to my nerd question of the morning. How much money are we really saving by decreasing the food stamp allowance in this country, if we consider how many more people will be diagnosed diabetic as a result of the decreased quality of their diet? And how many people’s diabetes will get worse, and how much will that cost?
Looking for fraud? Don't look at food stamp recipients, look at Wall Street - Hunger will drive kids to do crazy things. Like stay at school. A few weeks ago South Bronx public schools had a half-day, with dismissal at noon. Yet almost all the kids stayed an extra hour, waiting in the cafeteria to eat the schools' free lunch. Kids had always left when they could. "That was before the cut in food stamps. We get $45 less a month now". The school kids' neighborhood, the South Bronx, has been hit particularly hard by the recession. Here families live day by day on an average income of roughly $16,000. It means less food now, less clothing now, less everything now. Food stamps are often the only thing keeping families fed, and $45 dollars less a month has an impact. Sadly, Republicans in Congress are not just content to let the prior increases lapse, they are pushing for even greater cuts. They try to justify the reductions by pointing to the growth in food stamps and painting it as program rife with abuse.One Fox news report detailed a surfer who used food stamps to buy sushi and lobster. A modern twist on an age-old narrative that plays into the tired stereotype of "welfare queens". I have watched people sell food stamps for money. I see it almost monthly. They don't buy lobsters. They are homeless addicts, and they buy heroin, or crack, or dollar bottles of vodka. They don't just buy drugs. They also buy food from the dollar menu at McDonalds. Or sometimes they spend the money on blankets for their beds under bridges, next to expressways, or in abandoned buildings. This is fraud, but it certainly isn't rife. The homeless addicts are the outliers, a tiny desperate sliver of the food stamp population. They are not proud of this. They are addicts who are trying to feed their addiction through any means. Selling food stamps is preferable to selling their body.
The Causes of Poverty: Low IQ? - This kind of reasoning is all too common: the poor are stupid and they are poor because they make stupid decisions. Unsurprisingly, it’s mostly the rich who indulge in this kind of pop-psychology, because if true it would also mean that they are wealthy because they are smart. They imagine a correlation somewhat like this: Had they cared to look up the actual data, they would have found that the rich don’t necessarily have higher IQ. There’s no correlation at all between wealth and IQ, not even a weak one: And that’s not really surprising: a lot of high paying activities do not require high IQ (I’m looking at you, Sarah Palin). Conversely, it’s not uncommon for smart people to be poor. So, if the wealthy aren’t making a living that is proportionate to their intelligence, then their wages are determined by other factors: specific skills if we want to be kind; networking, nepotism, degrees paid for by their parents if we want to be nasty. And the wages of the poor aren’t caused by their IQ either.
Record Numbers Of Homeless Flood Massachusetts Even As State Shelters Overflowing - As the Boston Globe reports, citing a recent report from the Department of Housing and Urban Development, the number of homeless people in shelters and living on the streets in Massachusetts has risen 14 percent since 2010 to a record 20,000 in January 2013, even as homelessness has declined nationally. Aaron Gornstein, the undersecretary for housing, said the surge has followed cuts in state and federal housing subsidies, soaring rents in Greater Boston, and still-high rates of unemployment and underemployment, particularly among lower-income workers. “The state as a whole has recovered from the Great Recession faster than most other states, but in many ways we’re still struggling,” Gornstein said. “Federal budget cuts have made the situation worse.” However, in what may be the most curious twist, and yet another example of how perverted the incentive and capital allocation system in the US is, the nearly 2,100 families who could not find place in shelters, were housed in motel rooms at a greater cost to all US taxpayers amounting to tens of millions. An average of nearly 2,100 families a night — an all-time high — were temporarily housed in motel rooms in October, just about equaling the number of families in emergency shelters across the state, The demand for shelter is so great that the state has been temporarily sending homeless families from Boston to motels in Western Massachusetts, although state officials said many have been relocated back again, closer to home.
Two Cities With Unemployment Rates North of 25% -- The U.S. economy is growing at a steady pace and the job market is firming up. But that’s not how it feels in two cities in the southwest. The October unemployment rate was a staggering 31.9% in the metro area of Yuma, Ariz., and 25.2% in El Centro, Calif., according to a Labor Department report released Thursday. They had the highest unemployment rates, which aren’t seasonally adjusted, among the 372 metro regions measured by the Labor Department’s monthly report. The two regions, roughly 60 miles apart abutting the Mexico border, have long had historically high jobless rates. That’s due in part on their heavy reliance on major agriculture businesses and on migrant workers. But the recession and weak recovery pushed their employment problems into new territory.The Labor Department report showed how many regions, more than four years after the recession, are still struggling mightily with Depression-like jobless rates. Other regions — namely, those benefiting from a natural resources boom — are humming. Bismarck, N.D., for example, had the nation’s lowest unemployment rate in October at 1.7%.By comparison, the non-seasonally adjusted national unemployment rate was 7.0% in October. The seasonally adjusted national figure, which is more frequently cited, was 7.3% in October. The Labor Department doesn’t seasonally adjust the metro region figures in the monthly report. Most metro regions — 214 — had jobless rates below the national figure; 144 had rates above it; and 14 matched the U.S. figure.
Detroit Ruled Eligible For Chapter 9 Bankruptcy - A Federal Judge ruled today that the City of Detroit was indeed eligible to file for bankruptcy protection: — Detroit is eligible to shed billions in debt in the largest public bankruptcy ever in the United States, a federal judge ruled Tuesday, while also finding that the public pensions could be reduced during reorganization despite a provision in Michigan’s Constitution. In ruling that Detroit was eligible to reorganize under federal bankruptcy law, Judge Steven W. Rhodes said the city met every test of insolvency, including failing to pay its debts and being unable to provide a minimum level of basic services to its 680,000 residents.“This once proud and prosperous city can’t pay its debts,” the judge said. “It’s insolvent. It’s eligible for bankruptcy. But it also has an opportunity for a fresh start.” Appeals were expected to be filed quickly. Bruce Babiarz, a spokesman for Detroit’s fire and police retirement system, which supports 8,500 retirees, said lawyers were reviewing the ruling and expected to file an appeal by the end of the week. But the case will continue to move forward, with the next step being the city filing a “plan of adjustment.” It is unclear, however, what portions of the judge’s ruling may be appealed.
Detroit eligible to shed billions in largest public bankruptcy in U.S. history - Detroit is eligible to shed billions of dollars of debt that accumulated during the city’s decades-long decline, including cutting pensions for thousands of workers and retirees, a judge ruled Tuesday in a decision that shifts the epic bankruptcy case into a new and delicate phase. Judge Steven Rhodes, who wondered aloud why the bankruptcy had not happened years ago, said pensions can be altered just like any contract because the Michigan Constitution does not offer bulletproof protection for employee benefits. But he signalled a desire for a measured approach and warned city officials that they must be prepared to defend any deep reductions. “This once proud and prosperous city can’t pay its debts. It’s insolvent,” Rhodes said in formally granting Detroit the largest public bankruptcy in U.S. history. “At the same time, it also has an opportunity for a fresh start.” The ruling came more than four months after Detroit filed for Chapter 9 protection. Rhodes agreed with unions and pension funds that the city’s emergency manager, Kevyn Orr, had not negotiated in good faith in the weeks ahead of the July filing, a key condition under federal law. But he said the number of creditors — more than 100,000 — and a wide array of competing interests probably made that “impossible.”
Detroit Is Bankrupt: What Now? - Detroit is bankrupt—officially. Indeed, as Judge Steven Rhodes of the United States Bankruptcy Court said earlier today, the city "could have and should have filed for bankruptcy long before it did, perhaps even years before." Rhodes’ judgment takes immediate effect, and creditors are likely to begin fighting for whatever scraps they can get from the city at this point. Detroit's emergency manager, Kevyn Orr, and city lawyers expect to submit a plan of financial re-adjustment by the end of the month. This will include plans to pay off part of its debts to creditors, including bondholders, retirees, and unions. The plan will also address the need to reinvest in city services. According to the Detroit Free Press, it will likely also make proposals about the sale of assets, such as the city’s massive water and sewer department. At this point, Orr said in a press conference today, everything is on the table. The city has said that it is possible for it to emerge from bankruptcy before the end of 2014. There is a chance that the city will face an appeals process instigated by creditors. In particular, according to Reuters, “The city's largest union has asked Rhodes to allow any appeal to proceed directly to the U.S. 6th Circuit Court of Appeals, bypassing the U.S. District Court in Detroit.” However, the looming specter of ongoing legal battles is not likely to delay the city as it moves forward with its restructuring plan: it can proceed even as appeals are pending. Also, as the Detroit Free Press indicates, “experts say that appeals courts are hesitant to overturn bankruptcy rulings based on the facts.”
Judge Clears Way for Detroit to Pursue Bankruptcy, Handing Labor Unions Huge Defeat - Dealing a major blow to labor unions, a judge ruled Tuesday that Detroit can move ahead with its bankruptcy filing. “This once proud and prosperous city can’t pay its debts. It’s insolvent. It’s eligible for bankruptcy,” Judge Steven Rhodes said in announcing his decision. “At the same time, it also has an opportunity for a fresh start.” The bankruptcy, which aims to address the city’s $18 billion in long-term liabilities, means unions, pension funds and retirees stand to take a loss with the rest of the city’s creditors. Rhoades said he believes bankruptcy will allow Detroit to recover and move forward. “The city of Detroit was once a hard-working, diverse, vital city, the home of the automobile industry, proud of its nickname the Motor City,” he said adding Detroit’s many problems including double-digit unemployment, “catastrophic” debt deals, vacant homes, massive public safety issues and population loss. The judge did not approve a specific bankruptcy plan for the city. Rather, he gave Detroit officials the green light to pursue that option, despite massive pushback from major labor unions.
Busted and Bankrupt Detroit Can Now Wipe Out Worker Pensions - It is official. Detroit is bankrupt. Detroit is not only bankrupt they can now trash pensions owed to city workers. That is police, fire, hospital and a host of workers counting on those pensions for retirement. The U.S court ruling allows for a bankruptcy type for cities and towns, Chapter 9, to proceed and specifically puts pensions on the fair game bankruptcy chopping block. Detroit is now the largest city bankruptcy in the history of the United States. The city's debt is estimated at $18 billion. Chapter 9 bankruptcy allows for the bankruptcy court to negotiate with credits and no city asset is untouchable for a fire sale to pay bills. This includes the city's art collection. The ruling pensions can be cut is devastating to all those relying on those pensions for retirement. The unions immediately filed an appeal. It is estimated pensions will cost the city 65% of Detroit's revenues by 2017 and will have negative cash flow by $376 million that same year. This is while banks along with their derivatives and swaps are up to be paid, as first reported when Detroit filed for bankruptcy. The average pension in Detroit is $19,000. How much the cuts to the estimated 20,000 city worker's pensions is unknown. Even though the pensions are funded to about 80%, it appears there might be worse cuts to the meager pension amounts of workers than the unfunded 20%. Michigan live created a 15 most shocking list the judge said about Detroit during the bankruptcy hearing, which is just a very sad story for the city representing America's great decline
Detroit: Eligibility and Pensions Two big rulings in Detroit's Chapter 9 bankruptcy today: first that Detroit is eligible for Chapter 9 and second that it may impair its pension obligations in bankruptcy. Both rulings were delivered orally from the bench and transcripts aren't yet available, so it's hard to really parse them other than through selected quotations in the media. With that major caveat, here are my initial thoughts on each issue in turn:
- (1) Eligibility. The eligibility ruling was no surprise. The issue seems to have turned on whether Detroit was truly insolvent and whether Detroit attempted to negotiate with its creditors in good faith prior to filing as required by statute for eligibility. For municipal bankruptcies, insolvency is defined not as a balance sheet test, but as an ability to pay debts as they come due. That seemed a fairly easy part of the ruling. As for the good faith negotiation, the Bankruptcy Code allows, in the alternative, that the debtor "is unable to negotiate with creditors because such a negotiation is impracticable".
- (2) Pensions. Judge Rhodes also ruled that Detroit could impair its pension obligations. This is huge--it's a much bigger deal in general than eligilibity because this is the game for Detroit and for other cities that are watching in the wings. If Detroit can shed its pension obligations in bankruptcy, then bankruptcy enables municipalities to slough off decades of promises made to their employees. It also gives municipalities a lot more bargaining leverage outside of bankruptcy. Chicago has already been (arguably illegally) squeezing its municipal retirees on healthcare benefits now that a settlement has lapsed. Some municipal retirees saw their health insurance contributions rise 50% this past year, and more cost increases are on the way next way. The Detroit ruling is only going to embolden Rahm Emanuel.
California City’s Return to Solvency, With Pension Problem Unsolved - - Battered by a collapse in real estate prices, a spike in pension and retiree health care costs, and unmanageable debt, this struggling city in the Central Valley has labored for months to find a way out of Chapter 9. Now having renegotiated its debt with most creditors, cobbled together layoffs and service cuts and raised the sales tax to 9 percent from 8.25 percent, Stockton is nearly ready to leave court protection. But what Stockton, along with pretty much every other city in California that has gone into bankruptcy in recent years, has not done is address the skyrocketing public pensions that are at the heart of many of these cases. “No city wants to take on the state pension system by itself,” said Stockton’s new mayor, Anthony Silva, referring to the California Public Employees’ Retirement System, or Calpers. “Every city thinks some other city will take care of it.” While a federal bankruptcy judge ruled this week that Detroit could reduce public pensions to help shed its debts, Stockton has become an experiment of whether a municipality can successfully come out of bankruptcy and stabilize its finances without touching pensions. It is an effort that has come at great cost to city services and one that some critics say will simply not work once the city starts trying to restore services and hire 120 police officers it promised to get the sales-tax increase passed.
GOP Gov. Seeks Repeal of mid-1800s Child Labor Laws, Wanted 12-Year-Olds to Toil -- Gov. Paul LePage's goal of making it easier for minors to work will continue in January when the Department of Labor proposes streamlining the work permit process despite previous failed attempts to do so. Child labor in Maine has been regulated by state government since the mid-1800s and a key component of those regulations requires school superintendents to issue work permits for school-age children offered a job. Now the Department of Labor has proposed being the first contact for work permits during the summer months. The initiative falls short of LePage's stated desire to lower the legal working age to 12, but reprises previous unsuccessful attempts to make it easier for Mainers younger than 16 to earn a p*ycheck.
How Do U.S. Students Compare to Peers Overseas? - Today the Journal reported that U.S. 15-year-olds made no progress on recent international achievement exams and fell further in the rankings, reviving a debate about America’s ability to compete in a global economy. The following chart shows how students in various countries performed on the 2009 and 2012 Program for International Student Assessment test in math.
OECD 2012 Education Rankings: US, Leftists Get Dumberer - I am annoyed with the leftist Economic Policy Institute's spin on the results for the OECD's standardized tests known as PISA. The EPI is complaining that the results portray an unfair picture of American academic performance, and that US policymakers paint an unnecessarily dire picture of US education. Another year, another batch of crappy (should I spell that "KrapPi" to make it more intelligible to certain North American audiences?) results. Ho-hum. Among other EPI complaints we have the following:
- There is a test score gap between socioeconomically advantaged and disadvantaged students in every country. Although the size of the gap varies somewhat from country to country, countries’ gaps are more similar to each other than they are different.
- Countries’ average scores are affected by the relative numbers of advantaged and disadvantaged students in their schools. The United States has relatively more disadvantaged students than the usual comparison countries. If average scores were adjusted so that each country had a similar social class composition, U.S. scores would appear to be higher than conventionally reported and the gap with top-scoring countries, while still present, would be smaller..
While I appreciate the retro-Marxist class warfare stylings, the EPI argument boils down to this: "social class," i.e., household income (I aspire to the petty bourgeoisie, in case you're interested) is the largest determinant of PISA test performance. If we accept this premise, then the picture they paint is even direr than that portrayed by American policymakers. Why? Because Stateside incomes are going nowhere fast--and so there's no point in trying to improve test scores when they are tied to stagnant-to-declining incomes.
Many Young Americans Blame Colleges For Rising Student Debt -- A majority of young Americans say student debt is a major issue facing the nation, a new poll finds, and many blame colleges for the problem. Fifty-eight percent of adults ages 18 to 24 consider rising student debt levels in the United States a "major problem," according to survey results released exclusively to The Huffington Post on Tuesday by the Harvard University Institute of Politics. Only 3 percent said it's not an issue at all, while 22 percent called it a "minor problem." Yet even among people who weren't enrolled in college, 54 percent still considered student debt a major issue. A plurality -- 39 percent -- blame colleges and universities for the rising amount of student debt, compared with just 10 percent who think students are at fault. Survey respondents were more likely to blame colleges for rising student debt if they were currently enrolled in school. The cost of a college degree has increased 12-fold in the last 30 years, while having such a degree has become even more important to those seeking full-time employment. But policy experts and consumer watchdogs have increasingly flagged the wealth loss and ripple effect that the nation's $1.2 trillion in student debt is having on the economy as a whole. "Young people who are coming of age today understand that getting a postsecondary education is important [but] they have a lot of fear about the rising cost of higher education,"
Student-Loan Servicers Face Scrutiny- —Companies that collect payments on student loans will face stepped-up government scrutiny next year as a federal regulator examines whether they are breaking any laws or treating borrowers unfairly. The Consumer Financial Protection Bureau in March will start overseeing the seven largest servicers of student loans, agency officials said Monday. They are expected to include Sallie Mae, also known as SLM Corp., and Nelnet Inc., as well as government agencies in Pennsylvania and Missouri that service loans for the federal government. The federal government makes more than 85% of student loans but delegates collection of payments to outside servicers. The exams come amid concerns from federal officials that servicers try to maximize late fees charged to consumers and don't properly credit students who try to pay off loans early. Through its exams, the CFPB will be able to evaluate how borrowers are treated by their student-loan servicer regardless of whether the loan was originated by the federal government or a private lender. Previously, the CFPB examined large banks' student-loan-servicing operations but not those of nonbank firms like Sallie Mae.
CFPB To Supervise Largest Student Loan Servicers - The federal government for the first time will keep tabs on companies that collect payments on federal student loans, the Consumer Financial Protection Bureau announced Tuesday, extending federal supervision over companies such as Sallie Mae after years of scant oversight by the Department of Education. The CFPB said it had finalized a proposed rule permitting the agency to oversee operations at the largest student loan servicers. As a result, the agency will regularly examine the seven biggest companies, giving it insight into practices employed by financial groups that collectively service more than 70 percent of unpaid student debt. The agency did not identify the seven companies, though the list most certainly includes the Education Department's four main student loan servicers -- Sallie Mae, Great Lakes Educational Loan Services, Nelnet Servicing and the Pennsylvania Higher Education Assistance Agency. Sallie Mae has previously acknowledged in securities filings it was likely to be included in the group.Borrower advocates, who have complained that the Education Department has neglected its authority to punish and deter wrongdoing by federal student loan servicers, said Monday that the CFPB’s move likely would lead to two noticeable changes for borrowers: improved customer service and a more borrower-friendly culture at the largest servicers.
As Boomers Retire, We’ll All Be Detroiters Soon -- It was inevitable. Analysts have warned for years about the massive underfunding of public pensions. The Detroit bankruptcy will test whether governments can cut back on promises made years, even decades, earlier. Make no mistake, other cities are watching the proceedings. (I’m talking about you, Philadelphia.) Rejiggering pensions is nothing new: private-sector retirees have suffered when private pensions have failed. The Pension Benefit Guaranty Corporation takes over failed private plans but it has a ceiling for how much individual retirees may receive. (The 2014 yearly limit for a single-company plan will be $59,320.) Detroit’s pension woes, however, highlight a bigger challenge: the U.S. hasn’t saved enough to support the coming retirement of millions of baby boomers. In a sense, we are all Detroiters. A significant share of the population — 21% by 2050 — may have to cut back their spending to adjust to diminished circumstances. Given that the U.S. economy is driven by consumers young and old, contracting household demand looms as a huge problem. The saving shortfall is evident on both the consumer and business fronts. Fidelity Investment reported that its average 401k balance was just $84,300 at the end of the third quarter. No surprise, higher-income households tend to have larger retirement accounts. Private defined benefit plans are also running short. According to data released last summer by S&P Dow Jones Indices, the fiscal-2012 plans of the S&P 500 companies were underfunded by $451.7 billion.
States and cities grapple with cuts to pensions that workers have already earned - Bev Johns sat before Illinois lawmakers and asked why they hated teachers. The 67-year-old retired special-education teacher and administrator from Jacksonville thought she had a secure pension in return for 34 years of work. She wanted the people considering reducing benefits to rescue the worst-funded U.S. state pension system to know whom they were affecting. “You are punishing people who devoted their lives to educating children,” Johns told a committee in Springfield on Dec. 3. “You are harming individuals who have educated children, worked long hours, paid for materials out of their pocket and often fed and clothed children.” The legislature’s vote that day to approve the $160 billion restructuring, on the same day that a federal judge ruled that bankrupt Detroit may cut retirement benefits, shows the erosion of a social compact. For generations, public employees accepted modest wages for the promise of a secure retirement. The decisions, coming after efforts to curb public-employee power in states such as Wisconsin, Indiana and Michigan, may embolden other municipalities, leave workers more vulnerable and prompt unions to new tactics of opposition. Retirees are already seeing reduced benefits in cities such as Central Falls, Rhode Island, where a judge last year approved cutting pensions to help it emerge from insolvency. In California, San Jose Mayor Chuck Reed is leading the push for an initiative that would let cities cut benefits already promised to employees.
Medicaid and access: Not what you think - It’s conventional wisdom that people on Medicaid have far worse access to providers than those with private coverage or Medicare. Probably this impression is driven by the many studies that gather data from physicians or their offices on whether and when they will see patients with various types of coverage: Medicaid, uninsured, private, and sometimes Medicare. Studies of this type can give a misleading impression. It is true that many such studies reveal that physicians are less likely to see new Medicaid patients than those with private coverage or, if they will see them, they offer appointments further in the future. The June 2011 audit study published in NEJM finds exactly this, for example. (Prior TIE coverage of it here and here.) Other studies point this direction as well; But the literature is far more nuanced than this. There are studies that find Medicaid enrollees have access on par with that of private patients. In 2011, Aaron wrote about one such study, published in the Archives of Internal Medicine. The overall acceptance rate of new patients was pretty static from 2005-2008, going from 94.2% to 95.3%. The percentage of physicians accepting new Medicare patients dropped from 95.5% from 92.9% (about 2.5%). But here’s the thing. There was a bigger drop in physician acceptance of patients with private noncapitated insurance from 93.3% to 87.8% (about 5.5%). In fact, they found that over 90% of physicians accepted new Medicare patients.
Congressional Republicans Acknowledge That Republican Governors and State Legislators Are Death Panelists. Seriously. - Beverly Mann - "Pam Renshaw had just crashed her four-wheeler into a bonfire in rural Folkston, Georgia, and her skin was getting seared in the flames. Her boyfriend, Billy Chavis, pulled her away and struggled to dial 911 before driving her to the nearest place he could think of for medical attention: an ambulance station more than 20 miles away. The local public hospital, 9 miles from the crash, had closed six weeks earlier because of budget shortfalls resulting from Obamacare and Georgia’s decision not to expand Medicaid. The ambulances Chavis sought were taking other patients to the next closest hospital. It took two hours before Renshaw, in pain from second- and third-degree burns on almost half her body, was flown to a hospital in Florida." So began a Nov. 25 article by Toluse Olorunnia on Bloomberg News. The Bloomberg article is titled “Obamacare Cutbacks Shut Hospitals Where Medicaid Went Unexpanded.” Most of the hospitals in question have large numbers of uninsured patients. And nearly all of the hospitals are in states whose Republican governors and legislatures have refused to adopt the expanded Medicaid provision in the ACA and are opting instead to see hospitals close or drastically reduce services, resident-physician positions and other staff positions that until now had been paid for by, um, the federal government’s Medicaid funding. The ACA switches that funding from the current Medicaid program to the expanded Medicaid program that Republican governors and Republican-controlled state legislatures have refused.
Study: States that reject Medicaid expansion lose money — The 20 states choosing not to expand Medicaid will lose billions of dollars in federal funds, according to a new study released Thursday. By 2022, Texas could lose $9.2 billion by not expanding Medicaid as allowed under the Affordable Care Act, while Florida could lose $5 billion over that period, the study conducted by The Commonwealth Fund shows. Commonwealth was founded in 1918 to improve health services for Americans. Also during that period, the study showed, Georgia could lose $2.9 billion, while Virginia could lose $2.8 billion. "There are no states where the taxpayers would actually gain by not expanding Medicaid," said Sherry Glied, lead author on the study. "Nobody wins." Under the Affordable Care Act, states may expand their Medicaid programs to include anyone who falls beneath 138% of the federal poverty level, or about $32,500 for a family of four. But the 2012 Supreme Court decision that upheld the law also said states could choose not to expand Medicaid and not lose federal funding for their existing programs. All 20 of the states choosing not to expand Medicaid have Republican governors. Many have said increasing Medicaid could add to the federal deficit. Others have long opposed the law since its passage in 2010.
Obamacare Website Getting Fixes as Repair Deadline Passes - President Barack Obama’s administration was making more hardware and software fixes to the flawed federal health-insurance website as yesterday’s deadline to repair it passed. “The site is performing well today with low overall error rates and response times despite heavier than usual weekend traffic,” Julie Bataille, spokeswoman for the Centers for Medicare and Medicaid Services, said in an e-mailed statement yesterday. She said new servers installed for part of the system were allowing more people to use it more quickly. More changes were planned for last night to make healthcare.gov “work smoothly for the vast majority of users,” Bataille said. The website is a crucial piece of the 2010 Patient Protection and Affordable Care Act and its success -- or failure -- will have implications for the nation’s $2.7 trillion health-care system. The outcome will help define Obama’s legacy and influence the legislative agenda in a divided Congress, where Senate Democrats facing re-election next year have called for changes in the law. Obama said at a news conference two weeks ago that by the end of November, most people who go to the site “will see a website that is working the way it’s supposed to.” “The vast majority of consumers will be able to fill out applications, shop, compare plans and enroll in the insurance plans,” Jeffrey Zients, an Obama economic adviser overseeing the fixes, said at a Nov. 26 briefing with reporters on condition his comments wouldn’t be published
Obama Kept His Head in the Sand During Healthcare.gov Fiasco - Yves Smith - The New York Times has an instructive account, Inside the Race to Rescue a Health Care Site, and Obama, of the scrambling in the Administration to deal with the beyond-redeption-by-the-power-of-spin disaster of the Healthcare.gov launch. Word of serious shortcomings was leaking out of the hermetic Administration more than six months prior to launch. For instance, Henry Chao, who was in charge of technology of the exchanges was reported back in March of having stated at a conference that he was nervous and was already setting his goals astonishingly low: “Let’s just make sure it’s not a third-world experience.” Later reports have given further details of remarkable planning failures, such as not having a firm hired to act as project overseer/integrator, and of having the White House completely overhaul the “customer” forms in July, the refusal to revise deadlines even as the site failed with a mere 200 user trial, and the lack of meaningful testing and debugging. Now get a load of this: word of how bad things were had gotten out to the insurers so that they had enough time to discuss among themselves what to do, agree on some possible remedies, work up a presentation and get an audience with Administration officials. That is not a process that happens overnight. Yet Obama somehow didn’t know, didn’t care, or perhaps worst of all, believed if he just kept insisting things would get done on time, that would happen, that the imperial power of the Presidential edict would clear all obstacles. But the most damaging part of the piece isn’t what it says or neglects to say about the Obamacare tsuris. It’s that it reveals Obama to have been recklessly indifferent about the execution of what was billed as his signature policy initiative. One can only imagine how inattentive he is to other matters you’d expect him to take seriously.
Bugs plague HealthCare.gov enrollment -- The enrollment records for a significant portion of the Americans who have chosen health plans through the online federal insurance marketplace contain errors — generated by the computer system — that mean they might not get the coverage they’re expecting next month. The errors cumulatively have affected roughly one-third of the people who have signed up for health plans since Oct. 1, according to two government and health-care industry officials. The White House disputed the figure but declined to provide its own. The mistakes include failure to notify insurers about new customers, duplicate enrollments or cancellation notices for the same person, incorrect information about family members, and mistakes involving federal subsidies. The errors have been accumulating since HealthCare.gov opened two months ago, even as the Obama administration has been working to make it easier for consumers to sign up for coverage, the government and industry officials said. Figuring out how to clean up the backlog of errors and prevent similar ones in the future is emerging as the new imperative if the federal insurance exchange is to work as intended. The problems were the subject of a meeting Monday between administration officials and a new “Payer Exchange Performance Team” made up of insurance industry leaders.
Obamacare reboot survives heavy traffic - The new and improved Obamacare website struggled under heavy traffic loads on Monday, but still appeared to operate pretty much as the Obama administration has promised: Okay, but not perfect. After a weekend of final, intensive fixes, officials unveiled a somewhat repaired HealthCare.gov on Sunday and promised that it will work well enough to serve the Americans who want insurance exchange coverage by New Year’s.Amid unusually-high Monday traffic that hit about 750,000 people by 5:30 pm, not everyone was able to immediately log in. Those who couldn’t get on right away were put in a new virtual “waiting room” and there were no meltdowns like those that characterized the website back in October and early November. All eyes will be on the website over the next three weeks, as Americans face a Dec. 23 enrollment deadline to get covered Jan. 1. Its performance will help shape the political messaging around the law as Democrats and Republicans in Congress briefly return to Washington for a few weeks before the Christmas break.
Unacceptable Realities - Paul Krugman -- The other day I found myself hanging out with several other semi-public liberal figures (yes, we were drinking white wine), and the conversation turned to hate mail — specifically, what generated the most hysterical outpourings. For the others, it was often issues that are not my department, like reproductive rights. But for me, it’s two things: health care and monetary policy. The hysteria over Obamacare is being well documented, of course; Sahil Kapur’s piece on “Obamacare McCarthyism” — the instant purging of any Republican who offers any hint of accommodation to the law of the land — is getting a lot of well-deserved attention. One thing Kapur doesn’t emphasize, however, is what I see a lot in my inbox (and in my reading): the furious insistence that nothing resembling a government guarantee of health insurance can possibly work. That’s a curious belief to hold, given the fact that every other advanced country has such a guarantee, and that we ourselves have a 45-year-old single-payer system for seniors that has worked pretty well all this time. But nothing makes these people as angry as the suggestion that Obamacare might actually prove workable. And it’s going to get worse. For two months, thanks to the botched rollout, their delusions seemed confirmed by reality. Now that things are getting better, however, you can already see the rage building. It’s not supposed to be this way — therefore it can’t be this way. If, as now seems highly likely, Obamacare has more or less achieved its enrollment goals by 2015, and costs remain reasonable, that won’t be accepted — there will be furious claims that it’s all a lie.
New Obamacare weapon for GOP: Doctors - Get ready for the next line of attack from the GOP on Obamacare: good luck keeping your doctor. As other controversies surrounding the law begin to fade, House Republicans are increasingly focused on President Barack Obama’s pledge that “if you like your doctor, you will be able to keep your doctor.” They’re hoping to replicate the uproar over canceled insurance plans, which has caused problems for millions of consumers nationwide and political headaches for Democrats. Here is the gist of the GOP contention: Some insurers have limited the number of doctors or hospitals their customers can go to in their new coverage plans, and some people will have to get new coverage plans under Obamacare. While a limited inventory of doctors is typical of most insurance policies both on and off the Obamacare exchanges, it runs counter to the Obama administration’s promise that people won’t have to change doctors under the health care law.
Youth Break With President on Obamacare Support in Poll - More than half of those 18 to 29 years old say they disapprove of Obamacare and half expect it will increase their health-care costs, a survey by Harvard University’s Institute of Politics shows. Four in 10 say they anticipate the quality of their coverage will get worse because of the law. In a finding perhaps even more troubling for the White House, almost half in that age group, the so-called millennials, say they’re unlikely to enroll in insurance through a government exchange, even if eligible. That could put at risk the economics of the Patient Protection and Affordable Care Act, which needs young, healthy people to enroll in large numbers to offset the costs of caring for older, sicker Americans. “There are very few aspects of the health-care initiative that they approve of,” John Della Volpe, the institute’s polling director, said today on a conference call. “They think quality will decrease, that prices will increase, so it’s not surprising that has taken a significant hit to the president’s approval rating.”
Obamacare Will ‘Work Really Well’ By 2017 - Former Obama senior adviser and ABC News contributor David Plouffe said on “This Week” Sunday that the Affordable Care Act will “work really well” when all states run their own health care exchanges and fully expand Medicaid – actions that may not be seen until President Obama is out of office in 2017. “This program was designed to be implemented by the states. And in most of the states that are running their exchanges it’s going quite well,” Plouffe told ABC’s George Stephanopoulos. “You talked about Medicaid expansion. I think it’s just a fact, and it may take until 2017 when this president leaves office, you’re going to see almost every state in this country running their own exchanges eventually and expanding Medicaid. And I think it’ll work really well then.”
Provision in Obamacare Likely to Force Up Cost of Many Family Plans - In an ongoing trend, unrelated to Obamacare, companies have been passing on more and more healthcare costs to employees. However, an ACA gotcha has impacted the way costs are passed on, with families taking a bigger hit than individuals at many companies. Please consider Companies Prepare to Pass More Health Costs to Workers. Many employers are betting that the Affordable Care Act's requirement that all Americans have health insurance starting in 2014 will bring more people into their plans who have previously opted out. That, along with other rising expenses, is prompting companies to raise workers' premium contributions, steer them toward high-deductible plans and charge them more to cover family members.The changes as companies roll out their health plans for 2014 aren't solely the result of the ACA. Employers have been pushing more of the cost of providing health insurance on to their workers for years, and firms that aren't booking much sales growth due to the sluggish economy are under heavy pressure to keep expenses down.A quirk of the Affordable Care Act could make it more appealing for companies to raise rates for family coverage than for individuals, said Vivian Ho, a Rice University health-care economist.Starting in 2015, companies employing 50 or more people must offer affordable health-care coverage to anyone working 30 hours a week or more. But affordability is measured using the cost of individual coverage, capping the cost at 9.5% of income, Ms. Ho said. Raising family rates could help companies recoup costs without running afoul of that limit, she said.
Insurers’ Latest Dodge to Not Cover You when You Need It: The Incredible Shrinking Network -- Today’s must-read Seattle Times article (interactive graphic here and comparison table here) prompts me to write about a huge problem with American health insurance that I’ve been banging against quite personally in recent months. Insurers are actively eliminating must-have hospitals from their networks, while imposing unlimited out-of-pocket charges for out-of-network services. If the provider you need (a pediatric or major-trauma hospital for instance) isn’t in your insurer’s network, you could face financial ruin even though you’re insured. I’ve been deep in the individual health-insurance shopping game recently, shopping for myself in Washington State and for my 22-year-old daughter in Illinois. I even built a web app to compare total costs of different health plans, because there’s really no way to compare them without such a tool. It’s incredibly complex, with all sorts of interacting variables to evaluate. I can’t imagine how someone without my analytical skills (and time to use them) could even begin to do a good job of it — protect themselves effectively and suss out the best deals to do so. Most would have to throw up their hands and throw a dart. To be a smart shopper in this market, you have to be very smart, and have lots of time on your hands. But even I have been completely flummoxed by one big issue: how do I evaluate the networks of providers offered under different insurers and plans? Sure, I can look to see if my doctor’s covered. Great. Big deal. But what if I have a major auto accident? Is Harborview (Seattle’s top-flight regional trauma center) covered? How about Children’s Hospital, our pediatric mecca? (The Swedish Hospital system? (Top-rated for ER intake times, the place I would go for a medium emergency.) Seattle Cancer Care Alliance? (This is the outfit you’re gonna want if you face that horror.)
Insurers Seek to Bypass Health Site —Insurers and some states are continuing to look for ways to bypass the balky technology underpinning the health-care law despite the Obama administration's claim Sunday that it had made "dramatic progress" in fixing the federal insurance website. Federal officials said they had largely succeeded in repairing parts of the site that had most snarled users in the two months since its troubled launch, but acknowledged they only had begun to make headway on the biggest underlying problems: the system's ability to verify users' identities and accurately transmit enrollment data to insurers. One of the leading states operating its own exchange is considering ways to decouple itself from the federal infrastructure it relies on to confirm residents' eligibility for federal tax credits. That technology has been affected by planned and unplanned outages. James Wadleigh, chief information officer of Connecticut's exchange, said he was looking at having a new vendor support identity verification in addition to the federal vendor. He also said he wanted to be able to tap state databases, such as the labor department's, to validate incomes and was seeking a way to prove people were legal residents without depending on U.S. data.
Obamacare’s Drug Coverage Minefield - Yves Smith -- Now that the consumer front end of Healthcare.gov seems to be under control (the insurer interface is another matter), public attention is now shifting to the ultimately more important question of what benefits patients receive, and at what cost. One thing Lambert has stressed in the arbitrariness and therefore inequity in the way similarly situated individuals can wind up in Obamacare. Winding up on the wrong side of a subsidy cutoff line makes a difference. What state you are in will very often make a difference. And another issue he’s mentioned is that while some people will wind up better off, the question is how many people will wind up materially worse off. It’s almost certain that the outcome will be to result in a net negative across all consumers because Obamacare is a stealth handout to insurers and Big Pharma. Big Pharma benefits from a prohibition on drug reimportation. The Wall Street Journal tonight discusses a new “surprise” in Obamacare, that of how drugs are handled. The article notes that the people who are at risk are those who have chronic ailments that are treated with costly drugs. Here’s the nub of the issue (click on image to enlarge): Under the law, patients can’t be denied coverage due to existing conditions or charged higher rates than healthier peers. The law also sets an annual out-of-pocket maximum of up to $6,350 for individuals and $12,700 for families, after which insurers pay the full tab. But depending on the coverage they select, some patients on expensive drug regimens could reach that level fast. Some medications for conditions including hepatitis, rheumatoid arthritis, HIV and cancer can retail for thousands of dollars a month, and some plans require patients to pay as much as 50% of the cost… In general, the lower a plan’s monthly premium, the higher the portion of drug costs patients must bear. But an array of other factors also affect cost to patients—including whether a medication is on the insurer’s covered-drug list, or formulary; in what level, or tier, of coverage it is; and what cost-sharing formula applies to that tier, which can vary from plan to plan even among those offered by the same insurer in the same bronze, silver or other category.
Obamacare Is A Catastrophe That Cannot Be Fixed - I just finished a detailed comparison of my current grandfathered health insurance plan from Kaiser Permanente (kp.org), a respected non-profit healthcare provider, and Kaiser's Affordable Care Act (Obamacare) options. I reviewed all the information and detailed tables of coverage and then called a Kaiser specialist to clarify a few questions. First, the context of my analysis: we are self-employed, meaning there is no employer to pay our healthcare insurance. We pay the full market-rate cost of healthcare insurance. We have had a co-pay plan with kp.org for the past 20+ years that we pay in full because there's nobody else to pay it. Our grandfathered Kaiser Plan costs $1,217 per month. There is no coverage for medications, eyewear or dental. That is $14,604 per year for two 60-year old adults. We pay a $50 co-pay for any office visit and $10 for lab tests. Maximum out-of-pocket costs per person are $3,500, or $7,000 for the two of us. We pay $500 per day for all hospital stays and related surgery; out-patient surgery has a $250 co-pay. The closest equivalent coverage under Obamacare is Kaiser's Gold Plan. The cost to us is $1,937 per month or $23,244 a year. The Gold Plan covers medications ($50 per prescription for name-brand, $19 for generics) and free preventive-health visits and tests, but otherwise the coverage is inferior: the out-of-pocket limits are $6,350 per person or $12,700 for the two of us. Lab tests are also more expensive, as are X-rays, emergency care co-pays and a host of other typical charges. Specialty doctor's visits have a $50 co-pay. The Obamacare Gold Plan would cost us $8,640 more per year. This is a 60% increase. It could be argued that the meds coverage is worth more, but since we don't have any meds that cost more than $8 per bottle at Costco (i.e. generics), the coverage is meaningless to us.
Older Hill aides shocked by Obamacare prices - Veteran House Democratic aides are sick over the insurance prices they’ll pay under Obamacare, and they’re scrambling to find a cure. “In a shock to the system, the older staff in my office (folks over 59) have now found out their personal health insurance costs (even with the government contribution) have gone up 3-4 times what they were paying before,” Minh Ta, chief of staff to Rep. Gwen Moore (D-Wis.), wrote to fellow Democratic chiefs of staff in an email message obtained by POLITICO. “Simply unacceptable.” In the email, Ta noted that older congressional staffs may leave their jobs because of the change to their health insurance. (PHOTOS: 12 Democrats criticizing the Obamacare rollout) Under the Affordable Care Act, and federal regulations, many congressional staffers — designated as “official” aides — were forced to move out of the old heavily subsidized Federal Employees Health Benefits program and into the District of Columbia’s health insurance marketplace exchange. Others designated as “unofficial” were allowed to stay in the FEHB program. Managers had to choose whether aides were “official” or “unofficial” by Oct. 31, and Ta said that wasn’t enough time to make an informed decision about who would benefit and who would lose out by going into the new system. Moore’s office was one of those in which all staff were designated as “official” and pushed into the exchanges. That ended up being a problem for older staff, who weren’t accustomed to paying higher premiums because of their age. But age is one of the few factors insurers can use to adjust prices under Obamacare — and older people will often pay much more than younger people.
Why is Title X important to the success of the ACA? - Roosevelt Institute - video - Roosevelt Institute's fellow Andrea Flynn explains the importance of Title X in relation to the implementation of the Patient Protection and Affordable Care Act (PPACA). Read Flynn's paper: http://www.rooseveltinstitute.org/policy-and-ideas/big-ideas/title-x-factor To download the paper, click here.
Is Health Care Spending Finally Falling? - When it comes to health care, all anyone can talk about these days is Obamacare. And, while that may be understandable, the political furor over the program has obscured a quieter but arguably more consequential development: health-care costs in this country may finally be coming under control. As a new report from the Council of Economic Advisers details, after half a century in which medical spending has well outpaced G.D.P. growth, something has changed. From 2007 to 2010, per-capita health-care spending rose just 1.8 per cent annually. Since then, the annual increase has been a paltry 1.3 per cent. The slowdown in spending is due in part to the recession and the tepid recovery—but not as much as you’d think. A recent paper by the Harvard economists David Cutler and Nikhil Sahni estimated that the recession explained scarcely more than a third of the spending slowdown. Oddly enough, the public debate over Obamacare has also played a role. Just talking about medical costs, it seems, limits medical costs. Kocher, a physician turned venture capitalist (and currently a guest scholar at the Brookings Institution), dubs this “the health-care-policy placebo effect.” As he told me, “When you’ve got politicians going around the country making speeches about how out-of-control health-care spending is killing the economy, health-care providers come to feel that it might make sense to be less aggressive in setting prices.”
Chart: Growth trajectory of national health expenditures - Aaron noted a recent JAMA study titled “The Anatomy of Health Care in the United States.” It turns out it’s chock full of great charts. We like charts! So, I’ll share some over the next few weeks. Here’s one that you’ve no doubt seen before, or part thereof. Still, it’s too nice a chart not to share. It certainly puts the recent slowdown (bottom time series) in perspective, doesn’t it? Unprecedented.
How Americans Die - Is it because death is having a moment? Whatever it is, this new mortality-rate geographic is as grim as it is fascinating. The visualization comes by way of New York City based software developer Matthew Isabel, a former Microsoft project manager who pulled numbers from the CDC's 2013 National Vital Statistics Report. The full CDC analysis (pdf), which is definitely worth a look, plumbs the depths of mortality in 2010. That's the most recent year for which we have comprehensive domestic death data, which Isabel adjusted for age and to reflect rates per 100,000 citizens. Think of it as the broad post-mortem on a range of factors—deaths, death rates, life expectancy, infant mortality, and trends by selected characteritics like age, sex, Hispanic origin, state residence, and cause of death—that the CDC gleaned from death notices "completed by funeral directors, attending physicians, medical examiners, and coroners." From cancer to stroke, diabetes to influenza, alcohol to HIV, and beyond, memento mori hasn't ever looked this neat, tidy even, or been so easy to stomach.
The latest health issue for the elderly: ‘observation purgatory’ in hospitals - Say your mother gets dizzy and falls, so you take her to the hospital where she puts on a gown, lies in a hospital bed, eats hospital food and is attended to by nurses and doctors. She could access the same services as admitted patients, while technically not being considered "admitted" at all, costing her far more out of pocket. She might not even learn this occurred until she is packing to leave. Hospitals consider patients to be in observation status when they are not well enough to go home, but not ill enough for admission. Seniors who receive hospital care are increasingly at risk of being relegated to what I like to call the hospital's "observation purgatory", where they can stay in a hospital bed for longer than 72 hours and not secure premium insurance coverage for expensive extended visits. This change in semantics can have dire consequences, depriving seniors of proper healthcare and leaving them and their families responsible for thousands of dollars of hospital bills. As a geriatrician with more than a decade of direct patient care, I have seen this happen repeatedly. I am disturbed by it, and I am certain it could affect you or someone you love.
HIV Returns In Men Who Showed Signs Of ‘Cure’ - Disappointing news: HIV has returned in the two men who were able to go off antiretroviral medication because of undetectable virus levels after receiving bone marrow transplants for cancer, according to news reports. The Boston Globe first reported the news, which was presented at an AIDS research conference in Florida. The results are preliminary, but researchers noted that they wanted the findings to be released as soon as possible because other scientists were basing studies off of their initial results, according to the Boston Globe. "We felt it would be scientifically unfair to not let people know how things are going, especially for potential patients," the lead scientist of the findings, Dr. Timothy Henrich, of Brigham and Women's Hospital, told The Boston Globe. The findings suggest that HIV reservoirs could be hiding deeper in the body than previously thought. The initial news that the men's HIV had been reduced to undetectable levels made headlines earlier this year, when researchers announced that the men were able to go off their HIV medication for several weeks without any trace of the virus in their systems. The men, who were HIV positive and were taking antiretroviral drugs, both developed Hodgkin's lymphoma. They received the transplants as treatment for the cancer while also taking the antiretroviral medication. HIV was reduced to undetectable levels in both of the men, and they were eventually able to go off of their antiretroviral medication.
Chemotherapy needs gut bacteria to work - Cancer patients may carry powerful weapons against tumors in their intestines. Two independent studies indicate that intestinal bacteria assist chemotherapy drugs in fighting off tumors. Gut microbes are necessary for several types of anticancer therapies to work properly, the studies published in the Nov. 22 Science suggest. In experiments using mice, antibiotics hampered the ability of two types of anticancer treatments to combat lymphoma and skin and colon tumors, Noriho Iida of the U.S. National Cancer Institute in Frederick, Md., and colleagues report. In mice treated with antibiotics, immune therapy and a platinum-containing chemotherapy drug called oxaliplatin failed to fight off cancer, the researchers found. A separate study from Sophie Viaud of the French Institute of Health and Medical Research in Villejuif shows that a chemotherapy drug called cyclophosphamide causes bacteria in the gut to move into the lymph system. Once there, the bacteria trigger production of immune cells that then kill tumor cells. Mice raised without any bacteria and mice treated with antibiotics couldn’t produce as many of these immune cells, and the chemotherapy drug became less effective.
A Gut Reaction - Since low doses of antibiotics have been used to promote weight gain in food animals since the 1950s, it should come as no surprise that America's obesity epidemic may be linked to use of these drugs. For many years scientific studies have illustrated the connection between weight gain and antibiotics, due to their bacteria-killing action. One as early as 1954 found that Navy recruits given daily doses of penicillin to prevent strep infections gained 4.8 pounds over seven weeks compared with the 2.7 pounds gained by participants given a placebo. More recently, researchers have focused their attention on the possibility that antibiotics could be making children fat. New Zealand researchers conducting a large international survey found that boys treated with antibiotics during their first year of life reported higher body mass index (BMI) between the ages of 5 and 8 than boys who had not been similarly treated. A smaller Danish study found the use of antibiotics in infancy increased the risk of higher-than-average weight gains in childhood. Meanwhile, New York University researchers discovered that when infants were given antibiotics before the age of 6 months, they were 22 percent more likely to be overweight at 38 months than infants who had not been exposed to the drugs. Despite the relatively small weight gains in these children, the findings are significant.
A government ban on 23andMe's genetic testing ignores reality - Just last week, the US Food and Drug Administration (FDA) issued a bold shot across the bow for the burgeoning consumer genomics industry. Issuing a letter to halt the genetic testing offered by 23andMe, perhaps the most prominent company of its kind, the agency has sent a clear message to the nascent sector: scale back, or be shut down. But there is also a message that bears returning to the agency: regulating a 21st century technology with 20th century policy, no matter how well-intentioned, is liable to do more harm than good. To be clear, for all its boldness, the FDA ban on 23andMe's direct-to-consumer (DTC) genomics service is predicated on sensible public health concerns. After all, consumers receiving noisy, nebulous genetic information frequently make medical decisions that are misinformed, harmful, and drive up systemic healthcare costs. To illustrate, a grain-of-salt report that I carry a faulty gene raising my risk of Alzheimer's may spur me onto requesting an expensive follow-up diagnostic test, even though current evidence linking single genetic sequence mutations to disease development is largely lackluster. As a medical student, I know firsthand how difficult it is for clinicians to turn down these requests – the personal, professional, and legal risks of being wrong make this all but impossible.
There They Go Again, Again… – Johnson and Johnson Loses Two Civil Cases, Makes $2.5 Billion Settlement Based on Claims it Withheld Safety Data on its Products - After various rumors, the report of the settlement appeared in a New York Times article on November 19, 2013. The basics were, Johnson & Johnson and lawyers for patients injured by a flawed hip implant announced a multibillion-dollar deal on Tuesday to settle thousands of lawsuits, but it was not clear whether the deal would satisfy enough claimants. Under the agreement, the medical products giant would pay nearly $2.5 billion in compensation to an estimated 8,000 patients who have been forced to have the all-metal artificial hip removed and replaced with another device. Separately, the company has agreed to pay all medical costs related to such procedures, expenses that could raise the deal’s cost to Johnson & Johnson to $3 billion, people familiar with the proposal said. Under the plan, the typical patient payment for pain and suffering caused by the device would be about $250,000 before legal fees. Based on standard agreements, plaintiffs’ lawyers would receive about one-third of the overall payout, or more than $800 million, with those who negotiated the plan emerging as big winners. An earlier NY Times article on a rumored version of the settlement emphasized that relevant litigation had featured strong allegations that Johnson and Johnson's DePuy subsidiary hid what it knew about the faults of the device,
MRSA in UK Turkeys Raises Questions of Communication, Transparency and Risk - Just in time for our Thanksgiving — and in the ramp-up to English Christmas, for which turkey is a traditional dish — the UK’s Animal Health and Veterinary Laboratories Agency announced that livestock-associated MRSA, drug-resistant staph, has been found in UK poultry for the first time. From their not-very-informative press release: The Animal Health and Veterinary Laboratories Agency (AHVLA) has identified the presence of Livestock-Associated Meticillin Resistant Staphylococcus Aureus (LA-MRSA) in poultry on a farm in East Anglia… Once the poultry have been slaughtered and sold the owner will carry out cleansing and disinfection of their accommodation to ensure the next birds do not become colonised when they arrive on site. The AHVLA will revisit the farm after depopulation and thorough cleansing and disinfection to determine whether LA-MRSA is still present. Media reports filled in some of the details. The announcement was covered by the BBC, Mirror, and Express, but (as I’ll explain below) their stories are short on independent reporting and don’t give their readers the information they need. The most complete news-gathering looks to me to be in the Norwich Evening News, in a poultry-growing area: Specialist Norfolk poultry auctioneer Fabian Eagle says he has not been given any details of the country’s first case of low-risk MRSA in turkeys. Mr Eagle, a national member of the poultry industry’s stakeholder group, said: “We’ve been kept totally in the dark. The AHVLA (Animal Health Veterinary Laboratory Agency) are keeping everything close to their chest,”
Politics Counts: Who Benefits From Farm Subsidies, Food Stamps - It’s no secret that the current battle over the Farm Bill, which is stalled in Congress, has been a partisan slog. Democratic states and House districts, which hold large urban populations, are fighting to defend food-stamp money against Republican efforts to sharply cut spending. Meanwhile, Democrats and Republicans are also trying to reach a deal on restructuring agricultural subsidies to end direct payments and beef-up crop insurance and other protections instead. Amid this complex fight, the reality of who benefits is also complicated: Farm subsidies don’t follow the electoral map, and neither do food stamps. That is, it’s not just Republican states and areas that benefit from farm subsidies or just big Democratic states that benefit from food stamps — the money for both items is spread pretty widely across the spectrum. If you consider the top 10 states for agriculture subsidies for 2012, according to the Environmental Working Group, it’s a mix of Democratic and Republican states. That’s a lot of money for those Democrat-leaning states. And if you extend the time period and look at farm subsidies over the past 10 years, California, a strongly Democratic state, would be on that list as well. The numbers for SNAP, the Supplemental Nutrition Assistance Program commonly referred to as food stamps, show an even more complicated picture. The states with the greatest percentage of people using SNAP actually tend to vote Republican in presidential races — and they are mostly not the big urban states most imagine.
GMO Creep Into the Sweet Corn Supply - Friends of the Earth recently did a sampling of fresh, frozen, and canned sweet corn available at US supermarkets and farmers’ markets, to gauge the presence of GMO sweet corn, a direct Frankenfood, in our food supply. Although some varieties of GM sweet corn have been approved for commercialization in the US for over fifteen years, it wasn’t until the 2011 commercialization of Monsanto’s Seminis Performance Series variety that anyone’s made a real push to infect the food supply with this direct food GMO product. (Most GM corn is field corn, not used directly for human food, but destined for animal feed in factory farms, ethanol, and processed food.) This Monsanto product is a multi-poison “stacked variety”, internally oozing its own Bt poison and resistant to glyphosate. Herbicide tolerant GMOs merely assimilate the herbicide. So when you eat this product it has heavy internal concentrations of two poisons. You can’t wash them off – they’re contained within the cells of the food.
Policy Pennings on Corn Supply -- It could be worse than we thought. With record corn production in a year with heavy spring rains and late planting problems, the price drop in recent weeks suggests that corn demanders see the crop-reducing effects of 2012 drought as an aberration—since apparently improved seed genetics successfully protected 2013 corn production from moderate drought and planting problems. Compared to the 2012 corn crop, the November WASDE reports record production, increased crop utilization—both domestically and internationally—and the year-ending stocks increasing by nearly 1.2 billion bushels of corn. The result is a projected season average corn price received by farmers of $4.50 per bushel for the 2013 corn crop, a drop of $2.93 per bushel from a year earlier. For most farmers, even on the most productive land, $4.50 is getting frighteningly close to their cost of production—and for some-to-many land costs would not be covered. This leaves little margin on the downward side before things get really scary. Can it get any worse? We think that is a distinct possibility.Consider the following scenario, suppose that: 1) the USDA has underestimated the corn crop by 100 million bushels and 2) it has also overestimated domestic and export consumption by 200 million bushels. And, as we have further considered the November WASDE numbers, those possibilities seem very real.
Warsaw Climate Talks: Bad News for Farming - Disputes about money between rich and poor countries hamstrung the latest round of negotiations over a new climate treaty that’s planned to be finalized in 2015. Exasperated environmentalists and negotiators representing poor and developing nations stormed out of the meetings in Warsaw last week, fed up with what they saw as apathy and recalcitrance by mercenary governments of wealthy nations. The talks concluded Saturday with a small number of agreements that were roundly criticized for being dangerously pedestrian; no commitments were made in Warsaw that would meaningfully reduce future greenhouse gas levels. Exasperated environmentalists and negotiators representing poor and developing nations stormed out of meetings last week, fed up with what they see as apathy and recalcitrance by wealthier nations. That alone is bad news for farmers: Global warming is one of agriculture’s greatest foes, and an international failure to slow it down will continue to hit food production. Five days of scheduled negotiations dealing with farming fizzled out last week in Warsaw before they could even begin. They were blocked by India and other developing countries wielding procedural tools. This despite high hopes that the talks could have led to assistance for farmers in the developing world as they struggle to adapt to new weather regimes.
Humans are becoming more carnivorous. - The fast-growing economies of China and India are driving a global increase in meat consumption, cancelling out decreases elsewhere, according to a comprehensive study of global food consumption. The work, published today in Proceedings of the National Academy of Sciences1, takes a detailed look at what people eat, as well as trends from one country to the next. It is also the first time that researchers have calculated humanity's trophic level, a metric used in ecology to position species in the food chain. The study, led by Sylvain Bonhommeau, a fisheries scientist at the French Research Institute for Exploitation of the Sea in Sète, estimates that humanity's global median trophic level was 2.21 in 2009, which puts us on a par with other omnivores, such as pigs and anchovies, in the global food web. “We are closer to herbivore than carnivore,” says Bonhommeau. “It changes the preconception of being top predator.”
In New Jersey Pines, Trouble Arrives on Six Legs - In an infestation that scientists say is almost certainly a consequence of global warming, the southern pine beetle is spreading through New Jersey’s famous Pinelands. It tried to do so many times in the past, but bitterly cold winters would always kill it off. Now, scientists say, the winters are no longer cold enough. The tiny insect, firmly entrenched, has already killed tens of thousands of acres of pines, and it is marching northward. Scientists say it is a striking example of the way seemingly small climatic changes are disturbing the balance of nature. They see these changes as a warning of the costly impact that is likely to come with continued high emissions of greenhouse gases. The disturbances are also raising profound questions about how to respond. Old battles about whether to leave nature alone or to manage it are being rejoined as landscapes come under stress. The New Jersey situation resembles, on a smaller scale, the outbreak of mountain pine beetles that has ravaged tens of millions of acres of forest across the Western United States and Canada. That devastation, too, has been attributed to global warming — specifically, the disappearance of the bitterly cold winter nights that once kept the beetles in check.
41 Scientists Warn Obama Admin Against Burning Trees To Produce Electricity - This week 41 leading scientists sent a letter the the Environmental Protection Agency calling on the agency to use caution when determining what biomass — wood or plant materials — to use for power plants. The letter states that burning trees to produce electricity increases carbon emissions and contributes to air pollution. Burning other biomass, such as perennial grasses or harvest residues that can either regrow quickly or are not needed for other purposes, is quite different from burning forests. While the biomass industry argues that since trees grow back they offer a carbon neutral form of energy, recent research shows that burning trees for electricity is highly inefficient. An analysis from the National Resources Defense Council states that, “By substituting trees for coal, power plants avoid fossil-fuel carbon emissions”: “But trees are approximately half water by weight, which means they contain less potential energy per unit of carbon emissions than coal and other fossil fuels do. In other words, to get the same amount of energy from trees as from fossil fuels, many more trees have to be burned, resulting in 40 percent more carbon emissions at the smokestack per unit of energy generated. And even if trees are replanted immediately, it takes many decades for a tree to grow and absorb all the carbon released from the burning of just one tree.” The EPA is in the final stages of a three-year process of developing rules to properly quantify biomass carbon emissions from power plants burning biomass. In the letters scientists urge the EPA to establish a biomass regulatory system that is based on sound science and ensures adequate protections for forests and the climate.
Shanghai Warns Children to Stay Indoors on Air Pollution - Shanghai warned children and the elderly to stay indoors as the level of the most harmful pollutants exceeded more than 10 times the level deemed safe by the World Health Organization. The air pollution index in the nation’s commercial hub exceeded 300 as of 1:41 p.m., placing it in the “severe” range and the highest of six levels, the Shanghai Environmental Monitoring Center said on its website today. PM2.5 pollutants -- particles smaller than 2.5 microns in diameter that pose the biggest health risk -- reached 288.9, more than 10 times the WHO threshold, before falling to 211.5. Heavy pollution may undermine Shanghai’s plans to attract foreign investment and multinational firms, as the city implements a free-trade zone as part of a broader goal to become a global financial and logistics center by 2020. Today’s smog warning comes a day after about 35,000 runners from 84 countries turned out for the 2013 Shanghai International Marathon, according to the People’s Daily newspaper. Pollution levels began rising on the day of the Shanghai marathon, with the air quality index surpassing 200 at 1 p.m., according to the center. In October, the Shanghai government announced a plan to cut 2012 PM2.5 readings by 20 percent by 2017. “The sky was pretty bad,” said Bridget O’Donnell, a U.S. citizen living in Shanghai who ran in the race. “It didn’t really affect me during the race but toward the end of the race I started to feel a little sick. After the race and today my lungs are really hurting.”
Photos: Streamflow- End of the Colorado River, USGS - In a natural environment, rivers will get larger and contain more water the further they flow, thanks to water coming in via tributaries. Rivers also merge, resulting in even higher streamflows. But in a human world, this doesn't always happen. Take the mighty Colorado river, which carved out the Grand Canyon in Arizona. People make use of the river as it flows towards the Gulf of California, mainly for irrigation uses and to supply water for cities and people in that region. The river truly gets "used up". Less than 80 years ago, the Colorado River flowed unhindered from northern Colorado through the Grand Canyon, Arizona, and Mexico before pouring into the Gulf of California. But as this NASA Earth Observatory satellite photo from September 2000 shows, irrigation and urban water needs now prevent the river from reaching its final destination. Rather, the Colorado River just disappears into the desert sands. The Colorado River can be seen in dark blue at the topmost central part of this image. The river comes to an end just south of the multicolored patchwork of farmlands in the northwestern corner of the image and then fans out at the base of the Sierra de Juarez Mountains.
Australia's spring was the warmest on record, climate records show - The spring of 2013 has been Australia's warmest on record. Mean temperatures for the season were 1.57C above the 1961-1990 average, surpassing the previous record of 1.43C (set in 2006) by 0.14C. Daytime maximum temperatures were also the highest on record, coming in 2.07C above average and 0.24C above the previous record (also set in 2006), while overnight minimum temperatures were the fourth-warmest on record.The warmth was most dramatic in September, which saw a mean temperature anomaly of +2.75C, setting a new monthly record by more than a degree. October was also a very warm month, 1.43C above average. Temperatures during November were closer to normal, 0.52C above average, but were still warm enough to complete a record spring.The warmth was extensive, with virtually the entire country experiencing above-average mean temperatures for the spring. It was the warmest spring on record over an area covering most of western Queensland (sufficient to give Queensland its warmest spring on record), and extending into the eastern interior of the Northern Territory.Records were also set on the west coast around Perth, on the east coast around Sydney, and on parts of the Nullarbor. The spring ranked in the 10 warmest on record over 83% of the country.Strong westerly winds were a feature of the prevailing weather over southern parts of the continent during September and October. This brought unusually wet weather to western Tasmania, southwest Victoria, and southwest Western Australia — regions that are exposed to maritime westerlies.
Cold weather in U.S.: With a large chunk of the U.S. having endured one of the coldest Thanksgiving holidays in years and even more brutally cold weather in the forecast over the next few days, 2013 is poised to have daily record lows outnumber daily record highs for the first time in 20 years. That’s a stark reversal from last year — the warmest year on record in the U.S. — when record daily highs dwarfed record lows by a staggering 4-to-1 ratio. It’s also a stark reminder of the vagaries of short-term natural variability set against the backdrop of long-term global warming. ----- December will be a crucial month for determining if lows outpace highs for the year. The last time daily record lows outnumbered daily record highs in the U.S. was in 1993. The Arctic air mass moving south from Canada, which is set to send temperatures plunging from Seattle to Texas by the end of this week, tilts the odds in favor of cold temperature records prevailing. Even with the cold snap in the U.S., the world has continued to see above-average temperatures overall, with 2013 expected to wind up among the top 10 warmest on record. The last month to have global average surface temperatures below the 20th century average occurred in February of 1985.
Sea Level Experts Concerned About ‘High-End’ Scenarios -- A survey of nearly 100 experts on sea level rise reveals that scientists think there is a good chance the global average sea level rise can be limited to less than 3.3 feet by 2100 if stringent reductions in planet-warming greenhouse gases are rapidly instituted. However, the survey, which is the largest such study of the views of the most active sea level researchers ever conducted, found that if manmade global warming were to be on the high end of the scale — 8°F by 2100 — the global average sea level is likely to jump by between 2.3 and 3.9 feet by the end of this century. Worse yet, such a temperature increase could boost sea levels by up to 9.9 feet by 2300, the study found. Such a drastic increase in sea level would not just put heavily populated coastal cities at risk of flooding, but could also jeopardize the existence of low-lying island nations, the study found. The study solicited sea level rise projections from the most active researchers in the field, scientists who had published at least six papers on the subject during the previous 5 years. Since computer modeling approaches and other methods have yielded a wide range of projections, a poll of expert opinions provided Horton and his colleagues a different way of estimating the odds of particular sea level rise scenarios.
2 °C rise will be a disaster say leading scientists - Countries round the world have pledged to try and limit the average global temperature rise to 2 °C above pre industrial figures. That’s way too high and would threaten major dislocations for civilization say a group of prominent scientists. The goal at present – to limit global warming to a maximum of 2 °C higher than the average for most of human history – “would have consequences that can be described as disastrous,” say 18 scientists in a review paper in the journal PLOS One. With a 2 °C increase, “sea level rise of several meters could be expected,” they say. “Increased climate extremes, already apparent at 0.8 °C warming, would be more severe. Coral reefs and associated species, already stressed with current conditions, would be decimated by increased acidification, temperature and sea level rise." The paper’s lead author is James Hansen, now at Columbia University Hansen’s fellow authors include the economist Jeffrey Sachs of Columbia University and the biologist Camille Parmesan, of the University of Plymouth in the UK and the University of Texas at Austin, USA. Their argument is that humanity and nature –“the modern world as we know it” – is adapted to what scientists call the Holocene climate that has existed for more than 10,000 years – since the end of the Ice Age, the beginnings of agriculture and the first settlement of the cities. Warming of 1 °C relative to 1880–1920 keeps global temperature close to the Holocene range, but warming of 2°C, could cause “major dislocations for civilization.”
Emissions of Methane in U.S. Exceed Estimates, Study Finds - Emissions of the greenhouse gas methane due to human activity were roughly 1.5 times greater in the United States in the middle of the last decade than prevailing estimates, according to a new analysis by 15 climate scientists published Monday in The Proceedings of the National Academy of Sciences. The analysis also said that methane discharges in Texas and Oklahoma, where oil and gas production was concentrated at the time, were 2.7 times greater than conventional estimates. Emissions from oil and gas activity alone could be five times greater than the prevailing estimate, the report said. The study relies on nearly 12,700 measurements of atmospheric methane in 2007 and 2008. Its conclusions are sharply at odds with the two most comprehensive estimates of methane emissions, by the Environmental Protection Agency and an alliance of the Netherlands and the European Commission. The E.P.A. has stated that all emissions of methane, from both man-made and natural sources, have been slowly but steadily declining since the mid-1990s. In April, the agency reduced its estimate of methane discharges from 1990 through 2010 by 8 to 12 percent, largely citing sharp decreases in discharges from gas production and transmission, landfills and coal mines. The new analysis calls that reduction into question, saying that two sources of methane emissions in particular — from oil and gas production and from cattle and other livestock — appear to have been markedly larger than the E.P.A. estimated during 2007 and 2008.
Another reason to worry about methane: It’s leaking out of the Arctic Ocean hella fast - We often talk about greenhouse gases and carbon dioxide as if they are one and the same. CO2 is by far the most prevalent greenhouse gas, but while much less methane is released into the atmosphere, methane is about 21 times more potent over a 100-year period. And now we’ve got another reason to worry about methane. New research published in the journal Nature Geoscience finds that “significant quantities of methane are escaping the East Siberian Shelf as a result of the degradation of submarine permafrost over thousands of years.” Methane is stored on the Arctic Ocean floor, and is kept there by a layer of permafrost. As the permafrost thaws due to global warming, the methane escapes. Extra methane has also been escaping in recent years due to stronger and more frequent storms that shake up the ocean and bring gases to the top more quickly. As the Fairbanks Daily News-Miner notes, there are also carbon stores being similarly affected. And the methane release creates a feedback loop: More methane causes more warming, which causes more rapid methane release.
Off Siberia’s Arctic coast, the seafloor belches methane - Thawing permafrost gets a lot of attention as a positive feedback that could amplify global warming by releasing carbon dioxide and methane, both of which are greenhouse gases. Because of this, a lot of effort goes into studying Arctic permafrost. An international group of researchers led by Natalia Shakhova at the University of Alaska Fairbanks has been plying the remote waters of the Siberian Shelf for about a decade to find out how much methane was coming up from the thawing permafrost. They didn’t expect to find it bubbling. The researchers have discovered a number of these bubbling plumes, but it’s difficult to figure out just how important they are to the total amount of methane escaping from the Siberian Shelf. To make progress toward that end, their latest work involved surveys around the Lena River Delta to measure methane in and above the water and learn more about the bubble plumes in the area by measuring them using sonar. Apart from being unusual, the bubbles are actually an important phenomenon. Some of the methane doesn't form large bubbles. This moves slowly through the sediment and water and is oxidized by microbes, becoming CO2, which is less potent as a greenhouse gas, molecule-for-molecule, than methane. Large, buoyant bubbles take the express route, heading straight for the atmosphere. The sonar work found areas where bubbles were seeping out of the sediment all around the delta. Using their methane measurements and the density of the bubbles picked up with the sonar, the researchers revised their estimate of the total amount of methane being released from the Siberian Shelf. The number roughly doubled to 17 billion kilograms per year.
Warm Arctic Waters Emit Carbon, Though Region is Carbon Sink Overall - The Arctic Ocean has has long been known as a carbon sink, but a new study suggests that while the frigid waters do store large quantities of carbon, parts of the ocean also emit atmospheric carbon dioxide. Researchers from MIT constructed a model to simulate the effect of sea ice loss in the Arctic, finding that as the region loses its ice, it is becoming more of a carbon sink, taking on about one additional megaton of carbon each year between 1996 and 2007. But while the Arctic is taking on more carbon, the researchers found, paradoxically, the regions where the water is warmest are actually able to store less carbon and are instead emitting carbon dioxide into the atmosphere. While the Arctic region as a whole remains a large carbon sink, the realization that parts of the Arctic are carbon emitters paints a more complex picture of how the region is responding to global warming."People have suggested that the Arctic is having higher productivity, and therefore higher uptake of carbon," said Stephanie Dutkiewicz, an MIT research scientist. "What's nice about this study is, it says that's not the whole story. We've begun to pull apart the actual bits and pieces that are going on."
Mining, Fracking, And Drilling Have Changed Public Lands From Carbon Sinks To Carbon Polluters - A report released Thursday by the Center for American Progress finds that our nation’s forests, parks, grasslands, and other onshore public lands in the continental United States are the source of 4.5 times more carbon pollution than they are able to naturally absorb. This imbalance is primarily due to the large quantities of coal, oil, and natural gas that are extracted from public lands. 42.1 percent of the country’s coal, 26.2 percent of its oil, and 17.8 percent of its natural gas are currently sourced from public lands both onshore and offshore. Using data from the United States Geological Survey and Stratus Consulting, the CAP analysis determined that when combusted, fossil fuels extracted from public lands are the source of 1,154 million metric tons of carbon dioxide annually, while those same lands absorb only 259 million metric tons every year. As the authors wrote, the carbon sink that should be our national parks, forests, and other public lands is now “clogged.” The president’s “all of the above energy” plan calls for continued expansion of mining and drilling on the 700 million acres of public lands managed by the federal government — contributing to high levels of carbon pollution.
Dangerous Global Warming Closer Than You Think, Climate Scientists Say - Abrupt climate change is not only imminent, it's already here. The rapid dwindling of summer Arctic sea ice has outpaced all scientific projections, which will have impacts on everything from atmospheric circulation to global shipping. And plants, animals and other species are already struggling to keep up with rapid climate shifts, increasing the risk of mass extinction that would rival the end of the dinosaurs. So warns a new report from the U.S. National Research Council. That's exactly why longtime climate scientist James Hansen and a panoply of scientists and economists are urging in another new paper that current efforts to restrain global warming are woefully inadequate. In particular, global negotiations to limit global warming to no more than 2 degrees Celsius risk "wrecking the planet," in the words of lead author Hansen, recently retired head of the Goddard Institute for Space Studies and a researcher at Columbia University's Earth Institute. "We started this paper to provide a basis for legal actions against governments for not doing their jobs and protecting the rights of young people and future generations," Hansen said of the paper, entitled "Assessing 'Dangerous Climate Change.'" "We can't burn all these fossil fuels. There is no recognition of this in government policies." The paper, published in PLOS ONE, lays out the case for why fossil fuel emissions to date are dangerous enough to permanently alter the planet's climate—raising CO2 concentrations in the atmosphere above 400 parts-per-million, or levels not seen in at least 3 million years. Global emissions of CO2 from burning fossil fuels—which set another new high in 2012, according to the Global Carbon Project—must decline to zero new pollution within the next few decades, according to the analysis.
Climate change ‘tipping points’ imminent - "Our report focuses on abrupt change, that is, things that happen within a few years to decades: basically, over short enough time scales that young people living today would see the societal impacts brought on by faster-than-normal planetary changes," . The report, "Abrupt Impacts of Climate Change: Anticipating Surprises," is available from the National Research Council. Abrupt changes are already apparent, the authors noted: the number of serious wildfires has increased dramatically over the past decade, farmers are noticing hotter average temperatures that affect their crop yields, animals and plants are moving up mountainsides to reach cooler temperatures, and the Artic sea ice is melting back more and more each summer."A key charge to the committee was to try to identify the parts of the climate system where we would expect to see tipping points – major changes in ocean currents or atmospheric circulation – but also trying to determine how even gradual climate change might trigger tipping points in systems that are affected by climate change," he wrote. Changes in ocean temperatures and acidity, for example, could reach a threshold that would precipitate a crash in coral reef ecosystems, he said. But global change could also lead to economic and social impacts, much of this centered around food and water resources and the likelihood of international conflict to secure them. The report emphasizes the need to monitor Earth's ecosystems for early signs of serious change so that we can act to avoid them.
Warsaw Climate Conference Shows Capitalism Root of Climate Failure - SPIEGEL - When the United Nations Climate Change Conference wrapped up in Warsaw the weekend before last, it did, despite what most observers and disappointed NGO representatives believe, yield a result. It just wasn't officially announced: the termination of the at-least symbolic general agreement that urgent action must be taken to counter global warming. In other words, climate change has been definitively removed from the global policy agenda. The intense concern over climate change triggered by Intergovernmental Panel on Climate Change reports in 2007 and widely popularized by Al Gore's movie, "An Inconvenient Truth" -- a concern that led even Angela Merkel to make an appearance in the Arctic as the "climate chancellor," decked out in a red all-weather jacket -- actually dissipated a while ago, but no one wanted to say so out loud. The United States' lack of interest in an international treaty is dressed up by its argument that gas extracted by fracking is more climate-friendly than coal, while in Japan, the Fukushima disaster and resulting phase-out of nuclear power has provided those responsible with an excellent argument for why the country now needs to burn more coal in order to stay economically competitive. Hannelore Kraft, governor of the German state of North Rhine-Westphalia, feels much the same way about her own state. And Australia, Canada, Poland and Russia have never really grasped why global warming should stop anyone from burning everything the oil rigs, mines and pipelines have to offer in the first place.
Europe and Its Slippery Energy Slope - Europe, at present the world's largest market and largest economic bloc, is in decline and living standards are in danger. That was the sober message at an energy conference here, delivered by a battery of speakers from across eastern Europe. The narrative is that energy is what is dragging Europe down – not low birthrates and pervasive social-safety networks, but increasing dependence on expensive energy imports and hopelessly tangled markets. Although delegates gathered to discuss the particular problems of eastern Europe, many had comments about the energy dependence across Europe; its labyrinthine regulations in nearly all 28 countries, its inability to form capital for large projects like nuclear, and governments intruding into the market. The result is a patchwork of contradictions, counterproductive regulations, political fiats and multiple objectives that leave Europeans paying more for energy than they need to and failing to develop indigenous sources, such as their own shale gas deposits in Ukraine and Poland. It also leaves countries dependent on capricious and expensive gas from Russia, unsure of whether they can build needed electric generating plant in the future and poorly interconnected, sometimes by both gas pipelines and electric lines.
ALEC calls for penalties on ‘freerider’ homeowners - An alliance of corporations and conservative activists is mobilizing to penalize homeowners who install their own solar panels – casting them as "freeriders" – in a sweeping new offensive against renewable energy, the Guardian has learned. Over the coming year, the American Legislative Exchange Council (Alec) will promote legislation with goals ranging from penalising individual homeowners and weakening state clean energy regulations, to blocking the Environmental Protection Agency, which is Barack Obama's main channel for climate action. Details of Alec's strategy to block clean energy development at every stage – from the individual rooftop to the White House – are revealed as the group gathers for its policy summit in Washington this week. About 800 state legislators and business leaders are due to attend the three-day event, which begins on Wednesday with appearances by the Wisconsin senator Ron Johnson and the Republican budget guru and fellow Wisconsinite Paul Ryan. Other Alec speakers will be a leading figure behind the recent government shutdown, US senator Ted Cruz of Texas, and the governors of Indiana and Wyoming, Mike Pence and Matt Mead.
‘Extremely dangerous’ radioactive material stolen in Mexico: IAEA -- Thieves in Mexico have stolen a truck containing potentially "extremely dangerous" radioactive material used in medical treatment, the UN atomic watchdog said on Wednesday. The truck was transporting a cobalt-60 teletherapy source from a hospital in the northern city of Tijuana to a radioactive waste storage centre when it was stolen in Tepojaco near Mexico City, the International Atomic Energy Agency said. "At the time the truck was stolen, the source was properly shielded. However, the source could be extremely dangerous to a person if removed from the shielding, or if it was damaged," it said. The IAEA said it was informed about the December 2 theft by Mexico's CNSNS nuclear security authority.The material could not be used in a conventional nuclear weapon but could in theory be put in a so-called "dirty bomb" -- an explosive device spreading the radioactive material over a wide area. Experts have long warned about the danger posed by the large amounts of such material held in hospitals and other locations around the world under insufficient security.
Mass Die-Off of West Coast Sealife: Fukushima Radiation … Or Something Else? - NBC Nightly News reports that a mass die-off of starfish up and down the West Coast of North America is puzzling scientists: Brian Williams, anchor: Something is killing the starfish and they don’t know why. They have been dying in record numbers on the West Coast. [...] Pete Raimondi, marine biologist: It’s happened so rapidly that some species are just missing. [...]Miguel Almaguer, reporter: An epidemic affecting waters from Alaska to Southern California causing millions of starfish to fall apart and melt away. [...] Two species that used to thrive here have now vanished. [...] King5 news in Seattle reports that scientists have tested for radiation, and found none: It’s not just sea stars. There have been widespread reports of mysterious injury to Alaskan seals. The Alaska Dispatch reports:Scores of dead and sick ringed seals — some with open wounds, unusual hair loss and internal ulcers — … began washing up in summer 2011 in Western Alaska.Even today, a few seals continue to trickle ashore, biologists said. But the cause of the illness remains a mystery, despite an international effort to identify it. Some people believe radiation from the Fukushima nuclear power plant disaster in Japan in March 2011 is a factor. That’s never been proven. It hasn’t been disqualified, either. More than a year ago, 15 out of 15 bluefin tuna tested in California waters were contaminated with radioactive cesium from Fukushima. Associated Press reports that both scientists and native elders in British Columbia say that sockeye salmon numbers have plummeted:
Korea and world fear Fukushima’s radiation - Despite being the nation nearest to Japan, Korea remained relatively calm after the March 2011 disaster at the Fukushima Daiichi nuclear plant. But more than two years after the nuclear plant’s meltdown, the fear of radiation has increased in Korea after a series of revelations about contaminated water flowing into the Pacific. The Korean government is trying to say that consumer anxiety over the safety of Japanese products in particular is being whipped up by irresponsible postings on the Internet and through social network services. Prime Minister Chung Hong-won even said he would direct severe punishment at people who spread unfounded, radiation-related rumors. But fear continued to rise and fish consumption fell regardless of where the fish came from, affecting local fishermen and fish retailers. As a result, the Korean government decided on Sept. 6 to ban fish imports from eight prefectures surrounding the crippled Fukushima Daiichi nuclear complex to calm people down. Korea had banned 26 agricultural products from 13 prefectures, but the import of fish products was relatively unaffected, according to the Ministry of Food and Drug Safety.
Insight - Fukushima water tanks: leaky and built with illegal labor (Reuters) - Storage tanks at the Fukushima nuclear plant like one that spilled almost 80,000 gallons of radioactive water this year were built in part by workers illegally hired in one of the poorest corners of Japan, say labor regulators and some of those involved in the work. "Even if we didn't agree with how things were being done, we had to keep quiet and work fast," said Yoshitatsu Uechi, 48, a mechanic and former bus driver, who was one of a crew of 17 workers recruited in Okinawa and sent to Fukushima in June 2012 - among the thousands of workers from across Japan who have put together the emergency water tanks and stabilized the plant after three reactor meltdowns that were triggered by the March 2011 earthquake and tsunami. The Okinawa crew was recruited by Token Kogyo, an unregistered broker, and passed on to work at the Fukushima plant under the direction of Tec, a larger contractor which reported to construction firm Taisei Corp, records show. That practice of having workers hired by a broker but managed by another contractor is banned under Japanese law to protect workers from having their wages skimmed and to clarify who is responsible for their safety. In September, Okinawa labor regulators sanctioned Token Kogyo after investigating a complaint by Uechi and concluding the broker improperly sent workers to Fukushima, said an official with knowledge of the order, which was not made public. The official said Token Kogyo did not have the required license to dispatch workers. Japan's labor laws also prohibit third-party brokers from sending workers to construction jobs like the tank assembly where the Okinawa crew was employed.
Fukushima Clean-Up Chief Admits Contaminated Water will be Dumped into Ocean - ABC recently held an exclusive interview with Dale Klein, the former chairman of the US Nuclear Regulatory Commission (NRC) and now chairman of the Fukushima Monitoring Committee, in which he admitted that many more accidents are bound to happen at the stricken nuclear site before the clean-up is finished, and that the contaminated water collected will eventually have to be dumped into the sea. “I think the best word to use with Fukushima is challenging,” he said. In order to keep cool the nuclear fuel rods stored at the damaged power plant in the Fukushima prefecture, TEPCO has been forced to pump millions of litres of water into the reactors, but this process heavily contaminates the water meaning that it must later be stored in special tanks. The facility already boasts thousands of tanks full of radiated water, and some of those tanks have infamously leaked into the Pacific Ocean. Klein admits that TEPCO’s biggest challenge is treating and storing this ever growing volume of contaminated water. Suggesting that once the water is sufficiently treated to remove most of its radioactive elements, it will then be dumped back into the ocean.
They’re Going to Dump the Fukushima Radiation Into the Ocean - Tepco is planning on dumping all of the radioactive water stored at Fukushima into the ocean. The industry-controlled nuclear regulators are pushing for dumping the radiation, as well. As EneNews reports: Juan Carlos Lentijo, head of IAEA’s mission to Fukushima Daiichi, Dec. 4, 2013: “Controlled discharge is a regular practice in all the nuclear facilities in the world. And what we are trying to say here is to consider this as one of the options to contribute to a good balance of risks and to stabilize the facility for the long term.”Shunichi Tanaka, chairman of Japan’s Nuclear Regulation Authority, Dec. 4, 2013: “You cannot keep storing the water forever. We have to make choice comparing all risks involved.”Xinhua, Dec. 4, 2013: Lentijo said that TEPCO should weigh the possible damaging effects of discharging toxic water against the total risks involved in the overall decommissioning work process. [...] Tanaka highlighted the fact that while highly radioactive water could be decontaminated in around seven years, the amount of water containing tritium will keep rising, topping 700,000 tons in two years. [...] nuclear experts have repeatedly pointed out that [tritium] is still a significant radiation hazard when inhaled, ingested via food or water, or absorbed through the skin. [...] fisherman, industries and fisheries bodies in the Fukushima area and beyond in Japan’s northeast, have collectively baulked at the idea of releasing toxic water into the sea [...] TEPCO will be duty-bound to submit assessments of the safety and environmental impact [...]
Bloomberg LP Launches First Tool That Measures Risk of 'Unburnable Carbon' Assets - In a move that underscores Wall Street's growing unease over the business-as-usual strategy of the world's fossil fuel companies, Bloomberg L.P. unveiled a tool last week that helps investors quantify for the first time how climate policies and related risks might batter the earnings and stock prices of individual oil, coal and natural gas companies. The company's new Carbon Risk Valuation Tool is available to more than 300,000 high-end traders, analysts and others who regularly pore over the stream of information that's available through Bloomberg's financial data and analysis service. The move significantly broadens and elevates the discussion of "stranded" or "unburnable" carbon reserves—expanding it beyond climate groups and sustainability investors to the desks of the world's most active and influential investors and traders. "Investors and Bloomberg are responding to a growing body of work suggesting that a variety of factors—including carbon emission limits, falling demand and the spiraling costs of new oil production—could force fossil fuel companies to abandon reserves that underpin share prices and future earnings.
Could Al Gore Be Wrong About Coal's Future -- Energy economists have long talked about the "energy ladder" which says that as a person or a nation gets richer that they seek higher quality, cleaner fuels. For example, very poor people burn dung for heating and cooking services and this activity sharply raises local particulate levels causing serious breathing issues. The NY Times reports that China wants to burn cleaner coal for its electricity and heating and it is now buying coal from Australia. If such "clean coal" exists, this would mean that China's CO2 emissions will rise but that there will be less particulates and SO2 associated with power generation that relies on cleaner coal. I thought Al Gore told us that coal has no future? As I mentioned in a previous blog post, a boycott only works if no major potential purchaser steps in to purchase when the boycotted good's price falls. It is ironic that communist China knows how to play the capitalist game. It would have received an "A" in my class. How will Al Gore incentivize China to not rely on "clean coal"?
Coal Bed Methane Extraction: “Don’t Worry. It’s Not Fracking”- Coal bed methane extraction is a technology closely associated with shale bed fracking. While there have long been leases in Nova Scotia for exploration, the very first that was heard about actual plans was in a news release from the new provincial government early in November. “East Coast Energy has all of the necessary permits in place to begin exploring for local and cleaner sources of natural gas,” said Energy Minister Andrew Younger. The permits do not allow the use of hydraulic fracturing.East Coast Ventures went to even greater lengths to distance their project from fracking.
“It’s not fracking.” But coal bed methane extraction produces waste water in similar volumes, and with the same potential for “naturally occuring” toxins- the same toxins whose presence in the Kennetcook fracking wastes has produced the impasse that has stranded them in ‘temporary’ waste ponds.
“Not fracking.” But one of the major reasons the former NDP government took its internal review of hydraulic fracturing out of the hands of the Departments of Energy and Environment, was precisely because of that broad vote of no confidence in Environment’s assurances of the safety of the fracking waste processing they had approved.
“Not fracking.” But the Environment Department approvals for the Pictou County coal bed methane extraction use the regulatory protocols it has developed for hydraulic fracturing waste water.
“Not fracking.” But the early indications are that leakage from producing wells is even more prevalent with coal bed methane extraction than it is for shale gas fracking.
New Study Finds Higher Methane Emissions from Fracking - A major new study finds that methane emissions from the production of shale gas may in fact be higher than previously thought. The study, published in the Proceedings of the National Academy of Sciences on November 25, casts into doubt the notion that natural gas produces half as much greenhouse gas pollution as coal. Natural gas has been embraced by many, including President Obama, as a centerpiece of America’s climate change plan. Methane can be released from natural gas wells during the drilling process. Scientists have thus far had difficulty measuring these “fugitive methane emissions” precisely, with competing studies stirring controversy. The latest report, published by a group of 15 scientists, found that the U.S. Environmental Protection Agency is significantly underestimating the amount of methane released during natural gas production. Specifically, the report concludes that fugitive methane emissions could be 50% higher than EPA estimates. The findings could put pressure on state environmental regulators as well as the U.S. EPA to draw up new regulations, according to Dan Lashof of the Natural Resources Defense Council. “Methane is a powerful climate change pollutant, and the study gives greater impetus to the EPA and states to establish stronger standards to reduce leaks from the oil and gas system,” he said in an interview. Similarly, Dan Grossman of the Environmental Defense Fund told NPR in an interview last week, “[w]e think that other states will look at what we were able to accomplish here and replicate it.”
U.K. Embraces Fracking, Picks Winners And Losers Among Renewable Energy Industries - The U.K. government on Thursday announced generous tax breaks to the hydraulic fracturing industry, just one day after touting a green energy investment strategy that it says will bring $65 billion in renewable energy investment to the country. According to U.K. Treasury Chancellor George Osborne’s announcement, companies that explore shale gas will now be relieved of up to 75 percent of taxes for their early profits. The Chancellor said the tax breaks would make it easier for fracking companies to operate, therefore bringing “thousands of jobs, billions of pounds of business investment, and lower energy bills.” Interestingly enough, the announcement came just one day after the country’s Department of Energy and Climate Change (DECC), announced reforms to its electricity market that it said would attract $65 billion in renewable investment over the next seven years. Those changes are updated “strike prices” — akin to subsidies in the United States — that indicate just how much monetary support different types of renewable energy projects get from the government in exchange for investment in a low-carbon grid. The new strike prices will increase government support for offshore wind, geothermal, and hydro power. The pairing of the two energy reforms is strange given the government’s carbon budget, which mandates Britain to cut greenhouse gases 34 percent by 2020 and by 80 percent by 2050 from 1990 levels. While $65 billion in increased investment in low-carbon, renewable energy by 2020 would be a huge step toward meeting those goals, the government could be partially offsetting them by implementing an enormous incentive for a controversial methane-emitting fossil fuel industry.
Massachusetts moves toward fracking ban -- Legislation that would impose a 10-year moratorium on hydraulic fracturing is making its way through the Massachusetts state legislature. On Wednesday, the Joint Committee on Environment, Natural Resources and Agriculture passed the bill, which would also prohibit the dumping of fracking wastewater in the state. “Although the state isn’t seen as a rich source of shale gas, there could be limited deposits in western Massachusetts,” the Associated Press reports. As EcoWatch explains, “Local concern about fracking has grown since the U.S. Geological Survey identified shale gas deposits in the Pioneer Valley last December. Moreover, as New York mulls large-scale fracking next door, drilling operators could soon view Western Massachusetts as a convenient dumping ground for toxic fracking wastewater.” If the full state legislature passes the bill and Gov. Deval Patrick (D) signs it, Massachusetts would become the second state in the nation to ban fracking. Vermont banned it last year, despite having negligible fracking potential. Meanwhile, in states that actually have sizable shale deposits and active fracking operations, fracking bans are not faring well. Five Colorado cities have prohibited hydraulic fracturing, but all face legal challenges not just from industry but from the administration of Gov. John Hickenlooper (D). And in California, where scientists, celebs, activists, and policy wonks are all calling for a moratorium, Gov. Jerry Brown (D) still backs the growing fracking industry, despite his long legacy as a climate hawk and environmental champion.
Why Massachusetts Might Ban Fracking Even Though There’s No Fracking In Massachusetts - Last week, a committee in Massachusetts moved closer to banning hydraulic fracturing (or fracking) in the Bay State. This is a day after Texas, the epicenter of fracking in the United States, suffered a 3.6 magnitude earthquake. While Massachusetts may not be rich in fossil fuels, some in the state do not want to risk the the drinking water, the climate, or tectonic stability to tap what little shale gas might be hiding under the Berkshires. The Massachusetts State Legislature’s Joint Committee on Environment and Natural Resources approved a bill on Wednesday that would place a 10-year moratorium on fracking in the Bay State — through December 31, 2024. In addition, the bill would keep fracking wastewater produced by operations in other states from being treated, stored, or disposed in Massachusetts. Of special concern is the fact that many (largely rural) communities in Western Massachusetts depend on groundwater supplies for their only source of drinking water. Earthquakes are not a central concern to people in Massachusetts, but they hadn’t been to many states that are now dealing with them as the fracking boom takes hold. Ohio oil and gas regulators found earlier this year that 12 earthquakes were almost certainly caused by hydraulic fracturing. There are 216,000 active drilling wells and 50,000 disposal wells in Texas, and recent research has pinned the blame for the increasing number and magnitude of earthquakes in the area directly on fracking. Other studies back up the links, both from the hydraulic fracturing itself and the injection of the wastewater back underground.
Voters Ban Fracking in Colorado Towns, But Industry Sues To Stop Them - Four Colorado towns voted for bans or moratoria on hydraulic fracturing in November, but the oil and gas industry wants to repeal three of them in court. The Colorado Oil and Gas Association (COGA), the industry trade group, is arguing that only the state has the authority to ban drilling, and that Coloradans can not decide to keep it out of their communities.COGA filed suit Tuesday against three of the four towns: Fort Collins, Lafayette, and Broomfield, but not Boulder, which passed a similar five-year moratorium on fracking. The results of Broomfield’s vote were uncertain until Tuesday, when a recount found that the measure had passed by 20 votes out of nearly 21,000 ballots counted. The recount came after the vote initially came 13 votes shy of passage, then 17 votes ahead, triggering a mandatory recount. Lafayette’s measure is a total ban on new oil and gas wells, while Fort Collins imposed a five-year moratorium. COGA is also in the middle of suing the town of Longmont, Colorado, for regulations on drilling passed by its city council, including restrictions on drilling in residential areas.
Ohio’s Official Fracking Water Damage Denialism - By Dan Fejes, who lives in northeast Ohio. About a year ago a local family began getting flammable water. The fact that their house’s recorded methane levels (along with their sink) shot up shortly after fracking began nearby was considered maybe not coincidental, so the Ohio Department of Natural Resources (ODNR) looked into it. Before the agency did, though, it let the public know which way it was leaning: “Methane is naturally occurring in this portion of the state, and the water well in question was found to be drilled into shale, which may have led to these increased levels.” Isn’t the point of an investigation to try and understand the cause, not to confirm one’s hunches? It doesn’t inspire a lot of faith in the impartiality of the investigation to start by declaring the expected outcome. ODNR concluded its investigation a few weeks ago, and the result was no surprise to anyone who had seen the agency tip its hand at the outset: An investigation by the Ohio Department of Natural Resources recently concluded that the gas in the Kline’s’ water well was chemically different from the gas produced by a Mountaineer Keystone oil and gas well 1,500 feet southeast of the house. “Up to 40 percent of the water wells within the area of the (shale) drilling have some concentration of methane in them,” “Methane is naturally occurring.” The verbatim use of “methane is naturally occurring,” in addition to being a favored pro-fracking talking point, is not especially relevant when discussing the impact of fracking. The relevant question (or one of them) is: what happens to that naturally occurring methane when heavy industrial activity begins nearby? Setting off explosions below the earth and repeatedly forcing millions of gallons of chemical cocktails into the ground makes it more permeable. We already know that fluids in shale fields migrate much farther and much faster than previously thought, because busting up the earth makes it more porous. Saying that these fluids and gases are naturally occurring is trivial; stupid even. What matters is not whether they are naturally occurring but whether they are naturally migratory:
Chamber Of Commerce Leader Says Fracking Regulations ‘Undermine Freedom’ - Attempts to put pollution and other regulations on hydraulic fracturing are “undermining freedom” and hurting the economy, according to the president of America’s largest business lobbying group. Thomas Donohue, head of the U.S. Chamber of Commerce, told a meeting of business executives Tuesday that an anticipated study set to be released by the Environmental Protection Agency next year could give grounds for tight federal regulations on fracking, Reuters reported. If that were to occur, Donohue reportedly said, it would “short-circuit America’s absolute explosion in energy opportunity that is creating millions of jobs.” While many communities are increasingly concerned about the strain fracking places on local water supplies and the threat it poses to their health and safety, others — like Donohue — want to cash in on the boom. Currently, fracking is largely regulated by states, but the EPA has been attempting to take the reins. In 2012, the Obama administration set the first-ever national standards to control air pollution from fracking wells, which were finalized in 2013. The Bureau of Land Management is also working on regulations for drill operators with leases on federal lands, which the Chamber of Commerce has also attacked for coming at a time “when America should be taking greater advantage of our natural resources to create jobs and improve our economy.”
Leaked Documents Reveal IRS Concerns, Funding Crisis At Corporate Lobbying Group ALEC - Steve Horn - The Guardian has published a major investigative piece that once again exposes the scandalous ways of the right wing lobbying group, American Legislative Exchange Council (ALEC). [...] ALEC State Chairs were handed a draft pledge to put ALEC's interests over its constituent's interests, asked to "act with care and loyalty and put the interests of [ALEC] first." ALEC confirmed to The Guardian that it was "not adopted by the membership committee or by any of the state chairs."The Guardian obtained ALEC's Board of Directors' meeting minutes which reveal that ALEC has created a 501(c)(4) non-profit organization called The Jeffersonian Project. Creation of the Jeffersonian Project -- paralleling ALEC's self-serving branding as standing for "Jeffersonian principles" -- could be seen as a tacit admission that ALEC had been illegally operating as a shadow lobbying organization on behalf of its corporate members for the past four decades. [...] These findings by The Guardian come just one day before ALEC's forthcoming States and Nation Policy Summit in Washington, DC, in which pro-fracking and anti-regulatory model bills and presentations will be the centerpiece of the Energy, Environment and Agriculture Task Force's convening. Shale gas industry lobbying powerhouse America's Natural Gas Alliance will be named as a corporate member at the meeting.
US Consumers Are Getting “Fracked” as Fossil Fuel Industry Benefits Enormously From Natural Gas Wholesale Price Drops - An article posted in The National Journal asserts that fracking -- dangerous to the environment, the earth and humans -- has resulted in huge price breaks in natural gas for businesses, but comparatively little for consumers. The article reveals that the industrial sector has seen the wholesale price of natural gas decrease by 66% -- attributed to fracking increases in the supply of natural gas -- but only 23% for residential consumers. . On a web page revealingly filled with large adds for Chevron the article makes clear who is economically get a windfall from fracking: Fracking has sent the price of natural gas plummeting, just not for the people who need it most.The straight-out-of-the-ground price of natural gas is way down since the start of the boom in hydraulic fracturing. Back in 2008, users buying gas directly from drillers were paying an average of $7.97 per thousand cubic feet, according to the Energy Information Administration. By 2012, that cost—known as the “wellhead” price—had dropped to $2.66 in nominal dollars (not adjusted for inflation) resulting in a two-thirds discount in just five years.However, those are the prices paid by pipeline operators, utilities, large industrial users, and other entities that can buy gas directly from the companies that drill for it. By the time gas was piped into homes, individual consumers were still paying an average of $10.68 per thousand cubic feet. That’s down from $13.98 in 2008, but the $3.30 price drop is much smaller—both in absolute and relative terms—than the one that big buyers are getting further up the chain.
As Oil Floods Plains Towns, Crime Pours In - One cold morning last year, a math teacher jogging through her hometown in eastern Montana was abducted, strangled and buried in a shallow grave. Charged in her death were two drifters from Colorado, drawn to the region by the allure of easy money in the oil fields. One hundred fifty miles away, in a bustling oil town in North Dakota, a 30-year-old man disappeared one afternoon from the street where he had been putting in water and sewer pipes, leaving behind a lunchbox with his paycheck inside and a family grasping for answers. After months of searching, his mother said she now believes her son is gone, buried somewhere on the high plain. Stories like these, once rare, have become as common as drilling rigs in rural towns at the heart of one of the nation’s richest oil booms. Crime has soared as thousands of workers and rivers of cash have flowed into towns, straining police departments and shattering residents’ sense of safety. “It just feels like the modern-day Wild West,” said Sgt. Kylan Klauzer, an investigator in Dickinson, in western North Dakota. The Dickinson police handled 41 violent crimes last year, up from seven only five years ago.
In Fracking, Sand Is the New Gold - WSJ.com: The race to drill for oil in the U.S. is creating another boom—in sand, a key ingredient in fracking. Energy companies are expected to use 56.3 billion pounds of sand this year, blasting it down oil and natural gas wells to help crack rocks and allow fuel to flow out. Sand use has increased 25% since 2011, according to the consulting firm PacWest, which expects a further 20% rise over the next two years. In Wisconsin, the source of white sand perfectly suited for hydraulic fracturing, state officials now estimate more than 100 sand mines, loading, and processing facilities have received permits, up from just five sand mines and five processing plants operating in 2010.Less than a decade ago, U.S. Silica focused on sand for industrial and consumer products—plate glass for windows and, more recently, glass for iPhone and iPad screens. Now those uses account for just half the sand the company digs out of its open pits and even less of revenue. During the first nine months of this year, the more than $245 million in sand sold to energy companies accounted for 62% of U.S. Silica's sales, up from 53% during the same period in 2012 and 33% during the first nine months of 2011.
Frack-Water Recycling, an Emerging Market - Some 21 billion barrels of wastewater a year flows from oil and natural gas wells in the US, and while the market to recycle frack water has been slow to emerge, the potentially multi-billion-dollar arena is now starting to take off in earnest. It takes between 70 billion to 140 billion gallons of water to frack 35,000 wells a year, the industry's current pace, according to the Environmental Protection Agency (EPA), and while recycling frack water is still a relatively new idea, companies are coming under increasing pressure to do so, and Schlumberger predicts a strategic boom in the business. Re-using treated frack water in the fracking process itself is growing on companies as it proves it can be economically viable, environmentally safer and in the long-term a hedge against dwindling water supplies. In Texas, where hydraulic fracturing uses up around 50% of water in some counties, recycling for fracking re-use could have a significant impact. Schlumberger, an oilfield services company that has been a pioneer of frack water recycling, predicts that a million new wells will be fracked around the world between now and 2035, and reducing freshwater use "is no longer just an environmental issue—it has to be an issue of strategic importance”. This year, we’re seeing a clear uptick in frack water recycling, both in terms of pilot programs and actual implementation. Right now, only about 2% of frack water is being reused, but new recycling technology continues to make the process more cost effective.
The Fracking Industry’s Next Target: Our Natural Heritage - The fracking boom has already taken a devastating toll on communities across America, leaving toxic pollution and plummeting property values in its wake. Now, the oil and gas industry has set its sights on our national forests, wildlife refuges and even lands within view of national parks. President Obama promised to protect us from the ravages of fracking, but instead of safeguarding our natural heritage and its supplies of clean drinking water, his administration is preparing to step aside and let fracking run roughshod over them. The Bureau of Land Management (BLM), charged with safeguarding our public lands from the worst abuses of fracking, has just proposed a shocking set of rules that reads like an industry wish list.Those rules would not stop energy companies from fracking next to national parks, inside national forests, and across millions more acres of treasured lands. Nor would they stop the frackers from drilling alongside drinking water supplies on public lands. Here are just a few of the places where the BLM is essentially preparing to hang out a sign that says “Open for Drilling”: Virginia’s George Washington National Forest, Ohio’s Wayne National Forest, Colorado’s White River National Forest, California’s Los Padres National Forest, and lands outside Glacier and Grand Teton National Parks.
Rising Slag Heaps of Petcoke in Midwest Arouse Environmental Concerns - One by product of the long-delayed Keystone XL pipeline decision is that rising volumes of Canadian crude, particularly Alberta oil sands, are being refined in the Midwest rather than being shipped to U.S. refineries on the Gulf of Mexico. The increasing production is also generating attendant slag heaps of petroleum coke, or “petcoke,” whose particles wafting along on the wind has local residents claiming it endangers their health.Residents of the southeast side of Chicago, tired of the fact that the owners of the heaps don’t even bother to cover them, on 25 November filed a class-action lawsuit against several Koch Industries subsidiaries, which have been buying up the petcoke slag across the country, presumably for sale to lucrative Asian markets. The lawsuit charges that Koch Carbon, KCBX Terminals, George J. Beemsterboer Inc. and KM Railways in improperly storing the petcoke residue has resulted in its coating the homes and property of residents throughout the surrounding South Chicago neighborhood. The suit states, “Instead of safely disposing and deconstructing the petcoke, (the) defendants have chosen to sell it and distribute it and mark it for profit. It is a marketing enterprise that despoils and degrades every environment it touches.” BP is also named as a defendant as residents maintain that much of the problem petcoke is coming from BP’s nearby Whiting, Indiana refinery. The six-count lawful suit alleges willful and wanton conduct, abnormally dangerous activity, strict liability in tort, trespassing, public nuisance, private nuisance and declaratory relief, with the residents seeking an undisclosed amount in damages
Forget Keystone XL: Dangerous Tar Sands May Soon Be Traversing The Country By Barge - When tar sands crude spills into water, it doesn’t float on top in an oily sheen for all to see. It sinks to the bottom, mixes with sediment, and creates a toxic, viscous muck that is almost impossible to remove completely. That is exactly what happened three years ago in the Kalamazoo River in Southwest Michigan, and that is exactly what critics of plans to ship tar sands crude by barge across the Great Lakes say will happen again if industry is given the green light. According to a new report released by the Alliance for the Great Lakes, Calumet Specialty Products Partners, L.P. is preparing to begin shipping tar sands crude by barge on the Great Lakes as early as 2015. Calumet and its dock partner, Elkhorn Industries, recently applied for several permits from the Wisconsin Department of Natural Resources. Plans include a $25 million loading dock on Lake Superior, and the heavy crude would most likely travel from Wisconsin across Lake Superior to Lake Michigan. From there the barges would continue on to refineries in Whiting, Indiana, Lemont, Illinois, and Detroit, Michigan, as well as other destinations along the St. Lawrence Seaway. There is simply more tar sands crude being extracted from Alberta, Canada than can currently be transported to market via existing channels. The Great Lakes supplies drinking water for over 40 million people in North America and is the largest surface freshwater resource in the world.
The Geopolitics of Energy: An Interview with Steve Horn - If there is an up-and-coming investigative journalist to follow, it’s Steve Horn of DeSmog Blog. If you follow any of Frack The Media’s social media, you’ve been exposed to Steve. What draws us to Steve (and others like him) is his attention to detail surrounding the energy issue. It’s a multifaceted, highly complex and propagated geopolitical issue — regular reports often miss these intricacies (as mainstream media outlets tend to gloss over complex topics ). Long story short, we got to pick Steve’s brain and highlight some of the important investigative work he does.
Frack The Media: A lot of your reporting has focused on fracking and tar sands. What draws you to these particular issues?
Steve Horn: I focus on these issues for a number of reasons. Most importantly, the majority of the reporting on these issues by U.S. and Canadian reporters only grazes the surface, treating them as only environmental issues or only as energy issues. That’s not the case.
Given my academic background is in sociology and history and my keen interest in geopolitics, there is far more to these issues than meets the eye at face-value. In the case of fracking and tar sands, they’re the two biggest sources of energy that have transformed the U.S. and Canada into the “New Saudi Arabia” for oil and gas, huge players in the geopolitical “great game,” as Zbiginiew Brzezinski once put it. Not only are these important issues because they’re ravaging ecosystems and racing us to climate change catastrophe, but they’re also reshaping geopolitics as we know it.
Disconnecting the Price of Gasoline from the Price of Oil - I had been watching the relationship between the price of oil (West Texas Intermediate or WTI) and the price of gasoline for the past couple of years and have suspected that there is somewhat of a disconnect between the two. Let's open by looking at this graph that shows the price of West Texas Intermediate in red and the price of all formulations of regular gasoline in blue since 1990: You will notice that except for short periods of time in the mid-2000s that the price of regular gasoline tracked the price of oil quite closely. This was the case for 21 years, until 2011 when the price of gasoline began to track higher than the price of oil with this trend continuing over most of the period between early 2011 and mid-2013 as shown on this graph: Let's take a closer look at the relationship between the two over the period from 2010 to the present: How much of a difference does this "new reality" make to the price of a gallon of gasoline? In recent weeks, WTI has dropped from a one year high of $109.62 per barrel in early September 2013 to its current level of $94.00 per barrel, a drop of 14.2 percent. Over that period, the price of gasoline has dropped from around $3.59 a gallon to its current level of around $3.29, a drop of 8.4 percent. While there is somewhat of a disconnect between the price of oil and the price of gasoline, it is far better now than it was in the early part of 2013 as you will see. At the end of January 2013, WTI was priced at around $98 per barrel and by early March 2013, it had fallen to just over $90 per barrel, a drop of 8.2 percent. Over the same period, the price of a gallon of regular gasoline rose from $3.36 to $3.78, an increase of 12.5 percent. Had the historical relationship between the price of WTI and the price of gasoline held, the price of gasoline in March 2013 should have been around $3.20 per gallon, 15.3 percent lower than it was!
No Need for More Iranian Oil, U.S. Says - Iran says it expects a major boost in oil exports now that it has a nuclear deal in hand. In a sign the market is able to do without, however, the U.S. government said Iran's return is unlikely because of the ample supply of oil elsewhere. Iranian Deputy Oil Minister Kazzem Vaziri-Hamaneh said last week relief from economic sanctions could stimulate an oil export economy hamstrung by Western sanctions "Certainly, the annulment of sanctions will facilitate and accelerate exports operations and supply of Iranian oil to the global market," he said. Members of the P5+1 - the United States, Russia, China, United Kingdom, and France, plus Germany – reached a breakthrough nuclear agreement with Iran last month. Iran under the terms of the agreement can export only around 1 million barrels of oil per day. Before U.S. and European sanctions went into force in 2012, Iran was exporting around 2.5 million bpd and Washington said last weekend those sanctions will remain in place. A joint action plan agreed to by the P5+1 and Iran calls for a six-month pause in efforts to reduce Iran's crude oil sales in exchange for nuclear enrichment concessions from Tehran."However, the joint action plan does not offer relief from sanctions with respect to any increases in Iranian crude oil purchases by existing customers or any purchases by new customers," U.S. Secretary of State John Kerry said.
Iran threatens to trigger oil price war - FT.com: Tension between Iran and Saudi Arabia over Tehran’s plans to raise oil output spilled into the open on Wednesday as Opec rolled over its production target in the belief a wall of supply will fail to materialise next year. The oil producers’ cartel controls around a third of the global oil market and, as the only source of spare capacity, exerts a big influence over prices. But it faces a growing challenge to accommodate fast-rising US shale production, and balance the aspirations of Iran and Iraq, as both members threaten to increase output aggressively regardless of group targets. Buoyed by an interim agreement on its nuclear programme 10 days ago, Tehran hopes to raise crude production quickly from levels of 2.7m barrels a day if it reaches a deal to roll back sanctions. Iraq has also said it plans to increase production by 1m b/d next year to 4m b/d. Speaking in Farsi to Iranian journalists before ministers met in Vienna on Wednesday, Bijan Zangeneh, Iran’s oil minister, threatened to trigger a price war, warning Opec members that it would increase output even if crude prices tumbled. He said: “Under any circumstances we will reach 4m b/d even if the price of oil falls to $20 per barrel.”
Pentagon Approves Record Sale Of Advanced Arms To Countries At War - Selling weapons used to be a cut-throat business. With a no-questions-asked policy, it has led in the past, to the selling of weapons to support African conflicts, leaving Angola, Somalia, the Central African Republic and the Democratic Republic Congo awash with AK-47 semi-automatic rifles and very little else. Today’s high-tech weapons manufacturers are enjoying record sales. The State Department’s Military Assistance Report stated that it approved $44.28 billion in arms shipments to 173 nations in the last fiscal year. One of the more controversial is the Defense Department’s plans to sell Saudi Arabia $6.8 billion and the United Arab Emirates $4 billion in advanced weaponry, including air-launched cruise missiles and precision munitions. The trouble is – has anyone asked where these weapons will ultimately end up? This historic deal will be the first U.S sales of new Raytheon and Boeing weapons that can be launched at a distance from Saudi F-15 and U.A.E. F-16 fighters. But this is just part of Saudi Arabia’s military shopping list. The Saudi Kingdom is also purchasing the Boeing Expanded-Response Standoff Land Attack Missile and Raytheon Joint Standoff Weapon, which can strike at air defense sites and radar installations from beyond the range of enemy air-defense systems. The Royal Saudi Navy is acquiring Boeing missiles, a derivative of the Harpoon anti-ship missile that can be launched more than 135 nautical miles from a target and be redirected in flight. With such a big order should the U.S question the need for this military arsenal?
Worst Raw-Material Slump Since ’08 Seen Deepening: Commodities - The commodity slump that spurred bear markets in everything from gold to corn to sugar this year will deepen by the end of December as prices head for their first annual loss since 2008, if history is any guide. The Standard & Poor’s GSCI Spot Index of 24 raw materials fell in December 83 percent of the time since 1971 when the benchmark gauge was posting losses for the year through November, data compiled by Bloomberg show. The average December loss was 3.9 percent, which if it happened this time would mean a 7.8 percent drop for the year. Investors pulled a record $34.1 billion from commodity funds since the end of December, according to EPFR Global, which started tracking the flows in 2000. Ample rains boosted global crops, increased mine output spurred supply gluts in metals and the U.S. is extracting the most crude oil since 1989. Economic growth in China, the biggest user of everything from soybeans to zinc to cotton, is poised to slow for a third year in 2013, according to economist estimates compiled by Bloomberg.
Mexican drug cartels now make money exporting ore — Mexican drug cartels looking to diversify their businesses long ago moved into oil theft, pirated goods, extortion and kidnapping, consuming an ever larger swath of the country's economy. This month, federal officials confirmed the cartels have even entered the country's lucrative mining industry, exporting iron ore to Chinese mills. Such large-scale illegal mining operations were long thought to be wild rumor, but federal officials confirmed they had known about the cartels' involvement in mining since 2010, and that the Nov. 4 military takeover of Lazaro Cardenas, Mexico's second-largest port, was aimed at cutting off the cartels' export trade. That news served as a wake-up call to Mexicans that drug traffickers have penetrated the country's economy at unheard-of levels, becoming true Mafia-style organizations, ready to defend their mines at gun point. Three Michoacan state detectives were wounded in an ambush earlier this week when they were traveling to investigate a mine taken over by criminals. When reinforcements arrived, those officers were also ambushed, part of a string of attacks on police in Michoacan on Wednesday and Thursday that left two officers dead and about a dozen wounded.
Rare material shortages could put gadgets at risk: Modern technology is too reliant on rare materials whose scarcity could drastically set back innovation, a new report has warned. It suggested that as more and more devices are manufactured, supplies of key elements, particularly metals, will be strained. Potential substitute materials are either inadequate or non-existent, researchers said. One scientist called the findings "an important wake-up call". Andrea Sella, of University College London - who was unconnected to the study - told website The Conversation that it was the first time the issue had been explored in such detail. Researchers at Yale University, led by Prof Thomas Graedel, analysed the use of 62 metals or metalloids commonly found in popular technology, such as smartphones. Troubling It found that none of the 62 had alternatives that performed equally well. Twelve had no alternative, Prof Graedal found. The scope for serious disruption because of material shortages is increasingly troubling technology companies. Rare materials are expensive to extract, and their processing comes with considerable environmental concerns.
China factory sector growth steady, other centers quicken - Asia's manufacturing-sector expansion held around multi-month highs in November, factory surveys showed, with China maintaining its momentum but growth in other key exporters such as Japan, South Korea and Taiwan picking up speed.Activity in India expanded after three months of contraction as new orders grew for the first time since May, supporting government figures on Friday that suggested an economic slump may have bottomed out.Purchasing managers' indexes released on Monday showed the factory sector in Taiwan grew at its fastest pace in 20 months in November and at its fastest in six months in South Korea. Japan's PMI, released on Friday, showed manufacturing activity expanding at its quickest pace in more than seven years as new export orders reached their highest level in over three years.The Asia data suggests the global economy is showing signs of a more solid recovery as 2013 draws to a close. PMI reports from the euro zone and the United States later on Monday are expected to show both regions maintained factory-sector growth in November.
China Manufacturing Index Beats Estimates as Output Rises - Chinese manufacturing grew more than analysts estimated in November, indicating the nation’s economic recovery is sustaining momentum amid government efforts to rein in credit growth. The Purchasing Managers’ Index was 51.4, the National Bureau of Statistics and China Federation of Logistics and Purchasing said today in Beijing. That’s the same reading as October, which was an 18-month high, and exceeded 24 out of 26 estimates in a Bloomberg News survey. Stability in manufacturing growth in the world’s second-biggest economy may give Premier Li Keqiang more room to implement policy changes laid out after a Communist Party meeting last month. While industrial investment is picking up and retail sales have increased 13 percent so far this year, China faces headwinds that include industrial overcapacity, excessive corporate debt and slower export demand. “This is good news for policy makers as the expected slowdown in growth appears pretty mild,”
Apple Ignores Code of Conduct as Factory Workers in China Work Illegal, Excessive Overtime - Apple’s ugly labor problems aren’t limited to its Foxconn factories, and they aren’t going away. The labor rights group Students and Scholars Against Corporate Misbehaviour (SACOM) first exposed the wave of employee suicides at Apple’s Chinese contractor, Foxconn, and the grueling conditions in which hundreds of thousands of employees work. SACOM has regularly revealed Apple’s failure to abide by its so-called code of conduct, and along with another watchdog group, China Labor Watch, has monitored Apple’s failure to live up to its announced intention to clean up sweatshop conditions at its factories in China and to stop the use of indentured student labor. In April, China Labor Watch reported that two more Apple/Foxconn workers had committed suicide by jumping from buildings to their death. China Labor Watch also found labor law violations at ten other Apple suppliers, including Pegatron. Now SACOM has released a new report that details the serious labor rights violations at another Apple supplier, Biel Crystal, which reportedly makes 60 percent of Apple’s touch screens. SACOM reports that five Biel Crystal workers employed at its Huizhou factory have killed themselves since 2011. One possible cause is the stress of working horrific hours—11 hours a day, seven days a week, with only a day off in a month. This is a gross violation of Chinese labor law, which limits overtime to 39 hours a month. The Biel Crystal employees work more than twice as much overtime as the law allows.
China’s monetary squeeze collides with housing bubble - The fact that Chinese monetary policy can seem obscure to outside observers does nothing to diminish its importance. In fact, the ongoing attempt to deflate the 2010-13 credit bubble in China is more important for the global economy than the Fed’s tapering plan, or the ECB’s thinking on negative deposit rates. A collision is developing between a progressive tightening in monetary conditions, and the inflationary psychology of the housing and land markets. No-one can be certain how this will end. The official stance of policy in the regulated financial sector has been unchanged since 2012, and no major change in the overall policy setting is currently deemed necessary. This is why the reserve requirements on the banks and one-year deposit rates have not changed in more than a year. This, however, does not paint a true picture of what is really going on, since all of the important action is happening in the shadow banking system. Here the explosion of credit since 2010 has, of course, been fuelling rapid inflation in housing and land prices (well analysed here by the Wharton School). For years, the PBOC turned a blind eye to the emerging bubble. But since the administration of Xi Jinping took office in March, Governor Zhou has felt empowered to squeeze the liquidity in the interbank markets, in order to slow the growth in off-balance sheet lending. The intention is to do this gradually, letting the air out of the balloon over a period of years. In addition, there has been tacit pressure on the state-owned large banks to starve the shadow banks of funding sources.
Yuan overtakes euro as 2nd most used currency in trade finance - The yuan has overtaken the euro as the second most used currency in international trade finance, according to the Society for Worldwide Interbank Financial Telecommunication (SWIFT). The share of the Chinese currency's usage in trade finance, such as Letters of Credit and Collections, grew to 8.7 percent in October, from 1.9 percent in January 2012, data from the transaction services organization showed. It now ranks behind the U.S. dollar, which remains the leading currency with a share of 81.1 percent. The euro's share, meanwhile, dropped to 6.6 percent in October, from 7.9 in January 2012, and is now in third place. The top five countries using the renminbi (RMB) for trade finance in October were China, Hong Kong, Singapore, Germany and Australia. The yuan's use in international trade is set to continue growing in the coming years, say market watchers. According to a poll by HSBC conducted earlier this year, a quarter of 700 global businesses surveyed said they expect to start using the currency in trade settlements within the next five years.
Chinese Yuan Surpasses Euro, Becomes Second Most Used Currency In Trade Finance -- Slowly but surely the Chinese currency is catching up to the world's reserve and moments ago, according to SWIFT, the Yuan just surpassed the Euro in trade (remember trade: that's how countries once upon a time would generate capital flows in a time when central banks weren't there to literally print domestic funding needs) finance usage leaving just the USD in front. More from Bloomberg:
- Chinese currency had 8.66% share in letters of credit and collections, or trade finance, in Oct., Society for Worldwide Interbank Financial Telecommunications says in statement today.
- Euro’s shr in trade finance was 6.64% in Oct.
- Top 5 countries using yuan for trade finance in Oct. were China, Hong Kong, Singapore, Germany and Australia
- Yuan mkt shr in global payments was 0.84% in Oct. vs. 0.86% in Sept.
- Yuan payments value rose 1.5% in Oct. vs. 4.6% growth for all currencies: Swift
And so while the "developed" world is busy crushing its fiat through trillions in annual currency dilution and debasement in an attempt to make its exports cheaper and outtrade its peers through beggar thy neighbor policies (not to mention inflate away its debt), the leader of the "emerging" world, China, is doing just that.
Steve Keen: The International Financial Architecture - In this video, Steve Keen reviews the history of Keynes’ proposed international currency, Bancor, and why it failed to come to fruition at Bretton Woods. Keen thinks its time has finally come and supports the Central Bank of China’s call for its introduction.
US calls on China to rescind air defence zone - The US called on China to scrap its newly declared air defence identification zone on Monday, warning that Beijing risked a potentially dangerous confrontation with Japan and its allies at the start of a trip to the region by vice-president Joe Biden. The explicit request for China to “rescind” threats against unannounced aircraft passing over a chain of islands in the East China sea was made by the US just hours after Biden landed in Tokyo ahead of a six-day trip to Japan, China and South Korea. “The fact that China’s announcement has caused confusion and increased the risk of accidents only further underscores the validity of concerns and the need for China to rescind the procedures,” said Jen Psaki, the chief spokesperson for the State Department. Biden is expected to attempt to defuse the controversy during his visit. Senior diplomats privately concede that the dispute over the airspace above the islands, known as the Senkaku in Japan and the Diaoyu in China, will almost entirely dominate Biden’s trip, which had been intended to focus on US economic interests in the region. The row began nine days ago when Beijing unilaterally declared the enlarged air defence identification zone.
Japan consumer price rises speed up - Consumer prices in Japan rose at the fastest pace in five years in October, suggesting policymakers' attempts to end years of deflation are working. Consumer prices, excluding food, rose 0.9% from a year earlier. Prices have now risen for five months in a row. Japan has been battling deflation, or falling prices, for best part of the past 20 years. It is seen as a major drag on its economy and policymakers have unveiled a series of measures to end the cycle. While falling prices may sound good to those experiencing inflation, they hold back economic growth as consumers and businesses tend to put off purchases in the hope of getting a cheaper deal later on, which hurts domestic demand. Hidenobu Tokuda, an economist at Mizuho Research Institute, said the latest data indicated the world's third-largest economy was "making progress toward ending deflation". "We expect core inflation to approach 1% at the end of this year and then to rise more gradually next year." Japan's central bank has set a target of achieving an inflation rate of 2%.
Japan Salaries Extend Slide as Inflation Begins to Take Root - Japan’s salaries extended the longest tumble since 2010, increasing pressure on household finances as inflation begins to take root. Regular wages excluding overtime and bonuses fell 0.4 percent in October from a year earlier, a 17th straight monthly decline, according to labor ministry data released today. Total cash earnings rose 0.1 percent. The slide in wages threatens living standards as consumers face the prospect of sustained inflation on top of a sales-tax increase in April next year. As a weaker yen helps boost company profits, the focus is turning to salary talks early next year that may determine the success of Prime Minister Shinzo Abe’s bid to reflate the world’s third-largest economy. “Raising wages is essential for Japan’s sustainable economic recovery,” “It won’t be easy for manufacturing companies to raise base pay” as they are competing globally. Prices excluding energy and fresh food rose 0.3 percent in October from a year earlier, the most in 15 years, indicating inflationary pressures are broadening beyond electricity and gas price increases fueled by the yen’s decline. The Japanese currency has fallen about 16 percent against the dollar this year, weakened by the Bank of Japan’s record easing as it targets 2 percent inflation. The yen was down 0.4 percent at 103.31 against the U.S. currency at 3:38 p.m.
This Inflation Is Supposed To Be GOOD For Japanese Workers? - Japan’s new economic religion, lovingly dubbed Abenomics, relies mostly on a money-printing binge that monetizes the entire government deficit plus a chunk of its public debt, month after month. Printing yourself out of trouble and to wealth works every time. For the elite. This is a lesson learned from the Fed. But how are workers and consumers faring? And by implication the real economy? The consumer price index, released today, rose 0.1% in October and is now up 1.1% for the 12-month period. Less “imputed rent,” inflation rose 1.4% year over year. Service prices were up 0.4%, but goods prices jumped 1.9%. At this rate, Abenomics will have no problems meeting or exceeding by March, 2015, its “2% price stability” target, as the Bank of Japan has come to call it with bitter cynicism. What isn’t happening: wage increases! The Japanese Statistics Bureau just reported incomes and expenditures of households with two or more persons. This is by far the largest category of households in Japan. Incomes of the all-important “workers’ households” rose a measly 0.1% from a year ago to ¥482,684. In nominal terms. But adjusted for inflation – yes, here is where the benefits of Abenomics are kicking in – incomes fell 1.3%. Disposable incomes fell 1.4%. The details were ugly: “Current income” (salaries and wages) dropped 1.2% and “temporary bonuses” plunged 19.5%. Income from self-employment and piecework plummeted 20.8%.
Insight: After massive economic stimulus, BOJ under pressure to do more (Reuters) - A year into "Abenomics," it was not supposed to be like this for the Bank of Japan. The central bank, its boss hand-picked by Prime Minister Shinzo Abe, shot the first, and so far most successful, arrow from Abe's quiver of aggressive policies to pull the world's third-biggest economy out of almost two decades of deflation and lackluster growth. BOJ Governor Haruhiko Kuroda's massive burst of money-printing - almost $70 billion a month - has driven the yen down and Tokyo stocks up. It has also spurred the strongest economic growth among G7 countries in the first half of the year, arresting a long fall in consumer prices. But now, 12 months after Abe was elected and eight months after Kuroda announced the big-bang stimulus package, financial markets are looking for more stimulus - already dubbed "JQE2", or Japan's second round of quantitative easing.Economic growth slowed sharply in the third quarter and while inflation is at its highest in five years, it is well short of the BOJ's price target and the outlook is weakening. Private economists and half of Kuroda's fellow board members are openly skeptical of the BOJ's rosy growth and price forecasts. So bureaucrats in the BOJ are actively game-planning scenarios for further easing, such as increasing purchases of stock market-linked funds or buying other assets riskier than the Japanese government bonds (JGBs) it now gobbles up in huge quantities, officials briefed on the process say.
Japan preparing $53 billion economic stimulus package this week (Reuters) - Japan will craft an economic stimulus package this week worth about $53 billion to bolster the economy ahead of an increase in the national sales tax in April, people familiar with the process said on Tuesday. The size of the package, ordered in October by Prime Minister Shinzo Abe, will be between 5.4 trillion yen ($52.43 billion)and 5.6 trillion yen, the sources told Reuters on condition of anonymity. Government ministers have said the package needs to be at least 5 trillion yen to soften the economic blow of the tax hike - Japan's biggest step in decades toward curbing its enormous debt. The government will craft an "effective" package amounting to "as much as possible above 5 trillion yen," Yasuhiro Hanashi, a parliamentary finance secretary, told a panel of Abe's Liberal Democratic Party. The government is to decide on the measures on Thursday, but precise amounts will not be spelled out until the Cabinet approves a supplementary budget on Dec 12, the sources said. Sources said last week that the budget, including the stimulus measures, would be worth some 7 trillion yen.
Japan's monetary base hits record high in November -- Japan's monetary base rose 52.5 percent in November from a year earlier to a record 189.72 trillion yen (about 1.84 trillion US dollars) due to the central bank's ultra loose monetary policy aimed at beating Japan's prolonged deflation, according to local media Tuesday. It is the ninth straight month of increase of the monetary base, Japan's Kyodo News quoted the central bank, the Bank of Japan ( BOJ), as saying, adding the average daily balance of liquidity provided by the BOJ rose for the 19th consecutive month. The central bank said that the country's monetary base stood at 191.62 trillion yen (about 1.86 trillion dollars) at the end of November, the highest level ever. The BOJ said it has set monetary base as the main target for its monetary policy and it will double the monetary base within two years in a move to combat the country's deflation. BOJ chief Haruhiko Kuroda suggested Monday that the central bank may not end its ultra loose monetary policy before fiscal year 2015, vowing the BOJ will continue with its the policy "as long as it is necessary for maintaining the target in a stable manner," and might adopt further measures if the situation does not improve as expected
Observations on the Efficacy of Monetary and Fiscal Policy - Japan edition. Inflation and output are up. So too is gross fixed capital investment. The yen is weaker, and the real quantity of net exports is higher. GDP is up 1.9% q/q on an annualized basis in 2013Q3; it is up 2.6% y/y. What's of interest is that a measurable proportion of growth has been accounted for (in a mechanical sense) by government consumption and investment. This has been particularly noticeable in the last two quarters.The government is planning to increase spending in anticipation of a sales tax hike [0]. Private investment was not the biggest contributor to growth; it accounts for 0.4 percentage points of the 1.9 percentage points growth. That being said, this represents a change from before Abenomics, when it accounted for -1.7 percentage points of the -3.7 percentage points of growth in 2012Q3. Morever, investment -- including government investment -- is increasing. There is an interesting question regarding measurement of quantities; while real private investment (approximated by summing residential and nonresidential investment) rose an annualized 2.4% in 2013Q3, nominal investment rose 4.0%. On an annual basis, the numbers are 1.6% and 2.9% respectively (all calculations in log terms). (I don't have any particular information regarding investment revisions; discussion of GDP revisions is here) How much of these real economy effects are due to the expansionary monetary policy conducted under BoJ head Kuroda? One notable fact is the acceleration in inflation. Year on year inflation using several price indices is shown in Figure 4.
BOJ Beat: ‘No Free Lunch’ for Sustained Wage Rises - If Prime Minister Shinzo Abe really wants to push up wages to help end deflation, Japan may have to give up something else it has long cherished: job security. For decades, company management and labor unions in Japan have held down costs by limiting salary increases instead of shedding excess workers. While lifetime employment is no longer the panacea it was in the high-growth years before 1990, there are still widespread concerns that U.S.-style layoffs would undercut a carefully woven social fabric that has created one of the world’s most livable countries. While the government and the central bank are banging the drum on the need for a rise in salaries to get the country out of 15 years of deflation, they have spoken little of the potential negative aspects of higher wages. But Takehiro Sato, a member of the Bank of Japan policy board, broke that silence on Wednesday, openly cautioning that unemployment may surge if Japan transforms itself into an economy where wages rise on a regular basis. “There is no free lunch,” Mr. Sato said at a meeting with business leaders in Hokkaido, northern Japan.
Warren on Trans-Pacific Partnership: If people knew what was going on, they would stop it - Senator Elizabeth Warren (D-MA) on Wednesday voiced her opposition to President Barack Obama’s top international trade nominee because of a secretive free trade agreement. “I am deeply concerned about the transparency record of the U.S. Trade Representative and with one ongoing trade agreement in particular — the Trans-Pacific Partnership,” she said on the Senate floor. The Trans-Pacific Partnership (TPP) has been negotiated behind closed-doors for years by trade representatives from Australia, Brunei, Chile, Canada, Malaysia, Mexico, New Zealand, Peru, Singapore, the United States, and Vietnam. Though the free trade agreement could have wide ranging consequences on workers and consumers, the public only knows a few details of the treaty thanks to leaked documents. “I have heard the argument that transparency would undermine the Trade Representative’s policy to complete the trade agreement because public opposition would be significant,” Warren explained. “In other words, if people knew what was going on, they would stop it. This argument is exactly backwards. If transparency would lead to widespread public opposition to a trade agreement, then that trade agreement should not be the policy of the United States.” The Senate confirmed Michael Froman as the new United States Trade Representative by a 93-4 vote. Sens. Joe Manchin (D-WV), Bernie Sanders (I-VT) and Carl Levin (D-MI) joined Warren in voting no.
Preventing Currency Manipulation - Simon Johnson - The Obama administration is keen to agree on a “Trans-Pacific Partnership” that will increase market access in the United States in return for reducing trade barriers in other participating countries, all bordering on the Pacific Ocean. The partnership is also intended to write new rules for a wide range of international trade and investment transactions. But a new and perhaps insurmountable obstacle has now appeared: there is likely to be a great deal of congressional opposition to a potential deal as currently envisaged, because it does not do anything to prevent currency undervaluation resulting from direct intervention in the currency markets. Because the latest powerful challenge to the trans-Pacific agreement comes from an unlikely quarter – policy intellectuals who are strongly in favor of freer trade, along with some large manufacturing companies (including in the automobile sector) – this opposition is likely to succeed. Doctors Without Borders (also known as Médecins Sans Frontières), for one, has taken out advertisements criticizing the proposed trade agreement, asserting that it might undermine access to low-cost pharmaceuticals in poorer countries. The less predictable criticism comes from C. Fred Bergsten and Joseph Gagnon, who wrote a paper in December 2012 contending that “currency manipulation” by other countries is an important public policy problem and one that must be addressed in any free trade agreement that the United States signs. Mr. Bergsten has for more than 30 years been a leading voice for tariff reductions and other forms of trade liberalization. He is also a leading proponent of free-trade agreements. Yet in recent years he and many others have become increasingly outspoken about the use of intervention in currency markets to prevent particular currencies from appreciating. Currency manipulation involves the systematic and sustained undervaluation of currencies, which helps the country in question export more.
India Refuses to Budge on WTO Agreement - The hopes of a breakthrough for a new World Trade Organization agreement in Indonesia appeared remote Wednesday as India again asserted that its massive subsidized food program, which has emerged as a hurdle in trade talks, was “non-negotiable.” Under current WTO provisions, India could face WTO sanctions if it goes ahead with the program to deliver nearly free grain to around 70% of the country’s 1.2 billion people. India’s new program would push its subsidies on government food stocks above the level allowed by the trade organization. “Governments of all developing countries have a legitimate obligation and moral commitment towards food and livelihood security of hundreds of millions of their hungry and poor,” Indian Trade Minister Anand Sharma told the WTO ministerial conference on the resort island of Bali in Indonesia. “Dated WTO rules need to be corrected.” India wants to be allowed to keep its food subsidy program in place indefinitely. Without being allowed to do that, it has refused to support to a simple deal to streamline and harmonize customs procedures that the WTO has been hoping to pass in Bali. The unambitious trade agreement is seen as the last hope for the WTO to prove it can do deals and was seen as a small step towards reviving discussion of the long-moribund Doha trade agreement. India has emerged as the leader of a group of less-affluent countries pushing for changes. India is determined to push ahead with its food security program which is a cornerstone of the ruling Congress party’s platform ahead of national elections scheduled to happen by the end of May.
Why the WTO Needs a “Hypocrisy Clause” - I ended a recent article on the US government’s objections to the food security proposal of India and other developing countries at the World Trade Organization meetings in Bali with the provocative statement that what the WTO needs is not a “Peace Clause” – a four-year cease fire on WTO suits – but a “Hypocrisy Clause” – an agreement to reduce or eliminate the trade-distorting hypocrisy that is preventing a Bali agreement. I called for immediate reductions by the “most developed hypocrites.” In a subsequent talk, I was asked to elaborate. I offered my “top ten” examples of the US government’s most trade-distorting hypocrisy:
- India’s food security and stockholding program uses precisely the same policies that the United States used in its early farm policy coming out of the Great Depression. Exactly the same: price supports, food reserves, administered markets, subsidies. We used them because they work. India and other countries should be allowed to use them too. Because they work.
The Lost Billions of a Failed Doha Deal - Failure by the World Trade Organization’s 159 members to reach an agreement after 12 years of talks has cost the world economy billions of dollars in lost gains from trade liberalization. Calculating how much the Doha round could have been worth is an inexact science. But valuing the deal is worth doing at a time when many are ringing the death knell for the agreement. The gains mainly would have come from increased trade if countries had agreed to cut tariffs on manufactured goods, agricultural products and services. This paper by the Peterson Institute for International Economics in 2010 estimated the Doha round on the negotiating table at the time would have added between $63 and $282.7 billion to the global economy. The lower range of the estimate would have come from a deal that encompassed only manufactured goods and agricultural products, the institute said. Adding in liberalization of trade in services would have added $101.9 billion. Improvements in “trade facilitation” – measures that include streamlining customs procedures – would have added a further $117.8 billion.
WTO global trade deal hangs in balance - FT.com: The fate of the first global trade deal in a generation hung in the balance in the early hours of Saturday morning after Cuba blocked agreement in a bid to have it include language calling for the lifting of the 53-year-old US embargo against the Caribbean island. India and the US had resolved their differences over how to tackle food security, removing what had been thought to be the barrier to a deal in Bali. A majority of ministers from the 159 members of the World Trade Organisation backed the deal after four days of gruelling negotiations. Business groups hailed the news as a boost to the $18tn annual trade in goods. But Cuba’s objection, which was supported by Venezuela, Bolivia and Nicaragua, forced meetings that went on into the early hours of Saturday. Trade officials initially thought those objections could be overcome but Cuba’s position seemed to harden through the hours. While other delegations invoked the “spirit of Nelson Mandela” in backing proposals supported by poor countries around the world, Cuba invoked the “spirit of [Hugo] Chávez” in speaking out against the settlement. A Bali deal would mark the first time that any part of the Doha Round had been completed. As such, it would represent a rare victory and a credibility boost for the multilateral trading system and the WTO. Since its creation in 1995 the Geneva-based body has failed to produce any agreement, leaving the rules governing global trade outdated.
Australia’s “Miracle Economy” Running out of Tricks - Australians are slowly coming to the realization that their miracle economy, which on Wednesday marked 23 years without a recession, might not be so blessed going forward. A mining investment boom that has sustained the economy for the past decade remains a key growth driver but like a fading star its fuel will soon run low, it will dim and eventually it will flame out. The Reserve Bank of Australia has thrown eight interest-rate cuts at the problem over the past two years, hoping other parts of the economy will rise to fill the void. So far, however, the tonic has had little result: Gross domestic product grew 0.6% on-quarter in the third quarter of the year, slower than the prior period, data Wednesday showed. The economy grew 2.3% compared to a year earlier, well below its 3.0% long-term average and economists’ forecast of 2.6% growth. The RBA is predicting growth of just 2%-3% next year. Mining remained a key driver of growth in the third quarter, but other parts of the economy were quiet. The temperature under house prices has risen a few degrees, while credit has begun to flow more easily. Business confidence has risen, but how long that will last is anybody’s guess. That might explain why the RBA held interest rates Tuesday at a record low of 2.5%. The bank kept the door open to further cuts if manufacturing, tourism, housing and services fail to rally going forward, but it will have to move carefully to avoid inflating a housing bubble.
Australia’s debt ceiling, we barely knew you - From “noted” to gone in less than 2 months… From Nomura’s Martin Whetton: With just over a week before Australia was expected to hit its borrowing limit, the government reached a deal with the Green party in the Senate to abolish the Commonwealth debt ceiling, which is expected to pass Parliament sometime this week. While the details have yet to be finalised, it is understood that future budgets will extend the forward estimates from four to ten years, the government will be required to justify to parliament every increase in debt of more than AUD50bn and debt reporting will split out the gross and net debt at both a nominal level and the market value. The government will also be required to detail infrastructure borrowings and borrowings to fill revenue holes, described as “good” and “bad” debt. We’ll leave you with the, even-handed and sure to insipre no anger, words of Greens leader Christine Milne: “This, I think, will return some maturity to the debate around debt and get rid of what has become a phony debate every time the government has wanted to raise the debt ceiling,” Ms Milne said on Wednesday. “We have had the imported Tea Party-style debate here in Australia where the focus has been actually on the figure rather than on what the debt is being used to do.”
S. Korea Exports Slow as Southeast Asia Demand Declines - South Korea’s exports slowed last month as demand from Southeast Asian nations fell and the won’s advance weighed on exporters’ price competitiveness. Overseas shipments rose 0.2 percent in November from a year earlier, down from a revised 7.2 percent gain the previous month, the Ministry of Trade, Industry and Energy said in an e-mailed statement today. The median estimate in a Bloomberg News survey of 12 economists was for a 3 percent increase. The slowdown in exports threatens to derail the recovery in Asia’s fourth-largest economy, making it unlikely the Bank of Korea will raise its benchmark rate this month. The won was the best performer among Asian currencies last month, rising 0.2 percent against the dollar and hitting a five-year high against the yen. “Major economies are improving, which will boost our exports,” the ministry said in the statement. “However, the won’s appreciation and the expected tapering of the U.S. quantitative easing program will remain as a risk.” Imports fell 0.6 percent from a year earlier, bringing the monthly trade surplus to $4.8 billion, today’s report showed.
South Korea’s November Exports - Takeaways From the Data - As an export powerhouse and home to big-name shipbuilders, carmakers and cellphone makers, South Korea’s trade data are seen as a bellwether of global demand. November’s figures, which came out Sunday, reflect the uneven pickup in the global economy, showing some recovery in the West but weakness in the formerly hot emerging economies of Southeast Asia. Total exports rose just 0.2%, below the 2.5% forecast and far off October’s revised 7.2% pace. November’s export growth was driven by brisk shipments of ships and cell phone, items largely bound for the United States, the European Union and other advanced economies. Exports to the E.U and U.S. rose 6.8% and 2.9%, respectively, while shipments to China—which often serves as a transit point for South Korean intermediate goods that ultimately reach Europe and the U.S. —grew 3.7%. In contrast to the boost from advanced economies, exports to ASEAN dropped 11.2% from a year earlier. Partly this reflects an adverse statistical base – exports last November had grown a whopping 28.8%– but it also reflects flagging growth in Indonesia and other formerly hot emerging economies of Southeast Asia, where weak prices for the raw materials these countries export has limited their buying power. The weaker Japanese yen is also taking its toll. Korean shipments to Japan were down 6.4% on-year in November, the tenth straight month of decline. Exports of iron and steel —a sector where South Korea competes directly with Japan on global markets—fell 20.3%. November’s figures disappointed, but a second straight month of export growth backs the market view that South Korea’s economy is gradually regaining momentum.
Encouraging Data Suggest a Revival for India’s Economy - After a tough two years for India, a string of recent indicators suggest the economy may at last be regaining its footing. Data over the past week have shown a pick-up in gross domestic product and manufacturing activity – and a surprising reduction in India’s chronic current account deficit. “The September quarter finally represents the start of the recovery,” said Robert Prior-Wandesforde, a Singapore-based economist at Credit Suisse. The government announced last week that gross domestic product grew a faster-than-expected 4.8% in the three months to September. That’s far below the 9.3% growth recorded as recently as the 2011 financial year, but it’s better than the previous quarter’s 4.4% growth, the weakest in more than four years. Until recently India was among the world’s fastest-growing economies, but high inflation, deteriorating government finances and a slow pace of reform have shaken investor confidence. Economic growth touched a 10-year low of 5% last fiscal year and has been below 5% for the last four quarters. Optimists expect growth to climb back above 5% for the next two quarters, bringing full-year growth above 5% as well.
Firmer Trade Should Keep Malaysia out of ‘Twin Deficit’ Club - A steady trade surplus in October raises the odds that Malaysia can keep its current account in surplus in the final quarter of the year, avoiding membership in the “twin deficit” club that bore the brunt of the emerging-market selloff this summer – and would likely be hardest hit again when the U.S. Federal Reserve eventually reduces its economic stimulus.Malaysia’s trade balance, a key component of the current account, showed a surplus of 8.23 billion ringgit (US$2.55 billion) in October, only modestly lower than September’s 8.66 billion ringgit surplus. The rebound in the developed world suggests Malaysia’s exports should strengthen going forward, further boosting the surplus. “We believe the current account will not go into deficit,” Still, the government says the surplus will shrink by more than half, to 26.6 billion ringgit, from 57.3 billion ringgit in 2012.The sell-off from emerging markets as investors began to anticipate higher yields in the United States exposed countries that were overly dependent on foreign funding to balance their books. Countries with deficits in both their budgets and current accounts – such as India and Indonesia in Asia – were hit especially hard.
Indonesia’s Current-Account Gap Prompts a Rethink on Currency - Throughout the summer, as investors anticipating tighter monetary policy in the United States dumped emerging market assets, authorities in Jakarta fought a fierce rearguard action to defend the rupiah currency.They largely failed: The rupiah fell 12% from May through August, making it one of the worst performers among emerging market currencies beset by fears of U.S. Federal Reserve “tapering.”Even when other Asian currencies eventually rebounded, the rupiah stayed weak. Now it’s on a fresh downswing, dropping sharply in November to a fresh 4.5-year low around 12,000 to the dollar – possibly abetted, this time, by the central bank. It’s not clear if Bank Indonesia Gov. Agus Martowardojo has read a November column by Olivier Blanchard, director of the International Monetary Fund’s research department, but he appears to be thinking along the same lines. Reflecting on a recent IMF conference, Mr. Blanchard wrote that for emerging markets “the evidence suggests the best way to deal with volatile capital flows is by letting the exchange rate absorb most…of the adjustment.”
As Money Supply Surges, Some Warn of Bubble Risk in Philippines -- Consumer price increases in the Philippines look benign, barely at the bottom of the central bank’s target range in November despite the impact of Typhoon Haiyan.But other indicators suggest that beneath the surface, trouble could be brewing.Money-supply figures released last week showed domestic liquidity in the Philippines rose 32.5% in October from a year earlier — the fourth straight month it has grown by more than 30%, and a possible warning sign of future asset bubbles. By way of comparison, money supply in Singapore grew just 7.0% in October, and 7.9% in Malaysia. Money supply once was a key focus for authorities and a guideline for central bank policy, but central banks increasingly have moved toward targeting consumer inflation directly. But money supply still can give crucial clues to the outlook for consumer and asset prices, especially when it changes quickly: Behind the surge in Philippine money supply is a decision by the country’s central bank to restrict access to its special deposit accounts – a tool it uses to control liquidity in the banking system — and lower the interest on those accounts.The aim was to encourage investors to put their money to more productive use, while reducing capital inflows and appreciation in the Philippine peso and lowering the central bank’s operational costs. Some economists are worried about the possible side effects.
Emerging-Market Growth Rose Modestly in November - Increased manufacturing production drove emerging-markets’ economic output higher in November, according HSBC Holdings PLC’s index of business activity in the developing world. The HSBC Emerging Markets Index, which tracks purchasing managers’ index reports from 16 emerging economies, rose to 52.1 in November, from 51.7 the previous month. A reading above 50 indicates an expansion in activity. The rise, though relatively modest, still marks emerging markets’ fastest increase in business activity since March, HSBC said in a report late Wednesday. Rising manufacturing output was the main source of the improvement in growth, HSBC said. Chinese goods producers helped add some momentum to the manufacturing sector, with China’s manufacturing activity rising to 52.3 in November, from 51.8 the previous month, HSBC said. Manufacturing output in Brazil and Russia, however, decreased from the previous month. Services activity, meanwhile, was unchanged from the previous month, HSBC said.
Emerging Market Slowdown to Last for Years - Unilever (UNA) Chief Executive Officer Paul Polman said the economic slowdown in emerging markets is here to stay as many countries need to enact structural reforms to adjust to new conditions after the boom of recent years. “They are still relatively stronger economies, but still fragile,” Polman said. “And you see that growth coming off now a little bit, obviously not being helped either by lower demand coming from Europe and the U.S. This will last a few years. And it will only be corrected if some of the reforms have been made in these places.” “I am always surprised that I am the one who sort of has to announce there’s a slowdown in emerging markets,” Polman said, “Emerging markets are clearly decelerating, but will always grow faster than the developed world,” said Jon Cox, an analyst at Kepler Cheuvreux in Zurich. “Unilever is the emerging market play -- given 60 percent of sales are there, what Polman says on them has a lot of weight.”
Mexico Housing Hits U.S. Investors as Plan Collapses - Power outages drag on for hours at a time. Neighboring townhouses lie abandoned by the hundreds, giving criminals a growing foothold in the community. The stench of overflowing sewage permeates the development. And then there’s the commute: Until Orozco started driving to work, it was a van-to-train-to-bus odyssey whose cost consumed 20 percent of her pay. Orozco, a 52-year-old widow, is looking to leave her $18,500 house and move with her daughter and granddaughter closer to Mexico City. If she does, she’ll join an army of disenchanted homeowners who moved in the past 10 years to the sprawling new towns that have sprung up in most of Mexico’s 31 states. The buyers all signed up for a government-backed program that helped finance construction of millions of homes. The complexes ring the country’s major cities from Veracruz to Mexico City to Tijuana. The program has been a disaster. Hundreds of thousands of homes are now derelict after buyers such as Orozco concluded they were located too far from city centers and moved out. Developers, their profits assured by government guarantees, built houses faster than municipalities could connect them to water systems and power grids. Promised schools were never constructed. Now, the developers have halted construction on what have become rural slums. European lenders that helped finance the housing frenzy are suing the builders.
Brazil Economy Shrinks More Than Forecast on Investment Fall - Brazil’s economy shrank in the third quarter more than analysts forecast as above-target inflation, deteriorating fiscal accounts and rising interest rates sapped confidence and crimped investment. Swap rates fell. Brazil’s gross domestic product fell 0.5 percent in the July to September period from the previous three months, the biggest drop since the first quarter of 2009, the national statistics agency said today in Rio de Janeiro. The drop was larger than forecast from 38 economists surveyed by Bloomberg, whose median estimate was for a 0.3 percent drop, and follows a revised 1.8 percent gain in the second quarter. On an annualized basis, the third quarter decline was 1.9 percent. Earlier this year, President Dilma Rousseff’s administration attempted to revive growth by extending tax cuts to stoke demand for durable goods, boosted subsidized credit to businesses and auctioned concessions for her $240 billion infrastructure program to draw private capital. Her stimulus fueled inflation and widened the budget deficit. Today’s data ease pressure on the central bank to continue its series of half-point increases to the benchmark interest rate
Would You Rather Have Brazil's Problems or America's? - Two of the main drivers of a country’s economic growth are the size of its workforce and the productivity of its workers. In Brazil, rapid growth in the working-age population and rising labor-force participation have been boosting GDP for years, but have now pretty much run their course. The country’s fertility rate has fallen from 4.1 births per woman in 1980 to 1.8 now, and that decline has meant fewer people entering their working years. And full employment means that labor force participation simply can’t go much higher. I heard these arguments from Marcelo Carvalho, BNP Paribas’ chief economist for Latin America, earlier this fall in São Paulo. He was speaking at an HBR Brasil conference on Brazilian competitiveness, and his message was pretty gloomy. The country’s only hope of continued economic success, he said, was strong productivity growth. But it hasn’t been getting that lately. To illustrate, Carvalho showed a variation of the chart below: His message was that Brazilian workers have been getting a gift that can’t just keep on giving. My reaction, though, was that the chart looked awfully familiar, in an upside-down sort of way. As in, Isn’t this the exact opposite of what a chart of productivity and wages would show in the U.S.? Sure enough, it more or less is. The lines are flatter in the U.S., as befits an already very developed, very rich economy. But in sharp contrast to the situation in Brazil, productivity has been rising faster than wages in the U.S. since 2001 — which lends a helpful perspective to the often downbeat discussion over the economic future here:
Boost for manufacturers as global demand picks up - FT.com: Rising global demand sparked a pick-up in manufacturing activity across the world in November, according to polls of purchasing managers. Activity in the US rose at its fastest pace since April 2011, continuing a run of strong Institute for Supply Management data, at the start of a crucial week of data ahead of the US Federal Reserve’s policy meeting on December 18. The US manufacturing ISM rose to 57.3, from an already strong 56.4 in October, and important components did even better with the forward-looking new orders index up from 60.6 to 63.6. A reading of 50 divides expansion from contraction. The figures point to a strengthening of the global economy after weakness earlier this year. They will raise hopes for strong growth in 2014 and may increase the odds that the Fed soon chooses to “taper” its asset purchases from $85bn-a-month. However, the ISM has run ahead of other data on the US economy, and the single most important release will be Friday’s number on November jobs, with the consensus forecast running at 188,000 new posts. Activity in the eurozone’s factories increased by a little more than expected, propelled by better conditions in Germany, Italy and Greece. The manufacturing purchasing managers’ index for the single-currency area, compiled by data firm Markit, rose to 51.6 – up from an initial flash estimate of 51.5 and the highest level since June 2012. It is the fifth successive month that the reading has been above 50.
World-Wide Factory Activity, by Country -- Much of the world’s factory sector was expanding in November, as manufacturers in the U.S. posted their strongest month since April 2011 and much of the euro zone rebounded. Purchasing Managers Indexes, in which readings above 50 signal expansion, were higher in the U.S., China and across Asia. The U.K.’s PMI was higher, as was the overall number for the euro zone. However, factories in France and Spain were in contractionary territory.
Factories Worldwide Are Showing Momentum - Bucking fears of a sharp brake on growth after the government shutdown in the United States and earlier signs of distress in Europe and Asia, global manufacturing activity sped up in November, raising hopes for a broader global economic turnaround in the coming year. In the United States, figures released on Monday showed factories operating at the most robust pace since the spring of 2011, and well above the level economists had expected for the month. Separate surveys out Monday in Europe and China also offered encouraging signs in a sector often considered a bellwether for the global economy. Experts attributed the rebound in the United States to demand from a recovering construction sector, as well as rising exports. Overseas, German factories helped push manufacturing in Europe forward, while China also showed unexpected strength. The recovery is gradual and isn’t spectacular, but in an environment of fiscal headwinds, it looks good.”
PC shipments to see ‘severe fall’ - Global shipments of personal computers (PCs) are expected to see their "most severe yearly contraction on record" in 2013, according to research firm International Data Corporation (IDC).The firm said sales of PCs would fall by 10.1% this year, worse than the previous estimate of 9.7%. PC sales have fallen for the last six quarters, the longest historical drop. Global shipments of PCs have been hurt by the growing popularity of tablets and smartphones."Perhaps the chief concern for future PC demand is a lack of reasons to replace an older system, " Jay Chou, a senior research analyst with IDC, said in a statement. Worldwide shipments would continue to fall in 2014 but at a slower pace, said IDC.
Global factory growth picks up but Europe diverging (Reuters) - Increasing demand for manufactured goods drove global factory activity higher last month but the spurt in the euro zone masked a widening disparity among some of the bloc's key members. As year-end approaches, the global economy is showing signs of a more solid recovery, with encouraging signs from some economies, particularly Britain, of an acceleration. But growth in Europe's 17-nation currency union remains weak and Markit, compiler of the monthly Purchasing Managers' Indexes, said on Monday that there was evidence of a renewed downturn in France and Spain. Markit's Eurozone Manufacturing PMI rose to 51.6 last month from October's 51.3, a two-year high, just pipping an earlier flash reading of 51.5, and the fifth consecutive month showing growth. The output index nudged up to 53.1 from 52.9. France's PMI fell to a five-month low of 48.4 from 49.1, chalking up its 21st month below 50, while Spain's sank back below the 50 break-even mark after spending the last three months in growth territory. By contrast, data from Germany, Europe's biggest economy, showed factories there had their best month since mid-2011. Italian figures showed manufacturing there also picked up speed.
Everything’s Fine In A Parallel Universe – Ilargi - Last week, I was reading parts of a report issued by Japanese investment bank Nomura, which started out saying that the “Global Financial Crisis” is over. If I lay out a statement like that side by side with a lot of other things I see, I can only conclude that Nomura doesn’t reside in the same universe I do. Well, it’s either that or they have the idea that a financial crisis is something that exclusively plays down in, and affects, the “world” of investors. If the latter is true, that would of course be some pretty myopic thinking. So I’m left with just one possible conclusion: that we live in parallel universes. And I understand from perusing the notions about such universes in physics theories that they tend to include every possible universe. Therefore, if some of the best and brightest physicists who live in the same universe that I do tell me that there are other universes in which Elvis is very much alive, I must acknowledge the possibility that there are also some in which the Global Financial Crisis is indeed over. That still leaves me with the fact that I live in the universe I live in, and not in Nomura’s one. And even though the theory states that I may live in many others as well, that part of the theory is simply not of much practical use. So, given the fact that Nomura’s analysts write reports about a universe that may be parallel to mine but is decidedly different, these reports don’t seem to be of much practical use either. I therefore hope these analysts won’t be too disappointed that I don’t intend to turn to them for advice. They picked a nice title: The end of the end of the world.
Dr Doom: The global housing bubble is back -- It’s congratulations all around to global central banks today as the seer of the GFC, Nouriel Roubini, returns to declare the obvious, that the global housing bubble that brought the global economy to its knees is back, and it’s bad! From Project Syndicate:It is widely agreed that a series of collapsing housing-market bubbles triggered the global financial crisis of 2008-2009, along with the severe recession that followed. …Now, five years later, signs of frothiness, if not outright bubbles, are reappearing in housing markets in Switzerland, Sweden, Norway, Finland, France, Germany, Canada, Australia, New Zealand, and, back for an encore, the UK (well, London). In emerging markets, bubbles are appearing in Hong Kong, Singapore, China, and Israel, and in major urban centers in Turkey, India, Indonesia, and Brazil. …With central banks – especially in advanced economies and the high-income emerging economies – wary of using policy rates to fight bubbles, most countries are relying on macro-prudential regulation and supervision of the financial system to address frothy housing markets. That means lower loan-to-value ratios, stricter mortgage-underwriting standards, limits on second-home financing, higher counter-cyclical capital buffers for mortgage lending, higher permanent capital charges for mortgages, and restrictions on the use of pension funds for down payments on home purchases.…To be clear, macro-prudential restrictions are certainly called for; but they have been inadequate to control housing bubbles.
Two Simple Reasons to Not Fight Bubbles With Higher Interest Rates - I had no idea that Sweden has gone all-in on raising interest rates to fight "financial instability." (Alas poor Lars Svensson!) Simon Wren-Lewis has details, Krugman has more, and Peter Orszag had a great column about how New Zealand is instead using regulations to fight worries about the financial system. I've been long fascinated by this topic. The stakes are very high: should we endure a mini-recession, with lower employment and output, to fight a thing called “financial instability”? I offered a list of reasons why the answer should be a resounding "no", but I recently found two more. These two are much clearer, and I think should provide a major hurdle to clear for those who think we should raise rates.
Putin Battles Europe for Former Soviet States Amid Kiev Protests - Vladimir Putin’s dream of recreating the Soviet empire is being tested on the streets of Kiev. Hundreds of thousands of demonstrators facing off against riot police in the Ukrainian capital are protesting civil rights infringements and a government decision to back off signing free-trade accord with the European Union. The battle is really about whether Russian President Putin can extend his economic influence over its ex-Soviet neighbor. “For Putin, Ukraine is the Great Game with the EU -- and the big prize,” . “Bringing it into the fold would recreate a big part of the Soviet Union inside his trade zone.” Putin, who described the 1991 collapse of the Soviet Union as the “greatest geopolitical catastrophe” of the 20th century, is using his country’s energy wealth to anchor Ukraine, Armenia, Kazakhstan and Belarus in a Russian-led bloc after two decades of advances by the West. Ukraine, the route for half of OAO Gazprom (GAZP)’s gas shipments to Europe, faces a choice: cheaper gas and continued access to its traditional customers, or stronger ties with the EU’s $18 trillion market.
[PART 1] U.S. Current Account Deficits and German Surpluses: The Role of Income Distribution in Global Imbalances - Germany’s economic policies are under attack from all sides. The United States Treasury Department, in its Semiannual Report on International Economic and Exchange Rate Policies, charged that the German current account caused a “deflationary bias for the euro area, as well as for the world economy.” International observers have been ridiculing the German government, with its obsession with export surpluses, wage and price competitiveness, and fiscal discipline (see here, here, here and here). There is a widespread fear that Germany’s beggar-thy-neighbor policies may push the euro zone into a Japanese-like deflationary trap. Even the European Commission seems to “utter the unmentionable” to the Germans – that their persistent current account surplus is not a sign of a healthy economy but in fact a macroeconomic imbalance subject to the EU’s macroeconomic imbalance procedure.The current discussion about Germany’s trade surplus is, of course, part of the much broader debate about global current account imbalances, which are widely seen as a major underlying cause of the Great Recession starting in 2008. Fiscal policy and real exchange-rate misalignments are agreed to be important factors behind the imbalances. Yet, the important role of income distribution in the widening of global imbalances since the 1980s has not been widely recognized, as we explain in two new working papers (here and here). Several economists (here, and here) have pointed out the link between the secular rise in (top-end) income inequality, the fall in household saving, the rise in household debt, and the decrease in the current account in the United States and other Anglo-Saxon countries.
[PART 2] U.S. Current Account Deficits and German Surpluses: The Role of Income Distribution in Global Imbalances - In our two papers, we analyze how changes in personal and functional (wages versus profits) income distribution interact to produce different macroeconomic outcomes in different countries. On the basis of a stock-flow consistent model calibrated for the United States, Germany, and China, simulations suggest that a substantial part of the increase in household debt and the decrease in the current account in the United States since the early 1980s can be explained by the interplay of rising (top-end) household income inequality and certain institutions (e.g. easy access to credit, privately financed education and health care systems). On the other hand, the weak domestic demand and increasing current account balances of Germany and China since the mid-1990s are strongly related to shifts in the functional income distribution at the expense of the household sector. We also argue that expenditure cascades have been weaker in Germany and China, as compared to the United States, as a result of different patterns of personal income inequality and country-specific institutions.The figure below illustrates the results of one of our estimations. The estimated joint effects of changes in personal and functional income distribution are quantitatively very important. Taken together, changes in top income shares and the corporate balance explain, respectively, about half and one third of the actual decreases in the current account in the United States and the United Kingdom between the early 1980s and the Great Recession, about one third of the increase in the current account of Germany, and 100% and more of the increases in the current accounts of China and Japan.
Germany, Austerity’s Champion, Faces Some Big Repair Bills -- He did eventually come up with an alternative route. But it is telling of the sorry state of some of Germany’s roads and bridges: His company is driving the turbines to a ferry, shipping them north to Denmark and then driving them south again back into Germany. “That’s how bad it is,” Mr. Dechant said recently, explaining the 186-mile detour in his office here. “We just haven’t invested enough. And now there is trouble because there is no easy button to fix it all.” Germany was once known for its superfast autobahns, efficient industry and ability to rally public resources for big projects, like integration with the former East Germany. But more recently, it has been forced to confront a somewhat uncharacteristic problem: Its infrastructure — roads, bridges, train tracks, waterways and the like — is aging in a way that experts say could undermine its economic growth for years to come. As it has been preaching austerity to its neighbors, Germany itself has kept a tight rein on spending at home. Now critics abroad, including the European Union and the United States, are pressing it to do more to stimulate its own economy, and Chancellor Angela Merkel’s likely partners in a new coalition government, the left-leaning Social Democrats, are seeking more money for a variety of domestic programs.
Weak Growth: Agency Strips Netherlands’ AAA Rating - The list of euro-zone countries with immaculate credit ratings took another hit this week. On Friday morning, Standard & Poor's (S&P) removed the Netherlands' top rating, downgrading the country to AA+. This leaves only three countries in the common currency area with the best grade of AAA: Finland, Luxembourg and Germany. Two years ago, six countries still had that rating. S&P stated the downgrade resulted from weaker prospects for economic growth than previously anticipated. The agency said the atmosphere would make it more difficult for the government to reach its fiscal targets. Despite a "stable" outlook for the Netherlands, the company said the development of the country's per capita gross domestic product is "persistently lower" than nations with similarly high levels of economic development. The other two major rating agencies, Moody's and Fitch, have also threatened the Netherlands with a downgrade. Dutch Finance Minister Jeroen Dijsselbloem, who is also president of the Euro Group, recently announced that his country would violate the European Commission's deficit rules despite an additional €6 billion ($8.16 billion) austerity package. Dijsselbloem has stated that he doesn't think the move by S&P will have any substantial effect on the interest rates the country pays on its debt. In a statement released Friday in The Hague, Dijsselbloem said he was "disappointed" by the downgrade, but that he didn't expect it to have any impact on interest rates because the markets were already expecting the change.
The Netherlands "Depressingly Predictable Path" -- Simon Wren-Lewis documents the austerity insanity: Here we go again:
- 1) Government embarks on austerity, to try and maintain the confidence of the bond markets. We must preserve the AAA rating for our government’s debt, says the finance minister.
- 2) Austerity reduces demand, helping create flat or negative growth.
- 3) As a result, deficit targets keep being missed. Additional austerity is imposed, and growth declines again.
- 3) Country loses its AAA rating, and the credit rating agency gives concerns about poor growth as an important factor for the downgrade.
- 4) This confirms our fears, says the finance minister. We must redouble our efforts to reduce our debt.
The European Balanced Budget Disaster - A balanced budget requires that private savings minus private investment plus current account deficit ( = capital account surplus) sum to zero. There is little reason to think that such a relationship is compatible with economy operating at potential output—let alone at full employment. Attempts to achieve a balanced structural budget without actions which will raise investment, lower savings, and promote net exports are doomed. The pursuit of balanced budgets will involve cutting public expenditure and raising taxes; it will not achieve the target and will involve misery along the way. How long will it take until the Eurozone authorities and countries recognize that the conditions of the “fiscal compact” are unattainable in the sense that—whilst some countries are able to have a budget balanced at “potential output”—most cannot? Continuing to insist that fiscal austerity be pursued to balance budgets will bring misery. But now that the structural balanced budget requirement is written into national constitutions with penalties for failure to do, how will the counties signed up to the Treaty wriggle out of those commitments?
Moody's upgrades Greek government debt -- Yesterday the Eurozone received some positive (though largely symbolic) news. Moody's decided to upgrade the rating on Greek government debt from C to Caa3. It's an important psychological step for the area because Greece was the flashpoint for the Eurozone crisis. Here is the rationale for Moody's action:
(1) The significant fiscal consolidation that has taken place under Greece's structural adjustment program despite low growth and political uncertainty. As a result, Moody's expects that the government will achieve (and possibly outperform) its target of a primary balance in 2013, and record a surplus in 2014 in accordance with the adjustment program.
(2) The improvement in Greece's medium-term economic outlook supported by a cyclical recovery in the economy and also the progress made in implementing structural reforms and rebalancing the economy.
(3) The significant reduction of the government's interest burden following previous restructurings and official sector repayment assistance.
To be sure, most economic data out of Greece continues to resemble a full-scale depression. The unemployment rate is at 27% and youth unemployment is at 57%. Credit to the private sector has fallen 56% from the peak and continues to decline. Manufacturing, new orders, industrial production, retail sales, etc. are all contracting (though the rate of contraction has slowed).
What Europeans Should Know About the Current Situation in Greece - Some positive sounds are audible from Greece these days. Mostly produced by the government itself, of course, but also by Merkel, by the OECD (along with some negative sounds), by some European officials (while others say they’re ‘impatient’ with Greece). Is Greece slowly recovering? It takes a passionate disregard for the truth to suggest that Greece is recovering. Investment has fallen by 18% since the dismal levels of 2011/12, credit to non-financial institutions is 20% down from the asphyxiating depths of 2012, poverty has reached record heights, and is still growing, employment is at levels that are best narrated in the style of Steinbeck’s Grapes of Wrath, public debt is exceeding the worst expectations of the greatest pessimists, private debt is reaching for the sky at a time when the collateral posted (e.g. house prices) are sinking fast, the government’s tax take is trailing the worst forecasts. The list of woes is endless. The positive sounds refer to the budget surplus, to a small growth (says the gov’t) or just a small recession (says the others) of the economy. Europeans have a duty to themselves to see through this toxic propaganda. There is no such thing as a Greek budget surplus – not even a primary surplus (i.e. a surplus if we not count loan and interest repayments). If you look at the government’s own accounts, the January to October 2013 balance reveals a primary budget deficit of nearly €6 billion. As for growth, the Greek economy is still, by the government’s own accounts, shrinking at -4%. The projection of growth of… 0.4% is for 2014. Europeans need to look at this projection in the context of similar projections which, for example, had (at the time of ‘bailout Mk1’) Greece growing by 2012 at a dizzying rate of 2.3%! In truth, 2014 and 2015 will again see the Greek social economy shrink further.
Greek strikes build as austerity talks stalled — State doctors in Greece on Wednesday extended a strike through Dec. 13, after negotiations with the government over job cuts failed. The government is under pressure from international bailout lenders to make deeper cuts in a sixth year of recession, prompting doctors employed by the country’s largest public health insurer to launch strikes last month. While not affecting emergency care at hospitals, the doctors’ protest has led to longer waiting times for regular medical appointments. Health Minister Adonis Georgiadis said hospitals would increase their workload during the strike. “If the (unions’) view is that they intend to strike forever, and their approach is all or nothing, our answer is that this government and our society will not tolerate blackmail by any group protecting its interests,” he said. Anti-austerity strikes have intensified as the government scrambles to meet targets for job cuts and implement other cost-cutting measures. Athens University, the country’s largest, has been closed since the start of the fall semester, also due to cuts in administrative staff. The latest government attempt to break the deadlock at the university failed on Wednesday.
Unemployed Greeks Reconnect as Underground Electricians Defy Law -- Like thousands of other Greeks, Ioannidis had his power disconnected because he couldn’t pay his bills. He owes 2,700 euros ($3,668) and can’t make even the 150 euro monthly payments he negotiated with the power company. When his electricity was cut off in October -- for the second time in two years -- he illegally reconnected it, jerry rigging the cables. “I have lost my father and my younger brother and I don’t want to lose my mother,” said Ioannidis, 55, in an interview in his mother’s small apartment in a working-class neighborhood in Thessaloniki. “My mother’s health is more important to me than being legal.” Losing electricity is another hardship facing Greece’s unemployed, who now number 1.37 million, or 27 percent of the population able to work. There were 257,002 disconnections because of nonpayment of bills in the first nine months of the year, putting the country on pace to surpass last year’s total by 5.4 percent, according to the Regulatory Authority for Energy. The disconnections have spawned a movement of underground electricians who illegally restore power for themselves and others. About 1 in 10 homes will be reconnected without authorization this year, according to the Hellenic Electricity Distribution Network Operator S.A.
Greek Strikes Build as Austerity Talks Stalled - State doctors in Greece on Wednesday extended a strike through Dec. 13, after negotiations with the government over job cuts failed. The government is under pressure from international bailout lenders to make deeper cuts in a sixth year of recession, prompting doctors employed by the country's largest public health insurer to launch strikes last month. While not affecting emergency care at hospitals, the doctors' protest has led to longer waiting times for regular medical appointments. Health Minister Adonis Georgiadis said hospitals would increase their workload during the strike. "If the (unions') view is that they intend to strike forever, and their approach is all or nothing, our answer is that this government and our society will not tolerate blackmail by any group protecting its interests," he said. Anti-austerity strikes have intensified as the government scrambles to meet targets for job cuts and implement other cost-cutting measures. Athens University, the country's largest, has been closed since the start of the fall semester, also due to cuts in administrative staff. The latest government attempt to break the deadlock at the university failed on Wednesday.
Americanized Labor Policy Is Spreading in Europe - In 2008, 1.9 million Portuguese workers in the private sector were covered by collective bargaining agreements. Last year, the number was down to 300,000. Spain has eased restrictions on collective layoffs and unfair dismissal, and softened limits on extending temporary work, allowing workers to be kept on fixed-term contracts for up to four years. Ireland and Portugal have frozen the minimum wage, while Greece has cut it by nearly a fourth. This is what is known in Europe as “internal devaluation.” Tethered to the euro and thus unable to devalue their currency to help make their goods less expensive in export markets, many European countries — especially those along the Continent’s southern rim that have been hammered by the financial crisis — have been furiously dismantling workplace protections in a bid to reduce the cost of labor. The rationale — forcefully articulated by the German government of Angela Merkel, the European Commission and somewhat less enthusiastically by the International Monetary Fund — is that this is the only strategy available to restore competitiveness, increase employment and recover solvency. These policy moves are radically changing the nature of Europe’s society. “The speed of change has certainly been very fast,” said Raymond Torres, the chief economist of the International Labor Organization in Geneva. “As far as I can tell, these are the most significant changes since World War II.”
Debt Deflation in Spain: Record 4.7% Decline in Household Credit, Business Lending Down 10% - Kiss any notion of a Spanish recovery goodbye. Via translation, El Pais reports Household credit suffers record fall in October despite the rescue. Credit in Spain continues to show signs of weakness, year and a half after the Troika bailout.Statistics from the Bank of Spain show that household credit fell 5.2% in October to 793.940 billion euros. If we look at the evolution of the cash flow of borrowed money, the net change in assets is a decrease is 4.7%. In October, the credit borrowed to buy homes fell 4.7%, maintaining its rate of collapse, to 614.860 billion euros. Lending to businesses fell 10% in October, to 1.081 trillion euros. In both cases, the amount of money borrowed is at its lowest level since 2007.
The raiding of Spain’s “pensions piggybank” - Spain drew €5bn from the Social Security reserve fund on Monday, reported Europa Press, and will draw an additional €428M on account of income tax before the end of the month. Presumably this is to help attain the year’s deficit target. Commentators present this as “raiding the piggybank” of the pension system. Europa Press writes that, in 2012-2013, €23.6bn will have been drawn from the fund, bringing it down to €53.7bn. The original €77bn had been gradually accumulated over the previous decade. For comparison, Spain’s pension outlays are slightly over €100bn a year or roughly 10% of GDP, so the pension [reserve] fund even at its peak was only enough to cover about 9 months’ worth of pensions. Another source of public consternation has been the fact that 97% of the reserve fund is invested in Spanish public debt, up from 55% in 2008, as described by Expansión earlier this year. Before the crisis sovereign spreads were minimal and the fund was diversified among various Eurozone member states, but in 2009 the government of PM Zapatero started trading higher-rated debt for Spanish debt and the process of rebalancing into Spanish debt was nearly complete by the end of 2012.
French Unemployment Highest Since 1998 - Unemployment in France rose to its highest level in nearly 16 years in the third quarter, dealing a fresh blow to President François Hollande who has pledged to bring unemployment down by the end of the year. Unemployment in the euro zone's second-largest economy rose to 10.9% in the third quarter, from 10.8% in the second, according to data published Thursday by national statistics agency Insee. The rate hasn't fallen since the beginning of 2011, bringing joblessness in France to a level not seen since the beginning of 1998. The socialist leader has pinned his hopes on monthly unemployment data from the labor ministry, which showed last week that the number of people registered as unemployed fell by over 20,000 in October from September. Mr. Hollande said at the time this showed "the inversion of the unemployment curve has begun." He has pledged to achieve that inversion by the end of 2013. Barclays' European Chief Economist Philippe Gudin said: "Inverting the unemployment curve is still possible...We are now in a phase of stabilization that remains very fragile." Mr. Hollande has made fighting unemployment the keystone of his economic policy but achieving a lower jobless rate has been hampered by weak underlying growth. After recovering from recession in the second quarter, the latest gross domestic figures show economic output contracted again in the third quarter. Large and small French companies are pressing ahead with job cuts and restructuring plans.
France Unemployment Surges To 16 Year High - Europe's second largest economy and crucial to the core founding partnership of the euro project, France, has seen its unemployment rate rise unceasingly for 9 quarters in a row now. At 11.03%, French unemployment has not been higher since Q3 1997. Of course, President Hollande, despite falling PMIs and rising unemployment is hopeful that things are turning around as he notes, France is "now in a phase of stabilization that remains very fragile." Some optimism can be taken from the relative stability in youth unemployment for a change but the over-50s unemployment reached an all-time high of 8.2%.
Nearly Half of Younger Southern Europeans Underemployed - In 2013, nearly half of 15- to 29-year-olds in six southern European countries are underemployed -- meaning they are either unemployed or working part time but wanting full-time work. Though the unemployment rate is the labor market indicator that typically grabs headlines, underemployment may be almost as damaging to younger people in terms of their own long-term prospects and their countries' labor productivity. Temporary and part-time jobs are those most often available to young people, and they are often the first to be laid off because they lack seniority. Underemployment rates are much lower among southern Europeans aged 30 to 49 (26%) and those aged 50 and older (24%). Young people in southern Europe almost universally (90%) say it is a bad time to find a job in their communities, versus about two-thirds of young people in western Europe (67%) and eastern Europe (68%). However, at 57%, labor force participation among young southern Europeans is as high as it has been over the last several years, suggesting that those who find themselves out of work do not have the option of leaving the workforce altogether -- to pursue educational opportunities, for example -- until the labor market improves.
Euro-Area Economic Growth Slows as Exports, Consumption Cool - The euro area’s nascent recovery from a record-long recession nearly stalled in the third quarter as exports and household consumption cooled. Gross domestic product rose 0.1 percent after a 0.3 percent gain in the previous three months, the European Union’s statistics office in Luxembourg said today. That’s in line with Eurostat’s initial estimate. From a year earlier, the economy contracted 0.4 percent.The European Central Bank cut its main refinancing rate to a record-low 0.25 percent on Nov. 7, based in part on its forecast for “continued, albeit modest, growth in the second half of the year.” The ECB predicts the euro-area economy will contract 0.4 percent this year before growing 1 percent in 2014. It will release new forecasts tomorrow.
Europe repeating all the errors of Japan as deflation draws closer - The whole eurozone must have a higher inflation rate to lift the South far enough above the deflation line to gain breathing room. Europe is one shock away from a deflation trap. A surprise anywhere in the world is all that it needs: an upset in China as the credit bubble pops, or a global bond shock as the US Federal Reserve winds down monetary stimulus. Producer price inflation (PPI) fell to -1.4pc in the eurozone in October. This is how deflation becomes lodged in the price chain. "Prices are sticky for a while as you approach zero inflation, but once you break through the ice into deflation things can move fast, as we've seen in Greece," . "The European Central Bank needs to act before the horse has already bolted." Mr Callow said excess industrial plant in China is exporting deflation across the world. China's fixed capital investment over the past year has been $4 trillion, compared with $3 trillion for the entire EU and $3 trillion for the US. This has grown eightfold in a decade. It is a vast new source of supply for a saturated global economy.
PREs, VSPs, and the ECB - Paul Krugman -- Via Mark Thoma, ECB Watchers reports on what it calls a “confusing” speech by Peter Praet, the chief economist of the European Central Bank. But actually there’s nothing at all confusing about it — if there’s any puzzle, it lies in the underlying political economy of the situation. Praet, we learn from the speech, is a PRE; so, probably, are many of his colleagues at the ECB, including, one suspects, Mario Draghi himself. But they have to operate in an environment where Europe’s VSPs, who are both doctrinaire and in important ways anti-intellectual, still hold enormous power. So, Praet’s speech: the interesting thing here is that he shows himself to be a Perfectly Reasonable Economist, aware of the problems of the two zeroes — the zero lower bound on interest rates and the great difficulty in engineering downward movements in nominal wages. As a result, his underlying framework for thinking about European problems seems essentially indistinguishable from mine; as ECB watchers says, it’s a framework that sees a useful role for moderate inflation, both to avoid the zero lower bound and to ease the path of internal devaluation. And you do have to wonder what calculation leads to the notion that a target of “close to but less than 2%” is appropriate, as opposed to, say, 3 or 4 percent. But actually you don’t have to wonder. Whatever Praet may privately think, he and his boss have to deal with Europe’s Very Serious People — people who believe in austerity regardless of circumstances, and who also say things like this, from the Bundesbank’s Jens Weidmann, declaring that “the money printer is definitely not the way to solve [Europe's problems]“. This is stated as if it is a self-evident truth — even though any PRE can easily make the case (as Praet does) that the money printer is, in fact, something that can offer a great deal of help in solving Europe’s problems.
Is It Time to Pull the Plug on the EU? - A financial and political disaster has been transformed into a permanent calamity. Most of southern Europe dwells in an economic depression and the rest does not appear to be recovering. Success is currently defined as not being in recession. As “growth” in the third quarter fell to 0.2 per cent in the EU (in the Euro-currency group 0.1 per cent) there is talk of “recovery still slowly stabilising”. It is truly impressive to what depths success can plumb. The reality of the malaise came home to many as the year-on-year core inflation rate (excluding volatile items such as energy and food) in the EU fell to 0.8% in October. With deflation now a threat for many EU member states (it is already reality in Greece, Bulgaria, Cyprus and Latvia), one must ask not only how the highly indebted EU nations are to repay their debts, but how the European Union can achieve an internal rebalancing? If Germany with its high productivity has low inflation, the other EU countries, who would have devalued their currency before the inception of the Euro, will have to dramatically deflate their economies – and that after years of virulent austerity. This might seem a simple solution for economists and bureaucrats, but EU member states are democracies and patience in many of the peripheral nations – and not only those – is running very short.
European Central Bank Stands Firm on Rates - On Thursday, when much of the world economy looked a bit brighter, even the European Central Bank offered a more optimistic view of the cloudy euro zone. The bank, saying growth was poised “to gain some traction” as record-low interest rates began to flow to businesses and consumers in the form of cheaper loans, raised its forecast for 2014 slightly. “All in all, we’re seeing positive developments,” Mario Draghi, the president of the central bank, said at a news conference, after the bank left its main interest rate unchanged at 0.25 percent. While subdued and accompanied by caveats, Mr. Draghi’s assessment fit with upbeat economic reports from the United States, where third-quarter growth was revised sharply up, and from Britain, where the government also raised its growth forecasts. At the same time, Mr. Draghi showed his preference for brandishing monetary policy weapons rather than firing them. He emphasized that the central bank could still do plenty to stimulate growth or head off deflation, a destructive downward spiral of prices. But he announced no new measures Thursday and gave no indication that any were imminent.
ECB Cuts Inflation Forecast as Draghi Pledges Low Rates -- European Central Bank President Mario Draghi re-affirmed that interest rates will stay low for the foreseeable future, after officials cut their inflation forecast for next year. “We may experience a prolonged period of low inflation,” Draghi said at a news conference in Frankfurt today, echoing language he used last month after the ECB unexpectedly cut interest rates. Today, the ECB kept its main rates unchanged.Draghi reiterated his commitment to keeping borrowing costs low “for an extended period of time” as policy makers continue their deliberations over whether they have done enough to prevent deflation and support the region’s recovery, or whether they need to embrace measures such as a negative deposit rate. Draghi said that officials had a “brief discussion” on whether to cut the deposit rate and hinted that any future offerings of unlimited liquidity to banks will have conditions attached.
Draghi Paints Gloomy Picture but Signals No New Moves -- European Central Bank President Mario Draghi kicked off his monthly news conference by wishing everyone a happy Christmas and New Year. He then painted a far from happy picture of the state of the euro zone’s economy, reaffirming the central bank’s pledge to keep its benchmark interest rate at or lower than current levels for “an extended period of time.” Mr. Draghi said the condition of the economy was one of “broad-based weakness,” although he announced that the ECB’s economists have raised their growth forecast for next year to 1.1% from 1.0%. More worryingly for a central bank that targets an inflation rate close to 2.0%, he said ECB economists had lowered their inflation forecast for next year to 1.1% from 1.3% in September. Even in 2015, they don’t expect the inflation rate to be above 1.3%. Mr. Drahgi described that as “a prolonged period of low inflation,” but in early comments give no indication that was something that the ECB felt a pressing need to respond to with fresh stimulus, although he reiterated that the governing council was ready to react to any fresh sign of deterioration in the growth and inflation outlook, and had a range of tools at its disposal. Mr. Draghi also said that the impact of previous cuts in the benchmark interest rate–the most recent of which came last month, to a record low of 0.25%–had yet to be fully felt, and would be delayed by the weak state of the currency area’s banks.
ECB Bottom Line: Draghi Is in No Hurry - European Central Bank President Mario Draghi is not a man in a hurry. Reuters ECB President Mario Draghi. At Thursday’s press conference Mr. Draghi repeatedly passed up opportunities to add specifics to what the ECB’s remaining policy options are. “We have a full array of instruments,” he said, but added that it’s too early to speculate on the course of action. The ECB’s main policy rate was unchanged at 0.25%, a record low. With little left to cut from that, other options include installing a negative deposit rate, making more loans available to banks or doing full-scale QE. Of the three, Mr. Draghi spoke the most expansively on ways to facilitate credit to the private sector, a signal that this may be the ECB’s preferred course if it can design a program right. Officials only briefly discussed negative deposit rates, Mr. Draghi said. And he avoided opportunities to discuss QE. In short: the ECB seems pretty happy with its policy setup, is ready to act more but doesn’t seem in a hurry.
What is Wrong with the EU? - Eurostat just released the 2012 figures for poverty and social exclusion in the EU. The numbers are terrifying. Let me quote the press release: “In 2012, 124.5 million people, or 24.8% of the population, in the EU were at risk of poverty or social exclusion, compared with 24.3% in 2011 and 23.7% in 2008. ... This is plain unacceptable. And teaches us two lessons
- Our welfare system is not capable anymore to shield workers from the hardship of business cycles. We progressively dismantled welfare, becoming “more like the United States”. But we stubbornly refuse to accept the consequence of this, i.e. that fiscal and monetary policy need (like in the US) to be proactive and flexible, so as to dampen the cycle. Constraints to macroeconomic policy, coupled with a diminished protection from the welfare state, spell disaster, social exclusion, and the destruction of the social fabric.
- The second lesson is that these numbers are there to stay. The economy may recover, but the loss of confidence, of capacity, of social status of those who we pushed into hardship, will stay with us for years to come. We are destroying human capital at amazing speed.
What is enraging is that none of this was inevitable. The crisis could have been shielded by less ideological leadership in European institutions and in some most European capitals. Frontloading of austerity in the periphery was a terrible mistake. Not accompanying it with fiscal expansion in the core was a crime, showing of how little solidarity counts, facing the protestant urge to “punish the sinners”.
700 Years of Government Bond Yields - With the world almost in total agreement that rates can only go up, that the 30-year bull market in rates is over and a return to "normal" rates is timely, perhaps a glance at the following chart of 700 years of government bond yields will enlighten a little as to where the anomalies and what the "normal" is. All too often investors are caught up in their cognitive dissonance-driving recency bias when a bigger picture may just help those who always proclaim to invest for the long-term. It is fascinating to look at where we have been over the years and compare it to today’s markets. In looking at the data, you are trying to identify trends that will help you prepare for opportunities that the future holds. Sometimes you find similarities and sometimes you find differences with the data you are analyzing. That’s what makes it interesting. What never changes, is the fact that for centuries Governments have issued debt and paid interest on that debt. How much interest they pay has certainly fluctuated throughout the years as demonstrated by the chart below.
EU Commission fines banks $2.3 billion for benchmark rigging - (Reuters) - EU antitrust regulators vowed to keep investigating rate- rigging on Wednesday as they slapped a record 1.7 billion euro ($2.3 billion) penalty on six financial institutions including Deutsche Bank, RBS and JPMorgan. The fines by the Commission, which along with authorities around the globe has been examining the manipulation of London interbank offered rate (Libor) and its euro equivalent Euribor, takes the tally of penalties related to the scandal to almost $6 billion. Confirming what a source familiar with the matter had previously told Reuters, EU Competition Commissioner Joaquin Almunia said he had been shocked at the scale of the scam and was sending a clear message that Brussels would fight and impose sanctions on cartels. Deutsche Bank, which has yet to be fined by U.S. and UK regulators as part of separate investigations into benchmark interest-rate fixing, received the highest fine of 725.4 million euros. Germany's largest lender and RBS were fined for their involvement in both the Euribor and Libor cartels. Also fined were JPMorgan and Citigroup, France's Societe Generale and UK-based brokerage RP Martin. Swiss bank UBS and Britain's Barclays avoided fines of 2.5 billion euros and 690 million respectively for revealing the existence of the cartel.
Slovenia needs up to 5 billion euro to clean up troubled banks (Reuters) - Slovenia is expected to need as much as 5 billion euros ($6.8 billion) to recapitalize its banks, sources familiar with the matter told Reuters, a figure some officials say would not require an international bailout. Slovenia's government is determined not to seek international aid and one government official recently said that even were the bill for repair to reach 4.6 billion euros it would not trigger a request for help. The banks are nursing some 8 billion euros in bad loans, equivalent to almost one quarter of economic output, raising speculation that Slovenia, with a population of just 2 million, might become the sixth euro zone economy to need outside help. On December 13, the government will receive the results of an external audit of the banks, which will say how much cash the government must inject to keep them afloat. "The latest figure we have for Slovenia is 5 billion euros,"
Bad debts in European banks rise by €100bn in a year to hit €1.2 trillion - EUROPEAN banks are now sitting on €1.2 trillion of bad or so-called 'non-performing' loans, including over €100bn of Irish soured lending. The amount of problem debts sitting in European banks is up nearly €100bn in just 12 months, according to research from PwC. The more than €100bn of bad loans held by banks here means that Ireland is one of the six worst-affected economies in Europe. Only the UK, Germany, Spain, Italy and France have similar totals, but all are much bigger economies than Ireland. The latest rise in sour loans was driven mainly by increases in Italy, Greece, Spain and Ireland, according to PwC. Further write-offs are expected as boom-era lending continues to generate fresh losses.
Ian Fraser: The “Financial Terrorism” of Royal Bank of Scotland -from naked capitalism --Yves here. This story of institutionalized pilferage of customer accounts hasn’t gotten the attention it warrants in the US. Even if you are pretty jaded about bank chicanery, I suspect you’ll find this account falls in the category of “no matter how bad you think it is, it’s worse.” And in this case, the victims aren’t the usual hapless retail customers, but businesses.I first looked into the activities of RBS’s “recovery and restructuring” arm – global restructuring group and West Register – three years ago, publishing a blog that examined RBS’s despicable treatment of Scotland-based businessman Derek Carlyle in December 2010. I first looked at the allegations of “systemic institutionalised fraud” and systemic abuse inside GRG in June 2012. And in October 2012, I provided further details of alleged widespread wrongdoing inside RBS’s global restructuring group and West Register.This included details of “manufactured defaults” which are when a bank trips a business borrower into breach of covenant through mechanisms including:-
- (a) selling interest rate hedging products under false pretenses, and often under duress as a condition of continued funding support
- (b) the removal of overdraft facilities at 48 hours notice
- (c) arbitrary changes to the terms and conditions of loan agreements, including raising interest rates, adding charges and dramatically shortening loan maturities
- (d) “losing” and then “recreating” lending agreements
- (e) the placing of false valuations on the customers’ commercial property assets using ”tame” firms of chartered surveyors, which are alleged to include Graham & Sibbald in Edinburgh
FX to Libor Probes Leave UK Traders Seeking Lawyers - U.K. traders who’ve come under investigation for rigging benchmark rates may find themselves in another difficult situation -- unable to find a good lawyer. The top attorneys at specialist white-collar crime firms say that, in the past few months, they’ve seen the largest number of finance workers ever seeking advice as probes into the London interbank offered rate, or Libor, expand to the manipulation of currency, derivatives and precious metals benchmarks. About half a dozen law firms in the British capital specialize in advising individuals facing regulatory and criminal probes, while the largest London and U.S. based firms generally represent institutions. The increase in probes means that in a growing number of cases, the most experienced lawyers for individuals are turning traders away. “There is an unprecedented increase in the number of individuals who need specialist legal advice,” said David Corker, a defense lawyer at Corker Binning. “The supply of such lawyers is limited because hitherto white-collar crime has been seen as largely a boutique or highly specialist area.”
Very strong manufacturing and construction - Many economists expected the purchasing managers' surveys to moderate in the fourth quarter following their very strong third quarter but they remain very strong. We await the service sector number but both manufacturing and construction has surprised on the upside ths month. This was this morning's contruction PMI: "November data pointed to another strong upturn in the UK construction sector, with output and employment both rising at the sharpest rate since August 2007. Growth of business activity was broad based across the three main areas of construction, with residential building again the best performing category. Higher levels of output were supported by the joint-fastest expansion of incoming new work since September 2007."Adjusted for seasonal factors, the Markit/CIPS UK Construction Purchasing Managers’ Index® (PMI®) registered 62.6 in November, up sharply from 59.4 in October." It followed yesterday's buoyant manufacturing reading: "November saw the already solid upturn in the UK manufacturing sector gain further momentum. At 58.4, from an upwardly revised reading of 56.5 in October, the seasonally adjusted Markit/CIPS Purchasing Manager’s Index® (PMI®) rose to its highest level since February 2011. Moreover, the PMI has signalled expansion for eight months running. "The improved performance of the sector largely reflected substantial increases in both manufacturing production and new orders, with rates of growth in both at, or near to, 19-year highs."
OECD educational report: Pisa fever is causing east Asia’s demographic collapse -- Britain's poor scores in the Pisa education league are of course shameful. We should be doing as well as the Netherlands, our close cultural kin.But before we all flagellate ourselves – let alone think of copying the Shanghai success formula – just remember one thing. There is a body of scholarship showing that the collapse of the fertility rate to dangerously low levels across east Asia is the direct consequence of school cramming and "education fever". This is well-known to demographers and those who follow the Far East closely, but less known in the West. This paper for example on Korea: In this paper we argue that East Asia’s ultra-low fertility rates can be partially explained by the steadfast parental drive to have competitive and successful children… Deeply rooted Confucian values stress education as the best way for achieving high social status and economic prosperity. In the mid-1970s as part of their family planning project, even the Korean government adopted the notion of “quality over quantity” with colourful and creative “population propaganda” exclaiming: “Daughter or son, let's not think about which. Just have two and raise them well”. The CIA World FactBook says fertility rates have fallen to: Hong Kong (1.04), Singapore (1.10), Taiwan (1.15), Japan (1.20), Korea (1.22). These figures may be a little too low. Japan and Singapore have seen a small bounce lately.
UK revival leaves envious eurozone in shade - FT.com: The strength of the UK economy is drawing covetous and occasionally envious glances from the eurozone as investors from around the world size up the opportunity presented by Britain’s recovery. The UK economic revival has taken almost everyone by surprise, confounding domestic and international forecasting groups. Having failed to predict the turn, most explain the sudden resurgence as a rebounding of confidence linked to the removal of previous impediments to growth, such as weak banks and fears of a eurozone crisis. Some economists believe the UK will be the world’s fastest growing developed economy over the next five years. This is a tempting prospect for foreign corporates and investors, but they are weighing up potential opportunities against the political uncertainty of an EU referendum, as the coalition government staggers from one populist measure to another. In France, traditionally the third biggest source of foreign direct investment for the UK, Britain is regarded as a success story that casts an unflattering light on French malaise.
The Three Stooges Theory of Fiscal Policy - Paul Krugman - There’s a scene in one of the Three Stooges movies in which we see Curly banging his head repeatedly against a wall. Moe asks why he’s doing that, and Curly says, “Because it feels so good when I stop.” Big joke, right? Except that this is now the reigning theory of fiscal policy. As Antonio Fatas points out, austerians are now claiming vindication because some of the countries that imposed austerity are — after years of economic contraction — finally starting to show a bit of growth. This is, as he says, happening because sooner or later economies do tend to grow, unless bad policy not only continues but gets steadily worse; with austerity still severe but arguably not getting much more severe, some growth isn’t a big surprise. And these countries are still far below where they would have been with less austerity. But hey, it feels good, at least relatively, when the countries stop banging their heads against the wall. Austerity rules!
Bank of England Keeps Interest Rate at Record Low - Britain’s central bank on Thursday decided to keep its benchmark interest rate unchanged at a record low of 0.5 percent as the country’s economy continues to improve faster than those on the European continent. The Bank of England also voted to hold its program of economic stimulus at 375 billion pounds, or $614 billion. Loose monetary policy since 2009 and improving confidence among businesses and consumers have helped the British economy to grow 0.8 percent in the third quarter from the second quarter, more than Germany, France or the euro zone as a whole. “Growth momentum in the U.K. is strong,”. “The public deficit is likely to shrink much faster than initially thought. The government strategy seems to pay off.”
Biggest drop in savings for 40 years, Bank of England figures reveal - Savers have been withdrawing money from their accounts at the fastest rate for nearly 40 years, Bank of England figures show. They took £23 billion out of long-term savings in the past 12 months, equivalent to £900 for every household in the country. They either spent the cash – which in many cases was earning little more than 1 per cent interest – or moved it to easy-access current accounts. The Bank’s figures suggest that record low interest rates have convinced many to give up on the prospect of meaningful returns on their nest eggs. However, the withdrawals may also have helped to power Britain’s economic recovery, with much of the cash being spent on consumer goods. The figures represent a reversal of a trend to hold on to money which began in 2007, at the start of the credit crisis. In the year to Oct 2012, £24.8 billion was added to savings accounts overall. But long-term savings fell by almost the same amount, a 4.7 per cent decline, in the year to October 2013.
Food poverty in UK has reached level of 'public health emergency', warn experts - Hunger in Britain has reached the level of a “public health emergency” and the Government may be covering up the extent to which austerity and welfare cuts are adding to the problem, leading experts have said. In a letter to the British Medical Journal, a group of doctors and senior academics from the Medical Research Council and two leading universities said that the effect of Government policies on vulnerable people’s ability to afford food needed to be “urgently” monitored. A surge in the number of people requiring emergency food aid, a decrease in the amount of calories consumed by British families, and a doubling of the number of malnutrition cases seen at English hospitals represent “all the signs of a public health emergency that could go unrecognised until it is too late to take preventative action,” they write. Despite mounting evidence for a growing food poverty crisis in the UK, ministers maintain there is “no robust evidence” of a link between sweeping welfare reforms and a rise in the use of food banks. However, publication of research into the phenomenon, commissioned by the Government itself, has been delayed, amid speculation that the findings may prove embarrassing for ministers. “Because the Government has delayed the publication of research it commissioned into the rise of emergency food aid in the UK, we can only speculate that the cause is related to the rising cost of living and increasingly austere welfare reforms,” the public health experts write.
Food Poverty In The UK Has Reached "Public Health Emergency" Levels - This tragic story emanating from the UK just doesn’t seem to go away. Probably because it’s true. The food crisis across the pond first came to my attention in earnest back in October when the Red Cross announced it was set to provide food aid to the UK for the first time since World War II. The latest twist to this unacceptable saga comes via a letter send by a group of doctors and senior academics from the Medical Research Council and two leading universities to the British Medical Journal calling it a “public healthy emergency” and accusing the government of covering up the problem by delaying a report on the subject. More from The Independent: In a letter to the British Medical Journal, a group of doctors and senior academics from the Medical Research Council and two leading universities said that the effect of Government policies on vulnerable people’s ability to afford food needed to be “urgently” monitored. A surge in the number of people requiring emergency food aid, a decrease in the amount of calories consumed by British families, and a doubling of the number of malnutrition cases seen at English hospitals represent “all the signs of a public health emergency that could go unrecognised until it is too late to take preventative action,” they write. Despite mounting evidence for a growing food poverty crisis in the UK, ministers maintain there is “no robust evidence” of a link between sweeping welfare reforms and a rise in the use of food banks. However, publication of research into the phenomenon, commissioned by the Government itself, has been delayed, amid speculation that the findings may prove embarrassing for ministers.
More than a thousand care home residents die thirsty -- More than 1,000 care home residents have died of thirst or while suffering severe dehydration over the past decade, The Daily Telegraph can disclose. Elderly and vulnerable patients were left without enough water despite being under the supervision of trained staff in homes in England and Wales. The Coalition has failed to improve the situation, with more people dying while dehydrated last year than when David Cameron took office, although the total was lower than the 2006 peak. Charities called for an urgent overhaul in social care, saying that the general public would be outraged if animals were treated in the same way. “How can we call ourselves civilised when people are left to starve or die of thirst? … It is an utter disgrace that they are ever left without the most basic care,”


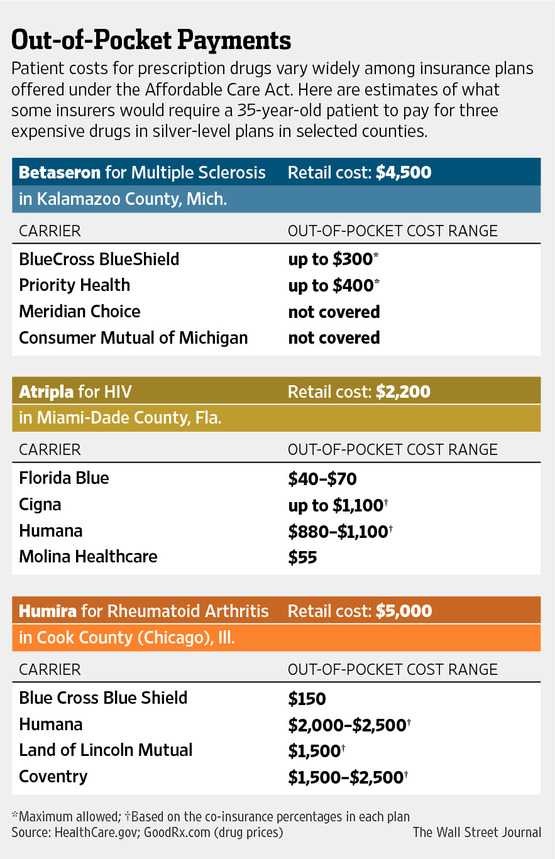
No comments:
Post a Comment